


Germinal centers (GC) are microanatomical lymphoid structures where affinity-matured memory B cells and long-lived bone marrow plasma cells are primarily generated. It is unclear how the maturation of B cells within the GC impacts the breadth and durability of B cell responses to influenza vaccination in humans. We used fine needle aspiration of draining lymph nodes to longitudinally track antigen-specific GC B cell responses to seasonal influenza vaccination. Antigen-specific GC B cells persisted for at least 13 wk after vaccination in two out of seven individuals. Monoclonal antibodies (mAbs) derived from persisting GC B cell clones exhibit enhanced binding affinity and breadth to influenza hemagglutinin (HA) antigens compared with related GC clonotypes isolated earlier in the response. Structural studies of early and late GC-derived mAbs from one clonal lineage in complex with H1 and H5 HAs revealed an altered binding footprint. Our study shows that inducing sustained GC reactions after influenza vaccination in humans supports the maturation of responding B cells.
Introduction
The World Health Organization estimates that influenza virus infection results in 290,000–650,000 annual deaths worldwide in non-pandemic years (Iuliano et al., 2018). Vaccination, the mainstay for protection against influenza virus infection, is focused on eliciting antibodies primarily targeting the influenza virus’ major surface glycoprotein, hemagglutinin (HA) (Krammer et al., 2018). The effectiveness of current influenza vaccines is variable due to multiple factors, including the age and health status of the individual, the type of vaccine (inactivated versus live attenuated), how the vaccine is produced, and the degree of matching between the vaccine and circulating strains (Grohskopf et al., 2022). The high rate of antigenic variation in the HA protein also undermines vaccine effectiveness. This high antigenic variation rate necessitates the yearly reformulation of vaccines to match circulating virus strains. Therefore, there is a pressing need to develop an influenza vaccine that can elicit long-lived and broadly crossreactive antibody responses against various influenza virus strains.
B cells responding to infection or vaccination in draining lymph nodes can either differentiate into short-lived antibody-secreting plasmablasts (PBs, proliferating cells with a life span of 3–5 days) (Wrammert et al., 2008) or initiate a series of highly orchestrated interactions with other immune cells, including CD4+ follicular helper T cells (Garside et al., 1998; Okada et al., 2005) and follicular dendritic cells (Suzuki et al., 2009; Wang et al., 2011), to form a germinal center (GC) reaction (Mesin et al., 2016). GCs are specialized microanatomical sites where antigen-stimulated B cells undergo iterative rounds of somatic hypermutation (SHM) and proliferation followed by affinity-based selection (Mesin et al., 2016). A fraction of the affinity-matured GC-derived B cells either differentiate into antibody-secreting plasma cells that migrate into specialized sites such as the bone marrow, where they establish residence as long-lived bone marrow plasma cells (BMPCs), or into memory B cells (MBCs) (Wrammert et al., 2008; Corti et al., 2010, 2011). MBCs are quiescent, circulating cells that can rapidly differentiate into antibody-secreting PBs upon antigen re-exposure (Wrammert et al., 2008; Tangye and Tarlinton, 2009). BMPCs and MBCs arising from the GC have a higher affinity for antigen than those maturing through GC-independent processes, thus providing enhanced protection upon pathogen exposure (Pape et al., 2011; Taylor et al., 2012).
Extending the duration of GCs can potentially increase the generation of high-affinity antibodies, as the mutational load of B cells increases proportionally to the time that they spend in GCs (Kaji et al., 2012; Jacob et al., 1993). The classical understanding of GC persistence based on immunization studies in mice suggests that GCs are maintained for only a few weeks before resolving (Jacob et al., 1991; Pedersen et al., 2020; Hägglöf et al., 2023). However, recent studies in non-human primates (NHPs) and humans suggest that GCs can persist for many months after vaccination. Modulating the vaccine formulation by using more potent adjuvants, escalating the dose of immunogen (Lee et al., 2022), or slowly delivering immunogen can increase the duration of the GC in NHPs (Cirelli et al., 2019).
In humans, increased SHM consistent with ongoing GCs has been observed in peripheral B cells after vaccination with replication-competent adenovirus (Matsuda et al., 2019) and live-attenuated virus vaccines (Wec et al., 2020). Direct sampling of GC B cells using fine needle aspiration of draining lymph nodes indicates that GCs can persist for at least 6 mo after vaccination in individuals immunized with the mRNA vaccine BNT162b2, which encodes the spike protein from SARS-CoV-2 (Turner et al., 2021; Kim et al., 2022; Mudd et al., 2022). The mutational load of these GC B cells increased over time, as did the affinity of the resulting MBCs and BMPCs (Kim et al., 2022), highlighting the importance of persistent GCs in generating a durable, high-affinity antibody response.
While these studies indicate persistent GCs can develop after vaccination, they used vaccine platforms with added adjuvants or replication-competent viral vectors that better mimic infection. It remains unclear if persistent GCs can be induced in response to a non-adjuvanted immunization like the currently licensed seasonal influenza vaccines. Previously, we showed that antigen-specific GC B cells in humans after vaccination with the seasonal influenza vaccine lasted up to 9 wk after vaccination (Turner et al., 2020). Here, we demonstrate that an influenza vaccine–specific GC can persist in two out of seven individuals 13 wk after vaccination, leading to an increased frequency of vaccine-specific BMPCs. Tracking the maturation of antigen-specific GC B cell clonal lineages over time revealed that, in some cases, clones that developed in the persistent GC exhibited increased affinity to vaccine antigens and could bind and neutralize diverse influenza viruses. Analysis of one clonal lineage indicated this affinity increase is mediated by mutations that alter the antibody binding footprint. Reimmunization of the same individuals with seasonal influenza virus vaccine engaged affinity-matured PBs and incited vaccine-specific GCs.
Results
Persistence of vaccine-specific germinal B cells after human influenza virus vaccination
Eight healthy volunteers who had not been vaccinated with seasonal influenza virus vaccination for at least 3 years were enrolled in an influenza vaccination study in which blood and fine needle aspirates (FNA) of the lateral axillary lymph nodes were collected at 0, 1, 2, 4, 9, 13, 17, and 26 wk after vaccination with the 2018/2019 inactivated quadrivalent influenza vaccine (2018 QIV) in the deltoid muscle (Fig. 1 A). Bone marrow aspirates were collected prior to vaccination and at 4, 13, and 26 wk after vaccination (Fig. 1 A). To detect HA-specific cells by flow cytometry, biotinylated HA probes derived from the following component viruses in the 2018 QIV were pooled: A/Michigan/45/2015 H1N1, A/Singapore/INFIMH-16-0019/2016 H3N2, and B/Colorado/06/2017. HA-binding PBs, defined as CD19+ IgDlo CD20lo HA+ lymphocytes, were measured by flow cytometry (Fig. S1 A). HA-binding PBs peaked in all participants at 1 wk after vaccination (Fig. 1 B). Enzyme-linked immunosorbent assay (ELISA) was used to measure titers of 2018 QIV–specific IgG plasma antibodies, which peaked at 2 wk after vaccination (Fig. 1 C).

Persistence of vaccine-specific GC B cells after human influenza virus vaccination. (A) Schematic of study design. Eight healthy adults (aged 26–40) received the 2018 QIV intramuscularly. Blood, FNAs of the ipsilateral axillary lymph nodes (LN), and bone marrow (BM) were collected prior to vaccination (week 0) and at the indicated weeks after vaccination. (B) Kinetics of HA-binding PBs (CD20lo HA+) in blood from seven participants. (C) 2018 QIV–specific IgG plasma antibody titers were measured via ELISA for seven participants. (D) Representative flow cytometry gating of total GC B cells (CD20+ CD38int) and HA-binding GC B cells (CD20+ CD38int HA+) in the LN from participant 05. Cells were pregated on CD4− CD19+ IgD− lymphocytes. (E) Kinetics of total GC B cells (open circles) and HA-binding GC B cells (closed circles) for all participants as defined by gating in D. Daggers indicate samples were excluded due to low cell recovery or blood contamination. (F) Representative ELISpot wells coated with 2018 QIV or anti-immunoglobulin (Ig) and developed in blue (IgG) and red (IgA) after plating BMPCs from participants 04, 05, and 11. (G) Frequencies of IgG and IgA 2018 QIV–specific BMPCs measured by ELISpot for seven participants. Participants with a detectable HA-binding GC are colored light blue. LoD, limit of detection. See also Fig. S1.
Persistence of vaccine-specific GC B cells after human influenza virus vaccination. (A) Schematic of study design. Eight healthy adults (aged 26–40) received the 2018 QIV intramuscularly. Blood, FNAs of the ipsilateral axillary lymph nodes (LN), and bone marrow (BM) were collected prior to vaccination (week 0) and at the indicated weeks after vaccination. (B) Kinetics of HA-binding PBs (CD20lo HA+) in blood from seven participants. (C) 2018 QIV–specific IgG plasma antibody titers were measured via ELISA for seven participants. (D) Representative flow cytometry gating of total GC B cells (CD20+ CD38int) and HA-binding GC B cells (CD20+ CD38int HA+) in the LN from participant 05. Cells were pregated on CD4− CD19+ IgD− lymphocytes. (E) Kinetics of total GC B cells (open circles) and HA-binding GC B cells (closed circles) for all participants as defined by gating in D. Daggers indicate samples were excluded due to low cell recovery or blood contamination. (F) Representative ELISpot wells coated with 2018 QIV or anti-immunoglobulin (Ig) and developed in blue (IgG) and red (IgA) after plating BMPCs from participants 04, 05, and 11. (G) Frequencies of IgG and IgA 2018 QIV–specific BMPCs measured by ELISpot for seven participants. Participants with a detectable HA-binding GC are colored light blue. LoD, limit of detection. See also Fig. S1.

Persistence of vaccine-specific GC B cells after human influenza virus vaccination. Related to Fig. 1. (A) Flow cytometry gating strategy for PBs from blood. (B) Flow cytometry gating strategy for HA-binding GCs in lymph nodes (LN). (C) Flow cytometry gating of total GC B cells (CD20+ CD38int) and HA-binding GC B cells (CD20+ CD38int HA+) in the LN from participant 04. Cells were pregated on CD4− CD19+ IgDlo live singlets. Dagger indicates samples were excluded from further analysis due to low cell recovery or blood contamination.
Persistence of vaccine-specific GC B cells after human influenza virus vaccination. Related to Fig. 1. (A) Flow cytometry gating strategy for PBs from blood. (B) Flow cytometry gating strategy for HA-binding GCs in lymph nodes (LN). (C) Flow cytometry gating of total GC B cells (CD20+ CD38int) and HA-binding GC B cells (CD20+ CD38int HA+) in the LN from participant 04. Cells were pregated on CD4− CD19+ IgDlo live singlets. Dagger indicates samples were excluded from further analysis due to low cell recovery or blood contamination.
Ultrasound-guided FNA of the draining lateral axillary lymph nodes was used to sample the lymph node cortex, which contains B cell follicles that are the site of GC reactions. Specimens with fewer than 4 × 10⁴ live cells or high blood contamination levels were excluded from further analyses; as previously reported, this included all FNA samples from participant 02 (Turner et al., 2020). Flow cytometry was used to identify total GC B cells, defined as CD19+ IgDlo CD20+ CD38int lymphocytes, and HA-binding GC B cells (Fig. 1 D; and Fig. S1, B and C). GC B cells were detected in all seven participants considered but only increased in frequency in four participants: 03, 05, 08, and 09 (Fig. 1 E). Total GC B cells were detected 9 wk after vaccination in all participants except participant 03 (Fig. 1 E). HA-binding GC B cells were only detected in participants 04, 05, and 11 and persisted after 9 wk in participants 04 and 05 (Fig. 1, D and E; and Fig. S1 C).
The frequency of BMPCs secreting 2018 QIV–specific IgG and IgA was quantified at all time points using enzyme-linked immunospot (ELISpot) assay (Fig. 1, F and G), except for the baseline for participant 02, which had low cell recovery. 2018 QIV–specific IgG peaked 4 wk after vaccination, with frequencies ranging between 0.3% and 3.9% of IgG-secreting BMPCs (Fig. 1 G). IgA-secreting BMPCs specific to 2018 QIV were detected at lower frequencies than IgG-secreting cells (Fig. 1, F and G). Frequencies of 2018 QIV–specific IgA peaked at 4 wk after vaccination and ranged from 0.3 to 1.4% of IgA-secreting BMPCs (Fig. 1 G).
Tracking vaccine-specific B cells in persistent GCs
To track the maturation of antigen-specific clones in persistent GCs, single-cell RNA sequencing (scRNA-seq) analysis was performed on pooled MBC-enriched and whole peripheral blood mononuclear cells (PBMCs), FNAs of lymph nodes, and BMPC-enriched bone marrow aspirates from baseline and subsequent time points in participants 04, 05, and 11 (Fig. S2, A and B). Blood and lymph node samples were sequenced at all time points for participant 05; the week 17 lymph node sample was excluded because of contamination from other samples (Fig. 1, D and E; and Fig. 2 A). For participant 04, blood and lymph node samples were sequenced at all time points during which an HA-specific GC was observed by flow cytometry (week 1, week 2, and week 17) (Fig. 1 E, Fig. S1 C, and Fig. 2 B). For participant 11, blood samples were sequenced at baseline, week 1, week 4, and week 17; no lymph node samples were sequenced (Fig. S2, A and B). Bone marrow aspirates were sequenced at all time points collected for participants 05 and 11 and at week 0, week 4, and week 26 for participant 04 (Fig. S2, A and B; and Fig. 2, A and B).

Tracking vaccine-specific B cells in persistent GCs. Related to Fig. 2. (A) Unsupervised clustering visualized via UMAP based on scRNA-seq gene expression of all cells pooled from all blood, lymph node (LN), and bone marrow (BM) samples and time points from participants 04, 05, and 11. (B) Dot plot of the average log-normalized expression of marker genes and the fraction of cells expressing the genes in each cluster from A. (C) Annotated UMAP clusters of scRNA-seq samples pooled from blood, LN, and BM samples from all time points from participants 04, 05, and 11. (D) Dot plot for annotated clusters in C. (E) Unsupervised clustering visualized via UMAP based on scRNA-seq gene expression of cells in the B cell cluster from A, pooled from all blood, LN, and BM samples and time points from participants 04, 05, and 11. (F) Dot plot of the average log-normalized expression of marker genes and the fraction of cells expressing the genes in each cluster from E. (G) Annotated UMAP clusters of cells from the B cell cluster in E, pooled from all blood, LN, and BM samples from all time points from participants 04, 05, and 11. (H) Dot plot for annotated clusters in G. (I) Optical density (OD) at 490 nm as determined by ELISA of 2018 QIV–binding clonally unique mAbs generated from GC B cells from week 13 and week 17 from participants 05 and 04, respectively. Positive binding was defined as greater than two times the OD 490 value for antibody binding to BSA. (J) Frequency of 2018 QIV–specific GC B cell clones at the indicated time points in participant 04. Each slice represents one clonal family. The frequency of a clonal family is defined as the percentage of cells in each clonal family among the total GC B cells at each time point (n = 166 at week 1, n = 338 at week 2, n = 930 at week 17). Colored slices indicate clones identified at multiple time points.
Tracking vaccine-specific B cells in persistent GCs. Related to Fig. 2. (A) Unsupervised clustering visualized via UMAP based on scRNA-seq gene expression of all cells pooled from all blood, lymph node (LN), and bone marrow (BM) samples and time points from participants 04, 05, and 11. (B) Dot plot of the average log-normalized expression of marker genes and the fraction of cells expressing the genes in each cluster from A. (C) Annotated UMAP clusters of scRNA-seq samples pooled from blood, LN, and BM samples from all time points from participants 04, 05, and 11. (D) Dot plot for annotated clusters in C. (E) Unsupervised clustering visualized via UMAP based on scRNA-seq gene expression of cells in the B cell cluster from A, pooled from all blood, LN, and BM samples and time points from participants 04, 05, and 11. (F) Dot plot of the average log-normalized expression of marker genes and the fraction of cells expressing the genes in each cluster from E. (G) Annotated UMAP clusters of cells from the B cell cluster in E, pooled from all blood, LN, and BM samples from all time points from participants 04, 05, and 11. (H) Dot plot for annotated clusters in G. (I) Optical density (OD) at 490 nm as determined by ELISA of 2018 QIV–binding clonally unique mAbs generated from GC B cells from week 13 and week 17 from participants 05 and 04, respectively. Positive binding was defined as greater than two times the OD 490 value for antibody binding to BSA. (J) Frequency of 2018 QIV–specific GC B cell clones at the indicated time points in participant 04. Each slice represents one clonal family. The frequency of a clonal family is defined as the percentage of cells in each clonal family among the total GC B cells at each time point (n = 166 at week 1, n = 338 at week 2, n = 930 at week 17). Colored slices indicate clones identified at multiple time points.
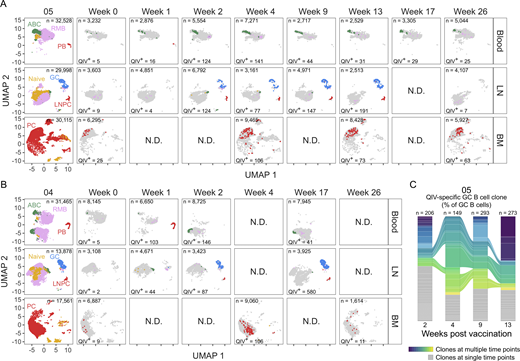
Tracking vaccine-specific B cells in persistent GCs. (A and B) Clustering visualized via UMAP of B cells from blood, lymph node (LN), and bone marrow (BM) scRNA-seq samples in participant 05 (A) and participant 04 (B). Each dot represents a cell, colored by phenotype as defined by transcriptomic profiles. Naïve B cells (gold), PBs (red), ABCs (green), GC B cells (blue), LNPCs (red), RMBs (lavender), and plasma cells (PC, red) populations are pooled from all time points (first panel). 2018 QIV–specific cells at each week after vaccination are colored as described. (C) Frequency of 2018 QIV–specific GC B cell clones at the indicated time points in participant 05. Each slice represents one clonal family. The frequency of a clonal family is defined as the percentage of cells in each clonal family among the total GC B cells at each time point (n = 206 at week 2, n = 149 at week 4, n = 293 at week 9, n = 273 at week 13). Colored slices indicate clones identified at multiple time points. N.D., no data. See also Fig. S2; and Tables S3, S4, S5, S6, and S7.
Tracking vaccine-specific B cells in persistent GCs. (A and B) Clustering visualized via UMAP of B cells from blood, lymph node (LN), and bone marrow (BM) scRNA-seq samples in participant 05 (A) and participant 04 (B). Each dot represents a cell, colored by phenotype as defined by transcriptomic profiles. Naïve B cells (gold), PBs (red), ABCs (green), GC B cells (blue), LNPCs (red), RMBs (lavender), and plasma cells (PC, red) populations are pooled from all time points (first panel). 2018 QIV–specific cells at each week after vaccination are colored as described. (C) Frequency of 2018 QIV–specific GC B cell clones at the indicated time points in participant 05. Each slice represents one clonal family. The frequency of a clonal family is defined as the percentage of cells in each clonal family among the total GC B cells at each time point (n = 206 at week 2, n = 149 at week 4, n = 293 at week 9, n = 273 at week 13). Colored slices indicate clones identified at multiple time points. N.D., no data. See also Fig. S2; and Tables S3, S4, S5, S6, and S7.
Single-cell transcriptional analysis of blood, lymph nodes, and bone marrow aspirates identified 14, 13, and 22 distinct clusters, respectively (Fig. S2, A and B). Cluster identity was assigned using a set of marker genes for distinct immune cell populations (Fig. S2, C and D). Unbiased secondary clustering of B cell populations was used to delineate 11, 18, and 13 distinct B cell clusters in blood, lymph nodes, and bone marrow, respectively (Fig. S2, E and F). A set of B cell marker genes identified naïve B cells, activated B cells (ABCs), and resting MBCs (RMBs) in blood and lymph nodes, PBs in blood, GC B cells and lymph node plasma cells (LNPCs) in lymph nodes, and BMPCs in bone marrow (Fig. S2, G and H).
To identify 2018 QIV–specific B cells, we generated monoclonal antibodies (mAbs) from PBs and GC B cells and screened for binding to 2018 QIV. Using single-cell-sorting of relevant populations from time points prior to 9 after vaccination, we previously generated 121, 4, and 27 clonally distinct 2018 QIV–binding PB mAbs and 59, 42, and 35 clonally distinct 2018 QIV–binding GC B cell mAbs from participants 05, 04, and 11, respectively (Turner et al., 2020). To characterize the repertoire 9 wk after vaccination, we isolated BCR sequences from cells transcriptionally annotated as GC B cells in participant 05 at week 13 and participant 04 at week 17 after vaccination, generated the corresponding mAbs, and screened the mAbs for binding to the 2018 QIV. At 13 wk after vaccination, we produced 40 clonally distinct GC B cell mAbs, of which 24 bound 2018 QIV, from participant 05 (Fig. S2 I). At 17 wk after vaccination, we generated 82 clonally distinct GC B cells mAbs, of which 13 bound 2018 QIV, from participant 04 (Fig. S2 I). Analysis of VH gene information combined from mAbs, scRNA-seq of BCR repertoires, and repertoires from bulk-sorted PBs was used to identify clonally related cells across blood, lymph nodes, and bone marrow samples.
Consistent with the flow cytometry analysis, 2018 QIV–specific GC B cells were identified from week 2 to week 13 after vaccination in participant 05 and at both week 2 and week 17 after vaccination in participant 04 (Fig. 2, A and B). 2018 QIV–specific BMPCs were identified at all time points analyzed (Fig. 2, A and B). To determine if vaccine-specific clones persisted in the GC over time, we tracked the proportion of 2018 QIV–specific GC B cells belonging to each clonal family at each time point (Fig. 2 C and Fig. S2 J). 2018 QIV–specific clonal groups in the GC expanded and contracted in both participants, with some clonal groups arising during the early GC (weeks 1/2/4) and persisting later in the GC compartment (weeks 9/13/17) (Fig. 2 C and Fig. S2 J). For participant 05, three clonal groups were identified at all four time points, eight clonal groups were found at three time points, 24 clonal groups were identified at two time points, and 76 clonal groups were found only at single time points (Fig. 2 C). 31 clonal groups included GC B cell at both early (week 2/4) and late (week 9/13) time points. For participant 04, three clonal groups were found at all three time points, 12 clonal groups were identified at two time points, and 49 clonal groups were found only at single time points (Fig. S2 J). 10 clonal groups included GC B cells at both early (week 1/2) and late (week 17) time points.
Affinity-matured late GC B cells can bind and neutralize heterologous influenza viruses
To further dissect the maturation of the persistent GC B cell response, we constructed phylogenetic lineage trees with BCR sequences of 13 responding clonal lineages identified in early and late GCs from participants 04 or 05 and generated mAbs from key nodes. Clonal family 05.89107.H1N1 from participant 05 included a PB-derived mAb, 05.PB.w1.3D11, as well as three GC B cell mAbs from week 2 and week 13, 05.GC.w2.3C10, 05.GC.w13.01, and 05.GC.w13.02 (henceforth referred to as 3D11, 3C10, 01, and 02, respectively) (Fig. 3 A and Fig. S3 A). All four antibodies bound the H1 HA in the 2018 QIV (H1 from A/Michigan/45/2015) as indicated by ELISA, with antibodies from the later time point exhibiting increased relative binding (Fig. 3 B). 02 had the highest affinity for H1 from A/Michigan/45/2015 as measured by biolayer interferometry (BLI) (Fig. 3 C). Increased binding affinity was also observed for late GC B cell mAbs isolated from clonal lineages targeting the H3N2 and influenza B virus components of the vaccine (Fig. S3, B and D). To determine if multiple clonal lineages in the persistent GC were undergoing affinity maturation, we compared the median half-maximal binding concentration as measured by ELISA of early (week 1/2/4) and late (week 9/13/17) GC B cells mAbs in the 13 responding clonal lineages (Fig. S3 E). While there was an increase in relative binding strength among some clonal lineages, there was no significant difference in binding strength between all early and late GC B cell mAbs.

Affinity-matured late GC B cells bind and neutralize heterologous influenza viruses. (A) Lineage tree of clonal family 05.89107.H1N1 from participant 05. IGHV and IGHJ gene use is indicated. Cells from which mAbs are derived are labeled with the cell of origin and the week isolated. Scale bar indicates mutations per codon. P value is calculated as described in the methods. (B) Optical density (OD) at 490 nm of A/Michigan/45/2015 H1-binding mAbs from clonal family 05.89107.H1N1. (C) Binding of Fabs from clonal family 05.89107.H1N1 to A/Michigan/45/2015 H1 as measured by BLI. KD, dissociation constant. (D) Binding of mAbs from clonal family 05.89107.H1N1 to the indicated H1, H2, and H5 HA proteins as measured by ELISA. Scale bar is the area under the curve (AUC). (E) Minimum concentration of antibody required to neutralize the indicated viruses. CR9114 was used as a positive control. Each point represents one of two replicates. See also Fig. S3.
Affinity-matured late GC B cells bind and neutralize heterologous influenza viruses. (A) Lineage tree of clonal family 05.89107.H1N1 from participant 05. IGHV and IGHJ gene use is indicated. Cells from which mAbs are derived are labeled with the cell of origin and the week isolated. Scale bar indicates mutations per codon. P value is calculated as described in the methods. (B) Optical density (OD) at 490 nm of A/Michigan/45/2015 H1-binding mAbs from clonal family 05.89107.H1N1. (C) Binding of Fabs from clonal family 05.89107.H1N1 to A/Michigan/45/2015 H1 as measured by BLI. KD, dissociation constant. (D) Binding of mAbs from clonal family 05.89107.H1N1 to the indicated H1, H2, and H5 HA proteins as measured by ELISA. Scale bar is the area under the curve (AUC). (E) Minimum concentration of antibody required to neutralize the indicated viruses. CR9114 was used as a positive control. Each point represents one of two replicates. See also Fig. S3.

Affinity-matured late GC B cells can bind and neutralize heterologous influenza viruses. Related to Fig. 3. (A) Lineage tree with corresponding heavy chain amino acid sequences in clonal family 05.89107.H1N1. Each row corresponds to its aligned node. Each row corresponds to the adjacent tip of the tree. (B) Lineage tree of clonal families 05.111394.H3N2, 05.129238.B/Ph, and 05.173963.H3N2 from participant 05 and 04.113954.B/Ph and 04.46156.B/Ph from participant 04. IGHV and IGHJ gene use is indicated. Cells from which mAbs are derived are labeled with the cell of origin and the week isolated. P values are calculated as described in the methods. (C) Optical density (OD) at 490 nm of A/Singapore/INFIMH-16-0019/2016 H3-binding or B/Phuket/3073/2013 HA-binding mAbs from clonal families in B. (D) Binding of Fabs from clonal family 05.111394.H3N2 to A/Singapore/INFIMH-16-0019/2016 H3 and Fabs from clonal family 04.113954.B to B/Phuket/3073/2013 HA as measured by BLI. (E) Median half-maximal binding concentration of mAbs isolated from GC B cell clonal lineages from participant 04 (purple) and participant 05 (blue) early (week 2/4) or late (week 9/13/17) after vaccination as measured by ELISA to relevant HA proteins. Filled circles indicate the clonal lineage tree is included in the manuscript. Median values are indicated above each column. P value was determined by paired t test. KD, dissociation constant.
Affinity-matured late GC B cells can bind and neutralize heterologous influenza viruses. Related to Fig. 3. (A) Lineage tree with corresponding heavy chain amino acid sequences in clonal family 05.89107.H1N1. Each row corresponds to its aligned node. Each row corresponds to the adjacent tip of the tree. (B) Lineage tree of clonal families 05.111394.H3N2, 05.129238.B/Ph, and 05.173963.H3N2 from participant 05 and 04.113954.B/Ph and 04.46156.B/Ph from participant 04. IGHV and IGHJ gene use is indicated. Cells from which mAbs are derived are labeled with the cell of origin and the week isolated. P values are calculated as described in the methods. (C) Optical density (OD) at 490 nm of A/Singapore/INFIMH-16-0019/2016 H3-binding or B/Phuket/3073/2013 HA-binding mAbs from clonal families in B. (D) Binding of Fabs from clonal family 05.111394.H3N2 to A/Singapore/INFIMH-16-0019/2016 H3 and Fabs from clonal family 04.113954.B to B/Phuket/3073/2013 HA as measured by BLI. (E) Median half-maximal binding concentration of mAbs isolated from GC B cell clonal lineages from participant 04 (purple) and participant 05 (blue) early (week 2/4) or late (week 9/13/17) after vaccination as measured by ELISA to relevant HA proteins. Filled circles indicate the clonal lineage tree is included in the manuscript. Median values are indicated above each column. P value was determined by paired t test. KD, dissociation constant.
We further characterized clonal family 05.89107.H1N1 through analysis of the binding breadth of 3D11, 3C10, 01, and 02 by performing ELISAs with various influenza virus HA proteins (Fig. 3 D). All four antibodies bound with relatively similar affinity to H1 HA proteins from influenza viruses from 2006 to 2007; however, antibodies from week 13 bound H1 HA proteins from post-2009 influenza viruses more potently than antibodies from earlier time points (Fig. 3 D). Additionally, later GC antibodies, particularly 02, exhibited increased relative binding to H5 proteins compared with antibodies isolated at earlier time points (Fig. 3 D).
We performed microneutralization assays to determine if the increased binding affinity of 02 to H1 and H5 correlated with increased neutralization of the influenza virus. All antibodies from clonal family 05.89107.H1N1 neutralized an A/Michigan/45/2015-like H1N1 virus (A/Singapore/GP1908/2015), as well as a pandemic H1N1 virus from 2009 (A/Netherlands/602/2009) (Fig. 3 E). 02 was the only antibody that could neutralize H5N1 (A/Vietnam/1203/2004) at similar levels to the positive control (CR9114) (Dreyfus et al., 2012), whereas other antibodies from the same clonal family could not (Fig. 3 E).
Structural characterization of Fabs from clonal family 05.89107.H1N1 with HA
Clonal family 05.89107.H1N1 was selected for structural characterization because it was encoded by the IGHV1-69 gene, which is associated with broadly neutralizing influenza mAbs (Dreyfus et al., 2012) and because it exhibited the greatest increase in binding affinity and breadth among the clonal lineages examined. To evaluate the mode of binding to HA and which mutations mediated the increased binding affinity of the later GC antibodies from the IGHV1-69 clonal family 05.89107.H1N1, we determined x-ray crystal structures of 3C10, 01, and 02 Fabs in complex with H1 HA from A/California/04/2009 (CA04), 02 Fab with A/Vietnam/1203/04 H5 HA, and a cryo-electron microscopy (cryo-EM) structure of 3C10 Fab with A/Solomon Islands/3/2006 (SI06) (Tables S1 and S2; and Fig. S4, A–C). All Fabs contact the stem region of H1 via HFR1, HCDR1, HCDR2, HFR3, and HCDR3 in the heavy chain, and LCDR1 and LCDR3 in the light chain (Fig. S4 D). From the crystal structures, the HFR1-HCDR1 regions of 01 and 02 bind to helix A and a hydrophobic pocket composed of residues T290, L292, P293, and P306 from HA1 and M59 and T61 from HA2 in the upper part of the stem region (Fig. S4 E). We found that an HFR1 TF motif, which is encoded by the IGHV1-69 germline gene, interacts with this pocket in 01 and 02 (Fig. 4, A–C; and Fig. S4 F). The phenylalanine of the TF motif inserts into this pocket and interacts with several hydrophobic residues from the 290-loop and interhelical loop, and the threonine of the TF motif makes side-chain and backbone H-bonds with the interhelical loop (Fig. 4 C). Superimposition of each Fab-H1 HA complex reveals that the orientation of the interhelical loop in HA2 is similar when the TF motif binds to the upper pocket (Fig. S4, G and H). As a result, this pocket becomes narrower compared with Apo-HA (PDB: 4M4Y) (Fig. S4 H) and could contribute to the increased binding affinity (Fig. 3 C).

Structural comparison of 05.GC.w2.3C10-H1, 05.GC.w13.01-H1, 05.GC.w13.02-H1, and 05.GC.w13.02-H5. Related to Figs. 4 and 5. (A) Overall binding model of each HA-Fab complex from their x-ray (panel 1, 3, 4, and 5) and cryo-EM (panel 2) structures. The Fabs are shown in surface representation. HA is represented as a trimer in backbone cartoon, with one HA monomer highlighted to illustrate the interaction between HA and Fab. (B and C) Local resolution (B) and Fourier Shell Correlation (C) of the cryo-EM structure of 3C10 Fab in complex with A/Solomon Islands/3/2006 (SI06) H1N1 HA. (D) The CDR loops of each Fab in contact with HA are shown with the loops as cartoons. (E) Hydrophobic residues involved in the contact between Fabs and HA are represented as sticks. Three hydrophobic areas in the stem region in H1 HA are circled and the underlying surface is represented in a green hydrophobicity gradient calculated by Color (https://pymolwiki.org/index.php/Color). (F) Critical hydrophobic residues in the heavy chain involved in interaction between Fab and HA are shown in side-chain sticks. (G) Superimposition of each Fab-HA complex and Apo-H1. The Thr61 side chain is illustrated as an indicator of the relative disposition of the interhelical loop among these structures. Distances in Angstroms were measured from T61 in 05.GC.w13.02-H1 to Apo-H1, and between 05.GC.w13.02-H1 and 05.GC.w13.02-H5. 05.GC.w2.3C10 is in yellow, 05.GC.w13.01-H1 in sand, 05.GC.w13.02-H1 in teal, 05.GC.w13.02-H5 in orange, and Apo-H1 in light blue (PDB: 4M4Y). The HA is shown in a backbone cartoon. (H) The extent of the upper pocket in each complex is measured from T290 (S290 in 05.GC.w13.02-H5) in the 290-loop to T61 in the interhelical loop after superimposition of HA1 and HA2 from each complex and Apo-H1. (I) The flexible 290-loop, 300-loop, and interhelical loop in the upper pocket in the stem region are highlighted in red. (J) 05.GC.w2.3C10-H1_SI06 complex determined by cryo-EM is shown in green. The extent of the upper pocket is measured from the distance between S290 and T61 in the 290-loop and interhelical loop, respectively (left). Superimposition of 05.GC.w2.3C10-H1_SI06 complex onto the 05.GC.w2.3C10-H1 (right). (K) Binding mode of Fab HCDR1, HCDR2, and HCDR3 loops with H1 HA. Residues involved in hydrophobic interactions are in red with black labels for HA residues and CDR loops. (L) Binding orientation of the Fab VH domain to HA and location of residues 98 in 05.GC.w2.3C10, 05.GC.w13.01, and 05.GC.w13.02 compared to CR9114. (M) Binding kinetics of 05.GC.w13.02 with alanine substitutions in critical contact positions using BLI. Black lines illustrate the response curves representing a 1:1 binding model of Fab with CA04 H1 HA.
Structural comparison of 05.GC.w2.3C10-H1, 05.GC.w13.01-H1, 05.GC.w13.02-H1, and 05.GC.w13.02-H5. Related to Figs. 4 and 5. (A) Overall binding model of each HA-Fab complex from their x-ray (panel 1, 3, 4, and 5) and cryo-EM (panel 2) structures. The Fabs are shown in surface representation. HA is represented as a trimer in backbone cartoon, with one HA monomer highlighted to illustrate the interaction between HA and Fab. (B and C) Local resolution (B) and Fourier Shell Correlation (C) of the cryo-EM structure of 3C10 Fab in complex with A/Solomon Islands/3/2006 (SI06) H1N1 HA. (D) The CDR loops of each Fab in contact with HA are shown with the loops as cartoons. (E) Hydrophobic residues involved in the contact between Fabs and HA are represented as sticks. Three hydrophobic areas in the stem region in H1 HA are circled and the underlying surface is represented in a green hydrophobicity gradient calculated by Color (https://pymolwiki.org/index.php/Color). (F) Critical hydrophobic residues in the heavy chain involved in interaction between Fab and HA are shown in side-chain sticks. (G) Superimposition of each Fab-HA complex and Apo-H1. The Thr61 side chain is illustrated as an indicator of the relative disposition of the interhelical loop among these structures. Distances in Angstroms were measured from T61 in 05.GC.w13.02-H1 to Apo-H1, and between 05.GC.w13.02-H1 and 05.GC.w13.02-H5. 05.GC.w2.3C10 is in yellow, 05.GC.w13.01-H1 in sand, 05.GC.w13.02-H1 in teal, 05.GC.w13.02-H5 in orange, and Apo-H1 in light blue (PDB: 4M4Y). The HA is shown in a backbone cartoon. (H) The extent of the upper pocket in each complex is measured from T290 (S290 in 05.GC.w13.02-H5) in the 290-loop to T61 in the interhelical loop after superimposition of HA1 and HA2 from each complex and Apo-H1. (I) The flexible 290-loop, 300-loop, and interhelical loop in the upper pocket in the stem region are highlighted in red. (J) 05.GC.w2.3C10-H1_SI06 complex determined by cryo-EM is shown in green. The extent of the upper pocket is measured from the distance between S290 and T61 in the 290-loop and interhelical loop, respectively (left). Superimposition of 05.GC.w2.3C10-H1_SI06 complex onto the 05.GC.w2.3C10-H1 (right). (K) Binding mode of Fab HCDR1, HCDR2, and HCDR3 loops with H1 HA. Residues involved in hydrophobic interactions are in red with black labels for HA residues and CDR loops. (L) Binding orientation of the Fab VH domain to HA and location of residues 98 in 05.GC.w2.3C10, 05.GC.w13.01, and 05.GC.w13.02 compared to CR9114. (M) Binding kinetics of 05.GC.w13.02 with alanine substitutions in critical contact positions using BLI. Black lines illustrate the response curves representing a 1:1 binding model of Fab with CA04 H1 HA.
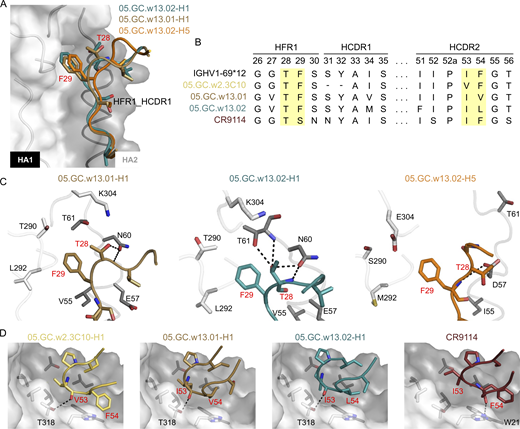
Crystal structure of 05.GC.w13.01 and 05.GC.w13.02 in complex with A/California/04/2009 (CA04) H1N1 HA and A/Vietnam/1203/04 (Viet04) H5N1 HA. The CA04 H1N1 HA is shown as a molecular surface in white for HA1 and gray for HA2. Residues involved in side-chain and backbone interactions between HA and Fab are represented in white (HA1) and gray (HA2) sticks. HCDR and LCDR represent CDRs in the heavy (H) and light (L) chains. Hydrogen bonds and salt bridges are indicated with black dashes. Fab residues are in Kabat numbering throughout. 05.GC.w13.01-H1 is in sand, 05.GC.w13.02-H1 in teal, 05.GC.w13.02-H5 in orange, and CR9114 in maroon. Fabs and HAs are shown in backbone cartoons with interacting side chains in sticks. For clarity, HA and Fab residues are colored with black and red numbers, respectively. (A) Structural comparison of HFR1-HCDR1 in 05.GC.w13.01-H1, 05.GC.w13.02-H1, and 05.GC.w13.02-H5. (B) Sequence comparisons of the IGHV1-69*12 germline, 05.GC.w2.3C10, 05.GC.w13.01, 05.GC.w13.02, and CR9114. Yellow highlights two critical motifs in HFR1 and HCDR2 in each Fab. (C) Interactions between the TF motif and the upper pocket of HA in each complex are shown. Residues involved in the interactions within this pocket are depicted in sticks. (D) The critical motif for residues 53 and 54 in HCDR2 for each Fab is shown: IV in VF in 05.GC.w2.3C10, 05.GC.w13.01, IL in 05.GC.w13.02, and IF in CR9114. This motif binds to the lower pocket in the HA stem. See also Fig. S4 and Tables S1 and S2.
Crystal structure of 05.GC.w13.01 and 05.GC.w13.02 in complex with A/California/04/2009 (CA04) H1N1 HA and A/Vietnam/1203/04 (Viet04) H5N1 HA. The CA04 H1N1 HA is shown as a molecular surface in white for HA1 and gray for HA2. Residues involved in side-chain and backbone interactions between HA and Fab are represented in white (HA1) and gray (HA2) sticks. HCDR and LCDR represent CDRs in the heavy (H) and light (L) chains. Hydrogen bonds and salt bridges are indicated with black dashes. Fab residues are in Kabat numbering throughout. 05.GC.w13.01-H1 is in sand, 05.GC.w13.02-H1 in teal, 05.GC.w13.02-H5 in orange, and CR9114 in maroon. Fabs and HAs are shown in backbone cartoons with interacting side chains in sticks. For clarity, HA and Fab residues are colored with black and red numbers, respectively. (A) Structural comparison of HFR1-HCDR1 in 05.GC.w13.01-H1, 05.GC.w13.02-H1, and 05.GC.w13.02-H5. (B) Sequence comparisons of the IGHV1-69*12 germline, 05.GC.w2.3C10, 05.GC.w13.01, 05.GC.w13.02, and CR9114. Yellow highlights two critical motifs in HFR1 and HCDR2 in each Fab. (C) Interactions between the TF motif and the upper pocket of HA in each complex are shown. Residues involved in the interactions within this pocket are depicted in sticks. (D) The critical motif for residues 53 and 54 in HCDR2 for each Fab is shown: IV in VF in 05.GC.w2.3C10, 05.GC.w13.01, IL in 05.GC.w13.02, and IF in CR9114. This motif binds to the lower pocket in the HA stem. See also Fig. S4 and Tables S1 and S2.
In addition, HFR3 and HCDR2 of 01 and 02 bind to the middle and lower part of the stem region, respectively (Fig. S4, D and F). L74 of HFR3 in 01 and 02 interact with a hydrophobic groove composed of V40 and L42 from HA1 and V52 and I56 from HA2 in the middle of the HA stem (Fig. 5 C and Fig. S4 F). Based on sequence comparison, two residues, S31 and Y32, were also conserved from the IGHV1-69 germline in 001 and 02 in HCDR1 (Fig. 4 B and Fig. S3 A). However, the deletion of residues 31 and 32 in HCDR1 in 3C10 results in a shift of HFR1-HCDR1 to the middle pocket of the stem region and HFR3 toward the 290-loop in HA1 (Fig. 5, A–C). Since the phenylalanine of the TF motif occupies this hydrophobic groove, these shifts in 3C10 abolish the hydrophobic interactions with the upper pocket and between HFR3 and the middle pocket, although new hydrogen bond interactions are made with HA1 T290 and S291 (Fig. 5 C). Deletion of S31, Y32, or both residues in combination in 02 reduces its binding affinity, as measured by BLI, with the deletion at position 32 having a greater effect (Fig. 5 D).
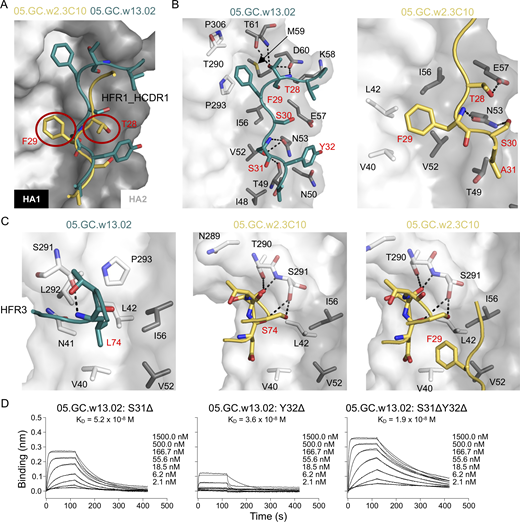
Characterization of 05.GC.w2.3C10 and 05.GC.w13.02 in complex with A/California/04/2009 (CA04) H1N1 HA. 05.GC.w2.3C10 and 05.GC.w13.02 are in yellow and teal, respectively. For clarity, HA and Fab residues are colored with black and red numbers, respectively. (A) Structural comparison of the binding of HFR1-HCDR1 with 05.GC.w2.3C10 and 05.GC.w13.02. The red circles indicate the TF motif in 05.GC.w2.3C10 that is lower than the corresponding motif in 05.GC.w13.02. (B) Detailed molecular interactions between 05.GC.w13.02 (left) and 05.GC.w2.3C10 (right) with CA04 HA. (C) The role of the hydrophobic HFR3 Leu74 in 05.GC.w13.02 (left), and the different binding of Ser74 in 05.GC.w2.3C10 (middle). The right panel shows that F29 from the TS motif in 05.GC.w2.3C10 occupies the middle hydrophobic groove. (D) Binding affinity of 05.GC.w13.02 with deletions of residues 31 and 32 to H1 (A/Michigan/45/2015) using BLI. See also Fig. S4 and Tables S1 and S2.
Characterization of 05.GC.w2.3C10 and 05.GC.w13.02 in complex with A/California/04/2009 (CA04) H1N1 HA. 05.GC.w2.3C10 and 05.GC.w13.02 are in yellow and teal, respectively. For clarity, HA and Fab residues are colored with black and red numbers, respectively. (A) Structural comparison of the binding of HFR1-HCDR1 with 05.GC.w2.3C10 and 05.GC.w13.02. The red circles indicate the TF motif in 05.GC.w2.3C10 that is lower than the corresponding motif in 05.GC.w13.02. (B) Detailed molecular interactions between 05.GC.w13.02 (left) and 05.GC.w2.3C10 (right) with CA04 HA. (C) The role of the hydrophobic HFR3 Leu74 in 05.GC.w13.02 (left), and the different binding of Ser74 in 05.GC.w2.3C10 (middle). The right panel shows that F29 from the TS motif in 05.GC.w2.3C10 occupies the middle hydrophobic groove. (D) Binding affinity of 05.GC.w13.02 with deletions of residues 31 and 32 to H1 (A/Michigan/45/2015) using BLI. See also Fig. S4 and Tables S1 and S2.
To decipher structural correlates for the difference in binding affinity between H1 and H5 HA to clonal family 05.89107.H1N1, the crystal structure of 02 Fab in complex with H5 HA from A/Vietnam/1203/2004 was determined (Table S1 and Fig. S4 A). The 02 contacts H5 HA through the same regions in the heavy and light chain as with H1 HA (Fig. S4, A and D). However, we observed that the upper pocket of the 02-H5 complex is wider than in the 02-H1 complex and Apo-H1 (Fig. S4 H). Given the wider upper pocket, there are no side-chain and backbone H-bonds between the TF motif and N60 of the interhelical loop, and hydrophobic interactions between T61 and the TF motif (Fig. 4 C), consistent with weaker binding in the ELISA (Fig. 3 D). Moreover, the distance between the 290-loop and interhelical loop slightly differs when 3C10 is bound with the SI06 H1 HA in the cryo-EM structure. The upper pocket is slightly perturbed when superimposed with 3C10-H1 (CA04 H1 HA), but the distance between the 290-loop and interhelical loop is narrower than with H5 HA (Fig. S4 J). These findings suggest that the interhelical loop in H5 may be more flexible than in H1, probably due to the differences in the intrinsic interactions among 290-loop, 300-loop, and interhelical loop in the upper stem region (Fig. S4, G and I).
Another critical factor in IGHV1-69 antibodies, including those in clonal family 05.89107.H1N1, is the IGHV1-69 germline-encoded IF motif in HCDR2. The hydrophobic residues in HCDR2, such as IIe53 and Phe54 in CR9114 (Fig. 4, B and D) in certain alleles of the IGHV1-69 germline gene dominate the IGHV1-69 antibody interaction with the lower pocket that is composed of several hydrophobic residues in the stem region (Fig. S4 E). The variation of this motif in HCDR2 among 3C10, 01, and 02 perhaps surprisingly appears to have relatively little effect on binding (Fig. 4, C and D; and Fig. S4 D), considering that IGHV1-69 alleles with a Leu at position 54 are not normally selected for binding to the HA stem. This phenomenon may also result from the clearance of B cells due to autoreactivity (Sangesland et al., 2022), where the HCDR2 loop is highly hydrophobic with aliphatic residues at 52 (I), 53 (I), 53 (I), 54 (L), and 56 (I) in most L alleles (Pappas et al., 2014). Furthermore, mutations at F54 can be tolerated in F-allele originating antibodies, where some redundancy is built in during affinity maturation, for example, by other mutations that arise in complementarity-determining region (CDR) HCDR1 or HCDR2 (Pappas et al., 2014). Here, a hydrophobic patch around Val 54 in 01 and Leu 54 in 02 is created with A33 from HCDR1; I52, P52a, and I53/V53 from HCDR2; I100c from HCDR3; and W21, I45, and I48 from HA2 (Fig. 4 D and Fig. S4 K). Moreover, the TF motif in HCDR1 forms a unique hydrophobic interaction between the 290-loop and interhelical loop (Fig. 4 C).
To investigate the functional consequences of these hydrophobic residues for these molecular features, we performed the alanine scanning analysis for corresponding residues in 02 using BLI. Alanine mutation at either I53 or F54 in the IF motif had a moderate effect (∼25-fold decreased binding), but mutation at both positions dramatically compromised binding to CA04 H1 HA by ∼200-fold (Fig. S4 M). Furthermore, mutating the germline-encoded TF motif, singly or together, further reduces or completely abrogates binding when also substituting the IF motif with alanine (Fig. S4 M). In addition, F29A alone in 02 reduces binding to CA04 H1 HA (Fig. S4 M). Alanine substitution at I52, P52a, or I100c increased the dissociation rate (Fig. S4 M), suggesting the importance of the hydrophobic interaction with the HA. These findings are consistent with IGHV1-69 germline-encoded antibodies being able to adopt different orientations and interactions on the HA (Lang et al., 2017). Here, variations in HCDR2 in the antibodies analyzed with IF/VF/IV/IL motifs, the absence of a conserved Y98 in HCDR3, and a deletion in HCDR1 result in important nuances in the mode of HA recognition (Fig. S4 L).
Reimmunization of individuals with persistent GCs promotes the development of affinity-matured PBs
To determine how persistent GCs affected the response to subsequent seasonal influenza virus vaccination, the two participants with persistent GCs (04 and 05) as well as participant 11, who developed an HA-specific but non-persistent GC response, were vaccinated with the 2019/2020 inactivated QIV (2019 QIV) in the same deltoid muscle (Fig. 6 A). Participants 04 and 05 were vaccinated with 2019 QIV at week 35 and week 38, respectively, after the 2018 QIV vaccination. Participant 11 was immunized with 2019 QIV on week 17 after the 2018 QIV vaccination as part of their week 17 study visit. Blood was collected at baseline (week 0) and at weeks 1, 2, 4, 9, and 13 or 17 after vaccination (Fig. 6 A). FNAs of the draining lateral axillary lymph nodes were collected at baseline and weeks 1, 4, 9, and 13 or 17 after vaccination. BM aspirates were collected at baseline and week 4 and week 13 or 17 after vaccination (Fig. 6 A). 2019 QIV–specific IgG secreted from PBs in the blood peaked at 1 wk after vaccination, with frequencies ranging from 511 to 1,748 IgG PBs per 106 PBMCs, as measured by ELISpot (Fig. 6 B). The pooled biotinylated HA probes used for flow cytometry were derived from the following component viruses in the 2019 QIV: A/Brisbane/02/2018 H1N1, A/Kansas/14/2017 H3N2, B/Phuket/3073/2013, and B/Colorado/06/2017. HA-specific PBs measured by flow cytometry were highest at week one after vaccination before rapidly declining (Fig. S5 A).
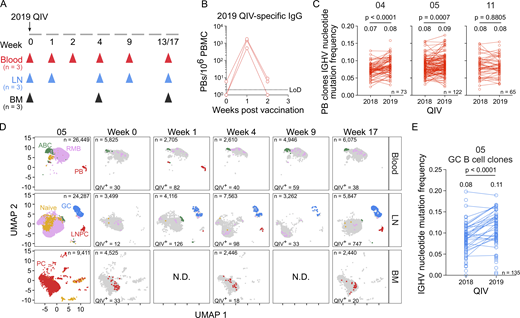
Re-immunization of individuals with persistent GCs promotes the development of affinity-matured PBs. (A) Schematic of study design. Three participants (04, 05, 11) received the 2019 QIV intramuscularly. Blood, FNAs of the ipsilateral axillary lymph nodes (LN), and bone marrow (BM) were collected prior to vaccination (week 0) and at the indicated weeks after vaccination. (B) ELISpot quantification of 2019 QIV–binding IgG-secreting PBs in blood at weeks 0, 1, and 2 after vaccination for three participants. (C) Median IGHV gene mutation frequency of QIV-binding PB clonal groups found after vaccination with 2018 and 2019 QIV. Lines between points indicate the clone was identified in the PB compartment after both vaccinations. Median IGHV nucleotide mutation frequency of all clonal groups is indicated above each column and the number of clones (n) is indicated in the bottom right of each panel (04, n = 73; 05, n = 122; 11, n = 65). P values were determined by paired t test. (D) Clustering was visualized via UMAP of B cells from blood, LN, and BM scRNA-seq samples in participant 05. Each dot represents a cell, colored by phenotype as defined by transcriptomic profiles. Naïve B cells (gold), PBs (red), ABCs (green), GC B cells (blue), LNPCs (red), RMBs (lavender), and plasma cells (PC, red) populations are pooled from all time points (first panel). QIV-specific cells at each week after vaccination are colored as described. (E) Median IGHV gene mutation frequency of QIV-binding GC B cell clonal groups found after vaccination with 2018 and 2019 QIV. Lines between points indicate the clone was identified in the GC B cell compartment after both vaccinations. Median IGHV nucleotide mutation frequency of all clonal groups is indicated above each column and the number of clones (n = 135) is indicated in the bottom right. P values were determined by paired t test. N.D., no data. See also Fig. S5 and Tables S3, S4, S5, S6, and S7.
Re-immunization of individuals with persistent GCs promotes the development of affinity-matured PBs. (A) Schematic of study design. Three participants (04, 05, 11) received the 2019 QIV intramuscularly. Blood, FNAs of the ipsilateral axillary lymph nodes (LN), and bone marrow (BM) were collected prior to vaccination (week 0) and at the indicated weeks after vaccination. (B) ELISpot quantification of 2019 QIV–binding IgG-secreting PBs in blood at weeks 0, 1, and 2 after vaccination for three participants. (C) Median IGHV gene mutation frequency of QIV-binding PB clonal groups found after vaccination with 2018 and 2019 QIV. Lines between points indicate the clone was identified in the PB compartment after both vaccinations. Median IGHV nucleotide mutation frequency of all clonal groups is indicated above each column and the number of clones (n) is indicated in the bottom right of each panel (04, n = 73; 05, n = 122; 11, n = 65). P values were determined by paired t test. (D) Clustering was visualized via UMAP of B cells from blood, LN, and BM scRNA-seq samples in participant 05. Each dot represents a cell, colored by phenotype as defined by transcriptomic profiles. Naïve B cells (gold), PBs (red), ABCs (green), GC B cells (blue), LNPCs (red), RMBs (lavender), and plasma cells (PC, red) populations are pooled from all time points (first panel). QIV-specific cells at each week after vaccination are colored as described. (E) Median IGHV gene mutation frequency of QIV-binding GC B cell clonal groups found after vaccination with 2018 and 2019 QIV. Lines between points indicate the clone was identified in the GC B cell compartment after both vaccinations. Median IGHV nucleotide mutation frequency of all clonal groups is indicated above each column and the number of clones (n = 135) is indicated in the bottom right. P values were determined by paired t test. N.D., no data. See also Fig. S5 and Tables S3, S4, S5, S6, and S7.

Re-immunization of individuals with persistent GCs engages affinity-matured PBs. Related to Fig. 6. (A) Kinetics of HA-binding PBs (CD20lo HA+) in blood from three participants (04, 05, 11) by flow cytometry. Cells were pre-gated on CD4− CD19+ IgD− live singlets. (B) Optical density (OD) at 490 nm at 15 µg/ml of 2019 QIV–binding clonally unique mAbs generated from singly sorted PBs from week 1 after vaccination. Positive binding is defined as greater than two times the OD 490 value for antibody binding to BSA. (C and D) Flow cytometry gating of total GC B cells (CD20+ CD38int) and HA-binding GC B cells (CD20+ CD38int HA+) in the lymph node (LN) from participant 05 (C) and participant 04 (D). Cells were pre-gated on CD4− CD19+ IgD− live singlets. (E) OD at 490 nm of 15 µg/ml of 2019 QIV–binding clonally unique mAbs generated from GC B cells at the indicated time points after vaccination. Positive binding defined as greater than two times the OD 490 value for antibody binding to BSA. (F) Unsupervised clustering visualized via UMAP of B cells from blood, LN, and bone marrow (BM) scRNA-seq samples in participant 04. Each dot represents a cell, colored by phenotype as defined by transcriptomic profiles. Naïve B cells (gold), PBs (red), ABCs (green), GC B cells (blue), LNPC (red), RMBs (lavender), and plasma cells (PC, red) populations are pooled from all time points (first panel). QIV-specific cells at each week after vaccination are colored as described. N.D., no data.
Re-immunization of individuals with persistent GCs engages affinity-matured PBs. Related to Fig. 6. (A) Kinetics of HA-binding PBs (CD20lo HA+) in blood from three participants (04, 05, 11) by flow cytometry. Cells were pre-gated on CD4− CD19+ IgD− live singlets. (B) Optical density (OD) at 490 nm at 15 µg/ml of 2019 QIV–binding clonally unique mAbs generated from singly sorted PBs from week 1 after vaccination. Positive binding is defined as greater than two times the OD 490 value for antibody binding to BSA. (C and D) Flow cytometry gating of total GC B cells (CD20+ CD38int) and HA-binding GC B cells (CD20+ CD38int HA+) in the lymph node (LN) from participant 05 (C) and participant 04 (D). Cells were pre-gated on CD4− CD19+ IgD− live singlets. (E) OD at 490 nm of 15 µg/ml of 2019 QIV–binding clonally unique mAbs generated from GC B cells at the indicated time points after vaccination. Positive binding defined as greater than two times the OD 490 value for antibody binding to BSA. (F) Unsupervised clustering visualized via UMAP of B cells from blood, LN, and bone marrow (BM) scRNA-seq samples in participant 04. Each dot represents a cell, colored by phenotype as defined by transcriptomic profiles. Naïve B cells (gold), PBs (red), ABCs (green), GC B cells (blue), LNPC (red), RMBs (lavender), and plasma cells (PC, red) populations are pooled from all time points (first panel). QIV-specific cells at each week after vaccination are colored as described. N.D., no data.
We sorted IgG-enriched PBs isolated from blood 1 wk after vaccination with the 2019 QIV and expressed the corresponding immunoglobulin genes as mAbs. We generated a total of 137, 96, and 138 clonally distinct mAbs, with 59, 36, and 94 binding the 2019 QIV, from participants 04, 05, and 11, respectively (Fig. S5 B). Using all antigen-specific data as determined by our analysis of binding to the 2018 and 2019 QIV, we identified PB clones engaged after vaccination with both formulations and examined SHM levels. The median IGHV nucleotide mutation frequency increased from 0.07 to 0.08 (P < 0.0001) and 0.08–0.09 (P = 0.0007) in participants 04 and 05, respectively (Fig. 6 C). In participant 11, the median IGHV nucleotide mutation frequency remained constant at 0.08 (Fig. 6 C).
Using flow cytometry, we identified total GC B cells (CD19+ IgDlo CD20+ CD38int) and HA-specific GC B cells in participants 05 and 04 (Fig. S5, C and D). Using scRNA-seq analysis as previously described, GC B cells were identified in lymph node samples and BCR sequences were cloned into expression vectors to make mAbs. We generated 57 and 2 2019 QIV–specific, clonally distinct mAbs from participants 05 and 04, respectively (Fig. S5 E), that were unrelated to any QIV-specific antibody identified after vaccination with 2018 QIV. Tracking all QIV-specific clones over time indicated that the vaccine-specific GC was detectable at 1 wk after vaccination with 2019 QIV in participant 05 and persisted until 17 wk after vaccination, consistent with the flow cytometry (Fig. 6 D). In participant 04, 2019 QIV–specific GC B cells were identified at week 9 and week 13 after vaccination (Fig. S5 F). Members of GC B cell clones re-engaged after 2019 QIV in participant 05 had significantly higher IGHV nucleotide mutation frequency compared with members of GC B cell clones identified after 2018 QIV vaccination (Fig. 6 E).
Discussion
This study tracked the evolution of antigen-specific B cell clonal lineages detected in persistent GC reactions induced after seasonal influenza vaccination in humans. This was accomplished by the longitudinal sampling of the same draining axillary lymph nodes in seven healthy adults following vaccination. In some cases, clones detected at later stages of the GC response exhibited enhanced binding affinity and breadth to influenza virus HA antigens. Structural characterization and modeling of late GC antibodies from one clonal lineage in complex with HA revealed mutational differences that altered the antibody binding footprint. Reimmunization of individuals with persistent GCs resulted in a more mutated PB response, indicating that GC persistence in those individuals was associated with the maturation of induced MBCs.
This work shows an example of a persistent antigen-specific GC in humans after immunization with a non-adjuvanted vaccine. We previously showed that vaccination with a SARS-CoV-2 mRNA vaccine induced highly robust and persistent antigen-specific GCs in humans (Turner et al., 2021). It remains unclear what role the lipid nanoparticles (LNPs) that encapsulate the nucleoside-modified mRNA vaccines play in regulating the GC duration. It has been shown that LNPs act as an adjuvant, enhancing mRNA-based vaccines’ efficacy (Alameh et al., 2021). Moreover, mRNA as a vaccine platform is associated with widespread antigen dissemination in mice (Pardi et al., 2015), although antigen is restricted to the draining lymph nodes after mRNA vaccination of NHPs (Liang et al., 2017; Lindsay et al., 2019). In mice (Pape et al., 2011; Pedersen et al., 2020; Dogan et al., 2009) and NHPs (Havenar-Daughton et al., 2019), adjuvant selection has been shown to moderately increase the duration of GCs. However, because non-adjuvanted vaccines in animal models typically do not produce a measurable antigen-specific GC B cell response, there have been few comparative studies between adjuvanted and non-adjuvanted vaccination. Here, we demonstrate that a non-adjuvanted vaccine can induce a persistent GC response, although only in 30% of individuals studied (2/7 participants). After SARS-CoV-2 mRNA vaccination, 80% of SARS-CoV-2-naive individuals had a detectable antigen-specific GC B cell response when assessed at 15 wk after vaccination (Turner et al., 2021; Kim et al., 2022). This difference may be due to the lack of exposure history for SARS-CoV-2 as compared with the influenza virus (Ellebedy, 2018). Further studies should investigate how repeated exposures to antigens shape the clonal composition of GC responses and influence their persistence.
In addition to characterizing vaccine-induced B cell responses in the blood and draining lymph nodes, we longitudinally tracked the BMPC compartment. While influenza vaccine–specific BMPCs were readily detectable in the bone marrow aspirates from all participants, the frequency of QIV-binding IgG and IgA-secreting BMPCs at 26 wk after vaccination was comparable with baseline for most individuals, suggesting that current seasonal influenza vaccines fail to bolster the long-lived BMPC compartment, as has been previously reported (Davis et al., 2020). However, the ELISpot analysis suggests that the frequency of QIV-specific IgG BMPCs increased between baseline and week 26 after vaccination only in the participants with a persistent GC, rising from 0.5% to 1.1% in participant 05 and 0.1% to 2.2% in participant 04 after 2018 QIV immunization. This increase indicates that GC persistence potentially influences the ability of the vaccine to elicit long-lived BMPCs. However, these participants also had the lowest BMPC frequencies and some of the lowest IgG titers at baseline. The relationship between BMPC frequency and persistence and output of the GC response should be examined in future studies with larger cohorts. Consistent with the maturation of the MBC compartment, re-immunizing the participants who exhibited a persistent GC response with the following season’s influenza vaccine, 2019 QIV, resulted in re-engaging B cell clones with higher levels of SHM. This suggests that persistent GCs allowed for the generation of higher affinity MBCs, which can then differentiate into PBs upon re-immunization.
The early GC B cell antibody from clonal group 05.89107.H1N1, 3C10, had a lower affinity for vaccine antigen than later GC B cell antibodies from the same clonal family, particularly the most mutated 02. Notably, 02 could bind and neutralize more diverse influenza virus HAs, particularly H5 HAs, compared with 3C10. Increasing antibody breadth should be a central goal of improved influenza vaccines because of the high rate of antigenic variation among influenza virus HA proteins. One mechanism by which GCs may facilitate increased antibody breadth is the recruitment of diverse B cell clones. GCs can be seeded with a diverse array of clonotypes, and that diversity can persist in individual GCs later in the response (Tas et al., 2016). Additionally, B cell clones specific only to the immunizing strain have been identified in GCs after seasonal influenza vaccination, suggesting that naïve B cells specific to novel epitopes are engaged in GCs. Our study suggests that clonal diversity and affinity maturation may increase antibody binding breadth by enhancing the binding affinity of B cell clones targeting conserved epitopes.
HA stem–binding antibodies encoded by the IGHV1-69 heavy chain variable gene have been well characterized (Corti et al., 2011; Dreyfus et al., 2012; Ekiert et al., 2009). These antibodies typically bind HA via a germline-encoded IF motif at positions 53 and 54 in the HCDR2 region, which can engage hydrophobic pockets in the stem (Chen et al., 2019). Whether or not individuals produce such antibodies correlates with which IGHV1-69 alleles they carry. Many highly neutralizing IGHV1-69 antibodies encode an F at position 54, compared with IGHV1-69 antibodies that encode an L (Sangesland et al., 2022; Pappas et al., 2014; Chen et al., 2019; Avnir et al., 2016). The late GC B cell antibody with the highest affinity, 02, uses an L at position 54 despite arising from an individual who was computationally inferred to be homozygous for F alleles, suggesting that it acquired a mutation that did not negatively impact its fitness in the GC. Other variations in the canonical HCDR2 residues are also involved in HA recognition by 01 and 3C10. Another variation in 3C10 was a deletion in conserved SY residues at positions 31 and 32 in HCDR1 that also shifted contacts for the conserved TF in HFR1 with a different pocket in the HA. These differences may have partially accounted for the weaker binding activity of 3C10. Removing these residues, particularly Y32, from 02, results in abrogation of binding affinity, further indicating their importance to the reduced binding of 3C10.
While the current study provides evidence that persistent GC responses can be induced by seasonal influenza virus vaccination in a minority of individuals, some limitations exist. First, despite all eight participants mounting a detectable peripheral vaccine response, we detected HA-specific GC B cells in only three participants. Of those three individuals, only two exhibited GC persistence. It is possible that either the primary draining lymph nodes were inaccessible and therefore not sampled in the five participants without detectable antigen-specific GC or that they did not mount a vaccine-specific GC response. However, our ability to readily sample draining lymph nodes and detect spike-specific GC B cells after SARS-CoV-2 mRNA vaccination (Turner et al., 2021) suggests that either the poor immunogenicity of the vaccine or the participants’ high pre-existing immunity may be the culprits for the lack of detectable antigen-specific GC response. Given the high frequency of exposure to the influenza virus compared with SARS-CoV-2 at the time of sampling, participants had higher levels of affinity-matured, antigen-specific circulating antibodies and MBCs. Antibodies produced when these MBCs are reactivated may clear the antigen before it can be efficiently presented in follicles, preventing the formation or maintenance of vaccine-specific GC (Arulraj et al., 2019). Vaccine formulations that promote robust and persistent GC responses that overcome this barrier may be critical to generating a diverse antibody response against influenza virus strains.
Materials and methods
Human subjects
All studies were approved by the Institutional Review Board of Washington University in St Louis (approval # 201808171) and written consent was obtained from all participants. Details of the study cohort have been previously reported (Turner et al., 2020). Eight participants who had not been vaccinated with seasonal influenza virus vaccine for at least 3 years were enrolled. Participants were aged 26–40 years old and included 1 female and 7 males. Participants reported no adverse effects. No statistical methods were used to predetermine the sample size. Investigators were not blinded to experiments and outcome assessment.
Blood samples were obtained by standard phlebotomy. PBMCs were isolated using Vacutainer CPT tubes (cat# 362753; BD Biosciences); the remaining red blood cells (RBCs) were lysed with ammonium chloride lysis buffer (cat# 10-548E; Lonza). Cells were immediately used or cryopreserved in 10% dimethylsulfoxide (DMSO) in fetal bovine serum (FBS).
A qualified physician’s assistant performed ultrasound-guided FNA of axillary lymph nodes under the supervision of a radiologist. Six passes were made using 25-gauge needles, which were flushed with 3 ml of Roswell Park Memorial Institute (RPMI 1640) medium supplemented with 10% FBS and 100 U/ml penicillin/streptomycin, followed by three 1-ml rinses. RBCs were lysed with ammonium chloride lysis buffer (Lonza). Cells were washed twice with phosphate-buffered saline (PBS) supplemented with 2% FBS and 2 mM ethylenediaminetetraacetic acid (EDTA) and immediately used or cryopreserved in 10% DMSO in FBS.
Bone marrow aspirates of ∼30 ml were collected in EDTA tubes from the iliac crest. Bone marrow mononuclear cells (BMMCs) were enriched by density gradient centrifugation over Ficoll-Paque PLUS. RBCs were lysed with ammonium chloride lysis buffer (Lonza) and washed with PBS supplemented with 2% FBS and 2 mM EDTA. BMPCs were enriched from BMMCs using EasySep Human CD138 Positive Selection Kit II (cat# 117877; StemCell Technologies) and immediately used for ELISpot or cryopreserved in 10% DMSO in FBS.
Vaccine and antigens
Flucelvax QIVs (2018/2019 season and 2019/2020 season) were purchased from Seqirus.
For ELISpot and plasma ELISA, recombinant HA proteins derived from pandemic H1N1 (A/Michigan/45/2015 or A/Brisbane/02/2018), H3N2 (A/Singapore/INFIMH-16-0019/2016 or A/Kansas/14/2017), B/Yamagata/16/88-like lineage (B/Phuket/3073/2013), or B/Victoria/2/87-like lineage (B/Brisbane/60/2008) were expressed in a baculovirus expression system as previously described (Margine et al., 2013).
For flow cytometry staining, recombinant HA proteins expressed in 293F cells and derived from the following viruses were purchased from Immune Technology (IT): A/Michigan/45/2015 (cat# IT-003-00105ΔTMp), A/Brisbane/02/2018 (cat# IT-003-00110ΔTMp), A/Singapore/INFIMH-16-0019/2016 (cat# IT-003-00434ΔTMp), A/Kansas/14/2017 (cat# IT-003-00436ΔTMp), B/Phuket/3073/2013 (cat# IT-003-B11ΔTMp), and B/Colorado/06/2017 (cat# IT-003-B21ΔTMp). Recombinant HA was biotinylated using the EZ-Link Micro NHS-PEG4-Biotinylation Kit (cat# 21955; Thermo Fisher Scientific); excess biotin was removed using 7-kDa Zeba desalting columns (Pierce).
For ELISAs with mAbs, baculovirus-expressed recombinant HA proteins were purchased from the International Reagent Resource (IRR) and 293F cell-expressed recombinant HA proteins were purchased from IT. The HA proteins purchased from IRR are as follows: H1 (A/South Carolina/1/1918 H1N1, cat# FR-692), H1 (A/swine/Iowa/15/1930 H1N1, cat# FR-699), H1 (A/Solomon Islands/3/2006 H1N1, cat# FR-67), H1 (A/Brisbane/59/2007 H1N1, cat# FR-65), H1 (A/Norway/3206-3/2009 H1N1, cat# FR-697), H2 (A/Japan/305/1957 H2N2, cat# FR-700), H5 (A/bar-headed goose/Qinghai/1A/2005 H5N1, cat# FR-85), H5 (A/gyrfalcon/Washington/41088-6/2014 H5N8, cat# FR-1418). The HA proteins purchased form IT are as follows: H1 (A/Michigan/45/2015 H1N1), H1 (A/California/04/2009 H1N1pdm09, cat# IT-003-00106ΔTMp), H5 (A/Vietnam/1203/2004 H5N1, cat# IT-003-0051p), and H5 (A/Indonesia/5/2005 H5N1, cat# IT-003-0052ΔTMp).
For BLI in the main figures and Fig. S3, recombinant 6× His-tagged HA proteins expressed in 293F cells and derived from the following viruses were purchased from IT: A/Michigan/45/2015 H1N1, A/Singapore/INFIMH-16-0019/2016 H3N2, and B/Phuket/3073/2013.
For crystallization, cryo-EM, and BLI in Fig. S4, HA was prepared as previously described (Lee et al., 2012; Ekiert et al., 2011). Briefly, each HA was fused with an N-terminal gp67 signal peptide and a C-terminal BirA biotinylation site, a thrombin cleavage site, a trimerization domain, and a His6 tag. The HAs were expressed in 293F cells and purified by Ni-NTA. The HAs were either matured by trypsin (New England BioLabs) for crystallization or biotinylated with BirA for BLI.
Flow cytometry
Fresh or cryo-preserved PBMCs or FNA single-cell suspensions were stained in PBS supplemented with 2% FBS and 2 mM EDTA (P2). For analysis, cells were stained for 30 min on ice with biotinylated recombinant HA proteins and PD-1-BB515 (EH12.1, 1:100, cat# 350526; BD Horizon) diluted in P2. Cells were washed twice and then stained for 30 min on ice with IgA-FITC (M24A, 1:500, cat# CBL114F; Millipore), CD45-PerCP (2D1, 1:25, cat# 345809; BD Biosciences), IgG-BV480 (goat polyclonal, 1:100, cat# 109-685-098; Jackson ImmunoResearch), IgD-SB702 (IA6-2, 1:50, cat# 67-9868-42; Thermo Fisher Scientific), CD38-BV421 (HIT2, 1:100, cat# 303526), CD20-Pacific Blue (2H7, 1:400, cat# 302320), CD27-BV510 (O323, 1:50, cat# 302836), CD4-BV570 (OKT4, 1:50, cat# 317445), CD24-BV605 (ML5, 1:100, cat# 311124), streptavidin-BV650, CD19-BV750 (HIB19, 1:100, cat# 302262), CXCR5-PE-Dazzle 594 (J252D4, 1:50, cat# 356928), CD71-APC (CY1G4, 1:100, cat# 334108), CD14-A700 (HCD14, 1:200, cat# 325614), and IgM-APC-Cy7 (MHM-88, 1:400, cat# 314520) (all BioLegend) diluted in Brilliant Staining buffer (cat# 563794; BD Horizon). Cells were washed twice, fixed, and permeabilized for intranuclear staining for 1 h at 25°C with True Nuclear fixation buffer (cat# 424401; BioLegend) and then washed twice with permeabilization/wash buffer (BioLegend). Cells were stained for 30 min at 25°C with BCL6-PE (7D1, 1:50, cat# 358504) and Ki-67-PE-Cy7 (Ki-67, 1:400, cat# 350526) (both BioLegend). Cells were washed twice with permeabilization/wash buffer and resuspended in P2 for acquisition on an Aurora using SpectroFlo v2.2 (Cytek). Flow cytometry was analyzed using FlowJo v10.8.1 (Treestar).
For sorting after 2018 QIV immunization, cells were stained for 30 min on ice with IgD-PerCP-Cy5.5 (IA6-2, 1:200, cat# 348208), CD4-Alexa 700 (SK3, 1:400, cat# 344622), CD20-APC-Fire750 (2H7, 1:100, cat# 302358), and Zombie Aqua (cat# 423102) (all BioLegend). For PBs, CD38-BV605 (HIT2, 1:100, cat# 303532), CD71-FITC (CY1G4, 1:200, cat# 334104), and CD19-PE (HIB19, 1:200, cat# 302254) (all BioLegend) were added. For GC B cells, CD19-BV421 (HIB19, 1:100, cat# 302234), CD71-PE (CY1G4, 1:400, cat# 356928), CXCR5-PE-Dazzle 594 (J252D4, 1:40), and CD38-PE-Cy7 (HIT2, 1:200, cat# 303516) (all BioLegend) were added. Cells were washed twice, and single PBs (live singlet CD19+ CD4− IgDlo CD38+ CD20− CD71+) and GC B cells (live singlet CD19+ CD4− IgDlo CD71+ CD38int CD20+ CXCR5+) were sorted using a FACSAria II into 96-well plates containing 2 µl Lysis Buffer (cat# 635013; Takara) supplemented with 1 U/µl RNase inhibitor (cat# M0314S; New England Biolabs), or bulk sorted into buffer RLT Plus (cat# 1053393; Qiagen) and immediately frozen on dry ice. For sorting after 2019 QIV immunization, cells were stained for 30 min on ice with IgD-APC (IA6-2, 1:200, cat# 348222), CD4-Alexa 700 (OKT4, 1:500, cat# 317426), CD20-Pacific Blue (2H7, 1:400), CD38-BB700 (HIT2, 1:500, cat# 566445; BD Biosciences), CD19-PE (HIB19, 1:200), IgA-FITC (M24A, 1:200), IgM-APC-Fire 750 (MHM-88, 1:100, cat# 314546), CXCR5-PE-Dazzle 594 (J252D4, 1:50), and Zombie Aqua (all others BioLegend). Cells were washed twice, and IgG-enriched single PBs (live singlet CD19+ CD4− IgDlo IgA− CD20lo CD38+ IgMlo CXCR5lo) were sorted as described above.
ELISA
ELISAs were performed in 96-well plates (MaxiSorp; Thermo Fisher Scientific). Wells were coated with 100 µl QIV (diluted 1:100) or with 1 µg/ml recombinant HA antigens in PBS and incubated at 4°C overnight. Plates were blocked with 0.05% Tween20 and 10% FBS in PBS (blocking buffer). Plasma or mAbs were serially diluted in blocking buffer and added to plates, which were incubated for 90 min at room temperature followed by three washes with 0.05% Tween20 in PBS. Goat anti-human IgG conjugated to horseradish peroxidase (HRP) (cat# 109-035-088, diluted 1:2,500; Jackson ImmunoResearch) was diluted in blocking buffer and added to plates. Plates were incubated for 90 min at room temperature followed by three washes with 0.05% Tween20 in PBS and three washes in PBS. Peroxidase substrate (SigmaFAST o-Phenylenediamine dihydrochloride, cat# P9187-50SET; Sigma-Aldrich) was used to develop plates. Reactions were stopped by the addition of 1 M HCl. Optical density measurements were taken at 490 nm. The half-maximal binding dilution for plasma was calculated using nonlinear regression (GraphPad Prism v9.5.1). The area under the curve was calculated using GraphPad Prism v9.5.1.
ELISpot
Direct ex vivo ELISpot was performed to determine the total and vaccine-binding IgG- and IgA-secreting cells in PBMCs or enriched BMPCs. ELISpot plates were coated overnight at 4°C with QIV (diluted 1:100) and 10 µg/ml goat anti-human IgA+IgG+IgM (cat# 109-005-064; Jackson ImmunoResearch). Secreting cells were detected using IgG/IgA double-color ELISpot Kits (SKU: hIgAIgG-DCE-1M; Cellular Technologies) according to the manufacturer’s instructions. ELISpot plates were analyzed using an ELISpot counter (Cellular Technologies).
Samples for bulk B cell receptor sequencing
Bulk BCR sequencing was performed on whole PBMCs, sorted PBs, and enriched BMPCs from participants 04, 05, and 11 after vaccination with 2018 and 2019 QIV. Bulk sequencing analysis for sorted PBs from participant 04 and whole PBMC and sorted PBs from participant 05 1 wk after vaccination with 2018 QIV was previously reported (Turner et al., 2020). Bulk BCR-sequenced samples reported for the first time in this publication are as follows: for participant 04, whole PBMCs (week 0) and enriched BMPCs (weeks 0, 4, 13, 26) after 2018 QIV and sorted PBs (week 1) after 2019 QIV; for participant 05, enriched BMPCs (weeks 0, 4, 13, 26) after 2018 QIV and sorted PBs (week 1) after 2019 QIV; for participant 11, whole PBMCs (week 0), sorted PBs (week 1), and enriched BMPCs (weeks 0, 4, 13, 26) after 2018 QIV and sorted PBs (week 1) after 2019 QIV.
To obtain samples for bulk BCR sequencing, RNA was purified using the RNeasy Micro Kit (cat# 74004; Qiagen). Reverse transcription, unique molecular identifier (UMI) barcoding, cDNA amplification, and Illumina linker addition to B cell heavy chain transcripts were performed using the human NEBNext Immune Sequencing Kit (cat# E6320S; New England Biolabs) according to the manufacturer’s instructions. High-throughput 2 × 300 bp paired-end sequencing was performed on the Illumina MiSeq platform with a 30% PhiX spike-in according to the manufacturer’s recommendations, except that 325 and 275 cycles were performed for read 1 and 2, respectively.
Processing B cell receptor bulk sequencing reads
Demultiplexed pair-end reads were preprocessed using pRESTO v0.5.7 (Vander Heiden et al., 2014) as follows: (1) Reads with a mean Phred quality score <20 were filtered. (2) Reads were aligned against template switch sequences and constant region primers, with a maximum mismatch rate of 0.5 and 0.2, respectively. (3) Reads were grouped based on UMIs determined by the 17 nucleotides preceding the template switch site. (4) Separate consensus sequences were constructed for the forward and reverse reads within each UMI group, with a maximum error score of 0.1 and minimum constant region primer frequency of 0.6. If multiple constant region primers were associated with a particular UMI group, the majority primer was used. (5) Forward and reverse consensus sequence pairs were assembled by first attempting de novo assembly with a minimum overlap of eight nucleotides and a maximum mismatch rate of 0.3. If unsuccessful, this was followed by reference-guided assembly using blastn v2.5.0 (Camacho et al., 2009) with a minimum identity of 0.5 and an E-value threshold of 1 × 10⁻⁵. (6) Isotypes were assigned by local alignment of the 3′ end of each consensus sequence to isotype-specific internal constant region sequences with a maximum mismatch rate of 0.3. Sequences with inconsistent isotype assignment and constant region primer alignment were removed. (7) Duplicate reads were collapsed into unique sequences, except for those spanning multiple biological samples and/or with different isotype assignments. Only sequences with at least two reads contributing to the UMI consensus sequence were used for further analyses. The template switch sequences, constant region primers, and isotype-specific internal constant region sequences that were used in these studies are available at https://bitbucket.org/kleinstein/immcantation/src/master/protocols/AbSeq/.
Initial germline V(D)J gene annotation was performed using IgBLAST v1.9.0 (Ye et al., 2013; Giudicelli et al., 2005). IgBLAST output was processed using Change-O v0.4.0 (Gupta et al., 2015). Additional quality control of these sequences was performed with the following requirements: aligned exclusively to heavy chain V and J genes; had fewer than 20 Ns and 15 continuous Ns in V segment; and had a junction length that was a multiple of 3, where the junction was defined as from IMGT codon 104 encoding the conserved cysteine to codon 118 encoding phenylalanine or tryptophan. Duplicate IMGT-aligned V(D)J sequences from bulk sequencing were collapsed except for duplicates derived from different B cell compartments or isotypes.
Samples for scRNA-seq
Activated and MBCs were enriched from PBMCs by first staining with IgD-PE (cat# 348204; BioLegend) and MojoSort anti-PE Nanobeads (cat# 480080; BioLegend), and then processing with the EasySep Human B cell Isolation Kit (cat# 17954; StemCell Technologies) using the EasyEights magnet (StemCell Technologies) to negatively enrich IgDlo B cells. Enriched IgDlo B cells (activated and memory B cells), whole PBMCs, and whole FNA from weeks 0, 1, 2, 4, and 9 for participant 05 after vaccination with 2018 QIV were processed as previously described (Turner et al., 2020). Samples processed for scRNA-seq reported for the first time in this publication are as follows: for participant 04, sorted PBs (week 1), enriched IgDlo B cells (weeks 0, 2, 17), whole FNA (weeks 0, 1, 2, 17), and enriched BMPCs (weeks 0, 4, 26) after 2018 QIV and sorted PBs (week 1), enriched IgDlo B cells (weeks 0, 2, 13), whole FNA (weeks 0, 2, 9, 13), and enriched BMPCs (week 0) after 2019 QIV; for participant 05, whole PBMCs (weeks 13, 17), enriched IgDlo B cells (weeks 13, 17, 26), whole FNA (weeks 13, 26), and enriched BMPCs (weeks 0, 4, 13, 26) after 2018 QIV and enriched IgDlo B cells (weeks 0, 1, 2, 4, 9, 13), whole FNA (weeks 0, 1, 4, 9, 17), and enriched BMPCs (week 0, 4, 13) after 2019 QIV; for participant 11, sorted PBs (week 1), enriched IgDlo B cells (weeks 0, 4, 17), and enriched BMPCs (weeks 0, 4, 13, 26) after 2018 QIV and sorted PBs (week 1) and enriched IgDlo B cells (weeks 0, 4, 13) after 2019 QIV. Sample identification for blood, lymph node, and bone marrow are shown in Tables S3, S4, and S5, respectively.
The following 10x Genomics kits were used: Chromium Single Cell 5′ Library and Gel Bead Kit v2 (PN-1000006); Chromium Single Cell A Chip Kit (PN-120236); Chromium Single Cell V(D)J Enrichment Kit, Human, B cell (PN-1000016); and Chromium i7 Multiplex Kit (PN-120262). The cDNA was prepared after GEM generation and barcoding, followed by GEM RT reaction and bead cleanup steps. Purified cDNA was amplified for 10–14 cycles followed by cleaning with SPRIselect beads (cat# B23318; Beckman Coulter). Samples were evaluated on a bioanalyzer to determine cDNA concentration. BCR target enrichments were performed on full-length cDNA. Gene expression (GEX) and enriched BCR libraries were prepared as recommended by the 10x Genomics Chromium Single Cell V(D)J Reagent Kit (v1 Chemistry) user guide, with appropriate modifications to PCR cycles based on cDNA concentration. The libraries were sequenced on Novaseq S4 (Illumina), targeting a median sequencing depth of 50,000 and 5,000 read pairs per cell for GEX and BCR libraries, respectively.
Processing 10x Genomics single-cell BCR reads
Demultiplexed pair-end FASTQ reads were preprocessed using the “cellranger vdj” command from 10x Genomics’ Cell Ranger v3.1.0 (https://support.10xgenomics.com/single-cell-gene-expression/software/overview/welcome) for alignment against the GRCh38 human reference v3.1.0 (refdata-cellranger-vdj-GRCh38-alts-ensembl-3.1.0). Initial germline V(D)J gene annotation was performed as described for bulk sequencing BCR reads. Additional quality control was performed, requiring sequences to be productively rearranged and have valid V and J gene annotations and a junction length that was a multiple of 3. Only cells with exactly one heavy chain sequence paired with at least one light chain sequence were retained.
Removing duplicate cells among samples in 10x Genomics single-cell BCR data
If two cells from two different samples shared the same cell barcode and the same IMGT-aligned V(D)J sequences, they were flagged as potential contaminants. If the percentage of potential contaminants was <20% of cells for both samples, then these cells were removed from further analysis. However, if the percentage of potential contaminants was over 20% in either of the samples, we attempted to assign the cells to one of the samples (i.e., the source of the contamination) and remove it from the other sample (i.e., the target of the contamination). For all cells flagged as potential contaminants, we calculated the fraction of cell barcodes that overlapped the GEX data associated with each of the samples. In all cases investigated, these cell barcodes overwhelmingly overlapped (>99%) with only one of the samples (i.e., the source of the contamination). In these cases, the potential contaminants that were exclusively found in the GEX from the source of contamination were assigned to the corresponding BCR sample and were removed from the other sample (i.e., target of the contamination). All other potential contaminants were removed from both samples.
Combining BCR sequences
Processed BCR sequences from bulk sequencing and single-cell sequencing were combined with mAb sequences for further analysis. Non-productively rearranged sequences annotated as “non-functional” by IgBLAST were removed from further analysis.
B cell receptor genotyping
Combined BCR sequences were called for genotyping using the function findNovelAlleles() and inferGenotype() from TIgGER v0.2.11 (Gadala-Maria et al., 2015). Individual genotypes, including novel V gene alleles missing from IMGT/GENE-DB, were computationally inferred and used to finalize V(D)J annotations.
Clonal lineage inference
B cell clonal lineages were inferred based on productively rearranged heavy chain sequences using hierarchical clustering with single linkage (Gupta et al., 2017). First, sequences were partitioned based on common V and J gene annotations and junction region lengths. Within each partition, sequences whose junction regions were within 0.1 normalized Hamming distance from each other were clustered as clones. This distance threshold was determined by manual inspection in conjunction with kernel density estimates to identify the local minimum between the two modes of the within-participant bimodal distance-to-nearest distribution. Following clonal clustering, full-length clonal consensus germline sequences were reconstructed for each clone with D-segment and N/P regions masked with Ns, resolving any ambiguous gene assignments by majority rule.
Clonal overlap analysis
Clonal overlap was determined by the presence of sequences from both compartments in the same B cell clone.
Calculation of SHM frequency
Mutation frequency was calculated by counting the number of nucleotide mismatches from the germline sequence in the heavy-chain variable segment leading up to the CDR3 while excluding the first 18 positions that could be error-prone due to the primers used for generating the mAb sequences. This calculation was performed using the calcObservedMutations function from SHazaM v1.1.0 (Gupta et al., 2015; Durinck et al., 2005).
Construction of B cell lineage trees
B cell lineage trees were inferred for three selected clones using the R package dowser v1.0.0 (Hoehn et al., 2022) and IgPhyML v1.1.4 (Hoehn et al., 2019). Heavy-chain sequences corresponding to barcodes with indeterminate cell annotations were removed. Identical sequences with the same timepoint and cell type annotation were collapsed. Lineage tree topologies, branch lengths, and substitution model parameters were estimated using maximum likelihood, first under the GY94 model (Nielsen and Yang, 1998) and then under the HLP19 model (Hoehn et al., 2019) starting with tree topologies and branch lengths estimated under the GY94 model. To increase precision, substitution model parameters were constrained to be identical among the three trees (Hoehn et al., 2019). Trees were visualized using dowser v1.0.0 and ggtree v3.0.4 (Yu et al., 2017). Trees showing only experimentally tested sequences were created by removing all tips corresponding to non-experimentally tested sequences using the keep.tip function in ape v5.6-2 (Paradis et al., 2004). Measurable evolution was tested using the clustered, resolved date randomization test (Hoehn et al., 2021) in dowser v1.0.0. This test compares the correlation between divergence and sample time in each tree versus 100,000 randomizations of the same tree with sample times shuffled among single-timepoint monophyletic clusters of tips. R v4.1.0 (R Core Team, 2017) was used for tree building and analysis.
Clonal germline reconstruction
Germline V and J genes were inferred based on alignment to the IMGT GENE-DB (Giudicelli et al., 2005) reference database. As a result of N/P additions and extensive D gene modification during VDJ recombination in the junction region (including the CDR3), additional phylogenetic algorithms must be used to infer this region. Two algorithms were used to reconstruct the heavy chain germline of clone 05.89107.H1N1. The first is implemented in IgPhyML v1.1.4 (Hoehn et al., 2019) and is an extension of likelihood calculations at each tree node. The second is linear-ham (v1.0.0, obtained 1/30/23), a Bayesian method based on hidden Markov models that infers the naïve VDJ rearrangements (Dhar et al., 2020). The germline reconstructed from linear-ham had a posterior probability of 96.2%, indicating high confidence. These methods produced nearly identical germline reconstructions, except the germline from IgPhyML was ambiguously S or T at position 106, while the germline from linear-ham was unambiguously T at position 106. T was chosen for this position.
Processing of 10x Genomics single-cell 5′ gene expression data
Demultiplexed pair-end FASTQ reads were first preprocessed on a by-sample basis using the “cellranger count” command from 10x Genomics’ Cell Ranger v3.1.0 for alignment against the GRCh38 human reference genome v3.0.0 (refdata-cellranger-GRCh38-3.0.0). The feature biotypes were retrieved using biomaRt v2.42.0 (Durinck et al., 2005) from Ensembl release 93 (Yates et al., 2020). Additional quality control was performed as follows: (1) to remove presumably lysed cells, cells with mitochondrial content >15% of all transcripts were removed. (2) To remove likely doublets, cells with more than 7,000 features were removed. (3) Genes that were expressed in less than five cells in any sample, and cells with detectable expression of fewer than 400 genes were removed. The counts of cells before and after quality control in blood, lymph node, and bone marrow samples are shown in Tables S3, S4, and S5, respectively.
Single-cell gene expression analysis
Single-cell gene expression analysis was performed using Seurat v4.0.3.1.1 (Stuart et al., 2019). UMI counts measuring gene expression were log-normalized. The top 2,000 highly variable genes (HVGs) were identified using the “FindVariableFeatures” function with the “vst” method. A set of 317 immune-related, “immunoStates” marker genes (Vallania et al., 2018) was added to the HVG list, whereas immunoglobulin and T cell receptor genes were removed. The data were scaled and centered, and principal component analysis (PCA) was performed based on HVG expression. The PCA-guided uniform manifold approximation and projection (UMAP) plot was generated using the top 20 principal components. Overall clusters (Table S6) were identified using the “FindClusters” function with resolution 0.2 (Fig. S2, A and C). Cluster identities were assigned by examining the expression of a set of marker genes for different cell types (Fig. S2, B and D): MS4A1, CD19, and CD79A for B cells; CD3D, CD3E, CD3G, IL7R, and CD4 or CD8A for CD4+ or CD8+ T cells, respectively; GZMB, GNLY, NKG7, and NCAM1 for natural killer cells; CD14, LYZ, CST3, and MS4A7 for monocytes; IL3RA and CLEC4C for plasmacytoid dendritic cells; and PPBP for platelets. B cells from the overall B cell cluster were further clustered to identify B cell subsets (Table S7) using the “FindClusters” function with resolution 0.2 for blood and 0.7 for FNA (Fig. S2, E and G). Cluster identities were assigned by examining the expression of a set of marker genes for different B cell subsets and the availability of BCRs (Fig. S2, F and H). The following marker genes were examined: BCL6, RGS13, MEF2B, STMN1, ELL3 and SERPINA9 for GC B cells; XBP1, IRF4, SEC11C, FKBP11, JCHAIN and PRDM1 for PBs; TCL1A, IL4R, CCR7, IGHM, and IGHD for naive B cells; TBX21, FCRL5, ITGAX, NKG7, ZEB2, and the lack of CR2 for ABCs; and TNFRSF13B, CD27 and CD24 for RMB cells.
Selection of single-cell BCRs from GC B cells for expression
BCRs from annotated GC B cell clusters at week 13 for participant 04 or week 17 for participant 05 after 2018 QIV vaccination and all time points after 2019 QIV vaccination of participants 04 and 05 were selected for expression. BCRs selected for 2019 QIV had not been previously identified after vaccination with 2018 QIV. One cell was selected from every clonal family that contained cells from GC B cell clusters. Native heavy and light chain pairing was preserved.
mAb generation
mAbs from all participants and cells isolated prior to week 13 after 2018 QIV vaccination, including 05.PB.w1.3D11, 05.GC.w2.3C10, and 05.GC.W9.1G03 from participant 05 and 05.GC.w2.1D05 from participant 04, were previously reported (Turner et al., 2020). mAbs from sorted PBs after 2019 QIV vaccination of participants 04, 05, and 11 were cloned as previously described (Wrammert et al., 2011). Briefly, VH, Vκ, and Vλ genes were amplified by reverse transcription-PCR and nested PCR reactions from singly-sorted PBs using primer combinations specific for IgG, IgM/A, Igκ, or Igλ from previously described primer sets (Smith et al., 2009) and then sequenced. To generate recombinant antibodies, restriction sites were incorporated via PCR with primers to the corresponding heavy and light chain V and J genes. The amplified VH, Vκ, and Vλ genes were cloned into IgG1, Igκ, or Igλ expression vectors, respectively, as previously described (Smith et al., 2009; Wrammert et al., 2008; Nachbagauer et al., 2018).
mAbs from GC B cells at week 13 and week 17 after 2018 QIV vaccination of participants 04 and 05, clonal families 05.89107.H1N1, 05.111394.H3N2, and 05.113954.B, and GC B cells after 2019 QIV vaccination of participants 04 and 05 were generated as follows. Heavy and light chain sequences were obtained from BCR repertoire analysis of cells identified and annotated via scRNA-seq. Heavy- and light-chain sequences flanked by relevant restriction sites were synthesized and cloned into IgG1, Igκ, or Igλ expression vectors by GenScript.
For all antibodies, heavy- and light-chain plasmids were cotransfected into Expi293F cells (Gibco) for expression using the ExpiFectamine 293 Transfection Kit (cat# A14525; Thermo Fisher Scientific). The antibody was purified with protein A agarose (cat# 15918014; Invitrogen).
Fab generation
The VH segment was cloned into a Fab expression vector with a thrombin cleavage site preceding a His6 tag by GenScript. Fab and light-chain plasmids were cotransfected into Expi293F cells (Gibco) for expression and purified with HisPur Ni-NTA resin (cat# 88222; Thermo Fisher Scientific).
Microneutralization
Microneutralization assays were performed on Madin Darby canine kidney (MDCK) cells seeded in 96-well plates at 2 × 10⁵ cells/ml. The following day, mAbs (starting concentration of 100 µg/ml) were serially diluted twofold in 1× minimal essential media (MEM) (10% 10× MEM [Gibco], 2 mM L-glutamine, 0.1% sodium bicarbonate [wt/vol, Gibo], 0.01 M -[2-hydroxyethyl]-1-piperazineethanesulfonic acid [HEPES] buffer [Gibco], penicillin–streptomycin [100 U/ml penicillin, 100 μg/ml streptomycin], 0.2% bovine serum albumin [BSA]) supplemented with tosyl phenylalanyl chloromethyl ketone (TPCK)–treated trypsin (infection medium; Sigma-Aldrich) at a concentration of 1 µg/ml in 96-well cell culture plates (Sigma-Aldrich). Duplicates of each mAb were prepared for each virus. The viruses, A/Singapore/GP1908/2015 IVR-180 (H1N1), A/Netherlands/602/2009 (H1N1), and A/Vietnam/1203/2004 (H5N1, low path A/PR/8/34 reassortant with polybasic cleavage site removed) were diluted to a concentration of 100 times the 50% tissue culture infectious dose in infection medium. 60 µl of serially diluted mAbs were incubated with 60 µl of virus dilution for 1 h at room temperature on a shaker. MDCK cells were then washed once with 220 µl of PBS and 100 µl of the virus–serum mixture was added to MDCK cells. The cells were incubated in the presence of antibody and virus for 1 h at 37°C. After the 1 h incubation, the virus and antibody mixture was removed, the cells were washed with PBS, and serially diluted mAbs were added to the cells. The cells were incubated in the presence of mAbs for 48 h. The readout was performed via a hemagglutination assay. In brief, chicken RBCs (cat# 7201401; Lampire) were washed once with PBS and diluted to a concentration of 0.5% RBCs in PBS, and 50 µl of RBCs was added to 50 µl of cell supernatant in V-bottom plates (Corning). The plates were kept at 4°C for 30–45 min and scanned and the results were analyzed in Microsoft Excel and GraphPad Prism v9.5.1.
BLI
Kinetic binding studies in the main figures and Fig. S3 were performed on an Octet-R8 (Sartorius) instrument. His6 tags were removed from Fabs using the thrombin cleavage site preceding the tag. Fabs were treated with biotin-tagged thrombin protease (Sigma-Aldrich) for 2 h at room temperature, followed by removal of remaining His-tagged Fabs with HisPur nickel-nitrilotriacetic acid (Ni-NTA) resin (Thermo Fisher Scientific). The thrombin-protease was removed via Streptavidin Sepharose high-performance affinity resin (cat# 17511301; Cytiva). 6× His-tagged HA proteins were purchased from IT as described above. Anti-Penta-His (HIS1K) sensor tips (cat# 18-5120; Sartorius) were pre-equilibrated in Hanks’ balanced salt solution (HBSS) with 0.05% Tween-20 and 1% BSA (kinetic buffer A) followed by loading of HA proteins to 0.5 nm. Thrombin-cleaved Fabs diluted in kinetic buffer A were monitored for 200 s of association and then dissociated for 300–1,200 s in kinetic buffer A. HIS1K sensors that were not loaded were used as reference sensors. Kinetic parameters of reference subtracted kinetic traces were calculated with Octet BLI analysis software v12.1 using a global fit 1:1 binding model. Traces were plotted with GraphPad Prism v9.5.1.
Kinetic binding studies in Fig. S4 were performed on an Octet Red instrument (ForteBio). Biotinylated HA was generated as described above. Streptavidin sensor tips (cat# 18-5019; Sartorius) were pre-equilibrated in PBS with 0.01% BSA and 0.002% Tween20 (kinetic buffer B) followed by loading of HA proteins at ∼10–50 µg/ml for 120 s. Fabs diluted in kinetic buffer B were monitored for 120 s of association and then dissociated for 120 s in kinetic buffer B. Streptavidin sensors that were not loaded were used as reference sensors. Kinetic parameters of reference subtracted kinetic traces were calculated using a global fit 1:1 binding model. Traces were plotted with GraphPad Prism v9.5.1.
Crystallization and structural determination
The HA-Fab complexes were formed by mixing Fab with a threefold molar ratio of HA, incubated overnight at 4°C, and followed by size exclusion chromatography. The complex was subsequently diluted to ∼8 mg/ml in pH 8.0 TBS buffer and sent for screening on the robotic high-throughput CrystalMation system (Rigaku) at The Scripps Research Institute using the JCSG Core Suite (QIAGEN) as precipitant. Crystallization trials were set up by the vapor diffusion method in sitting drops containing 0.1 μl of protein and 0.1 μl of reservoir solution. The optimized crystallization conditions were as follows: 0.2 M sodium citrate pH 5.6, with 20% PEG3350 for 05.GC.w13.02-H1 complex; 0.2 M sodium acetate pH 6.2, with 20% PEG3350 for 05.GC.w13.01-H1; and 0.2 M lithium sulfate pH 6.2, with 20% PEG3350 for 05.GC.w2.3C10. Crystals were harvested on or before day seven and then soaked in a reservoir solution with 12–18% (vol/vol) ethylene glycol as cryoprotectant. The harvested crystals were flash-cooled and stored in liquid nitrogen until data collection. Diffraction data were collected at cryogenic temperature (100 K) at the Stanford Synchrotron Radiation Lightsource on Scripps/Stanford beamline 12-1 with a wavelength of 0.97946 Å. The diffraction data were processed with HKL2000 (Otwinowski and Minor, 1997). The complex structure was solved by molecular replacement using Phaser (McCoy et al., 2007) with the models generated by Repertoire Builder (https://sysimm.org/rep_builder/) for 05.GC.w13.02 and 05.GC.w2.3C10. Iterative model building and refinement were carried out in Coot (Emsley et al., 2010) and PHENIX (Adams et al., 2010), respectively. Buried and accessible surface areas were calculated with PISA (Krissinel and Henrick, 2007). Molecular surface contact areas were computed using the Molecular Surface package (Connolly, 1983).
Cryo-EM grid preparation and imaging
Protein complexes were made by incubating A/Solomon Islands/3/2006 H1 HA with 3C10 Fab at a 1:3 M ratio of HA to Fab at room temperature for 1 h. Immune complexes were applied to grids at a concentration of 0.6–0.9 mg/ml. At 0.1% final concentration, octyl-beta-glucoside detergent was added to samples immediately before deposition on glow-discharged Au 2/2 200 mesh grids (Electron Microscopy Services). Samples were blotted for 4.5–5 s before plunge-freezing in liquid ethane using a Vitrobot mark IV (Thermo Fisher Scientific).
Data were collected with an exposure of 50.38 e−/Å2 at a nominal magnification of 130,000 on a 300 kV FEI Titan Krios (Thermo Fisher Scientific) equipped with a K2 Summit direct electron detector camera (Gatan). To increase angular sampling, data were collected at a stage tilt of 0° and 40°. Data collection was automated using Leginon.
Cryo-EM data processing
Image preprocessing was performed with the Appion (Lander et al., 2009) software package. Micrograph movie frames were aligned, dose-weighted using the UCSF MotionCor2 (Zheng et al., 2017) software, and GCTF (Zhang, 2016) was estimated. Micrographs were then transferred to cryoSPARC (Punjani et al., 2017) v2.0 for particle picking and reference-free 2D classification. A 3D refinement of total HA particles was performed and particle stacks were sorted for Fab-bound complexes and refined by heterogeneous, homogenous, and non-uniform refinements.
Online supplemental material
Fig. S1 provides flow cytometry gating strategies for B cells in blood and lymph nodes. Fig. S2 describes the scRNA-seq analysis. Fig. S3 provides additional examples of clonal lineages in persistent GCs. Fig. S4 includes additional structural analyses of clonal lineage 05.89107.H1N1. Fig. S5 shows flow cytometry and scRNA-seq analysis of GCs after 2019 QIV immunization. Tables S1 and S2 provide the x-ray and cryo-EM data collection and refinement statistics. Tables S3, S4, S5, S6, and S7 provide cell counts and processing statistics for single-cell BCR and 5′ gene expression.
Data availability
Raw sequencing data and processed GEX and BCR data have been submitted to the NCBI Gene Expression Omnibus (GEO) database under the identifiers GSE211875 and GSE148633, respectively. Map generated from electron microscopy data is deposited in the Electron Microscopy databank (http://www.emdatabank.org/) under accession ID EMD-41874 and in the Protein Data Bank (PDB) (https://www.rcsb.org) under accession code 8U44. X-ray coordinates and structure factors are deposited in the PDB under accession codes 8TY7, 8TXM, 8TXP, and 8TXT. This paper does not report original code. Any additional information required to reanalyze the data reported in this paper is available upon request from the corresponding authors.
Acknowledgments
The authors thank all the donors for generously providing precious specimens; L. Kessels, A. Haile, and the Washington University School of Medicine 321 Study Team for assistance with scheduling participants and sample collection; the Genome Technology Access Center in the Department of Genetics at Washington University School of Medicine; A. Melillo for submitting the scRNA-seq and BCR repertoire data to GEO; and H. Matz for critically reading the manuscript.
The Ellebedy laboratory was supported by National Institutes of Health (NIH) grants U01AI141990, 1U01AI150747, 5U01AI144616-02, and R01AI168178-01. The Ward and Wilson laboratories were supported by the Collaborative Influenza Vaccine Innovation Centers (CIVICs, contract 75N93019C00051). Work in the Kleinstein laboratory was partially funded by NIH grants R01AI104739 and U19AI089992. Work in the Krammer laboratory was partially funded by the Centers of Excellence for Influenza Research and Surveillance (contract HHSN272201400008C), the Centers of Excellence for Influenza Research and Response (contract 75N93021C00014), and the CIVICs (contract 75N93019C00051). K.M. McIntire was supported by NIH grant 5T32AI007163-44. W. Kim was supported by the Basic Science Research Program through the National Research Foundation of Korea funded by the Ministry of Education (2021R1A6A3A03041509). The content of this manuscript is solely the responsibility of the authors and does not necessarily represent the official view of NIH.
Author contributions: K.M. McIntire: Data curation, Formal analysis, Investigation, Methodology, Validation, Visualization, Writing - original draft, Writing - review & editing, H. Meng: Data curation, Formal analysis, Methodology, Resources, Software, Validation, Visualization, Writing - original draft, Writing - review & editing, T.-H. Lin: Conceptualization, Data curation, Formal analysis, Funding acquisition, Investigation, Methodology, Project administration, Resources, Software, Supervision, Validation, Visualization, Writing - original draft, Writing - review & editing, W. Kim: Data curation, Formal analysis, Investigation, Visualization, Writing - review & editing, N.E. Moore: Investigation, J. Han: Data curation, Formal analysis, Investigation, M. McMahon: Conceptualization, Data curation, Investigation, Methodology, Project administration, Supervision, Writing - original draft, Writing - review & editing, M. Wang: Formal analysis, S.K. Malladi: Data curation, Formal analysis, Investigation, Methodology, Validation, Visualization, Writing - original draft, Writing - review & editing, B.M. Mohammed: Investigation, Writing - review & editing, J.Q. Zhou: Data curation, Formal analysis, Software, Writing - review & editing, A.J. Schmitz: Investigation, Writing - review & editing, K.B. Hoehn: Formal analysis, Software, Visualization, Writing - review & editing, J.M. Carreno: Investigation, Validation, T. Yellin: Investigation, T. Suessen: Methodology, W.D. Middleton: Conceptualization, Data curation, Investigation, Methodology, Project administration, Resources, Supervision, Writing - review & editing, S.A. Teefey: Project administration, R.M. Presti: Conceptualization, Data curation, Investigation, Methodology, Project administration, Resources, Supervision, Writing - review & editing, F. Krammer: Conceptualization, Data curation, Formal analysis, Funding acquisition, Writing - review & editing, J.S. Turner: Formal analysis, Investigation, Visualization, Writing - review & editing, A.B. Ward: Funding acquisition, Project administration, Supervision, I.A. Wilson: Conceptualization, Funding acquisition, Project administration, Resources, Supervision, Validation, Writing - original draft, Writing - review & editing, S.H. Kleinstein: Conceptualization, Data curation, Funding acquisition, Methodology, Project administration, Supervision, Writing - original draft, Writing - review & editing, A.H. Ellebedy: Conceptualization, Funding acquisition, Project administration, Resources, Supervision, Writing - original draft, Writing - review & editing.

