


The translocation t(14;18) activates BCL2 and is considered the initiating genetic lesion in most follicular lymphomas (FL). Surprisingly, FL patients fail to respond to the BCL2 inhibitor, Venetoclax. We show that mutations and deletions affecting the histone lysine methyltransferase SETD1B (KMT2G) occur in 7% of FLs and 16% of diffuse large B cell lymphomas (DLBCL). Deficiency in SETD1B confers striking resistance to Venetoclax and an experimental MCL-1 inhibitor. SETD1B also acts as a tumor suppressor and cooperates with the loss of KMT2D in lymphoma development in vivo. Consistently, loss of SETD1B in human lymphomas typically coincides with loss of KMT2D. Mechanistically, SETD1B is required for the expression of several proapoptotic BCL2 family proteins. Conversely, inhibitors of the KDM5 histone H3K4 demethylases restore BIM and BIK expression and synergize with Venetoclax in SETD1B-deficient lymphomas. These results establish SETD1B as an epigenetic regulator of cell death and reveal a pharmacological strategy to augment Venetoclax sensitivity in lymphoma.
Introduction
Follicular lymphoma (FL) is the second most common form of B cell non-Hodgkin lymphoma and remains incurable with frequent relapses and eventual transformation into an aggressive disease (Huet et al., 2018; Relander et al., 2010). The genetic hallmark of FL is the translocation t(14;18), which occurs in over 90% of patients and leads to overexpression of the anti-apoptotic BCL2 protein. Unexpectedly, FL patients respond poorly to BCL2 inhibition with Venetoclax (Davids et al., 2021; Morschhauser et al., 2021; Zelenetz et al., 2019). The mechanisms underlying BCL2 independence in FL are poorly understood, and it has been speculated that epigenetic rewiring of cell death programs may play a role (Okosun et al., 2013). Studies in other cancers and leukemias have identified several potential causes of Venetoclax resistance including rare BCL2 mutations (Blombery et al., 2019a, 2019b; Weiss et al., 2019), increased levels of anti-apoptotic proteins BCL-xL and MCL-1 (Agarwal et al., 2019), changes in mitochondrial translation (Bosc et al., 2021), or broad metabolic adaptations (Jones et al., 2020; Stevens et al., 2020) (reviewed in Condoluci and Rossi, 2022; Ong et al., 2022; Sullivan et al., 2022).
Mutations in genes that encode histone tail modifiers are among the most frequent genetic lesions in FL (Green et al., 2011; Jiang et al., 2017; Morin et al., 2011; Okosun et al., 2013; Ortega-Molina et al., 2015; Pasqualucci et al., 2011). The lysine-specific methyltransferase 2D (KMT2D) is mutated in 76–89% of FLs, leading to a defect in histone H3 lysine 4 mono- and di-methylation (H3K4me1/me2) (Araf et al., 2016; Bouska et al., 2017; Shilatifard, 2012). We previously reported that loss of kmt2d in different Bcl2 transgenic models triggers the development of germinal center (GC) lymphomas resembling human FLs, and we have linked this to the silencing of key regulators of growth signaling pathways such as B cell receptor signaling, NF-κB, and JAK-STAT (Ortega-Molina et al., 2015; Zhang et al., 2015). SETD1B (KMT2G) is a related enzyme that catalyzes the trimethylation of histone H3 lysine 4 (H3K4me3). Among SET domain proteins of the complex of proteins associated with Set1 complex, only KMT2D, SETD1B (KMT2G), and KMT2C are mutational targets in lymphoma as documented in the International Cancer Genome Consortium database and reviewed in Bakhshi and Georgel (2020). The potential involvement of SETD1B mutations in lymphoma biology is somewhat surprising, given that conditional inactivation of SETD1B leads to lymphopenia and myeloid proliferation in mice (Schmidt et al., 2018), and SETD1B knockouts are embryonically lethal (Bledau et al., 2014). Mechanistically, the H3K4me3 mark is considered a marker of active promoters and has been linked to transcription initiation (Lauberth et al., 2013; Vermeulen and Timmers, 2010). A recent study emphasized the role of the H3K4me3 mark in the pause and release of RNA polymerase II and thereby the general process of transcription elongation (Wang et al., 2023a). Our results highlight a more selective role for SETD1B in the epigenetic regulation of cell death programs in B cell lymphomas that connect loss of SETD1B to lymphomagenesis and resistance to Venetoclax.
Results
SETD1B deficiency protects lymphoma cells against BCL2 and MCL-1 inhibitors
We performed two separate genome-wide CRISPR/Cas9 screens to explore the mechanisms of resistance to the clinically approved BCL2 inhibitor, Venetoclax, and to an experimental MCL-1 inhibitor (S63845) in OCI-LY19 lymphoma cells. Both compounds act by outcompeting the binding of proapoptotic BH3 proteins to the anti-apoptotic BCL2 and MCL-1 proteins, respectively (Kotschy et al., 2016; Souers et al., 2013). Briefly, we transduced OCI-LY19 lymphoma cells with the genome-scale GeCKO V2 CRISPR knockout library and exposed the cells to IC90 concentration of Venetoclax (100 nM) or S63845 (1 μM). We measured changes in the single guide RNA (sgRNA) library representation before and after treatment by deep sequencing. The screens against Venetoclax and S63845 identified an overlapping list of genes indicating common determinants of cell death (Fig. 1, A and B; and Tables S1 and S2). Expected hits included the tumor suppressor TP53 and the genes encoding BH3-only proteins BAX, BAK, NOXA, and BIK, and we confirmed their protective effect in gene-edited OCI-LY19 cells (Fig. S1 A) (DeWeirdt et al., 2020; Nechiporuk et al., 2019; Wang et al., 2023b; Zhang et al., 2022). The SETD1B gene was an unexpected top hit in both the BCL2 and MCL-1 inhibitor screens (Fig. 1, A and B). In detail, we observed a significant enrichment (false discovery rate [FDR] < 0.0001) of most (5/6 and 6/6) SETD1B sgRNAs in the Venetoclax and the S63845 (MCL-1 inhibitor) screens. We made SETD1B deficient OCI-LY19 cells and confirmed resistance to Venetoclax (IC50 shift from ∼5 nM to ∼2 µM) and S63845 (IC50 shift from ∼11 to ∼230 nM) (Fig. 1 C and Fig. S1 B); the clones showed no change in expression of drug targets, BCL2, and MCL-1 (Fig. S1 C). Consistently, SETD1B-deficient clones showed no Annexin V staining or outer mitochondrial membrane depolarization in response to Venetoclax (Fig. 1 D and Fig. S1 D). We also generated isogenic clones with SETD1B deficiency from OCI-LY8 and SU-DHL-10 cell lines that are KMT2D wild-type and confirmed resistance to Venetoclax in SETD1B-deficient cells (IC50 shift from ∼136 nM to ∼1.2 µM) (Fig. S1, E–H). Interestingly, loss of only KMT2D sensitized OCI-LY8 cells to Venetoclax (IC50 ∼22 nM) (Fig. S1 H). We speculate that coselection of SETD1B loss acts to neutralize this effect. We also confirmed SETD1B-loss-related drug resistance in vivo. OCI-LY19 (SETD1Bwt) xenografts showed significant growth inhibition when treated with Venetoclax (100 mg/kg,by oral administration [p.o.], 5 times daily [QDx5]), whereas isogenic, SETD1B-deficient tumors failed to respond to the drug (Fig. 1, E and F). Thus, loss of SETD1B emerges as an unexpected mechanism of resistance to both BCL2 and MCL-1 inhibition in lymphoma.

Loss of SETD1B impairs response to BCL2 and MCL-1 inhibition. (A and B) Dot plots illustrate the top candidate genes identified through CRISPR screening for (A) Venetoclax and (B) MCL-1 inhibitor (S63845). Genes are ranked by the average Log2FC (FC after treatment vs. before treatment) of all significantly enriched sgRNAs targeting the respective gene. (C) IC50 curves depict the response of OCI-LY19 cells to Venetoclax. The cells carry either Cas9 alone, Cas9 with sgRNA targeting LacZ (sgLacZ), or sgRNAs targeting SETD1B (sgSETD1B, single-cell clones without detectable SETD1B protein) generated from two independent sgRNAs. Values represent the average of three independent dose-titration curves (n = 3). (D) Bar graphs displaying measurements of mitochondrial cytochrome c release, reflecting mitochondrial depolarization, following treatment with DMSO or Venetoclax. Alamethicin treatment triggers the complete release of mitochondrial cytochrome c (100% mitochondrial depolarization) and serves as a positive control. (E) Relative growth curve of xenografted OCI-LY19; sgLacZ treated with vehicle (n = 5) or 100 mg/kg of Venetoclax (n = 5). P value was calculated using Student’s t test (*P < 0.05). (F) Relative growth curve of xenografted OCI-LY19;sgSETD1B (sg1; clone 1) treated with vehicle (n = 5) or Venetoclax (n = 5). P value was calculated using Student’s t test (n.s.: not significant).
Loss of SETD1B impairs response to BCL2 and MCL-1 inhibition. (A and B) Dot plots illustrate the top candidate genes identified through CRISPR screening for (A) Venetoclax and (B) MCL-1 inhibitor (S63845). Genes are ranked by the average Log2FC (FC after treatment vs. before treatment) of all significantly enriched sgRNAs targeting the respective gene. (C) IC50 curves depict the response of OCI-LY19 cells to Venetoclax. The cells carry either Cas9 alone, Cas9 with sgRNA targeting LacZ (sgLacZ), or sgRNAs targeting SETD1B (sgSETD1B, single-cell clones without detectable SETD1B protein) generated from two independent sgRNAs. Values represent the average of three independent dose-titration curves (n = 3). (D) Bar graphs displaying measurements of mitochondrial cytochrome c release, reflecting mitochondrial depolarization, following treatment with DMSO or Venetoclax. Alamethicin treatment triggers the complete release of mitochondrial cytochrome c (100% mitochondrial depolarization) and serves as a positive control. (E) Relative growth curve of xenografted OCI-LY19; sgLacZ treated with vehicle (n = 5) or 100 mg/kg of Venetoclax (n = 5). P value was calculated using Student’s t test (*P < 0.05). (F) Relative growth curve of xenografted OCI-LY19;sgSETD1B (sg1; clone 1) treated with vehicle (n = 5) or Venetoclax (n = 5). P value was calculated using Student’s t test (n.s.: not significant).
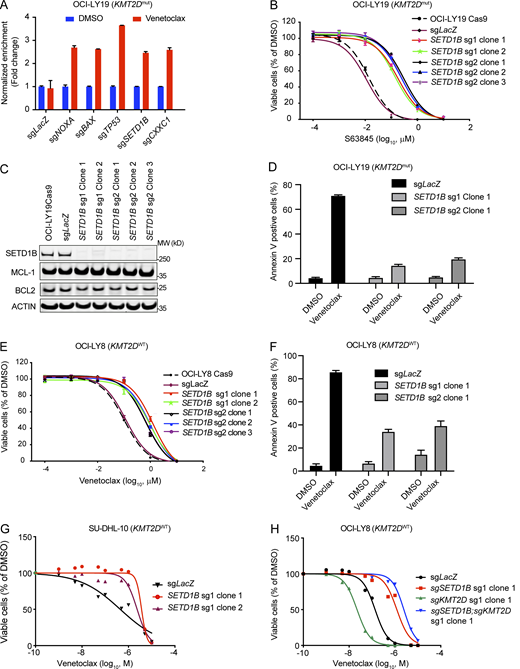
Funtional analysis of SETD1B loss in DLBCL cell lines. (A) Bar graphs displaying the validation of the CRISPR-cas9 screen hits with individual sgRNA by cell competition assay. OCI-LY19 cells were partially transduced with sgRNA targeting top candidate genes from the genome-wide screening. sgRNAs co-expressing tRFP (turbo-red fluorescent protein) and the percentages of tRFP-positive cells were measured by flow cytometry. Cells were treated with DMSO or 100 nmol Venetoclax for 3 days and recovered for 3–5 days and the treatment and recovery cycle was repeated once. The percentages of tRFP-positive cells after treatment were normalized to before treatment as FC to indicate the Venetoclax resistance of cells transduced with sgRNAs targeting these candidate genes. Results were represented as mean ± SD (n = 3). (B) IC50 curves of MCL-1 inhibitor, S63845, in OCI-LY19 cells carrying only Cas9, or Cas9; sgLacZ, or Cas9; sgSETD1B single-cell clones from two independent sgRNAs. Values represent the average of three independent dose-titration curves (n = 3). (C) Representative immunoblotting of OCI-LY19; sgLacZ and OCI-LY19; sgSETD1B clones were probed with SETD1B and BCL2 family proteins. β-Actin was used as a loading control. Data representative of at least two independent experiments are shown. MW, molecular weight in kD. (D) Annexin V analysis of OCI-LY19; sgLacZ and OCI-LY19; sgSETD1B clones treated with DMSO or 2.5 μM Venetoclax. Results were represented as mean ± SD (n = 3). (E) IC50 curves of Venetoclax in OCI-LY8 cells carrying only Cas9, or Cas9; sgLacZ, or Cas9; sgSETD1B single-cell clones from two independent sgRNAs. Values represent the average of three independent dose-titration curves (n = 3). (F) Annexin V analysis of OCI-LY8; sgSETD1B and OCI-LY8; sgLacZ treated with DMSO or 2.5 μM of Venetoclax. Values represent means and SD (n = 3). (G) IC50 curves of SU-DHL-10 isogenic cell lines with (sgSETD1B clone 1 and clone 2) or without (sgLacZ) SETD1B mutations after 72 h of Venetoclax treatment. Values represent means and SD (n = 3). (H) IC50 curves of OCI-LY8 isogenic cell lines with SETD1B (sgSETD1B), KMT2D (sgKMT2D), or with SETD1B and KMT2D mutations (sgSETD1B;KMT2D) after 72 h of Venetoclax treatment. Values represent means and SD (n = 3). Source data are available for this figure: SourceData FS1.
Funtional analysis of SETD1B loss in DLBCL cell lines. (A) Bar graphs displaying the validation of the CRISPR-cas9 screen hits with individual sgRNA by cell competition assay. OCI-LY19 cells were partially transduced with sgRNA targeting top candidate genes from the genome-wide screening. sgRNAs co-expressing tRFP (turbo-red fluorescent protein) and the percentages of tRFP-positive cells were measured by flow cytometry. Cells were treated with DMSO or 100 nmol Venetoclax for 3 days and recovered for 3–5 days and the treatment and recovery cycle was repeated once. The percentages of tRFP-positive cells after treatment were normalized to before treatment as FC to indicate the Venetoclax resistance of cells transduced with sgRNAs targeting these candidate genes. Results were represented as mean ± SD (n = 3). (B) IC50 curves of MCL-1 inhibitor, S63845, in OCI-LY19 cells carrying only Cas9, or Cas9; sgLacZ, or Cas9; sgSETD1B single-cell clones from two independent sgRNAs. Values represent the average of three independent dose-titration curves (n = 3). (C) Representative immunoblotting of OCI-LY19; sgLacZ and OCI-LY19; sgSETD1B clones were probed with SETD1B and BCL2 family proteins. β-Actin was used as a loading control. Data representative of at least two independent experiments are shown. MW, molecular weight in kD. (D) Annexin V analysis of OCI-LY19; sgLacZ and OCI-LY19; sgSETD1B clones treated with DMSO or 2.5 μM Venetoclax. Results were represented as mean ± SD (n = 3). (E) IC50 curves of Venetoclax in OCI-LY8 cells carrying only Cas9, or Cas9; sgLacZ, or Cas9; sgSETD1B single-cell clones from two independent sgRNAs. Values represent the average of three independent dose-titration curves (n = 3). (F) Annexin V analysis of OCI-LY8; sgSETD1B and OCI-LY8; sgLacZ treated with DMSO or 2.5 μM of Venetoclax. Values represent means and SD (n = 3). (G) IC50 curves of SU-DHL-10 isogenic cell lines with (sgSETD1B clone 1 and clone 2) or without (sgLacZ) SETD1B mutations after 72 h of Venetoclax treatment. Values represent means and SD (n = 3). (H) IC50 curves of OCI-LY8 isogenic cell lines with SETD1B (sgSETD1B), KMT2D (sgKMT2D), or with SETD1B and KMT2D mutations (sgSETD1B;KMT2D) after 72 h of Venetoclax treatment. Values represent means and SD (n = 3). Source data are available for this figure: SourceData FS1.
SETD1B is a mutational target in FL and diffuse large B cell lymphoma (DLBCL)
We investigated SETD1B mutations in large collections of human FLs (n = 216) and DLBCLs (n = 248) sourced from Memorial Sloan Kettering Cancer Center (MSKCC). We also included published data from various sources, and in total, we analyzed data from 1,759 FL and DLBCL samples. We identified 16 SETD1B missense mutations, 29 frameshift lesions, 3 nonsense mutations, and 2 splice mutations. A hotspot was apparent at position 8 where we observed 21 frameshift insertions that replaced a histidine (H) with a proline (P) and caused termination at amino acid 30 (H8Pfs*30) (Fig. 2 A). The SETD1B variant allele frequency (VAF < 0.5) across both MSK FL and MSK DLBCL studies suggests heterozygous or subclonal lesions (Fig. S2 A). SETD1B expression showed only a modest, not significant decrease between wild-type and mutant tumor samples (Fig. S2 B), while KMT2D analysis showed a stronger trend toward reduced expression (Fig. S2 C). The SIFT score (Sorting Intolerant from Tolerant) is a method to predict effects of amino acid changes on protein function (Ng and Henikoff, 2003). We observed SIFT scores close to “0” for SETD1B missense mutations listed in The Cancer Genome Atlas (TCGA) (Sanchez-Vega et al., 2018) study, which is consistent with a deleterious, loss-of-function effect (Fig. S2 D).

SETD1B is frequently mutated or depleted in FL and DLBCL. (A) Schematic overview illustrating SETD1B mutations in FL and DLBCL. The mutations span all functional domains of the protein, with a notable hotspot mutation resulting in a premature stop codon at amino acid 30 (H8Pfs*30). (B and C) (B) Oncoprint representation of an integrated annotation of somatic mutations and DNA copy-number changes of KMT2 family genes in 216 FL and (C) 248 DLBCL samples from MSK database. SETD1B mutations showed a propensity to co-occur with KMT2D mutations (FL, P = 0.008; DLBCL, P = 0.064). P values were calculated by two-sided Fisher Exact test. (D and E) (D) Oncoprint representation of an integrated annotation of somatic mutations and DNA copy-number changes of SETD1B and TP53 genes in 216 FL and (E) 248 DLBCL from MSK database. SETD1B mutations showed a trend (non-significant) to a mutual exclusive relationship with loss of TP53 (FL, P = 0.256; DLBCL, P = 0.126). P values were calculated by two-sided Fisher Exact test. All samples are arranged in columns with genes labeled along rows. Only samples with alterations are shown.
SETD1B is frequently mutated or depleted in FL and DLBCL. (A) Schematic overview illustrating SETD1B mutations in FL and DLBCL. The mutations span all functional domains of the protein, with a notable hotspot mutation resulting in a premature stop codon at amino acid 30 (H8Pfs*30). (B and C) (B) Oncoprint representation of an integrated annotation of somatic mutations and DNA copy-number changes of KMT2 family genes in 216 FL and (C) 248 DLBCL samples from MSK database. SETD1B mutations showed a propensity to co-occur with KMT2D mutations (FL, P = 0.008; DLBCL, P = 0.064). P values were calculated by two-sided Fisher Exact test. (D and E) (D) Oncoprint representation of an integrated annotation of somatic mutations and DNA copy-number changes of SETD1B and TP53 genes in 216 FL and (E) 248 DLBCL from MSK database. SETD1B mutations showed a trend (non-significant) to a mutual exclusive relationship with loss of TP53 (FL, P = 0.256; DLBCL, P = 0.126). P values were calculated by two-sided Fisher Exact test. All samples are arranged in columns with genes labeled along rows. Only samples with alterations are shown.

Comprehensive analysis of SETD1B mutation frequency in lymphoma across multiple studies. (A) Estimated allele frequency in tumor patient samples from MSK DLBCL and MSK FL studies. (B and C) Dot plot representing the (B) SETD1B and (C) KMT2D mRNA expression levels in altered and non-altered DLBCL patient samples (TCGA, Pan Cancer Atlas, Sanchez-Vega et al., 2018). (D) Table representing SIFT scores for SETD1B missense mutations found in TCGA, PanCancer Atlas database (Sanchez-Vega et al., 2018). (E) Oncoprint representation of mutation status of KMT2 family genes in 1,295 samples from published DLBCL sequencing studies. Samples are arranged in columns with genes labeled along rows. Only samples with alterations are shown. (F and G) Pie charts showing the frequency of SETD1B mutations in a cohort of (F) FL and (G) DLBCL patients with wild-type or mutated KMT2D. Patients with KMT2D mutations have a higher likelihood of having mutations in SETD1B in both cohorts. (H) Oncoprint representation of mutation status of SETD1B and TP53 genes in 1,295 samples from published DLBCL sequencing studies (P = 0.55). P values were calculated with two-sided Fisher Exact test.
Comprehensive analysis of SETD1B mutation frequency in lymphoma across multiple studies. (A) Estimated allele frequency in tumor patient samples from MSK DLBCL and MSK FL studies. (B and C) Dot plot representing the (B) SETD1B and (C) KMT2D mRNA expression levels in altered and non-altered DLBCL patient samples (TCGA, Pan Cancer Atlas, Sanchez-Vega et al., 2018). (D) Table representing SIFT scores for SETD1B missense mutations found in TCGA, PanCancer Atlas database (Sanchez-Vega et al., 2018). (E) Oncoprint representation of mutation status of KMT2 family genes in 1,295 samples from published DLBCL sequencing studies. Samples are arranged in columns with genes labeled along rows. Only samples with alterations are shown. (F and G) Pie charts showing the frequency of SETD1B mutations in a cohort of (F) FL and (G) DLBCL patients with wild-type or mutated KMT2D. Patients with KMT2D mutations have a higher likelihood of having mutations in SETD1B in both cohorts. (H) Oncoprint representation of mutation status of SETD1B and TP53 genes in 1,295 samples from published DLBCL sequencing studies (P = 0.55). P values were calculated with two-sided Fisher Exact test.
We also explored mutations and copy number changes of related H3K4 histone methyltransferase genes, including KMT2A, KMT2B, KMT2C, KMT2D, and SETD1A (Fig. 2, B and C; and Table S3). As anticipated, KMT2D emerged as the most frequently altered (mutated or deleted) H3K4 histone methyl transferase gene with frequencies of 62% in FL and 30% in DLBCL. The second most frequently mutated family member was SETD1B, with mutations or deletions in 16% of DLBCLs (and 7% of FLs). Other H3K4 methyltransferase genes were rarely mutated in our analysis; KMT2C showed mutation frequency of 5%. These findings align with public TCGA data and reported cohorts (Fig. S2 E) (Chapuy et al., 2018; Lohr et al., 2012; Morin et al., 2013; Reddy et al., 2017; Sanchez-Vega et al., 2018). Notably, SETD1B mutations were consistently associated with KMT2D mutations in all groups. For instance, in the MSK series of 216 FLs, the frequency of SETD1B lesions in KMT2D mutant tumors (n = 134) was 9.7%, whereas the SETD1B mutation frequency in KMT2D wild-type FLs (n = 82) was only 1.2% (Fig. 2 B and Fig. S2 F), indicating a significant concordance between SETD1B and KMT2D in FL (P = 0.008). We observed a similar trend in DLBCL (P = 0.064) (Fig. 2 C and Fig. S2 G) without association with the specific DLBCL genetic subtype described in the National Cancer Institute DLBCL cohort (Schmitz et al., 2018).
We further performed an unbiased genome-wide search for other genetic lesions that might be associated with SETD1B mutations. We only found a trend for a mutually exclusive relationship with the loss of TP53 in FL and DLBCL. Briefly, in the human FL cohort (n = 216), we observed TP53 mutations in 10% of the samples, occurring exclusively in SETD1B wild-type tumors (P = 0.254) (Fig. 2 D). In our DLBCL cohort (n = 248) and the published data, the observed trend was weaker than in FL (e.g., in the MSK cohort n = 248, P = 0.126 and across all published datasets P = 0.55) (Fig. 2 E and Fig. S2 H). Given the low mutation frequencies, this trend was interpreted with caution, and no other significant genetic association was detected. Together, the human genetic evidence suggests that SETD1B deficiency complements KMT2D mutations in lymphoma and may contribute additional biological functions.
SETD1B acts as a tumor suppressor in B cell lymphoma
The role of SETD1B and H3K4me3 regulation in lymphoma development has not been studied. We used the VavP-Bcl2 mouse model that recapitulates key aspects of human GC B cell lymphoma biology (Boice et al., 2016; Oricchio et al., 2011; Ortega-Molina et al., 2015). We crossed the VavP-Bcl2 strain with CAG-Cas9 transgenic mice (Platt et al., 2014) to enable in vivo CRISPR gene editing, and we used murine stem cell virus retroviral (RFP/GFP) vectors to express relevant sgRNAs in fetal liver–derived hematopoietic precursor cells (HPCs) (Fig. S3 A). Targeting Kmt2d resulted in an accelerated lymphomagenesis in vivo (sgLacZ: black, n = 22 versus sgKmt2d; blue, n = 8, P = 0.026) (Fig. 3 A) (Ortega-Molina et al., 2015; Zhang et al., 2015). Similarly, targeting Setd1b caused a significant acceleration and increased penetrance of lymphoma development compared with controls (sgLacZ: black, n = 22 versus sgSetd1b: green, n = 19; P = 0.011) (Fig. 3 A). We confirmed efficient Setd1b targeting using the T7 endonuclease detection and tumor acceleration using a second sgRNA against Setd1b (sgSetd1b [sg2], purple, n = 8; P = 0.005) (Fig. S3, B and C). The combined inactivation of Setd1b and Kmt2d (sgKmt2d; sgSetd1b, red, n = 10) had a powerful additive effect resulting in over 95% disease penetrance at 100 days, as compared with 60% with Setd1b or Kmt2d alone (P < 0.018) (Fig. 3 A). Measurements of spleen size, an indicator of lymphoma infiltration, corroborated this combination effect (Fig. 3 B and Fig. S3 D). Double positive population (sgKmt2dGFP; sgSetd1bRFP) was enriched in harvested tumors in comparison to initial transducer HPCs. Only three dual-targeted tumors were available for this analysis, and we observed an enrichment of sgKmt2dGFP+ cells and double transduced (sgKmt2dGFP; sgSetd1bRFP); for unclear reasons, we could not detect cells that were only RFP positive in HPCs or tumors (Fig. S3, E–G).
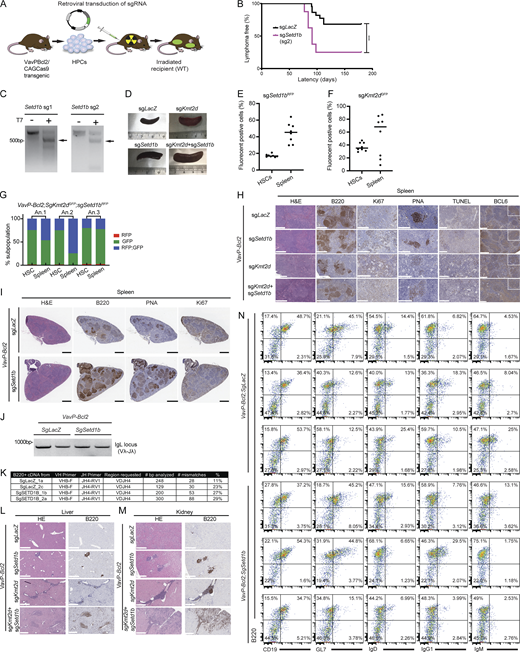
Combined loss of SETD1B and KMT2D leads to a more aggressive disease. (A) Illustration of FL adoptive transfer model based on the VavP-BCL2 transgenic and retroviral transduction of HPCs followed by reconstitution in lethally irradiated, syngeneic, female mice. (B) Survival curves for mice harboring sgRNA targeting LacZ (sgLacZ) and mice carrying sgRNA targeting Setd1b (sgSetd1b) (***P = 0.005). P value was calculated using Log-rank (Mantel–Cox) test. (C) Detection of genomic editing of Setd1b sgRNAs by T7 endonuclease I (T7E1) assay. The target fragments were amplified by PCR from genomic DNA from mouse tumors. Arrows indicate the digested fragments by T7EI. Data representative of at least two independent experiments are shown. (D) Representative spleens taken from each mouse group. Spleens from VavP-Bcl2; sgSetd1b (n = 27), VavP-Bcl2; sgKmt2d (n = 8), and VavP-Bcl2; sgkmt2d+sgSetd1b (n = 6) were enlarged compared with the control group, VavP-Bcl2; sgLacZ (n = 22). (E and F) Dot plot graph showing the percentage of positive transduced VavP-Bcl2 HSCs (prior to injection into mice) and splenic lymphoma cells (after injection and disease), indicating cells harboring (E) sgSetd1b-RFP (sgSetd1bRFP) or (F) sgKmt2d-GFP (sgKmt2dGFP) plasmids, (n = 8). (G) Stacked bar graph showing RFP and GFP-positive transduced VavP-Bcl2 HSCs (prior to injection into mice) and splenic lymphoma cells (after injection and disease), indicating cells harboring sgSetd1bRFP, sgKmt2dGFP plasmids or both sgSetd1bRFP and sgKmt2dGFP (RFP; GFP) (n = 3). (H) Additional immunohistochemistry serial micrographs of VavP-Bcl2 spleen tissues extracted from recipient mice upon sacrifice. VavP-Bcl2; sgLacZ, VavP-Bcl2; sgSetd1b, VavP-Bcl2; sgKmt2d, and VavP-Bcl2; sgSetd1b+Kmt2d were stained with H&E, B220, Ki67, PNA, TUNEL, and BCL6 of liver tissues extracted from recipient mice upon sacrifice (n = 3 per group). Insets are 3× magnified. Scale bar, 200 μm, 500 μm. (I) Representative histological micrographs of VavP-Bcl2; sgLacZ versus VavP-Bcl2; sgSetd1b, stained with H&E, B220, PNA, and Ki67 (n = 3 per group). Scale bar, 1 mm. (J) DNA gel representing Ig heavy chain variable region (IgVH) rearrangements in B220+ cells isolated from VavP-Bcl2;sgLacZ and VavP-Bcl2;sgSetd1b spleens. Data representative of two independent experiments are shown. (K) Table summarizing the results of SHM analysis in DNA collected from VavP-Bcl2;sgSetd1b to VavP-Bcl2;sgLacZ tumors. (L and M) H&E and B220 staining of kidney (M) and liver (L) tissues extracted from recipient mice upon sacrifice. n = 3 per group. (N) Flow cytometry analysis of the cellular composition of splenic tumor cells from three mice in each genotype, comparing VavP-Bcl2;sgSetd1b to VavP-Bcl2;sgLacZ. Source data are available for this figure: SourceData FS3.
Combined loss of SETD1B and KMT2D leads to a more aggressive disease. (A) Illustration of FL adoptive transfer model based on the VavP-BCL2 transgenic and retroviral transduction of HPCs followed by reconstitution in lethally irradiated, syngeneic, female mice. (B) Survival curves for mice harboring sgRNA targeting LacZ (sgLacZ) and mice carrying sgRNA targeting Setd1b (sgSetd1b) (***P = 0.005). P value was calculated using Log-rank (Mantel–Cox) test. (C) Detection of genomic editing of Setd1b sgRNAs by T7 endonuclease I (T7E1) assay. The target fragments were amplified by PCR from genomic DNA from mouse tumors. Arrows indicate the digested fragments by T7EI. Data representative of at least two independent experiments are shown. (D) Representative spleens taken from each mouse group. Spleens from VavP-Bcl2; sgSetd1b (n = 27), VavP-Bcl2; sgKmt2d (n = 8), and VavP-Bcl2; sgkmt2d+sgSetd1b (n = 6) were enlarged compared with the control group, VavP-Bcl2; sgLacZ (n = 22). (E and F) Dot plot graph showing the percentage of positive transduced VavP-Bcl2 HSCs (prior to injection into mice) and splenic lymphoma cells (after injection and disease), indicating cells harboring (E) sgSetd1b-RFP (sgSetd1bRFP) or (F) sgKmt2d-GFP (sgKmt2dGFP) plasmids, (n = 8). (G) Stacked bar graph showing RFP and GFP-positive transduced VavP-Bcl2 HSCs (prior to injection into mice) and splenic lymphoma cells (after injection and disease), indicating cells harboring sgSetd1bRFP, sgKmt2dGFP plasmids or both sgSetd1bRFP and sgKmt2dGFP (RFP; GFP) (n = 3). (H) Additional immunohistochemistry serial micrographs of VavP-Bcl2 spleen tissues extracted from recipient mice upon sacrifice. VavP-Bcl2; sgLacZ, VavP-Bcl2; sgSetd1b, VavP-Bcl2; sgKmt2d, and VavP-Bcl2; sgSetd1b+Kmt2d were stained with H&E, B220, Ki67, PNA, TUNEL, and BCL6 of liver tissues extracted from recipient mice upon sacrifice (n = 3 per group). Insets are 3× magnified. Scale bar, 200 μm, 500 μm. (I) Representative histological micrographs of VavP-Bcl2; sgLacZ versus VavP-Bcl2; sgSetd1b, stained with H&E, B220, PNA, and Ki67 (n = 3 per group). Scale bar, 1 mm. (J) DNA gel representing Ig heavy chain variable region (IgVH) rearrangements in B220+ cells isolated from VavP-Bcl2;sgLacZ and VavP-Bcl2;sgSetd1b spleens. Data representative of two independent experiments are shown. (K) Table summarizing the results of SHM analysis in DNA collected from VavP-Bcl2;sgSetd1b to VavP-Bcl2;sgLacZ tumors. (L and M) H&E and B220 staining of kidney (M) and liver (L) tissues extracted from recipient mice upon sacrifice. n = 3 per group. (N) Flow cytometry analysis of the cellular composition of splenic tumor cells from three mice in each genotype, comparing VavP-Bcl2;sgSetd1b to VavP-Bcl2;sgLacZ. Source data are available for this figure: SourceData FS3.

SETD1B is a tumor suppressor for B cell lymphoma. (A) Tumor latencies in animals receiving VavP-Bcl2/Cas9 transgenic HPCs transduced with sgRNA targeting LacZ (sgLacZ, black, n = 22) or sgRNA targeting Setd1b and/or Kmt2d (sgSetd1b, green, n = 19; P = 0.011; sgKmt2d, blue n = 8, P = 0.026; sgKmt2d+sgSetd1b, red, n = 10, P < 0.0001). P values were calculated using the Log-rank (Mantel–Cox) test. *P < 0.05, ****P < 0.0001. (B) Bar graphs showing the spleen/body weight ratio of recipient mice carrying sgLacZ (n = 22) or sgSetd1b (n = 27, pooled from sg1 and sg2, P < 0.0001), sgKmt2d (n = 8, P < 0.008), and sgSetd1B+sgKmt2d (n = 6, P < 0.0009). P values were calculated by two-way ANOVA followed by Tukey’s multiple comparisons test. **P < 0.01, ***P < 0.001, ****P < 0.0001. (C) Representative immunohistochemistry serial micrographs of VavP-Bcl2 spleen tissues extracted from recipient mice upon sacrifice VavP-Bcl2;sgLacZ, VavP-Bcl2;sgSetd1b, VavP-Bcl2;sgKmt2d, and VavP-Bcl2; sgSetd1b+Kmt2d were stained with H&E, B220, Ki67, PNA, TUNEL, and BCL6 (n = 3). Scale bar, 200, 500 μm. (D) Tumor volume growth curve of xenografted OCI-LY19;sgSETD1B and OCI-LY19;sgLacZ. P values were calculated by Student’s t test. ****P < 0.0001; n = 5. (E) Graph showing tumor weight comparison of OCI-LY19; sgSETD1B and OCI-LY19; sgLacZ. P values were calculated by Student’s t test. ***P = 0.0022; n = 5.
SETD1B is a tumor suppressor for B cell lymphoma. (A) Tumor latencies in animals receiving VavP-Bcl2/Cas9 transgenic HPCs transduced with sgRNA targeting LacZ (sgLacZ, black, n = 22) or sgRNA targeting Setd1b and/or Kmt2d (sgSetd1b, green, n = 19; P = 0.011; sgKmt2d, blue n = 8, P = 0.026; sgKmt2d+sgSetd1b, red, n = 10, P < 0.0001). P values were calculated using the Log-rank (Mantel–Cox) test. *P < 0.05, ****P < 0.0001. (B) Bar graphs showing the spleen/body weight ratio of recipient mice carrying sgLacZ (n = 22) or sgSetd1b (n = 27, pooled from sg1 and sg2, P < 0.0001), sgKmt2d (n = 8, P < 0.008), and sgSetd1B+sgKmt2d (n = 6, P < 0.0009). P values were calculated by two-way ANOVA followed by Tukey’s multiple comparisons test. **P < 0.01, ***P < 0.001, ****P < 0.0001. (C) Representative immunohistochemistry serial micrographs of VavP-Bcl2 spleen tissues extracted from recipient mice upon sacrifice VavP-Bcl2;sgLacZ, VavP-Bcl2;sgSetd1b, VavP-Bcl2;sgKmt2d, and VavP-Bcl2; sgSetd1b+Kmt2d were stained with H&E, B220, Ki67, PNA, TUNEL, and BCL6 (n = 3). Scale bar, 200, 500 μm. (D) Tumor volume growth curve of xenografted OCI-LY19;sgSETD1B and OCI-LY19;sgLacZ. P values were calculated by Student’s t test. ****P < 0.0001; n = 5. (E) Graph showing tumor weight comparison of OCI-LY19; sgSETD1B and OCI-LY19; sgLacZ. P values were calculated by Student’s t test. ***P = 0.0022; n = 5.
Mice transplanted with vavP-Bcl2;sgKmt2d, vavP-Bcl2;sgSetd1b, and vavP-Bcl2/sgKmt2d;Setd1b showed significant splenomegaly. Lymphomas had the typical follicular expansion of neoplastic B220+, peanut agglutinin positive (PNA+), and BCL6+ B cells with typically low Ki67 staining and negativeterminal deoxynucleotidyl transferase (TdT) dUTP nick-end labeling (TUNEL) (Fig. 3 C and Fig. S3 H). We interpreted the positivity of B cells for PNA and BCL6 and their localization to follicular structures as indicative of their GC origin (Fig. S3 I). PCR analysis of immunoglobulin light chain (IgL) locus indicated a clonal band as previously reported for the Kmt2d mutant lymphomas (Fig. S3 J). The GC origin was further supported by VDJH4 sequencing, showing evidence of somatic hypermutation (SHM) (Fig. S3 K). Compared with lymphomas arising in control animals (recipients of vavP-Bcl2 HPCs expressing sgLacZ) or in animals receiving the vavP-Bcl2 HPCs expressing sgKmt2d, the Setd1b-deficient tumors showed a more prominent extranodal infiltration into the liver and kidney (Fig. S3, L and M). Immunophenotyping confirmed a similar composition of lymphomatous spleens from control and Setd1b-deficient animals with neoplastic B cells that express B220, CD19, IgM, IgD, and between 15% and 45% GC marker GL7 (Fig. S3 N). These findings resemble the vavBcl2/shkmtd tumors we previously reported (Ortega-Molina et al., 2015), and they indicate that Setd1b deficiency cooperates with Bcl2 and Kmt2d in the development of high-grade, invasive, GC-derived FLs.
We further confirmed the cooperation between KMT2D and SETD1B in xenografted human B cell lymphomas. Briefly, we implanted isogenic clones of OCI-LY19 (KMT2Dmut) cells with and without SETD1B inactivation into the flanks of five mice and observed a striking growth advantage for double mutant clones (sgSETD1B) compared with parental OCI-LY19 (sgLacZ) (n = 5, P < 0.0001) (Fig. 3, D and E). Thus, SETD1B acts as a tumor suppressor in lymphoma development and cooperates with loss of KMT2D leading to a more aggressive disease.
SETD1B deficiency affects gene expression patterns in lymphoma cells
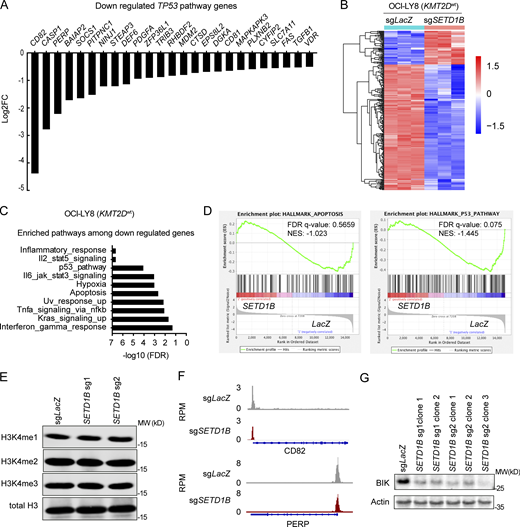
We have previously shown that KMT2D is required for the expression of negative regulators of RAS, NF-κB, CD40, and cytokine (IL-6, IL-10) signaling pathways such as SOCS3, TNFAIP3/A20, and IKBKB (Ortega-Molina et al., 2015; Zhang et al., 2015). To define the additional effects of SETD1B loss, we conducted a comparative analysis of gene expression patterns in isogenic clones of KMT2D mutant OCI-LY19 cells engineered to be mutant (sgSETD1B) or wild-type (sgLacZ) for SETD1B (Fig. 4 A). Differential gene expression analysis revealed differences linking loss of SETD1B to decreased expression of 1,235 genes and increased expression of 1,147 genes (FDR < 0.05, Log2FC [fold change] > 0.5) (Table S4). To identify direct SETD1B targets, we focused on downregulated genes, consistent with the known effect of deficient histone H3K4 methylation (Højfeldt et al., 2013; Shilatifard, 2012). The most significantly downregulated signatures were related to TNF-α, IFN-γ, interleukins IL-2 and IL-6, P53, and apoptosis including many proapoptotic TP53 targets genes (Fig. 4, B and C; Fig. S4 A; and Table S5). We also examined expression changes in OCI-LY8 that were wild-type for KMT2D and observed a similar pattern (Fig. S4 B and Table S6), such that SETD1B-deficient clones showed downregulation of signatures related to inflammation, cytokine (IL-2), apoptosis, and P53 functions (Fig. S4 D and Table S7).

SETD1B inactivation results in dysregulation of gene expression and H3K4 trimethylation. (A) Heatmap illustrating the differential gene expression of significantly differentially expressed genes (Log2FC > 0.5, FDR < 0.05) between OCI-LY19 cells (KMT2Dmut) carrying sgLacZ (n = 3) or sgSETD1B (sg1 clone 1) (n = 3). (B) Bar graphs demonstrating the top enriched gene sets within the hallmark dataset from MsigDB. The x-axis represents the differential gene expression’s FDR between SETD1B knockout and control. (C) Enrichment plot for P53 pathway and apoptosis hallmark gene sets of GSEA comparing OCI-LY19;sgSETD1B and OCI-LY19;sgLacZ. NES, normalized enrichment score. (D) Histograms showing the average H3K4me3 read density plot of ChIP-seq from SETD1B mutant (sgSETD1B) and OCI-LY19 control (sgLacZ). (E) Doughnut chart demonstrating the genomic distribution of H3K4me3-bound peaks with at least 30% loss (P < 0.05, peak numbers n = 1,553) in OCI-LY19 sgSETD1B cells versus sgLacZ cells located at the promoter (defined as ± 2 kb windows centered on TSS), intragenic (inside gene body), and intergenic (up- or downstream of the closest gene but not overlapping with the promoter). (F) Bar graphs representing the GSEA in significantly differentially expressed genes, as compared to the hallmark dataset (MsigDB). (G) Normalized Integrative Genomics Viewer (IGV) read-density tracks of H3K4me3 ChIP-seq peaks at the loci of representative genes (BIK and CD40) from the ChIP-seq experiments. Signals are plotted on a normalized read per million (RPM) bases. (H) ChIP-qPCR analysis of H3K4me3 loss in the promoter of BIK in OCI-LY19; sgSETD1B clones compared with control cells (sgLacZ). BIK downstream locus with no detectable H3K4me3 peaks in either sgSETD1B clones or control cells (NTC). Values represent means and SD. P values were calculated by Student’s t test. ****P < 0.0001, n = 3. (I) Bar graph representing the relative expression of BIK in OCI-LY19 sgSETD1B vs. clones OCI-LY19;sgLacZ treated with either DMSO or JIB-04. Values represent means and SD. P values were calculated by two-way ANOVA followed by Tukey’s multiple comparisons test. ****P < 0.0001; n = 3.
SETD1B inactivation results in dysregulation of gene expression and H3K4 trimethylation. (A) Heatmap illustrating the differential gene expression of significantly differentially expressed genes (Log2FC > 0.5, FDR < 0.05) between OCI-LY19 cells (KMT2Dmut) carrying sgLacZ (n = 3) or sgSETD1B (sg1 clone 1) (n = 3). (B) Bar graphs demonstrating the top enriched gene sets within the hallmark dataset from MsigDB. The x-axis represents the differential gene expression’s FDR between SETD1B knockout and control. (C) Enrichment plot for P53 pathway and apoptosis hallmark gene sets of GSEA comparing OCI-LY19;sgSETD1B and OCI-LY19;sgLacZ. NES, normalized enrichment score. (D) Histograms showing the average H3K4me3 read density plot of ChIP-seq from SETD1B mutant (sgSETD1B) and OCI-LY19 control (sgLacZ). (E) Doughnut chart demonstrating the genomic distribution of H3K4me3-bound peaks with at least 30% loss (P < 0.05, peak numbers n = 1,553) in OCI-LY19 sgSETD1B cells versus sgLacZ cells located at the promoter (defined as ± 2 kb windows centered on TSS), intragenic (inside gene body), and intergenic (up- or downstream of the closest gene but not overlapping with the promoter). (F) Bar graphs representing the GSEA in significantly differentially expressed genes, as compared to the hallmark dataset (MsigDB). (G) Normalized Integrative Genomics Viewer (IGV) read-density tracks of H3K4me3 ChIP-seq peaks at the loci of representative genes (BIK and CD40) from the ChIP-seq experiments. Signals are plotted on a normalized read per million (RPM) bases. (H) ChIP-qPCR analysis of H3K4me3 loss in the promoter of BIK in OCI-LY19; sgSETD1B clones compared with control cells (sgLacZ). BIK downstream locus with no detectable H3K4me3 peaks in either sgSETD1B clones or control cells (NTC). Values represent means and SD. P values were calculated by Student’s t test. ****P < 0.0001, n = 3. (I) Bar graph representing the relative expression of BIK in OCI-LY19 sgSETD1B vs. clones OCI-LY19;sgLacZ treated with either DMSO or JIB-04. Values represent means and SD. P values were calculated by two-way ANOVA followed by Tukey’s multiple comparisons test. ****P < 0.0001; n = 3.
Changes in gene expression and H3K4 trimethylation levels in SETD1B-deficient cells. (A) Direct TP53 targets genes derived from downregulated signatures as shown in Fig. 4 B. (B) Heatmap displaying the differential gene expression analysis of the top significantly differentially expressed genes (Log2FC > 1, FDR < 0.05) between OCI-LY8 cells carrying sgLacZ (n = 3) or sgSETD1B (sg1 clone 1) (n = 3). (C) Computed overlay of the significantly differentially expressed genes as compared with the hallmark pathways from MsigDB. (D) Enrichment plot for P53 pathway and apoptosis hallmark gene sets of GSEA comparing OCI-LY8; sgSETD1B and OCI-LY8; sgLacZ. NES, normalized enrichment score. (E) Western blots of OCI-LY19; sgLacZ and OCI-LY19; sgSETD1B (sg1 and sg2) cell lines blotted with H3K4 mono-, di- and tri-methylated and total H3 antibodies. Data representative of two independent experiments are shown. MW, molecular weight in kD. (F) Normalized IGV read-density tracks of H3K4me3 ChIP-seq peaks at the loci of representative genes (INFGR1 and CASP1) from the ChIP-seq experiments. Signals are plotted on a normalized read per million (RPM) bases. (G) Representative western blot analysis of BIK protein expression in OCI-LY19; sgLacZ and OCI-LY19; sgSETD1B clones. β-Actin was used as a loading control. Data representative of two independent experiments are shown. MW, molecular weight in kD. Source data are available for this figure: SourceData FS4.
Changes in gene expression and H3K4 trimethylation levels in SETD1B-deficient cells. (A) Direct TP53 targets genes derived from downregulated signatures as shown in Fig. 4 B. (B) Heatmap displaying the differential gene expression analysis of the top significantly differentially expressed genes (Log2FC > 1, FDR < 0.05) between OCI-LY8 cells carrying sgLacZ (n = 3) or sgSETD1B (sg1 clone 1) (n = 3). (C) Computed overlay of the significantly differentially expressed genes as compared with the hallmark pathways from MsigDB. (D) Enrichment plot for P53 pathway and apoptosis hallmark gene sets of GSEA comparing OCI-LY8; sgSETD1B and OCI-LY8; sgLacZ. NES, normalized enrichment score. (E) Western blots of OCI-LY19; sgLacZ and OCI-LY19; sgSETD1B (sg1 and sg2) cell lines blotted with H3K4 mono-, di- and tri-methylated and total H3 antibodies. Data representative of two independent experiments are shown. MW, molecular weight in kD. (F) Normalized IGV read-density tracks of H3K4me3 ChIP-seq peaks at the loci of representative genes (INFGR1 and CASP1) from the ChIP-seq experiments. Signals are plotted on a normalized read per million (RPM) bases. (G) Representative western blot analysis of BIK protein expression in OCI-LY19; sgLacZ and OCI-LY19; sgSETD1B clones. β-Actin was used as a loading control. Data representative of two independent experiments are shown. MW, molecular weight in kD. Source data are available for this figure: SourceData FS4.
As SETD1B catalyzes trimethylation on H3K4, we measured changes in this histone mark to define the immediate consequences of SETD1B loss (de Leval et al., 2009; Kranz and Anastassiadis, 2020; Wang et al., 2023b). Sensitive quantification by chromatin immunoprecipitation sequencing (ChIP-seq) analysis of H3K4me3-marked histone, as opposed to immunoblotting, confirmed a modest overall reduction in the H3K4me3 mark in SETD1B-deficient OCI-LY19 cells (Fig. 4 D and Fig. S4 E). Detailed analyses of SETD1B deficient cells by ChIP-seq revealed decreased H3K4 trimethylation in a subset of genomic regions. Specifically, we identified 1,553 H3K4me3 peaks with a reduction of more than 30% in the SETD1B-deficient cells compared to controls (Log2FC < 0.5, P < 0.05). 43% of these peaks localized to known promoter elements, defined as ± 2 kb windows centered on transcription start sites (TSS), while others were intra- or intergenic with unknown significance (Fig. 4 E and Table S8). Pathway analysis associated with H3K4me3 loss closely mirrored the changes in gene expression, showing significant enrichment of pathways related to TNF-α, IL-2 and IL-6, IFN-γ, cell death, and P53 (Fig. 4 F). For instance, the H3K4me3 peaks at promoters of the proapoptotic BH3-only gene BIK, the gene encoding receptor CD40 and P53 targets as PERP and CD82 were greatly decreased in the SETD1B-deficient clones compared with the parental KMT2D mutant OCI-LY19 cells (Fig. 4 G and Fig. S4 F). We confirmed the loss of the H3K4me3 mark on the BIK promoter by ChIP-PCR, along with the loss of its RNA and corresponding protein expression across different isogenic clones of SETD1B-deficient cells (Fig. 4, H and I; and Fig. S4 G). These results implicate SETD1B and H3K4 trimethylation in the expression of important immune receptors (CD40, IFNG) and cell death triggers (BIK) in B cell lymphoma.
Inhibitors of the KDM5 histone H3K4 demethylase restore Venetoclax sensitivity in SETD1B-deficient lymphomas
Epigenetic modifications are potentially amendable to therapeutic intervention. Inhibition of the KDM5 histone demethylase has been shown to restore the expression of a subset of KMT2D target genes (Heward et al., 2021). Consistently, we found that JIB-04, a KDM inhibitor with a preference for KDM5A (Wang et al., 2013), shows better cell-killing activity across most KMT2D mutant cell lines compared with KMT2D wild-type cells (Fig. S5, A and B). Moreover, we found a threefold increase in the expression of BIK mRNA in SETD1B-deficient OCI-LY19 (KMT2Dmut) cells (OCI-LY19;sgSETD1B) (Fig. 5 A). SETD1B loss also increased sensitivity to JIB-04 in isogenic clones of OCI-LY19 cells and in the KMT2D-wild-type OCI-LY8 cell line (Fig. 5 B and Fig. S5 C). Furthermore, JIB-04 treatment demonstrated clear in vitro synergy with Venetoclax (combination index at IC50 = 0.382 ± 0.014) and was able to reverse the resistance phenotype in OCI-LY19; sgSETD1B lymphoma cells (Fig. 5, C and D).
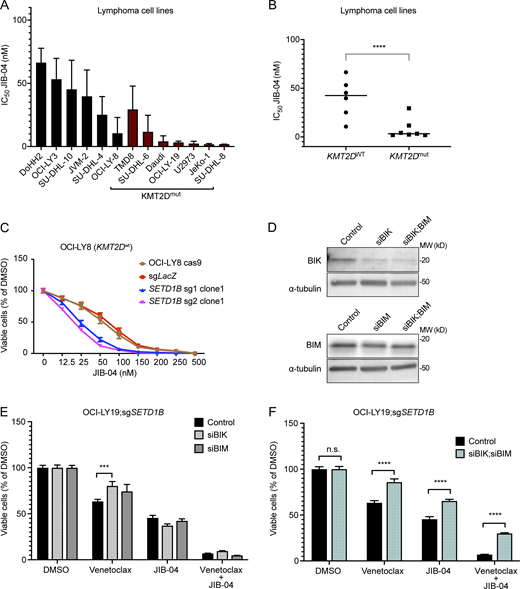
Venetoclax and JIB-04 treatment in lymphoma cells with BIM and BIK deficiency. (A) Bar graph representing JIB-04 IC50 values in cell lines with or without mutations in KMT2D after 72 h of JIB-04 treatment. Each bar represents the mean ± SD of two independent experiments, each time in triplicate (n = 3). (B) Dot plot comparing JIB-04 IC50 values in cell lines with or without mutations in KMT2D. Each dot represents the mean of two independent experiments, each time in triplicate. Cell viability was measured by CellTiter-Glo assay. P values were calculated by Student’s t test. ****P < 0.0001. (C) IC50 curves at 72 h of JIB-04 in OCI-LY8; sgLacZ or OCI-LY8; sgSETD1B single-cell clones. Results were represented as mean ± SD (n = 3). (D) Western blot analysis detection of the siRNA knockdown efficiency of BIK and BIM in OCI-LY19;sgSETD1B. β-Tubulin was used as the loading control. Data representative of two independent experiments are shown. MW, molecular weight in kD. (E) Bar graph showing the percentage of cell viability in OCI-LY19;sgSETD1B cells transfected with Control-siRNA, BIK-siRNA (2 μM), and BIM-siRNA (3 μM) after 72 h treatment with Venetoclax, JIB-04, or the combination of both compounds. Cell growth was assayed using the CellTiter-Glo Luminescent Cell Viability Assay Kit. Results were represented as mean ± SD (n = 3). P values were calculated by two-way ANOVA followed by Tukey’s multiple comparisons test, ***P = 0.007, n = 3. (F) Bar graph showing the percentage of cell viability in OCI-LY19;sgSETD1B cells transfected with Control-siRNA, BIK-siRNA (2 nM), or BIM-siRNA (3 nM) after 72 h treatment with Venetoclax, JIB-04, or the combination of both compounds. Cell growth was assayed using the CellTiter-Glo Luminescent Cell Viability Assay Kit. Results were represented as mean ± SD (n = 3). P values were calculated by two-way ANOVA followed by Tukey’s multiple comparisons test, ****P < 0.0001; n.s.: non-significant; n = 3. Source data are available for this figure: SourceData FS5.
Venetoclax and JIB-04 treatment in lymphoma cells with BIM and BIK deficiency. (A) Bar graph representing JIB-04 IC50 values in cell lines with or without mutations in KMT2D after 72 h of JIB-04 treatment. Each bar represents the mean ± SD of two independent experiments, each time in triplicate (n = 3). (B) Dot plot comparing JIB-04 IC50 values in cell lines with or without mutations in KMT2D. Each dot represents the mean of two independent experiments, each time in triplicate. Cell viability was measured by CellTiter-Glo assay. P values were calculated by Student’s t test. ****P < 0.0001. (C) IC50 curves at 72 h of JIB-04 in OCI-LY8; sgLacZ or OCI-LY8; sgSETD1B single-cell clones. Results were represented as mean ± SD (n = 3). (D) Western blot analysis detection of the siRNA knockdown efficiency of BIK and BIM in OCI-LY19;sgSETD1B. β-Tubulin was used as the loading control. Data representative of two independent experiments are shown. MW, molecular weight in kD. (E) Bar graph showing the percentage of cell viability in OCI-LY19;sgSETD1B cells transfected with Control-siRNA, BIK-siRNA (2 μM), and BIM-siRNA (3 μM) after 72 h treatment with Venetoclax, JIB-04, or the combination of both compounds. Cell growth was assayed using the CellTiter-Glo Luminescent Cell Viability Assay Kit. Results were represented as mean ± SD (n = 3). P values were calculated by two-way ANOVA followed by Tukey’s multiple comparisons test, ***P = 0.007, n = 3. (F) Bar graph showing the percentage of cell viability in OCI-LY19;sgSETD1B cells transfected with Control-siRNA, BIK-siRNA (2 nM), or BIM-siRNA (3 nM) after 72 h treatment with Venetoclax, JIB-04, or the combination of both compounds. Cell growth was assayed using the CellTiter-Glo Luminescent Cell Viability Assay Kit. Results were represented as mean ± SD (n = 3). P values were calculated by two-way ANOVA followed by Tukey’s multiple comparisons test, ****P < 0.0001; n.s.: non-significant; n = 3. Source data are available for this figure: SourceData FS5.

Combination benefit between BCL2 and KDM5-family inhibitors in SETD1B deficient lymphoma. (A) RT-qPCR analysis of the relative expression of BIK in OCI-LY19; sgSETD1B vs. OCI-LY19; sgLacZ cells treated with DMSO or 1 μM JIB-04 for 24 h. Results were represented as mean ± SD (n = 3). P values were calculated by two-way ANOVA followed by Tukey’s multiple comparisons test. ****P < 0.0001; n.s.: non-significant. (B) IC50 curves at 72 h of JIB-04 in OCI-LY19 cells carrying sgRNA targeting LacZ (sgLacZ) or SETD1B (sgSETD1b) knockout single-cell clone. Values represent the average of three independent dose-titration curves (n = 3). (C and D) Cell viability values in (C) OCI-LY19;sgSETD1B and (D) OCI-LY19;sgLacZ cell lines in response to Venetoclax and JIB-04 combined treatment for 72 h, as assessed by CellTiter-Glo assay. Values represent the average of three independent dose-titration curves (n = 3). Combination index at IC50 = 0.382 ± 0.014 calculated from the combination index equation algorithms (Chou, 2010) using CompuSyn software. (E and F) (E) Tumor volumes and (F) weight of OCI-LY19; sgSETD1B xenograft model treated with vehicle (p.o. QDx5); JIB-04 (50 mg/kg p.o. QDx5); Venetoclax (100 mg/kg p.o. QDx5); or with JIB-04 50 mg/kg p.o. QDx5 + Venetoclax 100 mg/kg p.o. QDx5. Treatment with JIB-04 started 5 days prior to the treatment with Venetoclax. Data represent the mean percentage ± SEM (n = 8 animal/group). P values were calculated by two-way ANOVA followed by Tukey’s multiple comparisons test. ****P < 0.0001; ***P = 0.0006.
Combination benefit between BCL2 and KDM5-family inhibitors in SETD1B deficient lymphoma. (A) RT-qPCR analysis of the relative expression of BIK in OCI-LY19; sgSETD1B vs. OCI-LY19; sgLacZ cells treated with DMSO or 1 μM JIB-04 for 24 h. Results were represented as mean ± SD (n = 3). P values were calculated by two-way ANOVA followed by Tukey’s multiple comparisons test. ****P < 0.0001; n.s.: non-significant. (B) IC50 curves at 72 h of JIB-04 in OCI-LY19 cells carrying sgRNA targeting LacZ (sgLacZ) or SETD1B (sgSETD1b) knockout single-cell clone. Values represent the average of three independent dose-titration curves (n = 3). (C and D) Cell viability values in (C) OCI-LY19;sgSETD1B and (D) OCI-LY19;sgLacZ cell lines in response to Venetoclax and JIB-04 combined treatment for 72 h, as assessed by CellTiter-Glo assay. Values represent the average of three independent dose-titration curves (n = 3). Combination index at IC50 = 0.382 ± 0.014 calculated from the combination index equation algorithms (Chou, 2010) using CompuSyn software. (E and F) (E) Tumor volumes and (F) weight of OCI-LY19; sgSETD1B xenograft model treated with vehicle (p.o. QDx5); JIB-04 (50 mg/kg p.o. QDx5); Venetoclax (100 mg/kg p.o. QDx5); or with JIB-04 50 mg/kg p.o. QDx5 + Venetoclax 100 mg/kg p.o. QDx5. Treatment with JIB-04 started 5 days prior to the treatment with Venetoclax. Data represent the mean percentage ± SEM (n = 8 animal/group). P values were calculated by two-way ANOVA followed by Tukey’s multiple comparisons test. ****P < 0.0001; ***P = 0.0006.
We knocked down BIM, BIK, or both proteins in OCI-LY19; sgSETD1B cells to determine the relevant contribution of these BH3-only proteins to the observed synergy (Fig. S5 D). We found that loss of BIK or BIM alone was insufficient to protect cells from single or combined treatment (Fig. S5 E). Only the loss of both BIK and BIM was able to confer resistance to Venetoclax, JIB-04, and the combination of both drugs (Fig. S5 F). We further examined this promising drug combination in vivo. Briefly, we implanted OCI-LY19; sgSETD1B cell clones into the flank of NOD/SCID/IL2Rγ−/− (NSG) mice and treated with Venetoclax at the full dose of 100 mg/kg, or JIB-04 at 50 mg/kg, or the combination of both drugs. We again observed resistance of the SETD1B-deficient tumors to Venetoclax (n = 8). No significant in vivo antitumor activity was detected with the KDM5 inhibitor JIB-04 (n = 8) (Fig. 5 E). However, the combination produced a significant tumor response (n = 8, P = 0.0006) compared with single-agent treatment with either drug (n = 8, P = 0.001) or untreated controls (n = 8, P = 0.0006). Importantly, the combination was well tolerated and no mortality or weight loss was observed (Fig. 5 F).
Discussion
Our results provide new insights into lymphoma development and the emergence of Venetoclax resistance in a subset of FL. Activation of BCL2 is the genetic hallmark of FL and is considered the initiating oncogenic event (Huet et al., 2018). However, the clinical activity of BCL2 inhibition with Venetoclax in FL remains disappointing, and epigenetic mechanisms have been proposed as potential contributors to BCL2 independence (Condoluci and Rossi, 2022; Davids et al., 2017, 2021; Morschhauser et al., 2021; Ong et al., 2022; Sullivan et al., 2022; Zelenetz et al., 2019). Heterozygous SETD1B mutations are observed in a small fraction of FLs (7%) and in DLBCLs (16%) indicating that SETD1B loss is not the only cause of primary Venetoclax resistance. An analysis of post-Venetoclax samples is needed to inform about the role of SETD1B in acquired resistance. A study in chronic lymphocytic leukemia previously identified promoter methylation of p53 upregulated modulator of apoptosis as a Venetoclax resistance mechanism (Thomalla et al., 2022); however, this would leave intact responses to MCL-1 inhibition (Lasater et al., 2023). Our screening and treatment results implicate SETD1B as an epigenetic—and therefore reversible—mechanism of resistance to both BCL2 and MCL-1 inhibition.
SETD1B functions as a broad regulator of gene expression with reported roles in transcription initiation (Lauberth et al., 2013; Vermeulen et al., 2007) and, more recently, in transcription elongation (Wang et al., 2023b). However, evidence of more selective effects has been seen in solid tumor xenografts, where SETD1B has been linked to hypoxia-induced transcription, driving angiogenesis and tumor growth (Ortmann et al., 2021). Genomic evidence in lymphoma indicates that SETD1B deficiency cooperates with loss of the histone methyl transferase KMT2D, and moreover, we observed a trend toward mutual exclusivity with TP53 mutations that suggests additional functions in the control of cell death programs. These genomic hypotheses are borne out in our functional evidence. For example, we report individual and cooperative tumor suppressor functions of SETD1B with KMT2D in a BCL2-driven lymphoma model. Moreover, we see that loss of SETD1B confers resistance apoptosis induction by BCL2 and MCL-1 inhibitors.
Mechanistically, SETD1B loss complements loss of KMT2D in part through the loss of cell death programs and thereby reduces the reliance on the antiapoptotic BCL2 protein. Briefly, SETD1B deficiency produces overlapping and additional effects compared with KMT2D deficiency. Specifically, we and others have previously characterized the consequences of KMT2D mutations in lymphoma, observing the activation of B cell receptor signaling, NF-κB, and JAK-STAT pathways due to the loss of expression of key regulators of these pathways (Ortega-Molina et al., 2015; Zhang et al., 2015). With regards to SETD1B, we identified similar effects on IFN-, interleukin-, and JAK kinase-induced expression programs and distinct additional effects on cell death triggers such as BIK, BIM, NOXA, and other TP53 targets and cell death–related genes.
The H3K4me3 mark catalyzed by SETD1B is especially sensitive to removal by KDM5 histone demethylases (Wang et al., 2023b). This suggests the possibility of offsetting the loss of SETD1B activity by inhibiting KDM5. Briefly, KDM5A was discovered as an RB binding protein (RBP2, Jarid1A) (Defeo-Jones et al., 1991; Fattaey et al., 1993) with demethylase activity against histone H3K4me3/m2 marks (Christensen et al., 2007; Iwase et al., 2007; Klose and Zhang, 2007; Secombe and Eisenman, 2007). Overexpression of KDM5A has oncogenic activity in solid tumors (Cao et al., 2014; Teng et al., 2013; Wang et al., 2009). Notably, KDM5A has been linked to a drug-tolerant persister phenotype in solid tumor cells (Sharma et al., 2010). These observations mirror our results on the loss of SETD1B in lymphomagenesis and indifference to BCL2/MCL1 inhibition. Newly developed KDM5 inhibitors offer the potential to target the histone H3K4me3 mark (Harmeyer et al., 2017; Tumber et al., 2017; Vinogradova et al., 2016). For example, the compound JQKD82 shows promising activity in multiple myeloma (Ohguchi et al., 2021), and KDM5-inh1 shows activity against KMT2D mutant lymphomas (Heward et al., 2021). We observed that KDM5 inhibition restores BIM and BIK expression, leading to synergistic drug effects with Venetoclax in SETD1B mutant lymphomas both in vitro and in vivo, without apparent toxicity. This indicates a potential combination therapy to increase Venetoclax efficacy in certain lymphomas as part of a strategy to overcome drug-tolerant persister cells (Sharma et al., 2010).
In this study, we employed the vavP-Bcl2 mouse model of FL and a method of adoptive transfer of retrovirally transduced hematopoietic stem cells (Egle et al., 2004; Oricchio et al., 2011). The model has clear benefits and enables tractable genetic studies into lymphomagenesis and treatment responses (Boice et al., 2016; Oricchio et al., 2011; Ortega-Molina et al., 2015; Parsa et al., 2020). However, we need to be mindful that in this model BCL2 is broadly expressed across hematopoietic lineages derived from the transplanted hematopoietic cells and that the kinetics of lymphoma development are accelerated compared with the human disease. Despite this limitation, young VavP-Bcl2 mice manifest spontaneous, antigen-independent GC hyperplasia and progressively develop B cell lymphomas that recapitulate key aspects of human FL pathology and even show spontaneous mutations that resemble those seen in patients (e.g., KMT2D) (Ortega-Molina et al., 2015).
Materials and methods
Cell culture
Phoenix-GP (CRL-3215; American Type Culture Collection [ATCC]) and HEK293T (CRL-3216; ATCC) cell lines were purchased from ATCC and cultured according to the instructions from ATCC. OCI-LY3, OCI-LY8, OCI-LY19, SU-DHL-4, SU-DHL-6, SU-DHL-8, SU-DHL-10, DoHH2, JVM-2, TMD8, Daudi, U2973, and JeKo-1 cells were maintained in RPMI 1640 with 10% FBS, supplemented with L-glutamine, HEPES, and penicillin/streptomycin. Cell lines were authenticated by the short tandem repeat analysis and cell lines were tested for mycoplasma contamination.
Genome-wide CRISPR screening
Genome-wide CRISPR screening was performed with Human Genome-wide CRISPR Knockout Pooled Library (GeCKO v2) (#1000000049; Addgene). OCI-LY19 cells are first transduced with lentivirus expressing Cas9 and then with genome-wide library. The library transduction efficiency was kept to ∼25% and screening was conducted at ∼200× library coverage. The screen was done in triplicate with each replicate independently transduced with the sgRNA library. After 3 days of selection with puromycin, transduced cells are treated with either Venetoclax (100 nM) or S63845 (1 μM) for 3 days and recovered for 3–5 days. After three cycles of treatment and recovery, genomic DNA was isolated from surviving cells, and the sgRNA region was amplified using the following primer pair: F: 5′-TCTTGTGGAAAGGACGAAACACCG-3′ and R: 5′-GTTACGCCAAGCTTAAAAAAGCACCG-3′. The gel-purified amplicon was subjected to deep sequencing. After PicoGreen quantitation and quality control by Agilent BioAnalyzer, sequencing libraries were prepared from amplicons with an average size of 191bp with an input of 100 ng using the KAPA Hyper Prep Kit (#KK8504; Kapa Biosystems) according to the manufacturer’s instructions with eight cycles of PCR. Equimolarly pooled barcoded libraries were then subjected to a 100bp/100bp paired-end run on a HiSeq 4000 using the HiSeq 3000/4000 SBS Kit (#FC-410-1001; Illumina). The average number of read pairs per sample was 15 million.
FASTQ files from screen experiments were processed using the MAGeCK software (v0.5.7b) to obtain sgRNA read counts from paired-end sequencing reads. Gene essentiality analysis was performed using the EdgeR R library (v3.24.2). Briefly, sgRNA counts for each sample were merged in R (v3.5.0) to create a matrix of sample/read counts, and sgRNAs with 0 counts in all samples were dropped from the data. Read counts were normalized using the trimmed mean of M-values method as described by the EdgeR authors. Individual sgRNAs were tested for enriched or depleted representation among treated samples compared with control using a likelihood-ratio test. Gene-wise statistics were calculated from the sgRNA-wise results for genes with at least three unique sgRNAs using a competitive gene set test, Camera, available in the limma R library (v3.38.3). Genes with EdgeR gene-level FDR < 0.05 were considered as significantly enriched genes and ranked by average Log2FCs (treated versus before treatment) of their sgRNAs.
Molecular cloning
sgRNAs were cloned into lentiGuide-Puro (#52963; Addgene) using the BsmBI enzyme as described in Sanjana et al. (2014). SETD1B: sgRNA1: 5′-ATCCTTGGCTCCCCGGACCG-3′; sgRNA2: 5′-GCTGTCGGTGCCCAAATTCA-3′; KMT2D: sgRNA: 5′-CCCCTATCCTAGTCCTACGG-3′; and LACZ: sgRNA: 5′-TGCGAATACGCCCACGCGAT-3′. sgRNA1 was used for all experiments involving the SETD1B gene unless stated otherwise.
Transfection of siRNA
Transfection of siRNA was carried out using the 4D Nucleofector (Lonza) following the manufacturer’s instructions. For each transfection, 4 × 10⁶ OCI-LY19; sgSETD1B cells were washed in PBS/0.5% BSA and resuspended in 100 μl nucleofector solution (Amaxa SF Cell Line 4D X Kit L; Lonza) with the appropriate siRNA (2–3 μM) added. Following nucleofection (program CV-104), cells were cultured in RPMI/10% FBS for 24 h before adding 50 nM of Venetoclax, 50 nM of JIB-04, or the combination of both drugs. SiRNAs were purchased from Thermofisher Scientific (#s195011 [BIM]; #s195011 [BIK]).
Animal studies
All mouse experiments were conducted in accordance with Memorial Sloan Kettering Cancer Center’s Institutional Animal Care and Use Committee–approved protocols. All mice were housed at the MSKCC animal facility, and the Research Animal Resource Center provided husbandry and clinical care. For adoptive transfer experiments, the VavP-Bcl2 mouse model of FL (Egle et al., 2004) was bred with Rosa26-Cas9 knock-in mice (Jackson lab, Stock Gt(ROSA)26Sortm1.1(CAG-cas9*,-EGFP)Fezh/J) (Platt et al., 2014). The progeny carrying both VavP-Bcl2 and Cas9 were used to isolate HPCs for the adoptive transfer approach using retroviral transduced HPCs with sgRNAs target Setd1b or Kmt2d. HPC isolation and transduction were performed as in Wendel et al. (2004). For OCI-Ly19 xenografts, ∼5 million cells in 50% Matrigel were subcutaneously transplanted into immunodeficient NSG mice. Tumor measurements were done periodically, and volumes were calculated using the formula 1/6*π*length*width2/1,000. Animals were randomized prior to treatments and tumor measurements were done in a blinded manner, i.e., the person injecting/measuring tumors did not know the experimental conditions. Unless otherwise stated, we used ≥ 5 age-matched (7–8 wk) female mice for all in vivo experiments (Jackson Laboratories).
Mouse B220+ tumor sample preparation
B220+ cells were purified from mouse lymphoma tumors by immunomagnetic enrichment with CD45R (B220) microbeads (Miltenyi Biotec).
Tumor clonality
PCR to evaluate Ig variable heavy chain rearrangements was performed on the complementary DNA of VavP-Bcl2 lymphoma cells with a set of forward primers that anneal to the framework region of the most abundantly used IgL variable region gene families and a reverse primer located in the Jλ1,3 gene segment (IgL-Vλ1: 5′-GCCATTTCCCCAGGCTGTTGTGACTCAGG-3′; IgL-Jλ1,3: 5′-ACTCACCTAGGACAGTCAGCTTGGTTCC-3′).
Somatic hypermutation
Somatic hypermutation analysis of B cells isolated from VavP-Bcl2; LacZ and VavP-Bcl2; Setd1b tumors was performed as described by Ortega-Molina et al. (2015). PCR conditions previously published (Ehlich et al., 1994). Amplification products were isolated from agarose gel and submitted to Sanger sequencing. Sequences were compared with reference and mutation rates were calculated using IMGT/V-QUEST37 and UCSC BLAT.
Cell proliferation assay and combination assay
Suspension cells were seeded in 24-well plates at 25,000 cells per 100 μl per well or in 24-well plates at 250,000 cells per 1 ml per well with either vehicle (DMSO 0.1%) or increasing concentrations of the compound for 72 h. Cell viability was assessed with CellTiter-Glo Luminescent assay (#G9683; Promega). About 80 μl of the cultured cells were transferred to opaque-white bottom 96-well plates and mixed with 20 μl of CellTiter-Glo reagent. The mixture was incubated for 30 min at room temperature and read using an EnSight Multimode plate reader (PerkinElmer) with Kaleido version 1.2. to collect luminescence. Data were normalized as percentage viability and graphed by nonlinear regression curves using GraphPad Prism 7 software. The combination index was determined using the CompuSyn v.1.0 software.
Flow cytometry analysis
Single-cell suspension was prepared from spleen of tumor-bearing mouse. Lymphocytes were isolated from the cell suspension of each genotype group by Fico/Lite-LM (mouse) (#140610; Atlanta Biologicals). The remaining red blood cells were removed from cell suspension by ACK lysing buffer (#A1049201; Thermo Fisher Scientific). Fc blocking was performed by purified rat anti-mouse CD16/CD32 (#553142; clone 2.4G2; BD Biosciences). Cells were stained with the following antibodies (1:100 dilution): APC-IgG1 (#560089; BD Biosciences), APC-CD19 (#550992; BD Biosciences); APC-IgM (#550676; BD Biosciences); APC-IgD (#560868; BD Biosciences); and APC-GL7 (#144618; BioLegend). Analysis was performed with a BD LSR Fortessa cell analyzer (BD Biosciences) and FlowJo software 10.4.1.
Immunohistochemistry
Mouse tissues (spleen, lymph nodes, and liver) were fixed overnight in 4% paraformaldehyde, embedded in paraffin blocks, and sectioned. Tissue sections were stained with hematoxylin and eosin (H&E) or with Ki-67, TUNEL, B220, PNA, and BCL6 following standard protocols at Histowiz, Inc (https://histowiz.com).
Western blotting
For immunoblotting, total lysates were prepared in radioimmunoprecipitation assay buffer supplemented with protease and phosphatase inhibitors, treated with benzonase, separated on 4–12% Tris-acrylamide gels (#NP0321BOX; Invitrogen), and transferred to a nitrocellulose membrane. Proteins were visualized using LI-COR or enhanced chemiluminescence detection after incubation with goat anti-rabbit-IR800 (#926–3221; LI-COR or goat anti-mouse-IR680 (#926–68070; LI-COR). All antibody incubations were done in PBS blocking buffer (#927-70001; LI-COR). Membranes were probed with the indicated primary antibodies (1:1,000 dilution): BIK (#4592S; Cell Signaling Technology [CST]), MCL-1 (#4572S; CST), BCL-2 (#4223S; CST), SETD1B (#A302-281A; Bethyl Laboratories), H3K4me1 (#ab8895; Abcam), H3K4me2 (#Ab32356; Abcam), H3K4me3 (#ab8580; Abcam), H3 (#4499; CST), and β-actin (#5316; Sigma-Aldrich).
Validation of SETD1B targets by quantitative real-time PCR (qRT-PCR) analyses
Total cell RNA was extracted using TRIZOL (#15596026; Invitrogen). Reverse transcription was performed using random primers and SuperScript III First-Strand (#18080-400; Invitrogen). qRT-PCR was performed in triplicates using TaqMan Universal Master Mix (#4304437; Applied Biosystems) in a 7900 HT Fast Real-Time thermocycler (Applied Biosystems). The housekeeping gene used for input normalization of all the qRT-PCR data is β-actin. TaqMan Gene Expression Assays used was BIK (Hs00154189_m1).
Cell death assay (Annexin V assay)
OCI-LY19 cells were treated with Venetoclax (2.5 µM) or control DMSO for 6 h and stained with APC-Annexin V and 7-aminoactinomycin D (#640930; BioLegend) as recommended by the manufacturer. Samples were analyzed by LSR Fortessa Cell Analyzer (BD Biosciences) and FlowJo software.
Detection of cytochrome c release
Cytochrome c release was measured using the iBH3 profiling assay previously described in Ryan et al. (2016). About 2 × 10⁵ cells/ml were resuspended in MEB buffer (150 nM Mannitol, 10 mM HEPES, 150 mM potassium chloride, 1 mM EGTA, 1 mM EDTA, 0.1% BSA, 5 mM succinate, and 2.5 g/l of Polaxamer 188 in distilled water at pH 7.5). Cell suspension (50 μl) was added to 50 μl of MEB buffer containing 0.002% digitonin with or without Venetoclax for 60 min at 25 ± 3 °C. After incubation, cells were fixed with 4% formaldehyde for 10 min and then neutralized with N2 buffer (1.7 M Tris base, 1.25 M Glycine, pH 9.1). Cells were stained with Alexa Fluor 488 anti-cytochrome c (#612308; BioLegend) or Alexa Fluor 647 anti-cytochrome c (#612310; BioLegend) to quantify the remaining intracellular cytochrome c. After incubation, stained cells were analyzed on a BD LSRFortessa cell analyzer, and FlowJo, LCC, 10.8 was used for data analysis. The percentage of mitochondrial depolarization was calculated using the normalized median fluorescence intensity (MFI) using DMSO as negative release control and Alamethicin as positive release control (100% depolarization). The following equation was used to calculate the percentage depolarization for each condition: % cytochrome c loss = 1 − [(MFIpeptide/sample) − (MFIPos Ctrl)]/[(MFINeg Ctrl) − (MFIPos Ctrl)].
RNA-seq library preparation and sequencing analysis
RNA size, concentration, and integrity were verified using a 2100 Bioanalyzer Instrument (Agilent Technologies). RNA-seq libraries were prepared with the Illumina TruSeq Stranded mRNA sample kits according to the manufacturer’s protocol. Libraries were validated using the 2100 Bioanalyzer Instrument and the Quant-iT dsDNA HS Assay Kit (Q33120; Thermo Fisher Scientific). The Casava v.1.8 software (Illumina) was used for base calling. After trimming the adaptor sequences using Trimmomatic, the RNA-seq reads were mapped to the Homo sapiens (hg38) genome assembly using HISAT2 (Kim et al., 2019). The sequencing reads were assigned to genes by featureCounts in Rsubread package in Bioconductor. Differentially expressed mRNAs between SETD1B knockout and control were identified, and FDR (Benjamini–Hochberg) was estimated, using DEseq2 (Love et al., 2014). The genes with FDR < 5% and log2FC > 0.5 were significantly differentially expressed.
Gene set enrichment analysis (GSEA)
GSEA analysis was performed using the Fgsea Bioconductor package and GSEA software. The input file included log2FCs of gene expression (sgSETD1B versus sgLacZ [control]). The Kyoto Encyclopedia of Genes and Genomes and hallmark gene sets from MSigDB were used for the analysis.
ChIP-seq library preparation and sequencing analysis
ChIP-seq library preparation and sequencing analysis were performed as described previously (Ortega-Molina et al., 2015). Briefly, 3−5 × 10⁷ cells were crosslinked with 1% paraformaldehyde at room temperature for 15 min and sonicated to generate chromatin fragments of 200–600 bp. Fragmented chromatin was then immunoprecipitated overnight with 1 μg of H3K4me3 antibody (#ab8580; Abcam) incubated overnight at 4°C. Enriched DNA was isolated by Dynabeads Protein A (#10001D; Thermo Fisher Scientific) and subsequent reverse cross-linking and purification. ChIP-seq libraries were prepared from 1 to 5 ng ChIP DNA according to the instructions of the TruSeq ChIP Library Preparation Kit (#IP-202-1012; Illumina). Libraries were then sequenced on a HiSeq 2500 System as 50-bp single-end runs. The ChIP-seq reads were aligned to Homo sapiens (hg38) using Bowtie2 with default parameters, following adapter trimming by Trimmomatic. Further analysis was conducted using only high-quality and uniquely mapped reads, with a mapping quality threshold of ≥20. Peak calling for ChIP-seq reads was performed against Input reads using the Genrich peak caller (available at https://github.com/jsh58/Genrich), which considered replicate consistency. Peak annotation was done using the HOMER package (Heinz et al., 2010). To identify differentially enriched H3K4me3 peaks between the SETD1B knockout and control samples, the DESeq2 R package was employed.
Mutation analysis in lymphoma patients
SETD1A, SETD1B, KMT2A-D, and TP53 gene mutations were analyzed from MSKCC targeted genomic database of either Foundation One Heme or MSK-IMPACT as well as publicly available sequencing data sets (references in Fig. S2 study of origin) using cBioPortal (https://www.cbioportal.org). Briefly, these datasets were queried by the gene named and analysis was performed as described in Cerami et al. (2012); Gao et al. (2013).
Statistics
Statistical tests were Student’s t test, two tails, type one. Specific statistical parameters and analysis are stated in corresponding figure legends for each panel of data. Analyses were carried out within the programs GraphPad Prism 10 and the R statistical environment. Tests resulting in P values <0.05 were deemed significant. Error bars reflect the standard error of the mean (SEM), or standard deviations (SD) as stated in the respective legends.
Online supplemental material
Fig. S1 shows additional validation of CRISPR-Cas9 screenings. Fig. S2 shows the characterization of SETD1B and KMT2D mutations in different cohorts of FL and DLBCL. Fig. S3 shows additional molecular and histological characterization of the VavP-BCL2 model. Fig. S4 shows RNA-seq data in a KMT2Dwt cell line (OCI-LY8) and additional ChIP-seq analysis. Fig. S5 shows the effect of JIB-04 treatment in different lymphoma cell lines and the involvement of protein BIK and BIM in the response to Venetoclax and JIB-04 treatment. Table S1 shows CRISPR screening results for Venetoclax treatment in OCI-LY19 cells. Table S2 shows CRISPR screening results for S63845 treatment in OCI-LY19 cells. Table S3 lists mutations of the KMT2-family in human FL and DLBCL. Table S4 shows RNA-seq results in OCI-LY19 isogenic cell lines. Table S5 shows RNA-seq results in OCI-LY8 isogenic cell lines. Table S6 shows pathway analysis in OCI-LY19 cells. Table S7 shows pathway analysis in OCI-LY8 isogenic cell lines. Table S8 shows H3K4me3 peaks determined by ChIP-seq in OCI-LY19 cells.
Data availability
The raw and processed data from the RNA-seq and ChIP-seq experiment have been deposited to the Gene Expression Omnibus archive under the accession codes: GSE273152, GSE273153 and GSE273154. Any additional information required to reanalyze the data reported in this article is available from the lead contact upon request.
Acknowledgments
We express gratitude to J.H. Schatz for cell line authentication and extend our appreciation to all members of the Wendel group for their insightful discussions related to this study. Our thanks also go to N. Mohibullah and members of MSKCC’s Integrated Genomics Operation core and Rui Gardner and members of MSKCC’s Flow Cytometry core.
J. Wen is supported by Australian Research Council Centre of Excellence for the Mathematical Analysis of Cellular Systems (CE230100001). E. de Stanchina is funded by National Institutes of Health P30 CA008748. A.M. Melnick is funded by National Institutes of Health R35 CA220499, P01 CA229086, R01 CA266279, Leukemia and Lymphoma Society Specialized Center of Research (LLS SCOR 7021-20, LLS SCOR 7027-23, LLS SCOR 7029-23), the Sam Waxman Foundation, The Chemotherapy Foundation, and an Institute for Follicular Lymphoma Innovation collaborative research award. This work received partial support from the National Institutes of Health (P50 CA217694) granted to H.-G. Wendel, MSKCC Core grant (P30 CA008748) to H.-G. Wendel, National Cancer Institute Outstanding Investigator grant to H.-G. Wendel (R35 CA252982), Lymphoma Research Foundation funding to H.-G. Wendel, Geoffrey Beene Cancer Research Center, Starr Cancer Consortium I10-0064 to H.-G. Wendel, the Follicular Lymphoma Foundation to H.-G. Wendel, and Astrazeneca (SK2021-1271) to H.-G. Wendel.
Author contributions: A. Portelinha: Conceptualization, Data curation, Formal analysis, Investigation, Methodology, Project administration, Supervision, Validation, Visualization, Writing—original draft, Writing—review & editing, S. Wang: Conceptualization, Data curation, Formal analysis, Investigation, Methodology, Project administration, Resources, Supervision, Validation, Visualization, Writing—original draft, Writing—review & editing, S. Parsa: Conceptualization, Data curation, Formal analysis, Investigation, Validation, Visualization, Writing—original draft, Writing—review & editing, M. Jiang: Investigation, A.N. Gorelick: Formal analysis, S. Mohanty: Data curation, Formal analysis, Writing—review & editing, S. Sharma: Formal analysis, E. de Stanchina: Methodology, Project administration, M. Berishaj: Investigation, Resources, C. Zhao: Investigation, J. Heward: Investigation, N.K. Aryal: Conceptualization, Supervision, Writing—review & editing, O. Tavana: Conceptualization, Funding acquisition, Writing—review & editing, J. Wen: Formal analysis, J. Fitzgibbon: Writing—review & editing, A. Dogan: Investigation, A. Younes: Funding acquisition, Resources, Writing—review & editing, A. Melnick: Conceptualization, Formal analysis, Investigation, Supervision, Writing—review & editing, H.-G. Wendel: Conceptualization, Data curation, Formal analysis, Funding acquisition, Project administration, Supervision, Writing—original draft, Writing—review & editing.

