


Effector regulatory T cells (eTregs) exhibit distinct homeostatic properties and superior suppressor capacities pivotal for controlling immune responses mediated by their conventional T cell counterpart. While the role of microRNAs (miRNAs) in Tregs has been well-established, how miRNAs regulate eTregs remains poorly understood. Here, we demonstrate that miR-15/16 clusters act as key regulators in limiting eTreg responses. Loss of miR-15/16 clusters leads to increased eTreg frequencies with enhanced suppressor function. Consequently, mice with Treg-specific ablation of miR-15/16 clusters display attenuated immune responses during neuroinflammation and upon both infectious and non-infectious challenges. Mechanistically, miR-15/16 clusters exert their regulatory effect in part through repressing IRF4, a transcription factor essential for eTreg differentiation and function. Moreover, miR-15/16 clusters also directly target neuritin, an IRF4-dependent molecule, known for its role in Treg-mediated regulation of plasma cell responses. Together, we identify an miRNA family that controls an important Treg subset and further demonstrate that eTreg responses are tightly regulated at both transcriptional and posttranscriptional levels.
Introduction
Upon activation in the periphery, naïve T cells differentiate into effector T cells (Teffs) that produce a variety of cytokines and effector molecules to orchestrate protective immune responses against a wide range of microbial invaders. Similarly, regulatory T cells (Tregs) have also been shown to be capable of differentiating into effector Tregs (eTregs) to prevent excessive and prolonged inflammation caused by their analogous Teff counterpart (Teh et al., 2015). Compared with the majority of Tregs identified in the secondary lymphoid tissue, these eTregs express significantly less CD25, a subunit of the high-affinity IL-2 receptor, and do not rely on IL-2 for their survival and homeostasis. Instead, an elevated level of costimulatory receptor ICOS is detected on eTregs, and continued ICOS signaling is essential for their maintenance (Smigiel et al., 2014). Besides ICOS, increased expressions of IL-10 and many other functionally important molecules such as CTLA4 and TIGIT were also found in eTregs, allowing them to exhibit enhanced suppressor activities to properly control Teff responses (Cretney et al., 2011; Dias et al., 2017; Joller et al., 2014).
To date, many transcription factors have been found to play a dominant role in regulating eTreg differentiation. Among them, IRF4 was identified to function as a key transcription factor required for the differentiation of all eTreg populations (Cretney et al., 2011). Expression of IRF4 in Tregs was previously shown to be dependent on TCR signaling (Levine et al., 2014). Deletion of IRF4 leads to severe defects in eTreg development and function, with even a partial loss of IRF4 expression downstream of TCR engagement in Tregs sufficiently impairing them. One of the major functions of IRF4 in controlling eTreg biology is to drive the expression of Blimp1. While Blimp-1 plays an expendable role in eTreg differentiation, it is required for the expression of IL-10 and ICOS in eTregs (Cretney et al., 2011). In addition to Blimp-1, recently, it was demonstrated that JunB, an AP-1 transcription factor, is a critical regulator of the IRF4-dependent eTreg program. Through facilitating the accumulation of IRF4 at IRF4 target sites, JunB was shown to promote the expression of a subset of eTreg molecules such as ICOS and CTLA4 (Koizumi et al., 2018). Besides IRF4, Myb has also been shown to be another key transcription factor that is crucial in regulating eTreg biology. Treg-specific Myb ablation results in a significantly reduced eTreg population accompanied with the development of fatal immune pathology (Dias et al., 2017). Mechanistically, it was suggested that Myb directly regulates the expression of a substantial portion of the eTreg gene program required for its survival and proliferation. Interestingly, while IRF4 is indispensable for eTreg differentiation from both thymus-derived and peripherally induced Treg origins, Myb was shown to be selectively required for the differentiation of thymus-derived eTregs (Dias et al., 2017).
Despite the aforementioned research effort, our understanding of the molecular mechanisms that govern eTreg differentiation and function beyond transcriptional regulation remains limited. Previously, we and others have demonstrated that microRNAs (miRNAs), a class of short regulatory noncoding RNAs, control many aspects of Treg biology (Anandagoda et al., 2019; Cruz et al., 2017; Huang et al., 2009; Liston et al., 2008a; Lu et al., 2010; Lu et al., 2009; Wang et al., 2022). However, while the role of miRNAs in Teff differentiation and function is well-documented (Cho et al., 2021), whether or not miRNAs regulate eTreg responses has been poorly studied. Here, we demonstrate that miR-15/16 clusters, an miRNA family that is highly expressed in Tregs, act as key regulators in limiting eTreg differentiation and function. Loss of miR-15/16 clusters does not impact thymic Treg development but instead results in a selective increase of Tregs with eTreg phenotype and enhanced suppressor activities. Consequently, mice with Treg-specific ablation of this miRNA family displayed attenuated disease phenotype during autoimmune neuroinflammation and exhibited impaired humoral immune responses upon both infectious and non-infectious challenges. Subsequent experiments revealed that miR-15/16 clusters exert their regulatory effect on eTreg differentiation program at least in part by targeting IRF4. Moreover, miR-15/16 clusters also directly target neuritin, an IRF4-dependent molecule, which is known for its role in Treg-mediated regulation of plasma cell (PC) responses (Gonzalez-Figueroa et al., 2021). Collectively, our study demonstrates that miR-15/16 clusters play a pivotal role in controlling eTreg biology and that eTreg responses are tightly regulated at both transcriptional and posttranscriptional levels.
Results and discussion
Elevated expressions of miR-15b/16-2 cluster in Tregs are Foxp3 independent but partially driven by IL-2 signaling
In the past 15 yr, many research efforts focused on specific miRNAs that are important in regulating Treg differentiation and function (Cho et al., 2021). However, none of the miRNAs studied thus far can fully account for the complexity and the severity of the phenotypes in mice harboring Tregs devoid of the entire miRNA network (Chong et al., 2008; Liston et al., 2008a; Zhou et al., 2008), suggesting the presence of unidentified miRNAs that control other important features of Treg biology. Previously, an miRNA profiling study across different lymphocytes demonstrated that compared with other T cell subsets, miR-15b and miR-16, members of the same miRNA family, are predominantly expressed in Tregs isolated from the secondary lymphoid tissue (Kuchen et al., 2010). Consistent with this early work, we also detected higher levels of miR-15b and miR-16 in Tregs isolated from the spleen (Fig. 1 A). Moreover, elevated levels of the miR-15b/16 cluster, but not its paralog, miR-15a, could already be detected in Foxp3+ CD4+ single-positive (CD4SP) thymocytes compared with their Foxp3− counterpart (Fig. 1 B). Given the pivotal role of Foxp3 in orchestrating the Treg genomic program, we first sought to examine whether elevated expression of the miR-15b/16 cluster in Tregs is dependent on Foxp3, similar to many other miRNAs that were found to be prevalent in Tregs (Cobb et al., 2006; Lu et al., 2009). To this end, we isolated Foxp3+ Tregs and Tregs expressing a Foxp3 reporter null allele from the thymus of heterozygous Foxp3YFPCre/WT and Foxp3GPF-null/WT females (which harbor a WT Treg population caused by X chromosome inactivation to prevent the potential development of autoimmunity; Gavin et al., 2007), respectively. As shown in Fig. 1 C, compared with the Foxp3− counterpart, similarly elevated levels of miR-15b expression were detected in Tregs and Treg “wannabes,” which are incapable of expressing functional Foxp3 proteins, indicating that the miR-15b/16 cluster is upregulated in thymic Tregs in a Foxp3-independent manner. Further analysis of different CD4SP subsets revealed no alteration in the expression of miR-15b between Foxp3−CD25− CD4SP and Foxp3−CD25hi CD4SP populations, despite the latter containing the majority of Treg precursors (Lio and Hsieh, 2008; Fig. 1 D). These results suggested that while Foxp3 plays an expendable role in miR-15b/16 induction, elevated expression of this miRNA cluster could only be found after Treg commitment. Previously, it has been shown that Treg precursors exist at a developmental stage where they only require stimulation by IL-2 to become fully committed Foxp3+ Tregs. Therefore, we sought to determine whether IL-2 signaling alone is also capable of driving the expression of the miR-15b/16 cluster. As shown in Fig. 1 E, we first confirmed the previous finding where Foxp3 expression in the Foxp3−CD25hi CD4SP populations could be observed during 24-h short-term IL-2 culture in the absence of TCR stimulation. At the same time, accompanied by Foxp3 induction, we could also detect increased levels of miR-15b and miR-16 (Fig. 1, E–G). On the other hand, consistent with the aforementioned finding of a lack of miR-15a induction in thymic Tregs, miR-15a expression did not seem to be impacted by IL-2 stimulation (Fig. 1 H). Collectively, these results suggest that upregulation of the miR-15b/16 cluster in Tregs during thymic development is independent of Foxp3 but at least in part driven by IL-2 stimulation.

miR-15/16 family regulates peripheral Treg homeostasis. (A) qPCR analyses for the expressions of miR-15b and miR-16 in Tconvs and Tregs isolated from spleen. (B) qPCR analyses for the expressions of miR-15b, miR-16, and miR-15a in Foxp3− and Foxp3+ CD4SP thymocytes. (C) qPCR analyses for the expressions of miR-15b in Foxp3− and Foxp3+ CD4SP thymocytes isolated from Foxp3YFPCre/WT and Foxp3GPF-null/WT heterozygous females. (D) qPCR analyses for the expressions of miR-15b in Foxp3−CD25−, Foxp3−CD25+, and Foxp3+ CD4SP thymocytes. (E–H) qPCR analyses for the expressions of (E) Foxp3, (F) miR-15b, (G) miR-16, and (H) miR-15a in Foxp3−CD25+ CD4SP thymocytes cultured with or without IL-2 for 24 h. (I) Flow cytometry analysis, frequencies, and numbers of Foxp3+ Tregs in thymus and spleen of Treg-DKO mice and WT littermates (∼8–12 wk). (J) Flow cytometry analysis of Foxp3+ Tregs in thymus of T-DKO mice and WT littermates (∼8–12 wk). Comparison of fold changes (on the basis of corresponding WT controls) of Treg frequencies and numbers in thymus between T-DKO and Treg-DKO mice. (K) qPCR analyses for the expressions of miR-15b and miR-16 in CD73− Foxp3− and CD73− Foxp3+ CD4SP thymocytes. (L) Flow cytometry analysis and frequencies of CD73+ and CD73− Foxp3+ Tregs in thymus of T-DKO mice and WT littermates (∼8–12 wk). Each symbol represents an individual mouse, and the bar represents the mean. Data are pooled from at least two independent experiments. Results of two-tailed Student’s t test (or one-way ANOVA for studies with more than two groups): n.s., not significant; *, P < 0.05; **, P < 0.01; ***, P < 0.001.
miR-15/16 family regulates peripheral Treg homeostasis. (A) qPCR analyses for the expressions of miR-15b and miR-16 in Tconvs and Tregs isolated from spleen. (B) qPCR analyses for the expressions of miR-15b, miR-16, and miR-15a in Foxp3− and Foxp3+ CD4SP thymocytes. (C) qPCR analyses for the expressions of miR-15b in Foxp3− and Foxp3+ CD4SP thymocytes isolated from Foxp3YFPCre/WT and Foxp3GPF-null/WT heterozygous females. (D) qPCR analyses for the expressions of miR-15b in Foxp3−CD25−, Foxp3−CD25+, and Foxp3+ CD4SP thymocytes. (E–H) qPCR analyses for the expressions of (E) Foxp3, (F) miR-15b, (G) miR-16, and (H) miR-15a in Foxp3−CD25+ CD4SP thymocytes cultured with or without IL-2 for 24 h. (I) Flow cytometry analysis, frequencies, and numbers of Foxp3+ Tregs in thymus and spleen of Treg-DKO mice and WT littermates (∼8–12 wk). (J) Flow cytometry analysis of Foxp3+ Tregs in thymus of T-DKO mice and WT littermates (∼8–12 wk). Comparison of fold changes (on the basis of corresponding WT controls) of Treg frequencies and numbers in thymus between T-DKO and Treg-DKO mice. (K) qPCR analyses for the expressions of miR-15b and miR-16 in CD73− Foxp3− and CD73− Foxp3+ CD4SP thymocytes. (L) Flow cytometry analysis and frequencies of CD73+ and CD73− Foxp3+ Tregs in thymus of T-DKO mice and WT littermates (∼8–12 wk). Each symbol represents an individual mouse, and the bar represents the mean. Data are pooled from at least two independent experiments. Results of two-tailed Student’s t test (or one-way ANOVA for studies with more than two groups): n.s., not significant; *, P < 0.05; **, P < 0.01; ***, P < 0.001.
Deletion of miR-15/16 clusters did not impact thymic Treg development but led to increased Treg frequencies and numbers in the periphery
To examine the potential role of the miR-15b/16 cluster in controlling Treg biology, we first generated mice with Treg-specific deletion of the miR-15b/16 cluster (Treg-bKO) by crossing miR-15b/16 floxed mice (miR15b/16fl) with Foxp3YFPCre mice. Interestingly, despite its elevated expression in Tregs, deletion of this miRNA cluster did not result in any appreciable phenotypes except a small but significant increase in Treg frequencies in the thymus (Fig. S1 A and data not shown). This modest phenotype is not likely due to an incomplete deletion of the miR-15b/16 cluster but rather a seemingly compensatory increase in miR-15a/16 expression (Fig. S1 B). As miR-15b/16 and miR-15a/16 share the same seed sequences, these miRNA prologs likely regulate the same set of targets. Therefore, to directly address this issue and to further study the biological role of the miR-15/16 family in Tregs, we generated mice harboring Tregs devoid of both clusters (Foxp3YFPCremiR15a/16fl/flmiR15a/16fl/fl; Treg-DKO). As depicted in Fig. 1 I, compared with their littermate controls, not only could we detect a clear increase in the thymic Treg population, but Treg-DKO mice also harbor significantly elevated Treg frequencies and numbers in the periphery. We next sought to determine whether miR-15/16 clusters could be involved in limiting thymic Treg differentiation even though we demonstrated that this miRNA family is not expressed at a high level before Treg commitment. To this end, we characterized mice with T cell–specific ablation of both miR-15a/16 and miR-15b/16 clusters (T-DKO mice). Due to the fact that both CD4-Cre transgene and the miR-15b/16 cluster are located in the same chromosome (i.e., Chr 3), mice expressing CRE recombinase driven by Lck promoter were used (Hennet et al., 1995). As shown in Fig. S1 C, we were able to obtain a complete deletion of both miR-15/16 clusters in isolated CD4SP thymocytes despite the fact that the gene-targeting efficiency using this LCKCre mouse line has been reported to be less optimal in the CD4+ T cell compartment. Next, by analyzing and comparing the frequencies and absolute numbers of Tregs in T-DKO and Treg-DKO mice, we found that deletion of this miRNA family prior to or after Treg commitment resulted in comparable increases in Treg frequencies and numbers (Fig. 1 J). Consistently, even though we were still able to detect elevated levels of miR-15b and miR-16 in CD73− nascent thymic Tregs (Owen et al., 2019; Fig. 1 K), when mature CD73+ recirculating Tregs were excluded from the total thymic Treg population, elevated Treg frequencies in T-DKO mice could no longer be found (Fig. 1 L). Together, our results demonstrate that rather than regulating thymic Treg development, miR-15/16 clusters control Treg homeostasis in the periphery.

Increased expression of the miR-15a/16 cluster in the absence of the miR-15b/16 cluster. (A) Flow cytometry analysis, frequencies, and numbers of Foxp3+ Tregs in thymus and spleen of Treg-bKO mice and WT littermates (∼8–12 wk). (B) qPCR analyses for the expressions of miR-15b, miR-16, and miR-15a in Foxp3+ CD4SP thymocytes isolated from Treg-bKO mice and WT littermates (∼8–12 wk). (C) qPCR analyses for the expressions of miR-15b, miR-16, and miR-15a in Foxp3+ CD4SP thymocytes isolated from T-DKO mice and WT littermates (∼8–12 wk). Each symbol represents an individual mouse, and the bar represents the mean. Data are pooled from at least three independent experiments. Results of two-tailed Student’s t test: **, P < 0.01; ***, P < 0.001.
Increased expression of the miR-15a/16 cluster in the absence of the miR-15b/16 cluster. (A) Flow cytometry analysis, frequencies, and numbers of Foxp3+ Tregs in thymus and spleen of Treg-bKO mice and WT littermates (∼8–12 wk). (B) qPCR analyses for the expressions of miR-15b, miR-16, and miR-15a in Foxp3+ CD4SP thymocytes isolated from Treg-bKO mice and WT littermates (∼8–12 wk). (C) qPCR analyses for the expressions of miR-15b, miR-16, and miR-15a in Foxp3+ CD4SP thymocytes isolated from T-DKO mice and WT littermates (∼8–12 wk). Each symbol represents an individual mouse, and the bar represents the mean. Data are pooled from at least three independent experiments. Results of two-tailed Student’s t test: **, P < 0.01; ***, P < 0.001.
Loss of miR-15/16 clusters in Tregs resulted in a selective increase of Tregs with eTreg phenotype and enhanced suppressor activities
Next, through further characterization of Tregs from Treg-DKO mice, we sought to investigate how the loss of miR-15/16 clusters could influence Tregs in the periphery beyond increasing numbers. To this end, as shown in Fig. 2 A, we found that elevated Treg numbers detected in Treg-DKO mice were the result of an increased CD25lo subset while the CD25hi subset was unaltered regardless of the presence or absence of miR-15/16 clusters. Moreover, while the amount of Foxp3 expression in the CD25lo subset seemed to be slightly lower compared with the CD25hi population, similar levels of Foxp3 expression were observed between Treg-DKO mice and their control littermates in both Treg subsets, suggesting that miR-15/16 clusters are not required to maintain Foxp3 expression and Treg stability (Fig. 2 B). Interestingly, despite an increase in CD25lo Tregs in Treg-DKO mice, compared with their WT counterparts, they did not exhibit higher proliferative activity or enhanced survival potential based on the expression of cell cycle–associated antigen Ki67 and prosurvival factor Bcl-2, respectively (Fig. 2, C and D). On the other hand, we observed higher Ki67+ frequencies in CD25hi Tregs (Fig. 2 C). As discussed above, it has been previously shown that upon eTreg differentiation, they express significantly less CD25 and do not rely on IL-2 for their survival and homeostasis (Smigiel et al., 2014). Moreover, eTregs were reported to express considerably more Ki67 but much lower levels of Bcl-2. These phenotypes were also observed in our analysis of CD25lo Tregs compared with CD25hi Tregs (Fig. 2, C and D). It is thus possible that miR-15/16 clusters play a negative role in eTreg differentiation and that deletion of this miRNA family resulted in increased CD25lo eTregs conversion from CD25hi Tregs that were recently generated and migrated out of the thymus. To this end, it has been previously shown that Tregs emerge from the thymus expressing low levels of CD44 and high levels of CD62L. These so-called central Tregs (cTregs) are then capable of differentiating into CD44hiCD62Llo eTregs in the periphery (Smigiel et al., 2014). Consistent with the proposed role of miR-15/16 clusters in restricting eTreg differentiation, we could also observe increased frequencies and numbers of CD44hiCD62Llo eTregs accompanied with decreased CD44loCD62Lhi cTregs in both lymphoid (e.g., spleen) and non-lymphoid tissues (e.g., lung) from Treg-DKO mice (Fig. 2, E and F). It is noteworthy that elevated frequencies of CD25lo Tregs were found in both miR-15/16–deficient CD44loCD62Lhi cTreg and CD44hiCD62Llo eTreg populations (Fig. S2), suggesting that loss of the miR-15/16 family could lead to enhanced eTreg differentiation even in Tregs exhibiting certain features of the cTreg phenotype. In agreement with this notion, compared with those in the control animals, we also detected significantly higher expression of ICOS, another key eTreg molecule that is critical for their maintenance (Smigiel et al., 2014), in all Tregs devoid of miR-15/16 clusters, regardless of the level of CD25 expression (Fig. 2 G). Together, these results suggested that the miR-15/16 family likely limits the eTreg differentiation program at a relatively early stage.

Loss of miR-15/16 clusters in Tregs resulted in a selective increase of Tregs with eTreg phenotype and enhanced suppressor activities. (A) Flow cytometry analysis and frequencies of CD25hi vs. CD25lo Foxp3+ Tregs in the spleen of Treg-DKO mice and WT littermates (∼8–12 wk). (B–D) Geometric mean fluorescence intensity (gMFI) of Foxp3, (C) frequencies of Ki67+, and (D) gMFI of Bcl-2 in CD25hi vs. CD25lo Foxp3+ Tregs in the spleen of Treg-DKO mice and WT littermates. (E and F) Flow cytometry analysis, frequencies, and numbers of CD44hiCD62Llo Tregs in (E) spleen and (F) lung of Treg-DKO mice and WT littermates. (G) Flow cytometry analysis and frequencies of ICOS+ in CD25hi vs. CD25lo Foxp3+ Tregs in the spleen of Treg-DKO mice and WT littermates. Each symbol represents an individual mouse, and the bar represents the mean. Data are pooled from at least three independent experiments. (H) Percents of suppression of proliferation of WT Teffs by Tregs isolated from either WT or Treg-DKO mice in an in vitro suppression assay. Data are representative of three independent experiments. n = 6. Results of two-tailed Student’s t test: n.s., not significant; *, P < 0.05; **, P < 0.01; ***, P < 0.001; ****, P < 0.0001.
Loss of miR-15/16 clusters in Tregs resulted in a selective increase of Tregs with eTreg phenotype and enhanced suppressor activities. (A) Flow cytometry analysis and frequencies of CD25hi vs. CD25lo Foxp3+ Tregs in the spleen of Treg-DKO mice and WT littermates (∼8–12 wk). (B–D) Geometric mean fluorescence intensity (gMFI) of Foxp3, (C) frequencies of Ki67+, and (D) gMFI of Bcl-2 in CD25hi vs. CD25lo Foxp3+ Tregs in the spleen of Treg-DKO mice and WT littermates. (E and F) Flow cytometry analysis, frequencies, and numbers of CD44hiCD62Llo Tregs in (E) spleen and (F) lung of Treg-DKO mice and WT littermates. (G) Flow cytometry analysis and frequencies of ICOS+ in CD25hi vs. CD25lo Foxp3+ Tregs in the spleen of Treg-DKO mice and WT littermates. Each symbol represents an individual mouse, and the bar represents the mean. Data are pooled from at least three independent experiments. (H) Percents of suppression of proliferation of WT Teffs by Tregs isolated from either WT or Treg-DKO mice in an in vitro suppression assay. Data are representative of three independent experiments. n = 6. Results of two-tailed Student’s t test: n.s., not significant; *, P < 0.05; **, P < 0.01; ***, P < 0.001; ****, P < 0.0001.

miR-15/16–deficient Tregs exhibit enhanced eTreg phenotype. (A and B) Flow cytometry analysis (A) and frequencies (B) of CD25lo cells in cTregs (CD44loCD62Lhi) and eTregs (CD44hiCD62Llo) isolated from the spleen of Treg-DKO mice and WT littermates (∼8–12 wk). Each symbol represents an individual mouse, and the bar represents the mean. Data are pooled from at least three independent experiments. Results of two-tailed Student’s t test: **, P < 0.01; ****, P < 0.0001.
miR-15/16–deficient Tregs exhibit enhanced eTreg phenotype. (A and B) Flow cytometry analysis (A) and frequencies (B) of CD25lo cells in cTregs (CD44loCD62Lhi) and eTregs (CD44hiCD62Llo) isolated from the spleen of Treg-DKO mice and WT littermates (∼8–12 wk). Each symbol represents an individual mouse, and the bar represents the mean. Data are pooled from at least three independent experiments. Results of two-tailed Student’s t test: **, P < 0.01; ****, P < 0.0001.
In addition to playing a pivotal role in promoting eTreg homeostasis, ICOS has long been shown to not only mark a Treg subset with stronger inhibitory capabilities but also directly promote their suppressor function (Busse et al., 2012; Chen et al., 2018; Herman et al., 2004; Kornete et al., 2012). Consistently, by performing in vitro suppression assays, we have observed that Tregs isolated from Treg-DKO mice exhibited enhanced suppressive activity on a per-cell basis compared with the miR-15/16–sufficient Tregs isolated from their wild-type counterparts (Fig. 2 H). Together, these results demonstrated that rather than impacting peripheral Treg homeostasis in general, deletion of miR-15/16 clusters in Tregs resulted in an increase in Tregs exhibiting phenotypic and functional characteristics of eTregs.
Treg-DKO mice exhibited attenuated immune responses and disease phenotype during autoimmune neuroinflammation
After examining the suppressor function of miR-15/16–deficient Tregs in vitro, we next sought to investigate how the immune system would be affected by the loss of miR-15/16 clusters in Tregs in vivo. As shown in Fig. 3, A and B, despite harboring increased Treg frequencies with enhanced suppressive capacities, deletion of both miR-15/16 clusters did not result in any apparent differences in conventional T cell (Tconv) proliferation or activation status. Nevertheless, even when the basal levels of cytokine responses were low in mice without any immunological challenges, we could still detect significantly reduced frequencies of IFNγ expressing cells in both CD4+ and CD8+ Tconv subsets in Treg-DKO mice compared with their WT littermates (Fig. 3, C and D), suggesting that the immune responses are likely under tighter control by miR-15/16–deficient Tregs. To further demonstrate the impact of miR-15/16 ablation in Tregs on the host beyond steady state, we employed a mouse model of autoimmune neuroinflammation, experimental autoimmune encephalomyelitis (EAE), in which Tregs are pivotal in protection and recovery from EAE by suppressing autoreactive T cells (Kleinewietfeld and Hafler, 2014). As shown in Fig. 3 E, Treg-DKO mice exhibited an attenuated disease phenotype with delayed onset of the disease upon EAE induction. Consistent with the disease phenotype and our analysis of Treg-DKO mice at steady state, frequencies of IFNγ+ CD4+ Teffs in the brain of Treg-DKO mice were considerably lower than those observed in WT control mice (Fig. 3 F). Moreover, while we could only detect a modest but statistically insignificant reduction in IL-17+ CD4+ Teffs in Treg-DKO mice (Fig. 3 G), the frequencies of CD4+ Teffs expressing GM-CSF, an inflammatory cytokine that is considered to be the main driver of EAE and many other autoimmune diseases (Croxford et al., 2015a; Croxford et al., 2015b), were clearly diminished (Fig. 3 H). Collectively, our analysis of Treg-DKO mice both at steady state and under the neuroinflammatory disease condition implied a role of miR-15/16 clusters in restricting peripheral Treg-mediated immune regulation.

miR-15/16–deficient Tregs exhibited enhanced suppressor function in vivo. (A and B) Flow cytometry analysis and frequencies of (A) Ki67+ and (B) CD44hiCD62Llo Tconvs in the spleen of Treg-DKO mice and WT littermates (∼8–12 wk). (C and D) Flow cytometry analysis and frequencies of IFNγ+ in (C) CD4+ and (D) CD8+ Tconvs in the spleen of Treg-DKO mice and WT littermates (∼8–12 wk). (E) The disease severities of EAE in Treg-DKO mice and WT littermates were scored regularly based on clinical symptoms. (F–H) Flow cytometry analysis and frequencies of (F) IFNγ+, (G) IL-17+, and (H) GM-CSF+ Tconvs in the brain of Treg-DKO mice and WT littermates 18 d after EAE induction. Each symbol represents an individual mouse, and the bar represents the mean. Data are pooled from at least three independent experiments. Results of two-tailed Student’s t test: n.s., not significant; *, P < 0.05; **, P < 0.01; ***, P < 0.001.
miR-15/16–deficient Tregs exhibited enhanced suppressor function in vivo. (A and B) Flow cytometry analysis and frequencies of (A) Ki67+ and (B) CD44hiCD62Llo Tconvs in the spleen of Treg-DKO mice and WT littermates (∼8–12 wk). (C and D) Flow cytometry analysis and frequencies of IFNγ+ in (C) CD4+ and (D) CD8+ Tconvs in the spleen of Treg-DKO mice and WT littermates (∼8–12 wk). (E) The disease severities of EAE in Treg-DKO mice and WT littermates were scored regularly based on clinical symptoms. (F–H) Flow cytometry analysis and frequencies of (F) IFNγ+, (G) IL-17+, and (H) GM-CSF+ Tconvs in the brain of Treg-DKO mice and WT littermates 18 d after EAE induction. Each symbol represents an individual mouse, and the bar represents the mean. Data are pooled from at least three independent experiments. Results of two-tailed Student’s t test: n.s., not significant; *, P < 0.05; **, P < 0.01; ***, P < 0.001.
miR-15/16 clusters limit eTreg differentiation at least partially by targeting IRF4
Previously, miR-15/16 clusters have been shown to target Bcl-2 in B cells (Cimmino et al., 2005). While overexpression of Bcl-2 in Tregs could lead to the accumulation of Tregs, we did not detect any increases in Bcl-2 expression in Tregs devoid of miR-15/16 clusters (Fig. 2 D). As such, dysregulated Bcl-2 in the absence of miR-15/16–mediated regulation could not account for increased Treg frequencies observed in Treg-DKO mice. Moreover, the miR-15b/16 cluster has also been shown to promote Treg induction by targeting Rictor, a key component of the mTORC2 pathway (Singh et al., 2015). However, inhibition of Rictor by miR-342 in Tregs was recently reported to be critical to ensure their suppressor function to effectively attenuate EAE in response to glucocorticoid treatment (Kim et al., 2020). Therefore, loss of miR-15/16–mediated control of Rictor is also unlikely to be responsible for the observed phenotype in which miR-15/16–deficient Tregs exhibited enhanced suppressive capacities in EAE. To gain molecular insights into miR-15/16–dependent regulation of Treg biology, we performed transcriptome analysis of miR-15/16–deficient Tregs isolated from heterozygous Foxp3YFPCre/+miR15a/16fl/flmiR15a/16fl/fl female mice which harbor a mixture of WT and miR-15/16–deficient Tregs due to X chromosome inactivation (Cruz et al., 2017). The presence of WT Tregs would help reduce the potential environmental influences allowing direct assessment of the cell-intrinsic impact of miR-15/16 ablation on Tregs. As shown in Fig. 4 A, gene ontology (GO) enrichment analysis demonstrated that miR-15/16 ablation resulted in substantial changes in genes related to T cell activation as well as regulation of T cell activation, suggesting that this miRNA family is critical in regulating Treg activation. Moreover, genes related to negative regulation of immune system processes were also identified, consistent with enhanced suppressor function observed in miR-15/16–deficient Tregs. Additional screening of genes associated with eTreg differentiation and function further revealed that eTreg gene signature was amplified in Tregs devoid of miR-15/16 clusters. Consistent with the aforementioned findings of miR-15/16–deficient Tregs displaying many eTreg phenotypic and functional properties, in addition to Icos, many genes that were reported to be highly expressed in eTregs (e.g., Il10, Fgl2) were further upregulated in Tregs with miR-15/16 ablation whereas genes that are downregulated in eTregs (e.g., Gata1, Igfbp4) were found to be expressed at even lower levels by both RNA sequencing (RNA-seq) and quantitative PCR (qPCR) analysis (Fig. 4 B and Fig. S3 A).

miR-15/16 clusters limit eTreg differentiation at least partially through targeting IRF4. (A) Dot plot of GO term enrichment analysis of differentially expressed genes between miR-15/16–deficient and –sufficient Tregs. Colors indicate the P values from Fisher’s exact test, and dot size is proportional to the number of differentially expressed genes in a given biological process. (B) Heatmap of eTreg core genes differentially expressed in Tregs with or without miR-15/16 clusters. (C) HITS-CLIP analyses (the underlying numbers represent the nucleotide position related to the start of the 3′ UTR and sequence alignments of two putative miR-15 binding sites in 3′ UTR of IRF4). Mutations of the corresponding miR-15 target sites are shown in blue. (D) Percentage of repressed luciferase activity of cells with IRF4 3′ UTR with or without mutations in the seed sequences in the presence of miR-15 compared with cells transfected with the empty vector. (E) qPCR analyses of the expressions of Irf4 in sorted Tregs from WT and Treg-DKO mice. (F) Flow cytometry analysis of IRF4 expression in Tconvs and Tregs with or without miR-15/16 ablation. n-fold increase of gMFI values of IRF4 on the basis of each corresponding WT Treg sample. (G) Bar graphs depict the numbers of miR-15/16–regulated eTreg genes that have been previously shown to be controlled in a IRF4-dependent or -independent manner. (H) Flow cytometry analysis of IRF4 expression in Tregs with or without IRF4 retroviral transduction. n-fold increases of gMFI values of IRF4 compared with each corresponding control in miR-15/16–deficient Tregs and Tregs with retroviral IRF4 transduction were shown on the right panel. (I) Flow cytometry analysis and ratios of transferred (I) GFP+CD25lo vs. GFP-CD25lo (J) GFP+ICOShi vs. GFP-ICOShi Tregs in RAG-deficient recipients. Each symbol represents an individual mouse, and the bar represents the mean. Data are pooled from at least three independent experiments. Results of two-tailed Student’s t test: n.s., not significant; *, P < 0.05; **, P < 0.01.
miR-15/16 clusters limit eTreg differentiation at least partially through targeting IRF4. (A) Dot plot of GO term enrichment analysis of differentially expressed genes between miR-15/16–deficient and –sufficient Tregs. Colors indicate the P values from Fisher’s exact test, and dot size is proportional to the number of differentially expressed genes in a given biological process. (B) Heatmap of eTreg core genes differentially expressed in Tregs with or without miR-15/16 clusters. (C) HITS-CLIP analyses (the underlying numbers represent the nucleotide position related to the start of the 3′ UTR and sequence alignments of two putative miR-15 binding sites in 3′ UTR of IRF4). Mutations of the corresponding miR-15 target sites are shown in blue. (D) Percentage of repressed luciferase activity of cells with IRF4 3′ UTR with or without mutations in the seed sequences in the presence of miR-15 compared with cells transfected with the empty vector. (E) qPCR analyses of the expressions of Irf4 in sorted Tregs from WT and Treg-DKO mice. (F) Flow cytometry analysis of IRF4 expression in Tconvs and Tregs with or without miR-15/16 ablation. n-fold increase of gMFI values of IRF4 on the basis of each corresponding WT Treg sample. (G) Bar graphs depict the numbers of miR-15/16–regulated eTreg genes that have been previously shown to be controlled in a IRF4-dependent or -independent manner. (H) Flow cytometry analysis of IRF4 expression in Tregs with or without IRF4 retroviral transduction. n-fold increases of gMFI values of IRF4 compared with each corresponding control in miR-15/16–deficient Tregs and Tregs with retroviral IRF4 transduction were shown on the right panel. (I) Flow cytometry analysis and ratios of transferred (I) GFP+CD25lo vs. GFP-CD25lo (J) GFP+ICOShi vs. GFP-ICOShi Tregs in RAG-deficient recipients. Each symbol represents an individual mouse, and the bar represents the mean. Data are pooled from at least three independent experiments. Results of two-tailed Student’s t test: n.s., not significant; *, P < 0.05; **, P < 0.01.

miR-15/16 clusters regulate eTreg gene program. (A) qPCR analyses of the expressions of Iocs, Il10, Fgl2, Gata1, and Igfbp4 in sorted Tregs isolated from WT and Treg-DKO mice. (B) Flow cytometry analysis of IRF4 expression in Tconvs, cTregs (CD44loCD62Lhi), and eTregs (CD44hiCD62Llo) with or without miR-15/16 ablation. n-fold increase of gMFI values of IRF4 in different Treg populations on the basis of Tconvs. (C) Heatmap of IRF4-dependent eTreg core genes differentially expressed in Tregs with or without miR-15/16 clusters. Each symbol represents an individual mouse, and the bar represents the mean. Data are pooled from at least three independent experiments. Results of two-tailed Student’s t test (or one-way ANOVA for studies with more than two groups): n.s., not significant; *, P < 0.05; **, P < 0.01; ***, P < 0.001.
miR-15/16 clusters regulate eTreg gene program. (A) qPCR analyses of the expressions of Iocs, Il10, Fgl2, Gata1, and Igfbp4 in sorted Tregs isolated from WT and Treg-DKO mice. (B) Flow cytometry analysis of IRF4 expression in Tconvs, cTregs (CD44loCD62Lhi), and eTregs (CD44hiCD62Llo) with or without miR-15/16 ablation. n-fold increase of gMFI values of IRF4 in different Treg populations on the basis of Tconvs. (C) Heatmap of IRF4-dependent eTreg core genes differentially expressed in Tregs with or without miR-15/16 clusters. Each symbol represents an individual mouse, and the bar represents the mean. Data are pooled from at least three independent experiments. Results of two-tailed Student’s t test (or one-way ANOVA for studies with more than two groups): n.s., not significant; *, P < 0.05; **, P < 0.01; ***, P < 0.001.
As discussed above, many transcription factors have been identified to be critical for eTreg differentiation. Among them, IRF4 was shown to serve as the key transcription factor required for the differentiation of all eTreg populations (Cretney et al., 2011). By analyzing previous results from high-throughput sequencing of RNAs isolated by crosslinking immunoprecipitation (HITS-CLIP; Loeb et al., 2012), two putative binding sites for miR-15 were found for IRF4 (Fig. 4 C). Further luciferase reporter analysis confirmed that IRF4 is indeed a direct target of miR-15 as mutations of these two binding sites completely abolished miR-15-mediated repression (Fig. 4, C and D). Consistently, we could detect significant increases in both Irf4 transcript and protein levels in miR-15/16–deficient Tregs compared with those in their WT counterparts (Fig. 4, E and F). It should be noted that elevated IRF4 expression found in miR-15/16–deficient Tregs was not simply due to increased frequencies of CD44hiCD62Llo eTregs that are known to express higher levels of IRF4 compared with the CD44loCD62Lhi cTreg counterpart. As shown in Fig. S3 B, augmented amounts of IRF4 were found in both CD44loCD62Lhi cTregs and CD44hiCD62Llo eTregs devoid of miR-15/16 clusters, further supporting IRF4 as a target directly regulated by this miRNA family in Tregs. Moreover, the potential contribution of elevated IRF4 expression in miR-15/16–deficient Tregs to eTreg differentiation was evident as almost two-thirds of miR-15/16–regulated eTreg genes have been previously shown to be controlled in an IRF4-dependent manner (Joller et al., 2014; Zheng et al., 2009; Fig. 4 G and Fig. S3 C). Nevertheless, as miRNAs typically exert their biological impact by repressing multiple targets that are in a shared pathway or protein complex, it remains unclear as to whether loss of miR-15/16–mediated regulation of IRF4 is at least in part responsible for the observed eTreg phenotype in Treg-DKO mice. To this end, we retrovirally expressed IRF4 in Tregs to a level closer to what could be detected in miR-15/16–deficient Tregs (Fig. 4 H). Next, IRF4-transduced Tregs or those transduced with the control vector were transferred along with congenically marked Tconvs into RAG-deficient recipients. Mice were then rested for 4–6 wk to allow proper T cell reconstitution before analysis. In addition to the congenic marker that helps distinguish the transferred Tregs and Tconvs, the presence of GFP reporter in the retroviral vector also afforded the opportunity to compare Tregs with or without ectopic IRF4 expression in the same recipients. As shown in Fig. 4, I and J, increased IRF4 expression in Tregs alone was sufficient to induce an eTreg phenotype (i.e., increased CD25lo subset with elevated ICOS expression), similar to what we have observed in Tregs devoid of miR-15/16. These results not only support the regulatory role of the miR-15/16–IRF4 axis in eTreg differentiation but also suggest that the level of IRF4 needs to be tightly controlled to ensure optimal eTreg responses.
Neuritin, an IRF4-dependent molecule, which is produced by Tregs to control PC responses, is a direct target of miR-15/16 clusters
While IRF4 is now well recognized as a master transcription factor for all eTreg populations (Cretney et al., 2011), it was initially reported to play a selective role in Treg-mediated control of type 2 humoral immunity (Zheng et al., 2009). Specifically, mice harboring IRF4-deficient Tregs exhibited tissue lesions with pronounced IgG1- and IgE-producing PC infiltration. However, while IRF4 has been shown to instruct the suppressive activity of Tregs by inducing many Treg suppressor molecules such as IL-10, FGL2, and ICOS (Cretney et al., 2011; Joller et al., 2014; Zheng et al., 2009), loss of neither of the aforementioned molecules in Tregs could account for the PC-dominated pathology found in mice with Treg-specific deletion of IRF4. On the contrary, besides a well-established role of ICOS in promoting follicular helper T cell (Tfh) differentiation, Treg-derived IL-10 and FGL2 have actually been shown to promote germinal center (GC) responses and type 2 immunity, respectively (Joller et al., 2014; Laidlaw et al., 2017).
To explore additional molecular mechanisms that could account for the enhanced suppressor function found in miR-15/16–deficient Tregs, further analysis of our RNA-seq dataset was performed. As shown in Fig. 5 A, we found that Nrn1, a gene encoding NRN1 (neuritin), is significantly upregulated in Tregs devoid of miR-15/16 clusters. Even though Nrn1 was not part of the previously reported core eTreg gene signature (Dias et al., 2017; Joller et al., 2014), expression of Nrn1 in Tregs was also reported to be dependent on IRF4 (Joller et al., 2014; Zheng et al., 2009). Recently, it has been shown that the production of neuritin by follicular Tregs (Tfrs) plays a crucial role in controlling PC differentiation and limiting autoantibody responses (Gonzalez-Figueroa et al., 2021). Interestingly, by analyzing the HITS-CLIP dataset, we were also able to identify a putative miR-15–binding site in the 3′UTR of neuritin (Fig. 5 B), suggesting that miR-15/16 clusters could directly inhibit neuritin in addition to indirectly controlling its expression through targeting IRF4. Supporting this notion, our luciferase reporter assay has confirmed neuritin as a direct target of miR-15 (Fig. 5 C). Consistently, not only could we confirm our RNA-seq results of elevated Nrn1 expression in Tregs devoid of miR-15/16 clusters by qPCR analysis, but we also observed a larger increased level of neuritin protein in miR-15/16–deficient Tregs compared with their WT counterparts (∼2.4 and ∼3.2-fold increase, respectively Fig. 5, D and E).
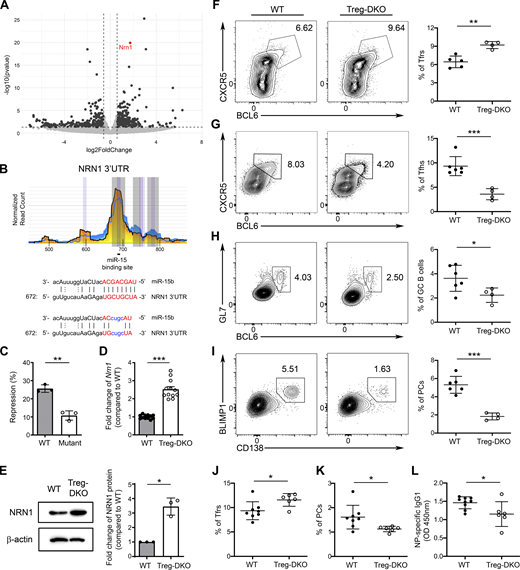
Neuritin, a known molecule that Tfrs employ to control PC responses, is a direct target of miR-15/16 clusters. (A) The volcano plot represents differential gene expression analysis of Tregs from Treg-DKO mice and WT littermates. Vertical dashed lines represent thresholds of log2FC of −0.585 and 0.585 corresponding to a fold change of 1.5 times. Horizontal dashed lines represent thresholds of −log10 of 1.301 corresponding to a P value of 0.05. (B) HITS-CLIP analyses (the underlying numbers represent the nucleotide position related to the start of the 3′ UTR and sequence alignments of the putative miR-15–binding site in 3′ UTR of NRN1. Mutations of the corresponding miR-15 target site are shown in blue. (C) Percentage of repressed luciferase activity of cells with NRN1 3′ UTR with or without mutations in the seed sequences in the presence of miR-15 compared with cells transfected with the empty vector. (D) qPCR analyses of the expressions of Nrn1 in sorted Tregs from WT and Treg-DKO mice. (E) Immunoblot analysis of NRN1 expression in Tregs with or without miR-15/16 ablation. Densitometric NRN1 expression values were first normalized to β-actin expression values and n-fold increase on the basis of each corresponding WT Treg sample. (F–I) Flow cytometry analysis and frequencies of (F) CXCR5+BCL6+ Tfrs, (G) CXCR5+BCL6+ Tfhs, (H) GL7+BCL6+ GC B cells, and (I) BLIMP1+CD138+ PCs in the spleen of Treg-DKO mice and WT littermates 8 d after LCMV infection. (J–L) Frequencies of splenic (J) CXCR5+BCL6+ Tfrs, (K) BLIMP1+CD138+ PCs, and (L) serum NP-specific IgG1 responses from Treg-DKO mice and WT littermates 8 d after NP-OVA immunization. Each symbol represents an individual mouse, and the bar represents the mean. Data are pooled from at least two independent experiments. Results of two-tailed Student’s t test: n.s., not significant; *, P < 0.05; **, P < 0.01; ***, P < 0.001. Source data are available for this figure: SourceData F5.
Neuritin, a known molecule that Tfrs employ to control PC responses, is a direct target of miR-15/16 clusters. (A) The volcano plot represents differential gene expression analysis of Tregs from Treg-DKO mice and WT littermates. Vertical dashed lines represent thresholds of log2FC of −0.585 and 0.585 corresponding to a fold change of 1.5 times. Horizontal dashed lines represent thresholds of −log10 of 1.301 corresponding to a P value of 0.05. (B) HITS-CLIP analyses (the underlying numbers represent the nucleotide position related to the start of the 3′ UTR and sequence alignments of the putative miR-15–binding site in 3′ UTR of NRN1. Mutations of the corresponding miR-15 target site are shown in blue. (C) Percentage of repressed luciferase activity of cells with NRN1 3′ UTR with or without mutations in the seed sequences in the presence of miR-15 compared with cells transfected with the empty vector. (D) qPCR analyses of the expressions of Nrn1 in sorted Tregs from WT and Treg-DKO mice. (E) Immunoblot analysis of NRN1 expression in Tregs with or without miR-15/16 ablation. Densitometric NRN1 expression values were first normalized to β-actin expression values and n-fold increase on the basis of each corresponding WT Treg sample. (F–I) Flow cytometry analysis and frequencies of (F) CXCR5+BCL6+ Tfrs, (G) CXCR5+BCL6+ Tfhs, (H) GL7+BCL6+ GC B cells, and (I) BLIMP1+CD138+ PCs in the spleen of Treg-DKO mice and WT littermates 8 d after LCMV infection. (J–L) Frequencies of splenic (J) CXCR5+BCL6+ Tfrs, (K) BLIMP1+CD138+ PCs, and (L) serum NP-specific IgG1 responses from Treg-DKO mice and WT littermates 8 d after NP-OVA immunization. Each symbol represents an individual mouse, and the bar represents the mean. Data are pooled from at least two independent experiments. Results of two-tailed Student’s t test: n.s., not significant; *, P < 0.05; **, P < 0.01; ***, P < 0.001. Source data are available for this figure: SourceData F5.
Considering the aforementioned role of neuritin in Tfrs, we next sought to examine how humoral immune responses could be impacted by the loss of miR-15/16 clusters in Tregs in the context of acute infection with lymphocytic choriomeningitis virus (LCMV). As shown in Fig. 5 F, similar to the observed phenotype of increased eTregs in Treg-DKO mice at steady state, we also detected elevated frequencies of Tfrs in mice with Treg-specific deletion of miR-15/16 clusters upon LCMV infection. On the other hand, diminished Tfh and GC B cell responses were found (∼2 and ∼1.5-fold reduction, respectively; Fig. 5, G and H), demonstrating that loss of miR-15/16–mediated gene regulation in Tregs could lead to enhanced Tfr responses and, consequently, impaired humoral immunity during infection. Interestingly, consistent with the reported role of neuritin in limiting PC differentiation, we observed an even bigger reduction in the frequency of CD138+Blimp1+ PCs in mice harboring miR-15/16–deficient Tregs upon LCMV infection (approximately threefold reduction; Fig. 5 I). Similarly, results could also be obtained when mice were immunized with 4-hydroxy-3-nitrophenyl linked to ovalbumin (NP-OVA) precipitated in alum. As shown in Fig. 5, J–L, in addition to observing increased Tfr and reduced PC responses in Treg-DKO mice upon NP-OVA immunization, diminished amounts of NP-specific IgG1 antibodies were also detected. Together, these results demonstrate that enhanced eTreg responses in mice with Treg-specific miR-15/16 ablation restrain humoral immunity under both infectious and non-infectious immunization conditions. Our data further suggest that the miR-15/16 family regulates Treg biology not only through controlling IRF4-dependent eTreg differentiation program but can also limit their function via directly targeting suppressor molecules such as neuritin.
Since the identification of Tregs more than two decades ago, how they develop, are maintained, and function to establish immunological tolerance have been under intensive investigation. While the emergence of eTregs has been shown to be critical to control diverse inflammatory responses in both lymphoid and nonlymphoid tissues, dysregulated eTreg responses could also lead to detrimental consequences under certain disease conditions (Alvisi et al., 2020; Perry et al., 2022). Here, we demonstrate that the miR-15/16 clusters play a pivotal role in limiting eTreg differentiation and function. Moreover, as the induction of miR-15b/16 cluster in Tregs could be driven by IL-2, while the maintenance of eTregs does not seem to require IL-2 signaling (Smigiel et al., 2014), our data suggest that IL-2 might still act as a key molecule in determining the appropriate eTreg responses under different physiologic and pathologic contexts. On the other hand, it is interesting that the miR-15b paralog, miR-15a, displays an opposite expression pattern in Tregs and is independent of IL-2 regulation. While the mechanism underlying miR-15a induction in Tregs with miR-15b ablation remains to be further investigated, the fact that elevated miR-15a expression can largely compensate for the loss of miR-15b suggests that they share many common targets crucial for Treg biology. As such, a relatively lower expression of miR-15a found in Tregs might be necessary to permit proper eTreg differentiation. Collectively, our findings once again highlight the importance of miRNA-mediated gene regulation in fine-tuning Treg biology to properly respond to different immunological challenges.
Materials and methods
Mice
miR-15a/16-1fl (Klein et al., 2010) and miR-15b/16-2fl (Gagnon et al., 2019) mice were bred with Foxp3YFPCre and LckCre mice (Hennet et al., 1995), respectively, to obtain mice with Treg-specific deletion of miR-15a/16-1 (Treg-aKO), miR-15b/16-2 (Treg-bKO), and both miR-15/16 clusters (Treg-DKO) or T cell–specific deletion of both miR-15/16 clusters (T-DKO). Foxp3Thy1.1 and Foxp3GPF-null mice have been described previously (Gavin et al., 2007; Liston et al., 2008b). All mice were maintained and handled in accordance with the Institutional Animal Care and Use Guidelines of the University of California, San Diego, the National Institutes of Health Guidelines for the Care and Use of Laboratory Animals, and the ARRIVE Guidelines.
Flow cytometry
For T cell analysis, single-cell suspensions of the thymus, spleen, and lymph nodes, as well as lymphocyte isolation in the brain and spinal cord were prepared as described previously. Cells were first stained with Ghost Dye Red 780 (Tonbo Biosciences) followed by surface antibody staining for CD4 (RM4-5), CD8a (53-6.7), CD44 (IM7), CD62L (MEL-14), CD25 (PC61), ICOS (7E.17G9, C398.4A), CD73 (TY/11.8), Thy1.1 (HIS51), B220 (RA3-6B2), CD138 (281-2), GL7 (GL7), and PNA (FL-1071). For CXCR5 staining, cells were stained with purified CXCR5 (2G8) for 1 h, followed by staining with biotinylated anti-rat IgG (Jackson) for 30 min, and then surface staining was performed with indicated antibodies, as well as PE- or APC-labeled streptavidin. Intracellular staining for Foxp3 (FJK-16s), Ki67 (SolA15), CTLA-4 (UC10-4B9), YFP/GFP(FM264G), BCL6 (K112-91), BLIMP1 (5E7), and IRF4 (3E4) was completed after fixation and permeabilization with Foxp3/Transcription Factor Staining Kit according to the manufacturer’s protocol (Tonbo). To detect IFNγ (XMG1.2), IL-17A (eBio17B7), and GM-CSF (MP1-22E9) cytokine production, cells were stimulated in a 96-well plate with 50 ng/ml PMA, 0.5 mg/ml ionomycin, and 1 mg/ml Brefeldin A (all from Sigma-Aldrich) in complete 5% RPMI media for 4 h at 37°C before staining. For thymic Treg analysis, total tTregs were gated on Foxp3+ cells from the CD4+CD8− population. For nascent and recirculating tTregs, CD73− and CD73+ cells were first gated from the CD4+CD8− population, followed by Foxp3+ gating. For cTregs and eTregs, total Tregs were first gated on Foxp3+ cells from the CD4+CD8− population followed by CD44loCD62Lhi (for cTregs) and CD44hiCD62Llo (for eTregs) gating. Cells were fixed in 2% paraformaldehyde prior to analysis by flow cytometry. Flow cytometry data were collected by BD LSRFortessa or BD LSRFortessa X-20 (BD Biosciences) and analyzed by FlowJo (Tree star). Finally, BD FACSAria Fusion (BD Biosciences) was used for cell sorting.
qPCR analysis
For quantification of the expression of miR-15/16 clusters in different thymocyte subsets, CD25−Foxp3YFP− CD4SP, CD25+Foxp3YFP− CD4SP, Foxp3+ CD4SP, and CD73−Foxp3+ CD4SP from Foxp3YFPCre/WT, and Foxp3GFP+ CD4SP from Foxp3GPF−null/WT heterozygous female mice were sorted on BD FACSAria II (BD Biosciences) with a purity of >95%, followed by RNA isolation using miRNeasy kit (Qiagen) according to the manufacturer’s instructions. To determine the expression of miR-15a, miR-15b, and miR-16, TaqMan MicroRNA Assay (Thermo Fisher Scientific) was performed. For other gene detection, cDNA was generated using iScript cDNA Synthesis Kit (Bio-Rad), followed by qPCR reactions using SYBR Green PCR Mix (Thermo Fisher Scientific). The primer sequences used were as follows: Irf4: 5′-GAACGAGGAGAAGAGCGTCTTC-3′ (F), 5′-GTAGGAGGATCTGGCTTGTCGA-3′ (R); Nrn1: 5′-TGTTTGCTCAAGCTGGGCGACA-3′ (F), 5′-CTTCCTGGCAATCCGTAAGAGC-3′ (R); Fgl2: 5′- GGCAAATCTAACCGTTGTGGTCA-3′ (F), 5′-TTCCTAGCACGTAGTGGTCGGA-3′ (R); Il10: 5′-ATCGATTTCTCCCCTGTGAA-3′ (F), 5′-TGTCAAATTCATTCATGGCCT-3′ (R); Icos: 5′-TGACCCACCTCCTTTTCAAG-3′ (F), 5′-TTAGGGTCATGCACACTGGA-3′ (R); Gapdh: 5′-CGTCCCGTAGACAAAATGGT-3′ (F), 5′-TCAATGAAGGGGTCGTTGAT-3′ (R); Igfbp4: 5′-CGGAGCAAGATGAAGATCGTGG-3′ (F), 5′-GATGAAGAGGTCTTCGTGGGTAC-3′ (R); Gata1: 5′-ACGACCACTACAACACTCTGGC-3′ (F), 5′-TTGCGGTTCCTCGTCTGGATTC-3′ (R); Socs2: 5′-GCGCGTCTGGCGAAAGCCCT-3′ (F), 5′-GAAAGTTCCTTCTGGAGCCTCTT-3′ (R).
In vitro IL-2 stimulation
CD25hiFoxp3YFP− Treg precursors from Foxp3YFPCre mice were sorted on a FACSAria Fusion (BD Biosciences) into complete RPMI, followed by stimulation with or without 500 U/ml IL-2 at 37°C for 24 h.
In vitro suppression assay
5 × 10⁴ naïve CD4+CD25−CD62Lhi T cells from Ly5.1+ B6 mice labeled with CellTrace Violet (Thermo Fisher Scientific) and CD4+Foxp3YFP+ Tregs in spleen from Treg-DKO mice or WT control littermates were co-cultured at the indicated ratios and stimulated with 1 μg/ml αCD3 mAb in the presence of 15 × 104 Mitomycin C–treated T cell–depleted splenocytes for 72 h at 37°C. CFSE dilution was assessed by flow cytometry analysis.
Luciferase reporter assay
The 3′UTR sequences of Irf4 were amplified from mouse genomic DNA and cloned into pSiCheck2 vector (Promega). Site-directed mutagenesis (Agilent) was performed to obtain mutants of Irf4 3′UTR. Indicated 3′UTR WT or mutant plasmids were transfected into HEK293T (ATCC CRL-3216) cells along with either a miR-15b-expressing plasmid or a control empty vector. Luciferase activity was determined by the Dual Luciferase Reporter Assay system (Promega) according to the manufacturer’s instructions 24 h after transfection.
Western blot
Flow cytometry–isolated Tregs from Treg-DKO mice or WT control littermates were subjected to lysis with radioimmunoprecipitation assay buffer supplemented with 1 mM PMSF for 30 min. Cell debris was removed by centrifugation at 14,000 rpm for 15 min at 4°C, and the supernatants were transferred to fresh tubes. Cell lysates were separated by SDS-PAGE followed by a nitrocellulose membrane (Bio-Rad Laboratories) transfer. Antibodies against β-actin (AC-74; Sigma-Aldrich) and neuritin (B-9; Santa Cruz Biotechnology) were used to visualize the corresponding proteins. Images were acquired on an LSM 700 system (Carl Zeiss Inc.). Quantification of proteins was calculated with ImageJ (National Institutes of Health).
Retroviral transduction
To generate retrovirus, pMIG-IRF4, a gift from David Baltimore (California Institute of Technology, Pasadena, CA, USA; Addgene plasmid #58987), or empty vector was transfected with pCL-Eco into HEK293T cell using Fugene 6 (Promega). Retroviral supernatants were collected at 48 h after transfection. CD4+Foxp3Thy1.1+ Tregs were isolated from Foxp3Thy1.1 reporter mice and activated by plate-bound αCD3 and αCD28 antibodies (2 μg/ml each) and IL-2 (500 U) for 1 d and retrovirally transduced by spin infection for 90 min at 2,000 rpm in the presence of 8 µg/ml of polybrene (Millipore).
For immunoblotting, transduced cells were cultured with IL-2 (500 U) for 3 d after retroviral transduction and subcultured with IL-2 (500 U) in the absence of plate-bound αCD3 and αCD28 antibodies. 6 d after initial retroviral transduction, cells were harvested and sorted for GFP expression. Flow cytometry–sorted GFP+ IRF4-overexpressing as well as control Tregs were lysed and subjected to immunoblot analysis as described previously.
For adoptive transfer studies, transduced cells were cultured with IL-2 (500 U) in the presence of plate-bound αCD3 and αCD28 antibodies. 6 d after initial retroviral transduction, CD4+Foxp3Thy1.1+ Tregs were harvested and transferred together with CD4+CD25− Tconvs isolated from Ly5.1+ B6 mice at 1:3 ratio by i.v. injection into RAG1-deficient mice. Mice were taken down 4–6 wk after adoptive transfer for flow analysis.
EAE
Mice were immunized s.c. with 200 μg MOG35–55 emulsified with complete Freund’s adjuvant on day 0. In addition, mice were administered i.p. with 260 ng pertussis toxin in 500 μl PBS twice on day 0 and day 2. Animals were scored every day after day 7 for disease symptoms as described previously (Lu et al., 2015). For flow cytometry analysis of CNS-infiltrating T cell phenotype, mice were taken down 18 d after EAE induction.
LCMV infection
LCMV Armstrong viral stocks were prepared and quantified as described previously (Harker et al., 2011). Mice were inoculated i.p. with 2 × 10⁶ PFU viruses for GC response study. Mice were sacrificed on day 8 after infection.
NP-OVA immunization
100 μg of NP-OVA (Biosearch Technologies) in PBS mixed with 50% of alum (Thermo Fisher Scientific) were injected intraperitoneally. Mice were sacrificed on day 8 after immunization.
ELISA
NP-specific IgG1 antibody were measured similar to what was described previously (Cho et al., 2018). In brief, 96-well plates were first coated overnight at 4°C with NP27-BSA (Biosearch Technologies), followed by blockade of non-specific binding by incubation with blocking buffer (1% of BSA in PBS) for 1 h at room temperature. Mouse serum was diluted to 10−4 of the original concentration in blocking buffer and then added to the plates, followed by incubation for 1 h at room temperature. Plates were washed with washing buffer (0.05% Tween-20 in PBS) three times. Bound antibodies were detected by HRP-conjugated anti-mouse IgG1 antibodies (5300-05; 1:1,000; Southern Biotech). The reactions were developed by incubation for 15 min at room temperature with TMB substrate (BioLegend) and were stopped by the addition of 2N H2SO4. Absorbance was measured by a microreader (Bio-Rad) at 450 nm.
Gene expression profiling
CD4+Foxp3YFP+ Tregs were sorted on FACSAria II cell sorter (BD Biosciences) from heterozygous Foxp3YFPCre/+miR15a/16fl/flmiR15b/16fl/fl female mice and control Foxp3YFPCre/+ female mice, followed by total RNA isolation using a miRNeasy Kit (Qiagen). cDNA was synthesized as previously described. Pair-end 250 base-pair RNA-seq was performed on the Illumina NovaSeq 6000. Reads were aligned to the mouse genome (mm10) using STAR (Dobin et al., 2013). Differential expression was tested using DESeq2 (Love et al., 2014) with a cutoff of 1.25-fold change and P value 0.05. Volcano plots were generated using EnhancedVolcano (https://github.com/kevinblighe/EnhancedVolcano). GO biological processes associated with differentially expressed genes (cutoff P value 0.05) were queried using clusterProfiler (Yu et al., 2012), and the top GO categories with the most significance were selected.
Statistical analyses
A two-tailed Student’s t test (or one-way ANOVA for studies with more than two groups) was done on all reported data using Prism software (GraphPad; *, P < 0.05; **, P < 0.01; ***, P < 0.001; ****, P < 0.0001; ns, not significant). All experiments were performed independently at least two times to ensure the reproducibility of the data.
Online supplemental material
Data availability
RNA-seq data underlying Figs. 4 and 5 and Fig. S3 are available from the National Center for Biotechnology Information under accession no. GSE225737. The core eTreg gene list was generated by overlapping differentially expressed genes in TIGIT+ or Myb+ eTregs from previous bulk RNA-seq studies (Dias et al., 2017; Joller et al., 2014). HITS-CLIP data underlying Figs. 4 and 5 are available from the National Center for Biotechnology Information under accession no. GSE41288 (Loeb et al., 2012).
Acknowledgments
We thank all members of our laboratory for discussions.
This work was supported by National Institutes of Health grants AI108651, AI139753, and AI163813 (to L.-F. Lu).
Author contributions: Conceived and designed the experiments: J. Dong, W.J. Huth, and L.-F. Lu. Performed the experiments: J. Dong, W.J. Huth, N. Marcel, and Z. Zhang. Analyzed the data: J. Dong, W.J. Huth, and L.-F. Lu. Contributed reagents, materials, and analysis tools: L.-L. Lin. Wrote the paper: J. Dong and L.-F. Lu.

