


Gastric cancer (GC) is one of the most common deadly cancers in the world. Although patient genomic data have identified AT-rich interaction domain 1A (ARID1A), a key chromatin remodeling complex subunit, as the second most frequently mutated gene after TP53, its in vivo role and relationship to TP53 in gastric tumorigenesis remains unclear. Establishing a novel mouse model that reflects the ARID1A heterozygous mutations found in the majority of human GC cases, we demonstrated that Arid1a heterozygosity facilitates tumor progression through a global loss of enhancers and subsequent suppression of the p53 and apoptosis pathways. Moreover, mouse genetic and single-cell analyses demonstrated that the homozygous deletion of Arid1a confers a competitive disadvantage through the activation of the p53 pathway, highlighting its distinct dosage-dependent roles. Using this unique vulnerability of Arid1a mutated GC cells, our combined treatment with the epigenetic inhibitor, TP064, and the p53 agonist, Nutlin-3, inhibited growth of Arid1a heterozygous tumor organoids, providing a novel therapeutic option for GC.

Introduction
As the third deadliest cancer worldwide, gastric cancer (GC) accounted for an estimated 8% of all cancer mortality in 2019 (Ferlay et al., 2019). One striking feature of the GC genome is a high incidence of mutations altering chromatin modifiers. Indeed, mutations in genes for BRG1- or HBRM-associated factors (BAF) chromatin remodeling complex proteins (ARID1A mutations at 14–31%, ARID1B at 9%) and nucleosome remodeling deacetylase complex proteins (CHD3 at 8%, CHD4 at 9%) are collectively very common (The Cancer Genome Atlas Research Network, 2014; Cerami et al., 2012; Gao et al., 2013; Wang et al., 2011). Histone methyltransferase genes also are frequently mutated (MLL1–MLL4 at 9–21%; The Cancer Genome Atlas Research Network, 2014; Cerami et al., 2012; Gao et al., 2013; Zang et al., 2012). These types of mutations suggest a prominent role for altered chromatin organization in gastric tumorigenesis, but the in vivo roles of these chromatin modifiers have been poorly understood due to the limitation of relevant GC animal models. Moreover, the mutations in these chromatin modifier genes also overlap with other GC mutations such as TP53, the most mutated GC gene. However, it remains unclear how altered chromatin modifiers cooperate with the p53 pathway to promote gastric tumorigenesis.
The BAF complex is an ATP-dependent chromatin remodeling complex that mobilizes nucleosomes and regulates global histone modification (Kadoch and Crabtree, 2015). The BAF complex is the most commonly mutated chromatin modifier in human malignancies, and many subunits of the complex have been linked to a wide spectrum of cancers (Kadoch and Crabtree, 2015). Notably, AT-rich interaction domain 1A (ARID1A), a subunit of the BAF complex, has been identified as the second most mutated gene after TP53 in GC (The Cancer Genome Atlas Research Network, 2014). Consistent with ARID1A mutations found in various types of cancer, it has been known primarily to have tumor suppressor roles in other tissues (Wu and Roberts, 2013). Several studies showed that its tissue-specific deletion promotes pancreatic and intestinal tumorigenesis in vivo (Kimura et al., 2018; Mathur et al., 2017; Wang et al., 2019). Interestingly, liver-specific deletion of Arid1a at early stages conferred resistance to tumor initiation, whereas its deletion in established tumors facilitated tumor progression, indicating its tissue-specific roles (Sun et al., 2017). In GC, recent clinical studies have shown that ARID1A deficiency is associated with poor prognosis and lymph node metastasis (Aso et al., 2015; Han et al., 2016; Inada et al., 2015; Yang et al., 2016). Several cell culture studies have provided some evidence supporting its role as a tumor suppressor in GC. Knockdown of ARID1A in GC cell lines promoted proliferation, migration, and survival (Nagl et al., 2005; Yan et al., 2014; Yang et al., 2018). However, its in vivo role remains unclear.
To define the mechanistic role of Arid1a in gastric tumorigenesis, we generated a clinically relevant gastric tumor model with an Arid1a heterozygous deletion. We found that Arid1a heterozygous tumors exhibit a global loss of active enhancer marks and down-regulation of the p53 and apoptotic pathway genes, leading to enhanced tumor growth and progression. Surprisingly, during GC development, homozygous deletion of Arid1a in gastric tumors conferred a competitive disadvantage through abnormal activation of the p53 pathway. Using this vulnerability of Arid1a mutated tumor cells, we were able to design a combinatorial treatment consisting of an epigenetic inhibitor and a p53 agonist that synergistically inhibits the growth of organoids established from Arid1a heterozygous tumors. This novel approach provides a potentially effective therapeutic option for GC patients harboring ARID1A mutations.
Results
Arid1a heterozygosity promotes tumor progression in vivo
To examine the correlation between tumor progression and ARID1A expression in GC, we analyzed human GC samples by performing histology. This analysis categorized them into four different groups: benign, well, moderately, and poorly differentiated groups (Fig. 1 A). ARID1A staining showed its significantly reduced expression in moderately differentiated gastric tumors compared with the benign tissue (Fig. 1 B). While poorly differentiated gastric tumors exhibit higher levels of ARID1A expression than moderately differentiated gastric tumors, they display a lower level of its expression than the benign tissue (Fig. 1 B). In matched tumor-normal pair analyses, we found that gastric tumors consistently exhibit a lower level of ARID1A expression than the benign tissue in all pairs, further supporting that ARID1A loss may be a driver for gastric tumorigenesis (Fig. 1 C).
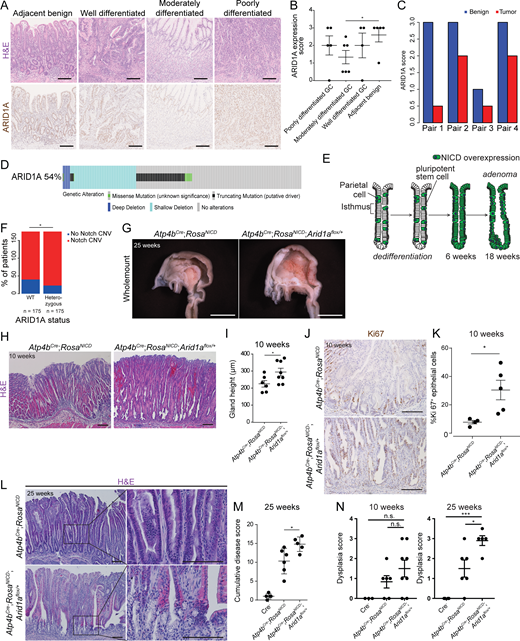
Promotion of gastric tumor progression by Arid1a heterozygosity. (A) Histological images and ARID1A staining of human GC samples with different tumor grades. Scale bars, 100 µm. (B) Quantification of ARID1A protein level using ARID1A staining of human GC samples with different tumor grades (*, P = 0.048). Bars represent mean ± SEM. (C) Quantification of ARID1A protein level from ARID1A staining between tumor and adjacent benign tissues in the same tumor-normal pairs. (D) Summary of ARID1A alterations found in human GC patients using DNA-sequencing data obtained from TCGA (STAD, Firehose) and visualized using cBioportal OncoPrint (Cerami et al., 2012; Gao et al., 2013). Among the 54% of all GC samples that exhibit ARID1A mutations, the majority of ARID1A alterations (87%) are functionally heterozygous, occurring either as a single truncation mutation (in black) or as a shallow deletion (in light blue). (E) Diagram outlining adenoma formation in the Notch-driven gastric adenoma model. NICD, Notch1 intracellular domain. (F) Analysis of TCGA-STAD data showing the proportion of ARID1A wild-type or ARID1A heterozygous GC samples that contain amplification for genes related to Notch signaling (*, P = 0.026, χ2 test). (G) Whole-mount images of the gastric lumen comparing Arid1a heterozygous adenoma mice with adenoma mice with intact Arid1a, showing larger tumors in the former (n = 5 each). Scale bars, 5 mm. (H) Representative histological images of Arid1a intact and Arid1a heterozygous gastric adenoma at an early stage of tumor progression (n = 6–8 each). Scale bars, 100 µm. Bars represent mean ± SEM. (I) Quantification of gastric gland height confirms a significant increase in gland height of Arid1a heterozygous tumors compared with Arid1a intact tumors at initial stages of tumor progression (*, P = 0.045, unpaired t test). (J) Representative images of Ki67 staining, a marker of proliferating cells, in Arid1a intact and Arid1a heterozygous tumors at 10 wk (n = 4–5 each). Scale bars, 100 µm. (K) Quantification of Ki67+ cells in the epithelium of Arid1a intact and Arid1a heterozygous tumors at 10 wk (*, P = 0.024, unpaired t test). Bars represent mean ± SEM. (L) Representative histological images of Arid1a intact and Arid1a heterozygous gastric adenoma at late stage (25 wk) of tumor progression (n = 5–6 each). Scale bars, 100 µm. (M) Histopathological scoring of late-stage tumors shows a significant increase in the cumulative disease score of Arid1a heterozygous tumors compared with Arid1a intact tumors using features shown in Table S1 (*, P = 0.028, unpaired t test). Bars represent mean ± SEM. (N) Histopathological scoring of dysplasia using features shown in Table S1 indicates no significant difference between Arid11a intact and heterozygous tumors at an early stage. At late stages, Arid1a heterozygous tumors have a significantly higher dysplastic index than Arid1a intact tumors (*, P < 0.05; ***, P < 0.001; unpaired t test). Bars represent mean ± SEM.
Promotion of gastric tumor progression by Arid1a heterozygosity. (A) Histological images and ARID1A staining of human GC samples with different tumor grades. Scale bars, 100 µm. (B) Quantification of ARID1A protein level using ARID1A staining of human GC samples with different tumor grades (*, P = 0.048). Bars represent mean ± SEM. (C) Quantification of ARID1A protein level from ARID1A staining between tumor and adjacent benign tissues in the same tumor-normal pairs. (D) Summary of ARID1A alterations found in human GC patients using DNA-sequencing data obtained from TCGA (STAD, Firehose) and visualized using cBioportal OncoPrint (Cerami et al., 2012; Gao et al., 2013). Among the 54% of all GC samples that exhibit ARID1A mutations, the majority of ARID1A alterations (87%) are functionally heterozygous, occurring either as a single truncation mutation (in black) or as a shallow deletion (in light blue). (E) Diagram outlining adenoma formation in the Notch-driven gastric adenoma model. NICD, Notch1 intracellular domain. (F) Analysis of TCGA-STAD data showing the proportion of ARID1A wild-type or ARID1A heterozygous GC samples that contain amplification for genes related to Notch signaling (*, P = 0.026, χ2 test). (G) Whole-mount images of the gastric lumen comparing Arid1a heterozygous adenoma mice with adenoma mice with intact Arid1a, showing larger tumors in the former (n = 5 each). Scale bars, 5 mm. (H) Representative histological images of Arid1a intact and Arid1a heterozygous gastric adenoma at an early stage of tumor progression (n = 6–8 each). Scale bars, 100 µm. Bars represent mean ± SEM. (I) Quantification of gastric gland height confirms a significant increase in gland height of Arid1a heterozygous tumors compared with Arid1a intact tumors at initial stages of tumor progression (*, P = 0.045, unpaired t test). (J) Representative images of Ki67 staining, a marker of proliferating cells, in Arid1a intact and Arid1a heterozygous tumors at 10 wk (n = 4–5 each). Scale bars, 100 µm. (K) Quantification of Ki67+ cells in the epithelium of Arid1a intact and Arid1a heterozygous tumors at 10 wk (*, P = 0.024, unpaired t test). Bars represent mean ± SEM. (L) Representative histological images of Arid1a intact and Arid1a heterozygous gastric adenoma at late stage (25 wk) of tumor progression (n = 5–6 each). Scale bars, 100 µm. (M) Histopathological scoring of late-stage tumors shows a significant increase in the cumulative disease score of Arid1a heterozygous tumors compared with Arid1a intact tumors using features shown in Table S1 (*, P = 0.028, unpaired t test). Bars represent mean ± SEM. (N) Histopathological scoring of dysplasia using features shown in Table S1 indicates no significant difference between Arid11a intact and heterozygous tumors at an early stage. At late stages, Arid1a heterozygous tumors have a significantly higher dysplastic index than Arid1a intact tumors (*, P < 0.05; ***, P < 0.001; unpaired t test). Bars represent mean ± SEM.
To further examine the dynamics of ARID1A expression observed in GC, we defined the different types of ARID1A mutations in human GC patients by analyzing genomic data collected by The Cancer Genome Atlas (TCGA) Research Network. Interestingly, we observed that most ARID1A alterations found in GC patients were shallow deletions or single-copy truncations, suggesting haploinsufficiency of ARID1A in GC (Fig. 1 D; Cerami et al., 2012; Gao et al., 2013). Furthermore, we found that ARID1A heterozygosity is correlated with more advanced stages of GC (Fig. S1 A). To address, for the first time, the in vivo role of Arid1a heterozygosity during gastric tumor progression, we generated a clinically relevant gastric tumor model by combining Arid1a heterozygosity and the pro-proliferative signaling pathway, Notch signaling.
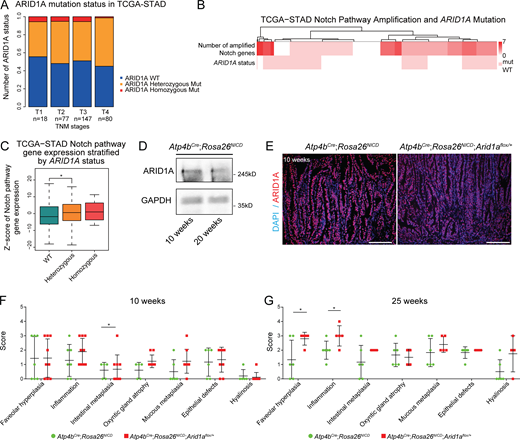
ARID1A heterozygous loss promotes tumor progression in Notch-activated gastric adenoma. (A) Analysis of ARID1A alterations in different human GC stages based on data obtained from TCGA (STAD, Firehose) identifies an increased proportion of ARID1A heterozygous alterations in the more advanced stages. TNM, tumor, node, metastasis. (B) Analysis of TCGA-STAD data showing the overlap of human GC cases with amplifications in Notch pathway genes and ARID1A mutations. The top row of the heatmap indicates the number of Notch pathway genes amplified, and the bottom row indicates the samples with or without ARID1A mutation. (C) Analysis of Notch pathway gene expression in human gastric cancer cases with ARID1A alterations from TCGA-STAD data shows significantly increased Notch pathway gene expression in ARID1A heterozygous cancer cases compared with ARID1A wild-type cancer cases (*, P < 0.04491, unpaired t test). (D) Western blot of ARID1A from the tumor epithelial cells of 10- and 20-wk-old Notch-activated adenoma mice. (E) Representative immunofluorescence images of ARID1A staining in Arid1a intact and Arid1a heterozygous gastric tumors demonstrate that ARID1A expression is not completely lost in Arid1a heterozygous tumors (n = 3 each). Scale bar, 100 µm. (F) Individual disease scores of 10-wk-old Arid1a intact and Arid1a heterozygous gastric tumors using Table S1 (*, P < 0.05; unpaired t test). Bars represent mean ± SD. (G) Individual disease scores of Arid1a intact and Arid1a heterozygous gastric tumors at 25 wk of age using Table S1 (*, P < 0.05; unpaired t test). Bars represent mean ± SD.
ARID1A heterozygous loss promotes tumor progression in Notch-activated gastric adenoma. (A) Analysis of ARID1A alterations in different human GC stages based on data obtained from TCGA (STAD, Firehose) identifies an increased proportion of ARID1A heterozygous alterations in the more advanced stages. TNM, tumor, node, metastasis. (B) Analysis of TCGA-STAD data showing the overlap of human GC cases with amplifications in Notch pathway genes and ARID1A mutations. The top row of the heatmap indicates the number of Notch pathway genes amplified, and the bottom row indicates the samples with or without ARID1A mutation. (C) Analysis of Notch pathway gene expression in human gastric cancer cases with ARID1A alterations from TCGA-STAD data shows significantly increased Notch pathway gene expression in ARID1A heterozygous cancer cases compared with ARID1A wild-type cancer cases (*, P < 0.04491, unpaired t test). (D) Western blot of ARID1A from the tumor epithelial cells of 10- and 20-wk-old Notch-activated adenoma mice. (E) Representative immunofluorescence images of ARID1A staining in Arid1a intact and Arid1a heterozygous gastric tumors demonstrate that ARID1A expression is not completely lost in Arid1a heterozygous tumors (n = 3 each). Scale bar, 100 µm. (F) Individual disease scores of 10-wk-old Arid1a intact and Arid1a heterozygous gastric tumors using Table S1 (*, P < 0.05; unpaired t test). Bars represent mean ± SD. (G) Individual disease scores of Arid1a intact and Arid1a heterozygous gastric tumors at 25 wk of age using Table S1 (*, P < 0.05; unpaired t test). Bars represent mean ± SD.
Notch signaling is frequently activated in GC (Yao et al., 2017), and its ectopic activation in gastric parietal cells (Atp4bCre;Rosa26NICD) induces their dedifferentiation to stem cells and leads to adenoma formation in the gastric corpus region (Fig. 1 E; Kim and Shivdasani, 2011). Notably, copy number variation and gene expression analyses showed that amplification of Notch pathway genes significantly co-occurs with ARID1A heterozygosity in human GC (Fig. 1 F and Fig. S1 B) and that significantly higher expression of Notch pathway genes is found in ARID1A heterozygous GC than in wild-type GC (Fig. S1 C). Given the clinical relevance of activated Notch signaling co-occurring with ARID1A heterozygosity in human GC, we used this model to specifically target Arid1a in the gastric corpus region.
After confirming ARID1A expression in the stomach of Atp4bCre;Rosa26NICD mice (Fig. S1 D), we deleted one copy of Arid1a in this model (Atp4bCre;Rosa26NICD;Arid1aflox/+; Fig. S1 E). Compared with the Arid1a intact controls, mice with a single copy of Arid1a developed larger tumors (Fig. 1 G), and further histological analyses revealed enhanced glandular hyperplasia at 10 wk (Fig. 1, H and I). In addition, staining for the proliferation marker, Ki67, identified an increased number of proliferating cells in Arid1a heterozygous adenomas compared with Arid1a intact adenomas, suggesting that the enhanced tumor growth may be due in part to increased proliferation (Fig. 1, J and K).
To further characterize the effect of Arid1a loss in our gastric tumor model, we analyzed the tumors using additional features indicative of tumor progression (Table S1). In a comparison with Arid1a intact adenomas, we found enhanced intestinal metaplasia at 10 wk and a significant increase in inflammation and foveolar hyperplasia at 25 wk in Arid1a heterozygous adenomas (Fig. 1 L; and Fig. S1, F and G). By combining these disease features, we calculated a cumulative disease score and found a significantly increased score in Arid1a heterozygous adenoma mice compared with Arid1a intact adenoma mice (Fig. 1 M). Additional scoring of tumors at 25 wk showed a significant increase in the number of tumors with high-grade dysplasia for Arid1a heterozygous adenoma mice compared with the Arid1a intact adenoma mice (Fig. 1 N). Together, this work demonstrates, for the first time, a tumor-suppressive in vivo role for Arid1a in gastric tumor progression.
Global loss of active enhancer marks and down-regulation of the p53 and apoptosis pathway genes by Arid1a heterozygosity
To define the chromatin changes induced by Arid1a heterozygosity in our adenoma model, we performed chromatin immunoprecipitation sequencing (ChIP-seq) with gastric epithelial cells isolated from both Arid1a intact and heterozygous adenoma mice, as well as from normal (Cre− control) mice. We then analyzed histone modifications for active cis-regulatory elements (i.e., H3K27ac, H3K4me3) typically regulated by the BAF complex (Fig. 2 A). We observed an overall increase in the number of H3K27ac and H3K4me3 peaks in the Arid1a intact tumors compared with the normal stomachs (Fig. 2 B and Fig. S2 A). However, the loss of one copy of Arid1a led to a dramatic reduction in the number of peaks across the genome (Fig. 2 B and Fig. S2 A). Since H3K27ac marks both active promoter and enhancer regions, we categorized the peaks into either enhancers or promoters based on proximity to the transcriptional start site (Fig. S2 B). Strikingly, we found that a majority of both promoter and enhancer peaks were lost in Arid1a heterozygous tumors compared with Arid1a intact tumors; 11,067 promoter and 7,354 enhancer regions were unique to Arid1a intact tumors (Fig. 2 C and Table S2). While pathway enrichment analysis did not identify any pathways unique to promoter peaks in Arid1a intact tumors (Fig. S2 C), we found an enrichment for enhancer peaks related to apoptosis genes, such as Casp8 and Fos, in the Arid1a intact tumors but not the Arid1a heterozygous tumors (Fig. 2, D and E). Transcription factor motif analysis identified enrichment of Notch effectors, HES1 and HES7, in common (Arid1a intact and heterozygous) enhancer peaks, supporting Arid1a- and Notch signaling–mediated gastric tumor progression (Fig. S2 D).

Chromatin and gene expression analyses of gastric adenomas with and without Arid1a heterozygosity. (A) Experimental overview of chromatin and transcriptomic analyses performed using normal (wild-type) stomachs and Arid1a intact and Arid1a heterozygous gastric tumors. (B) Analysis of common H3K27ac peaks across replicates (n = 2 each) shows a drastic reduction in peak number in Arid1a heterozygous tumors compared with Arid1a intact tumors. (C) Venn diagrams outlining the number of H3K27ac marked peaks associated with enhancers and promoters that are common and unique to Arid1a intact and Arid1a heterozygous tumors. (D) Kyoto Encyclopedia of Genes and Genomes (KEGG) pathway enrichment analysis of enhancer elements unique to Arid1a intact tumor exhibits an enrichment in loci associated with apoptosis (red arrowhead). For Arid1a intact–specific enhancers, the top 2,000 enhancer peaks were used for analysis. (E) H3K27ac ChIP-seq–derived peak tracks of genes involved in apoptosis display a loss in peak signal at enhancer regions of Arid1a heterozygous tumors compared with Arid1a intact counterparts. Enhancer regions are outlined by a green box. (F) Analysis of the number of dysregulated genes that lose enhancer- and promoter-specific H3K27ac in Arid1a heterozygous tumors compared with Arid1a intact tumors. (G) A global heatmap of all the dysregulated genes between wild-type stomachs (n = 3), Arid1a intact tumors (n = 3), and Arid1a heterozygous tumors (n = 3) identifies four groups of dysregulated genes. Groups A and B are genes up-regulated and down-regulated in all tumor samples, respectively, regardless of Arid1a status. Group C comprises genes up-regulated in Arid1a intact tumors only, and group D comprises genes that are only down-regulated in Arid1a intact tumors. (H) KEGG pathway enrichment analysis of the four groups does not enrich for any specific pathways in group A, but apoptosis and p53 signaling are uniquely enriched in group C (red arrowheads). AGE, advanced glycation end products; RAGE, receptor for advanced glycation end products. (I) A higher-resolution heatmap of p53 signaling pathway and apoptosis-related genes highlights the up-regulation of these genes in Arid1a intact but not Arid1a heterozygous tumors when compared with wild-type gastric tissue. (J) RT-qPCR of Arid1a expression in the epithelial cells of Arid1a heterozygous tumors compared with Arid1a intact tumors confirms down-regulation of Arid1a (**, P = 0.01, unpaired t test). Bars represent mean ± SEM. (K) Enrichment analysis of the overlap between H3K27ac signal and the enhancers of apoptosis and p53 signaling pathway genes shows an increased overlapping odds ratio for Arid1a intact tumors (n = 2) compared with Arid1a heterozygous tumors (n = 2). The orange diamond shows the true overlap between H3K27ac signal and the enhancers in each condition, and the box plot indicates background overlap.
Chromatin and gene expression analyses of gastric adenomas with and without Arid1a heterozygosity. (A) Experimental overview of chromatin and transcriptomic analyses performed using normal (wild-type) stomachs and Arid1a intact and Arid1a heterozygous gastric tumors. (B) Analysis of common H3K27ac peaks across replicates (n = 2 each) shows a drastic reduction in peak number in Arid1a heterozygous tumors compared with Arid1a intact tumors. (C) Venn diagrams outlining the number of H3K27ac marked peaks associated with enhancers and promoters that are common and unique to Arid1a intact and Arid1a heterozygous tumors. (D) Kyoto Encyclopedia of Genes and Genomes (KEGG) pathway enrichment analysis of enhancer elements unique to Arid1a intact tumor exhibits an enrichment in loci associated with apoptosis (red arrowhead). For Arid1a intact–specific enhancers, the top 2,000 enhancer peaks were used for analysis. (E) H3K27ac ChIP-seq–derived peak tracks of genes involved in apoptosis display a loss in peak signal at enhancer regions of Arid1a heterozygous tumors compared with Arid1a intact counterparts. Enhancer regions are outlined by a green box. (F) Analysis of the number of dysregulated genes that lose enhancer- and promoter-specific H3K27ac in Arid1a heterozygous tumors compared with Arid1a intact tumors. (G) A global heatmap of all the dysregulated genes between wild-type stomachs (n = 3), Arid1a intact tumors (n = 3), and Arid1a heterozygous tumors (n = 3) identifies four groups of dysregulated genes. Groups A and B are genes up-regulated and down-regulated in all tumor samples, respectively, regardless of Arid1a status. Group C comprises genes up-regulated in Arid1a intact tumors only, and group D comprises genes that are only down-regulated in Arid1a intact tumors. (H) KEGG pathway enrichment analysis of the four groups does not enrich for any specific pathways in group A, but apoptosis and p53 signaling are uniquely enriched in group C (red arrowheads). AGE, advanced glycation end products; RAGE, receptor for advanced glycation end products. (I) A higher-resolution heatmap of p53 signaling pathway and apoptosis-related genes highlights the up-regulation of these genes in Arid1a intact but not Arid1a heterozygous tumors when compared with wild-type gastric tissue. (J) RT-qPCR of Arid1a expression in the epithelial cells of Arid1a heterozygous tumors compared with Arid1a intact tumors confirms down-regulation of Arid1a (**, P = 0.01, unpaired t test). Bars represent mean ± SEM. (K) Enrichment analysis of the overlap between H3K27ac signal and the enhancers of apoptosis and p53 signaling pathway genes shows an increased overlapping odds ratio for Arid1a intact tumors (n = 2) compared with Arid1a heterozygous tumors (n = 2). The orange diamond shows the true overlap between H3K27ac signal and the enhancers in each condition, and the box plot indicates background overlap.

Chromatin and transcriptomic analyses of Arid1a intact tumors and Arid1a heterozygous tumors. (A) Number of H3K4me3 and H3K27ac peaks per biological replicate in the wild-type stomach and Arid1a intact and Arid1a heterozygous tumors. (B) Feature distribution of all H3K27ac peaks (top), promoter peaks (middle), and enhancer peaks (bottom) specific to either Arid1a intact tumors or Arid1a heterozygous tumors or shared between both. UTR, untranslated region. (C) Kyoto Encyclopedia of Genes and Genomes (KEGG) pathway enrichment analysis of promoter H3K27ac peaks that are specific to or shared between Arid1a intact and Arid1a heterozygous tumors. EGFR, epidermal growth factor receptor. (D) Motif enrichment analysis of H3K27 peaks of Arid1a intact and Arid1a heterozygous tumors. PWM, position weight matrix. (E) RT-qPCR of p53- and apoptosis-related genes in Arid1a intact and Arid1a heterozygous tumors. Bars represent mean ± SEM. (F) FACS plots of annexin V and PI staining of epithelial cells isolated from Arid1a intact and Arid1a heterozygous tumors at 10 wk of age. (G) Quantification of annexin V+ and PI+ epithelial cells isolated from 10-wk-old Arid1a intact and Arid1a heterozygous tumors shows significant reduction of late-stage apoptotic cells (annexin V+ PI+) in Arid1a heterozygous tumors compared with Arid1a intact tumors (P = 0.0096, unpaired t test). Bars represent mean ± SEM. (H) Representative images of cleaved caspase-3 staining in normal stomach and Arid1a heterozygous tumors. Arrowheads indicate cleaved caspase-3+ cells. (n = 7 and n = 5, respectively). Scale bar, 100 µm. (I) Quantification of the number of cleaved caspase-3+ cells in the normal stomachs and Arid1a heterozygous tumors (unpaired t test). Bars represent mean ± SEM. (J) Representative images of p53 staining in normal stomach and Arid1a heterozygous tumors. Arrowheads indicate p53+ cells. (n = 4 and n = 3, respectively). Scale bar, 100 µm. (K) Quantification of the number of p53+ cells in the normal stomachs and Arid1a heterozygous tumors (unpaired t test). Bars represent mean ± SEM. (L) Analysis of TP53 mutation status in human gastric cancer cases with or without ARID1A alterations using TCGA-STAD data. (M) Gene set enrichment analysis of mismatch repair pathway using RNA-seq data of normal stomach, Arid1a intact tumors, and Arid1a heterozygous tumors. FDR, false discovery rate. (N) PCR analysis of mononucleotide repeat loci in the Arid1a intact and Arid1a heterozygous tumor mice. Left: An example of peak spectra indicating the size of the PCR product obtained from epithelial cells isolated from tumor and adjacent benign (antrum) regions. Right: Summary of the differences in PCR product size obtained from epithelial cells isolated from tumor and adjacent benign region using the corresponding primers (Bacher et al., 2005).
Chromatin and transcriptomic analyses of Arid1a intact tumors and Arid1a heterozygous tumors. (A) Number of H3K4me3 and H3K27ac peaks per biological replicate in the wild-type stomach and Arid1a intact and Arid1a heterozygous tumors. (B) Feature distribution of all H3K27ac peaks (top), promoter peaks (middle), and enhancer peaks (bottom) specific to either Arid1a intact tumors or Arid1a heterozygous tumors or shared between both. UTR, untranslated region. (C) Kyoto Encyclopedia of Genes and Genomes (KEGG) pathway enrichment analysis of promoter H3K27ac peaks that are specific to or shared between Arid1a intact and Arid1a heterozygous tumors. EGFR, epidermal growth factor receptor. (D) Motif enrichment analysis of H3K27 peaks of Arid1a intact and Arid1a heterozygous tumors. PWM, position weight matrix. (E) RT-qPCR of p53- and apoptosis-related genes in Arid1a intact and Arid1a heterozygous tumors. Bars represent mean ± SEM. (F) FACS plots of annexin V and PI staining of epithelial cells isolated from Arid1a intact and Arid1a heterozygous tumors at 10 wk of age. (G) Quantification of annexin V+ and PI+ epithelial cells isolated from 10-wk-old Arid1a intact and Arid1a heterozygous tumors shows significant reduction of late-stage apoptotic cells (annexin V+ PI+) in Arid1a heterozygous tumors compared with Arid1a intact tumors (P = 0.0096, unpaired t test). Bars represent mean ± SEM. (H) Representative images of cleaved caspase-3 staining in normal stomach and Arid1a heterozygous tumors. Arrowheads indicate cleaved caspase-3+ cells. (n = 7 and n = 5, respectively). Scale bar, 100 µm. (I) Quantification of the number of cleaved caspase-3+ cells in the normal stomachs and Arid1a heterozygous tumors (unpaired t test). Bars represent mean ± SEM. (J) Representative images of p53 staining in normal stomach and Arid1a heterozygous tumors. Arrowheads indicate p53+ cells. (n = 4 and n = 3, respectively). Scale bar, 100 µm. (K) Quantification of the number of p53+ cells in the normal stomachs and Arid1a heterozygous tumors (unpaired t test). Bars represent mean ± SEM. (L) Analysis of TP53 mutation status in human gastric cancer cases with or without ARID1A alterations using TCGA-STAD data. (M) Gene set enrichment analysis of mismatch repair pathway using RNA-seq data of normal stomach, Arid1a intact tumors, and Arid1a heterozygous tumors. FDR, false discovery rate. (N) PCR analysis of mononucleotide repeat loci in the Arid1a intact and Arid1a heterozygous tumor mice. Left: An example of peak spectra indicating the size of the PCR product obtained from epithelial cells isolated from tumor and adjacent benign (antrum) regions. Right: Summary of the differences in PCR product size obtained from epithelial cells isolated from tumor and adjacent benign region using the corresponding primers (Bacher et al., 2005).
To determine if the changed H3K27ac landscape due to Arid1a heterozygosity influences downstream gene expression, we also performed RNA sequencing (RNA-seq) under the same conditions (Fig. 2 A). Of the genes that have lost promoter and enhancer H3K27ac marks in Arid1a heterozygous tumors compared with Arid1a intact tumors, 208 and 171 genes, respectively, were down-regulated (Fig. 2 F). We also found that Arid1a heterozygous tumors have an expression profile more similar to that of normal stomachs than Arid1a intact tumors (Fig. 2 G). We then further categorized the dysregulated genes into four groups: (A) genes that are up-regulated in both Arid1a intact and Arid1a heterozygous tumors compared with normal stomachs, (B) genes that are down-regulated in both Arid1a intact and Arid1a heterozygous tumors compared with normal stomachs, (C) genes that are up-regulated in Arid1a intact tumors but not in Arid1a heterozygous tumors when compared with normal stomachs, and (D) genes that are down-regulated in Arid1a intact tumors but not in Arid1a heterozygous tumors when compared with normal stomachs (Fig. 2 G and Table S3). Group C and D contained genes that are dysregulated between the Arid1a intact tumors and Arid1a heterozygous tumors. To study the function of these genes, we performed pathway enrichment analysis for groups B, C, and D and found apoptosis and p53 signaling to be enriched in group C, while processes related to fatty acid metabolism were enriched in group D (Fig. 2, H and I). To validate our findings, we performed quantitative RT-PCR (RT-qPCR) using gastric epithelial cells isolated from Arid1a intact and Arid1a heterozygous tumors. We found that expression levels of Arid1a as well as p53 pathway and apoptosis genes, such as Fos, Bax, and Casp8, are significantly down-regulated in Arid1a heterozygous tumors compared with Arid1a intact tumors (Fig. 2 J and Fig. S2 E). To quantitatively analyze apoptosis using flow cytometry, we isolated epithelial cells (epithelial cell adhesion molecule positive [Epcam+]) from tumors and stained them with annexin V and propidium iodide (PI). While there was no difference in the proportion of cells undergoing early apoptosis (annexin V+ PI−), we found a significant reduction of late apoptotic cells (annexin V+ PI+) in Arid1a heterozygous tumors compared with Arid1a intact tumors (Fig. S2, F and G). Although a downward trend was observed, cleaved caspase-3 antibody staining did not show a significant reduction of apoptotic cells in Arid1a heterozygous tumors compared with Arid1a intact tumors (Fig. S2, H and I). These data suggest that the loss of one copy of Arid1a results in a moderate suppression of apoptosis, leading to the increased tumor growth observed in gastric tumors at later stages (25 wk). We were also unable to identify a significant difference in expression of p53 proteins between Arid1a intact or Arid1a heterozygous tumors, suggesting that the activation of p53 signaling and apoptosis observed in our tumor model may be caused by activation of enhancers and genes downstream of p53 rather than the accumulation of p53 protein itself (Fig. S2, J and K).
To determine whether the enhancers activated in Arid1a intact tumors were also associated with the p53 and apoptosis pathway genes, we calculated the overlap between the H3K27ac peaks in Arid1a intact tumors and potential enhancer regions (±50 kb to approximately ±2 kb from transcription start sites) of the p53 and apoptosis pathway genes. We then compared it with the genome background (the overlap between those H3K27ac peaks enhancer regions of random genes). Indeed, we observed a significant increase in the overlap between the H3K27ac peaks in the Arid1a intact tumors and apoptosis/p53 pathway enhancer regions compared with the background. However, this overlap was markedly reduced in Arid1a heterozygous tumors, suggesting Arid1a heterozygosity-mediated regulation of apoptosis/p53 pathway enhancers (Fig. 2 K). Together, these experiments showed that heterozygous deletion of Arid1a in gastric tumors leads to a global loss of H3K27ac marked enhancers and the subsequent down-regulation of genes involved in the p53 and apoptotic pathways, potentially contributing to tumor progression.
To examine possible alternative mechanisms, we further analyzed the nature of ARID1A mutations found in human GC molecular subtypes. ARID1A mutations have been shown to be enriched in the genomically stable subtype of human GC, while TP53 mutations are enriched in the chromosomal instability subtype (The Cancer Genome Atlas Research Network, 2014). Since many human GC samples heterozygous for ARID1A harbor TP53 mutations (Fig. S2 L), we examined the relationship between the Arid1a deletion in our model and genome stability. Since mismatch repair is known to be important for maintaining genome stability (Li, 2008), we performed gene set enrichment analysis of mismatch repair pathways using our RNA-seq data. We found a significant enrichment of the mismatch repair pathway in Arid1a intact tumors compared with normal stomachs, while there was no significant enrichment or depletion of mismatch repair genes in Arid1a heterozygous tumors when compared with Arid1a intact tumors (Fig. S2 M). PCR analysis using a panel of high-sensitivity mononucleotide repeat loci did not identify high levels of microsatellite instability in either Arid1a intact or Arid1a heterozygous tumors (Fig. S2 N; Bacher et al., 2005). These findings suggest that both Notch-activated gastric adenomas, with or without single-copy Arid1a deletion, do not confer genomic instability associated with dysregulation of mismatch repair.
Arid1a plays cell type–specific roles during adult gastric homeostasis
The reported roles of Arid1a in the gastrointestinal tract are highly tissue specific: deletion of Arid1a in the colon led to adenoma development, while Arid1a loss in the small intestine depleted stem cells and disrupted villi formation but did not form tumors (Hiramatsu et al., 2019; Mathur et al., 2017). Therefore, we also addressed the role of Arid1a during epithelial homeostasis in the adult stomach. Costaining of ARID1A with markers of parietal cells (H+-K+-ATPase), proliferating cells (proliferating cell nuclear antigen [PCNA]), pit cells (periodic acid-Schiff [PAS]), and chief cells (intrinsic factor) in the gastric epithelium showed that it is expressed ubiquitously in both differentiated and progenitor cells (Fig. S3, A–D).

Analysis of cell type–specific ARID1A loss during adult gastric homeostasis. (A) Costaining of ARID1A and parietal cell marker, H+-K+-ATPase. Arrowheads indicate examples of H+-K+-ATPase and ARID1A double positive cells. Scale bar, 100 µm. (B) Costaining of ARID1A and proliferating cell marker PCNA. Arrowheads indicate examples of PCNA and ARID1A double positive cells. Scale bar, 100 µm. (C) Costaining of ARID1A with PAS staining, which labels gastric pit cells. Arrowheads indicate examples of PAS and ARID1A double positive cells. Scale bar, 100 µm. (D) Staining of ARID1A and chief cell marker, intrinsic factor using serial histological sections. Scale bar, 100 µm. (E) Representative immunofluorescence images of ARID1A and H+-K+-ATPase costaining in the murine stomachs of normal (wild-type) and parietal cell–specific deletion of Arid1a, displaying effective deletion of Arid1a in target cells (n = 3). Scale bar, 100 µm. (F) Representative histological images of normal stomach and the stomach of mice with one or both copies Arid1a deleted in parietal cells (n = 3 each). Scale bar, 100 µm. (G) Representative images of cleaved caspase-3 staining in normal stomach and the stomach of mice with one or both copies Arid1a deleted in parietal cells; arrowhead denotes cleaved caspase-3+ cells (n = 3 each). Scale bar, 100 µm. (H) Representative images of p53 staining in normal stomach and the stomach of mice with one or both copies Arid1a deleted in parietal cells (n = 3 each). Scale bar, 100 µm. (I) Expression of membrane GFP in the stomach of Mist1CreERT2;Rosa26mT/mG mice 2 d after the last dose of tamoxifen injection. Scale bar, 100 µm. (J) Staining of ARID1A in the stomach of Mist1CreERT2;Arid1aflox/flox and injected Cre− control mice 6 w.p.i., showing effective deletion of ARID1A in a large region of the stomach epithelium. Dotted white lines outline individual glands, and asterisk indicates a cystic region in Mist1CreERT2;Arid1aflox/flox mice (n = 3 each). Scale bar, 100 µm. (K) Representative images of cleaved caspase-3 staining in the stomach of Mist1CreERT2;Arid1aflox/+, Mist1CreERT2;Arid1aflox/flox, and injected control mice at 6 w.p.i. (n = 3 each). Scale bar, 100 µm. (L) Representative images of p53 staining in the stomach of Mist1CreERT2;Arid1aflox/+, Mist1CreERT2;Arid1aflox/flox, and injected control mice at 6 w.p.i. (n = 3 each). Scale bar, 100 µm.
Analysis of cell type–specific ARID1A loss during adult gastric homeostasis. (A) Costaining of ARID1A and parietal cell marker, H+-K+-ATPase. Arrowheads indicate examples of H+-K+-ATPase and ARID1A double positive cells. Scale bar, 100 µm. (B) Costaining of ARID1A and proliferating cell marker PCNA. Arrowheads indicate examples of PCNA and ARID1A double positive cells. Scale bar, 100 µm. (C) Costaining of ARID1A with PAS staining, which labels gastric pit cells. Arrowheads indicate examples of PAS and ARID1A double positive cells. Scale bar, 100 µm. (D) Staining of ARID1A and chief cell marker, intrinsic factor using serial histological sections. Scale bar, 100 µm. (E) Representative immunofluorescence images of ARID1A and H+-K+-ATPase costaining in the murine stomachs of normal (wild-type) and parietal cell–specific deletion of Arid1a, displaying effective deletion of Arid1a in target cells (n = 3). Scale bar, 100 µm. (F) Representative histological images of normal stomach and the stomach of mice with one or both copies Arid1a deleted in parietal cells (n = 3 each). Scale bar, 100 µm. (G) Representative images of cleaved caspase-3 staining in normal stomach and the stomach of mice with one or both copies Arid1a deleted in parietal cells; arrowhead denotes cleaved caspase-3+ cells (n = 3 each). Scale bar, 100 µm. (H) Representative images of p53 staining in normal stomach and the stomach of mice with one or both copies Arid1a deleted in parietal cells (n = 3 each). Scale bar, 100 µm. (I) Expression of membrane GFP in the stomach of Mist1CreERT2;Rosa26mT/mG mice 2 d after the last dose of tamoxifen injection. Scale bar, 100 µm. (J) Staining of ARID1A in the stomach of Mist1CreERT2;Arid1aflox/flox and injected Cre− control mice 6 w.p.i., showing effective deletion of ARID1A in a large region of the stomach epithelium. Dotted white lines outline individual glands, and asterisk indicates a cystic region in Mist1CreERT2;Arid1aflox/flox mice (n = 3 each). Scale bar, 100 µm. (K) Representative images of cleaved caspase-3 staining in the stomach of Mist1CreERT2;Arid1aflox/+, Mist1CreERT2;Arid1aflox/flox, and injected control mice at 6 w.p.i. (n = 3 each). Scale bar, 100 µm. (L) Representative images of p53 staining in the stomach of Mist1CreERT2;Arid1aflox/+, Mist1CreERT2;Arid1aflox/flox, and injected control mice at 6 w.p.i. (n = 3 each). Scale bar, 100 µm.
To examine the role of Arid1a in adult gastric homeostasis, we conditionally deleted one or both copies of Arid1a in gastric parietal cells (Atp4bCre;Arid1aflox/+ and Atp4bCre;Arid1aflox/flox). Costaining of ARID1A and H+-K+-ATPase showed the specific deletion of Arid1a in parietal cells (Fig. S3 E). While we observed no abnormal phenotypes at 10 wk, histological analysis of mutant mice revealed regions of foveolar hyperplasia in the corpus of Arid1a homozygous mice but not heterozygous or Cre− mice at 25 wk (Fig. 3 A and Fig. S3 F). These features of foveolar hyperplasia include a basal restriction of H+-K+-ATPase+ parietal cells and a caudal extension of surface pit cells (Petersen et al., 2017). PAS staining for pit cells and immunofluorescence staining for parietal cells confirmed hyperplastic features (Fig. 3, B and C). Although Ki67 antibody staining showed an increased number of proliferating cells in the corpus of both Arid1a heterozygous and Arid1a homozygous mice, we observed no adenoma formation (Fig. 3, D and E). Since p53 signaling and apoptosis are suppressed in Arid1a heterozygous tumors, we also analyzed cleaved caspase-3 and p53 staining in Arid1a heterozygous and Arid1a homozygous mice. We did not identify any changes in cleaved caspase-3 protein expression between Cre− controls and mutants, and we found no visible expression of p53 protein in mutant mice (Fig. S3, G and H). This finding indicates that Arid1a is required to maintain adult gastric homeostasis, but its partial or complete loss in parietal cells does not efficiently drive tumor initiation.

The role of Arid1a in adult stomach homeostasis. (A) Parietal cell–specific Arid1a deletion in aged mice exhibits regions of hyperplasia at 25 wk when compared with wild-type and Arid1a heterozygous mice. Asterisk marks the hyperplastic region (n = 3 each). Scale bar, 100 µm. (B) Representative images of PAS staining of the stomach epithelia reveal basal extension of PAS+ cells in the hyperplastic regions of the Arid1a-deleted mice. Asterisk marks PAS+ hyperplastic regions in mutant samples (n = 3 each). Scale bar, 100 µm. (C) Representative immunofluorescence images of H+-K+-ATPase staining of the gastric epithelium shows a loss of H+-K+-ATPase+ parietal cells in the hyperplastic regions of Atp4bCre;Arid1aflox/flox mice, labeled by the asterisk (n = 3 each). Scale bar, 100 µm. (D) Representative images of Ki67 staining in the gastric epithelia (n = 3 each). Scale bar, 100 µm. (E) Quantification of Ki67 staining shows an increase in the number of proliferative cells in Atp4bCre;Arid1aflox/+ and Atp4bCre;Arid1aflox/flox mice compared with Cre− controls (***, P < 0.001, unpaired t test). Bars represent mean ± SEM. (F) Deletion of either one copy or both copies of Arid1a in MIST1+ cells 6 w.p.i. leads to the formation of cystic structures (marked by asterisk). These cystic structures are not found in the injected Cre− controls (n = 3 each). Scale bar, 100 µm. (G) Representative images of PAS staining did not identify extension of PAS+ cells along the cystic glands (n = 3 each). Scale bar, 100 µm. (H) Representative images of H+-K+-ATPase staining show the loss of parietal cells in the aforementioned cystic regions (n = 3 each). Scale bar, 100 µm. (I) Representative images of Ki67 staining in the gastric epithelium (n = 3 each). Scale bar, 100 µm. (J) Quantification of Ki67 staining shows no significant changes in the number of proliferative cells in Mist1CreERT2;Arid1aflox/+ or Mist1CreERT2;Arid1aflox/flox compared with injected controls (unpaired t test). Bars represent mean ± SEM.
The role of Arid1a in adult stomach homeostasis. (A) Parietal cell–specific Arid1a deletion in aged mice exhibits regions of hyperplasia at 25 wk when compared with wild-type and Arid1a heterozygous mice. Asterisk marks the hyperplastic region (n = 3 each). Scale bar, 100 µm. (B) Representative images of PAS staining of the stomach epithelia reveal basal extension of PAS+ cells in the hyperplastic regions of the Arid1a-deleted mice. Asterisk marks PAS+ hyperplastic regions in mutant samples (n = 3 each). Scale bar, 100 µm. (C) Representative immunofluorescence images of H+-K+-ATPase staining of the gastric epithelium shows a loss of H+-K+-ATPase+ parietal cells in the hyperplastic regions of Atp4bCre;Arid1aflox/flox mice, labeled by the asterisk (n = 3 each). Scale bar, 100 µm. (D) Representative images of Ki67 staining in the gastric epithelia (n = 3 each). Scale bar, 100 µm. (E) Quantification of Ki67 staining shows an increase in the number of proliferative cells in Atp4bCre;Arid1aflox/+ and Atp4bCre;Arid1aflox/flox mice compared with Cre− controls (***, P < 0.001, unpaired t test). Bars represent mean ± SEM. (F) Deletion of either one copy or both copies of Arid1a in MIST1+ cells 6 w.p.i. leads to the formation of cystic structures (marked by asterisk). These cystic structures are not found in the injected Cre− controls (n = 3 each). Scale bar, 100 µm. (G) Representative images of PAS staining did not identify extension of PAS+ cells along the cystic glands (n = 3 each). Scale bar, 100 µm. (H) Representative images of H+-K+-ATPase staining show the loss of parietal cells in the aforementioned cystic regions (n = 3 each). Scale bar, 100 µm. (I) Representative images of Ki67 staining in the gastric epithelium (n = 3 each). Scale bar, 100 µm. (J) Quantification of Ki67 staining shows no significant changes in the number of proliferative cells in Mist1CreERT2;Arid1aflox/+ or Mist1CreERT2;Arid1aflox/flox compared with injected controls (unpaired t test). Bars represent mean ± SEM.
MIST1 not only is a marker of mature chief cells found at the base of gastric glands but also has been shown to label quiescent stem cells that can act as the cell of origin for GC (Hayakawa et al., 2015; Stange et al., 2013). We confirmed Mist1-Cre expression by short-term tamoxifen studies (Fig. S3 I). To determine if Arid1a loss in MIST1+ cells can drive tumor initiation, we also generated mice with one or both copies of Arid1a deleted in MIST1+ cells (Mist1CreERT2;Arid1aflox/+ and Mist1CreERT;Arid1aflox/flox). At 6 wk post-induction (w.p.i.), a large number of corpus epithelial cells were depleted of ARID1A (Fig. S3 J). Interestingly, we identified rare foci of abnormal cystlike structures in the gastric epithelium of both heterozygous and homozygous mice (Fig. 3 F). These foci were also depleted of parietal cells, but they did not display signs of foveolar hyperplasia, indicated by the restriction of PAS staining to the pit of the glands (Fig. 3, G and H). Consistently, we were unable to identify any significant increase in the number of Ki67+ proliferative cells (Fig. 3, I and J). We were also unable to detect apoptotic or p53+ cells in the abnormal glands (Fig. S3, K and L). Taken together, these experiments suggest that while the partial loss of Arid1a is sufficient to significantly promote tumor progression in the Notch signaling-activated adenoma model, its deletion alone in parietal cells or MIST1+ cells does not seem to efficiently drive tumor initiation.
Arid1a homozygous deletion confers competitive disadvantage through up-regulation of the p53 apoptotic pathway
Only a small subset of patients within the available TCGA GC cohort displayed homozygous deletion of Arid1a, implying its dose-dependent roles in a clinical setting (Fig. 1 D). To determine if the homozygous deletion of Arid1a also promotes gastric tumor progression, we deleted both copies of Arid1a alleles in our gastric adenoma model (Atp4bCre;Rosa26NICD;Arid1aflox/flox). Interestingly, while immunofluorescence staining revealed an efficient deletion of Arid1a at early stages, ARID1A− cells were progressively outcompeted by ARID1A+Cre escaper cells at advanced stages (Fig. 4, A and B). To assess if ARID1A+ escaper cells may exhibit stem cell–like traits and confer a selective growth advantage within Arid1a homozygous tumors, we stained for a GC stem cell marker, CD44 (Takaishi et al., 2009). Interestingly, both ARID1A+ and ARID1A− cells expressed CD44 (Fig. S4 A), suggesting that alternative mechanisms might be at play in attributing a fitness advantage to escaped tumor cells.

Single-cell analysis of Arid1a-knockout gastric adenoma epithelium. (A) Immunofluorescence images of ARID1A staining in Arid1a-deleted gastric adenomas at early and late stages (n = 6–7 each) demonstrate repopulation of adenomatous glands by ARID1A+ cells at 25 wk. The white dotted line outlines the epithelium without ARID1A staining in late-stage tumors. Scale bar, 100 µm. (B) Quantification of the percentage of ARID1A+ epithelial cells at different stages confirms a progressive increase of ARID1A+ cells over time (***, P = 2.2 × 10⁻⁴ between 10 wk and 20 wk and P = 8.5 × 10⁻⁵ between 10 wk and 25 wk, unpaired t test). Bars represent mean ± SEM. (C) Experimental overview of single-cell analysis of gastric adenomas with Arid1a deletion at a late stage of tumor progression. (D) Clustering analysis of scRNA-seq data from Arid1a-deleted gastric adenomas identifies nine clusters of cells with distinct expression profiles. (E) Violin plots depicting Arid1a expression among the nine clusters of cells identifies clusters 2 and 3 to have lower Arid1a expression than the other clusters. (F) Kyoto Encyclopedia of Genes and Genomes (KEGG) pathway enrichment analysis of clustering markers found an enrichment of the p53 signaling pathway (red arrowhead) in clusters 2 and 3 but not in the other clusters. (G) Feature plots of the scRNA-seq data show a negative correlation between Arid1a expression and the expression of genes related to p53 signaling and apoptosis (dotted line outlines Arid1alow clusters). (H) Representative images of TUNEL and ARID1A immunofluorescence staining in Arid1a homozygous gastric adenomas; white arrowheads indicate TUNEL+ ARID1A− cells (n = 7). Scale bar, 100 µm. (I) Quantification of TUNEL+ cells confirms an increase in the percentage of TUNEL+ cells in the ARID1A− cell population compared with the ARID1A+ cell population (*, P = 0.024, paired t test). Bars represent mean ± SEM. (J) Analysis of common H3K27ac peaks across replicates (n = 2 each) shows an increase in peak number in Arid1a homozygous tumors compared with Arid1a heterozygous tumors. (K) Among all the enhancers associated with p53 signaling and apoptosis genes that lost H3K27 acetylation in Arid1a heterozygous tumors (black circle), a subset of these enhancers was reactivated in Arid1a homozygous tumors when compared with Arid1a intact tumors (red circle). (L) Representative H3K27ac ChIP-seq track of an apoptosis-related gene, Fos, with loss in peak signals at enhancer regions of Arid1a heterozygous tumors compared with Arid1a intact and reactivation of peak signals in Arid1a homozygous tumors. Enhancer regions are outlined by a green box. (M) KEGG pathway enrichment analysis of enhancer H3K27ac peaks shows enrichment of apoptosis in Arid1a intact and Arid1a homozygous tumors but not in Arid1a heterozygous tumors (red arrowhead). AMPK, 5′-AMP–activated protein kinase. (N) Enrichment analysis of the overlap between H3K27ac signal and the enhancers of apoptosis and p53 signaling pathway genes shows an increased overlapping odds ratio for Arid1a homozygous tumors. The orange diamond shows the true overlap between H3K27ac signal and the enhancers in each condition, and the box plot indicates background overlap.
Single-cell analysis of Arid1a-knockout gastric adenoma epithelium. (A) Immunofluorescence images of ARID1A staining in Arid1a-deleted gastric adenomas at early and late stages (n = 6–7 each) demonstrate repopulation of adenomatous glands by ARID1A+ cells at 25 wk. The white dotted line outlines the epithelium without ARID1A staining in late-stage tumors. Scale bar, 100 µm. (B) Quantification of the percentage of ARID1A+ epithelial cells at different stages confirms a progressive increase of ARID1A+ cells over time (***, P = 2.2 × 10⁻⁴ between 10 wk and 20 wk and P = 8.5 × 10⁻⁵ between 10 wk and 25 wk, unpaired t test). Bars represent mean ± SEM. (C) Experimental overview of single-cell analysis of gastric adenomas with Arid1a deletion at a late stage of tumor progression. (D) Clustering analysis of scRNA-seq data from Arid1a-deleted gastric adenomas identifies nine clusters of cells with distinct expression profiles. (E) Violin plots depicting Arid1a expression among the nine clusters of cells identifies clusters 2 and 3 to have lower Arid1a expression than the other clusters. (F) Kyoto Encyclopedia of Genes and Genomes (KEGG) pathway enrichment analysis of clustering markers found an enrichment of the p53 signaling pathway (red arrowhead) in clusters 2 and 3 but not in the other clusters. (G) Feature plots of the scRNA-seq data show a negative correlation between Arid1a expression and the expression of genes related to p53 signaling and apoptosis (dotted line outlines Arid1alow clusters). (H) Representative images of TUNEL and ARID1A immunofluorescence staining in Arid1a homozygous gastric adenomas; white arrowheads indicate TUNEL+ ARID1A− cells (n = 7). Scale bar, 100 µm. (I) Quantification of TUNEL+ cells confirms an increase in the percentage of TUNEL+ cells in the ARID1A− cell population compared with the ARID1A+ cell population (*, P = 0.024, paired t test). Bars represent mean ± SEM. (J) Analysis of common H3K27ac peaks across replicates (n = 2 each) shows an increase in peak number in Arid1a homozygous tumors compared with Arid1a heterozygous tumors. (K) Among all the enhancers associated with p53 signaling and apoptosis genes that lost H3K27 acetylation in Arid1a heterozygous tumors (black circle), a subset of these enhancers was reactivated in Arid1a homozygous tumors when compared with Arid1a intact tumors (red circle). (L) Representative H3K27ac ChIP-seq track of an apoptosis-related gene, Fos, with loss in peak signals at enhancer regions of Arid1a heterozygous tumors compared with Arid1a intact and reactivation of peak signals in Arid1a homozygous tumors. Enhancer regions are outlined by a green box. (M) KEGG pathway enrichment analysis of enhancer H3K27ac peaks shows enrichment of apoptosis in Arid1a intact and Arid1a homozygous tumors but not in Arid1a heterozygous tumors (red arrowhead). AMPK, 5′-AMP–activated protein kinase. (N) Enrichment analysis of the overlap between H3K27ac signal and the enhancers of apoptosis and p53 signaling pathway genes shows an increased overlapping odds ratio for Arid1a homozygous tumors. The orange diamond shows the true overlap between H3K27ac signal and the enhancers in each condition, and the box plot indicates background overlap.

Single-cell analysis of Arid1a homozygous tumor. (A) Representative immunofluorescence image of ARID1A and CD44 costaining of Arid1a homozygous tumors at 20 wk shows both ARID1A+ CD44+ (white arrowhead) and ARID1A− CD44+ (yellow arrowhead) cells (n = 3). Scale bar, 100 µm. (B) Immunofluorescence image of ARID1A staining of epithelial cells isolated from Arid1a homozygous tumors in preparation for scRNA-seq; the white arrowhead denotes the ARID1A− cells, and yellow arrowheads denote the ARID1A+ cells (n = 3). Scale bar, 100 µm. (C) GO term analysis of clustering markers of epithelial cells in Arid1a homozygous tumors. (D) Analysis of GO terms related to p53 signaling and apoptosis displays increased enrichment in clusters 2 and 3 compared with the other clusters. (E) Feature plots of the scRNA-seq data shows enriched expression of Trp53 in clusters 2 and 3 (dotted line). (F) Representative images of TUNEL staining in Arid1a homozygous gastric tumors at 10 and 20 wk (n = 4 and 7, respectively). Scale bar, 100 µm. (G) Quantification of TUNEL+ cells in Arid1a homozygous gastric tumors at 10 and 20 wk (*, P = 0.01, unpaired t test). Bars represent mean ± SD. (H) Number of H3K27ac peaks per replicate in normal Cre− stomach, Arid1a intact, Arid1a heterozygous, and Arid1a homozygous tumors. (I) Representative images of TUNEL fluorescence staining in Arid1a heterozygous and homozygous gastric tumors at 10 wk (n = 3 and 4, respectively). Scale bar, 100 µm. (J) Quantification of TUNEL+ cells in Arid1a heterozygous and homozygous gastric tumors at 10 wk (unpaired t test). Bars represent mean ± SD. (K) Expression of Arid1b in wild-type stomachs (n = 3), Arid1a intact tumors (n = 3), and Arid1a heterozygous tumors (n = 3) from RNA-seq (unpaired t test). (L) Violin plots of Arid1a and Arid1b expression from scRNA-seq of Arid1a homozygous tumors. (M) Representative images of ARID1A and ARID1B antibody staining in serial sections of 20-wk-old Arid1a homozygous tumors shows expression of ARID1B in both ARID1A− and ARID1A+ regions (n = 4). Scale bars, 100 μm.
Single-cell analysis of Arid1a homozygous tumor. (A) Representative immunofluorescence image of ARID1A and CD44 costaining of Arid1a homozygous tumors at 20 wk shows both ARID1A+ CD44+ (white arrowhead) and ARID1A− CD44+ (yellow arrowhead) cells (n = 3). Scale bar, 100 µm. (B) Immunofluorescence image of ARID1A staining of epithelial cells isolated from Arid1a homozygous tumors in preparation for scRNA-seq; the white arrowhead denotes the ARID1A− cells, and yellow arrowheads denote the ARID1A+ cells (n = 3). Scale bar, 100 µm. (C) GO term analysis of clustering markers of epithelial cells in Arid1a homozygous tumors. (D) Analysis of GO terms related to p53 signaling and apoptosis displays increased enrichment in clusters 2 and 3 compared with the other clusters. (E) Feature plots of the scRNA-seq data shows enriched expression of Trp53 in clusters 2 and 3 (dotted line). (F) Representative images of TUNEL staining in Arid1a homozygous gastric tumors at 10 and 20 wk (n = 4 and 7, respectively). Scale bar, 100 µm. (G) Quantification of TUNEL+ cells in Arid1a homozygous gastric tumors at 10 and 20 wk (*, P = 0.01, unpaired t test). Bars represent mean ± SD. (H) Number of H3K27ac peaks per replicate in normal Cre− stomach, Arid1a intact, Arid1a heterozygous, and Arid1a homozygous tumors. (I) Representative images of TUNEL fluorescence staining in Arid1a heterozygous and homozygous gastric tumors at 10 wk (n = 3 and 4, respectively). Scale bar, 100 µm. (J) Quantification of TUNEL+ cells in Arid1a heterozygous and homozygous gastric tumors at 10 wk (unpaired t test). Bars represent mean ± SD. (K) Expression of Arid1b in wild-type stomachs (n = 3), Arid1a intact tumors (n = 3), and Arid1a heterozygous tumors (n = 3) from RNA-seq (unpaired t test). (L) Violin plots of Arid1a and Arid1b expression from scRNA-seq of Arid1a homozygous tumors. (M) Representative images of ARID1A and ARID1B antibody staining in serial sections of 20-wk-old Arid1a homozygous tumors shows expression of ARID1B in both ARID1A− and ARID1A+ regions (n = 4). Scale bars, 100 μm.
To further elucidate the mechanisms underlying the survival advantage of ARID1A+ versus ARID1A− cells, we performed single-cell RNA-seq (scRNA-seq) on epithelial cells isolated from late-stage Atp4bCre;Rosa26NICD;Arid1aflox/flox tumors (Fig. 4 C). Consistent with our in vivo data, immunofluorescence staining for ARID1A on the sorted epithelial cells (Epcam+) showed both ARID1A+ and ARID1A− cells (Fig. S4 B). Principal component analysis of the single-cell data revealed nine distinct clusters (Fig. 4 D). To determine the cell types represented by each cluster, we performed gene ontology (GO) enrichment for biological processes using the associated clustering markers (Fig. S4 C and Table S4). While cluster 0 and cluster 6 were enriched for terms related to proliferation and active cell division, multiple terms related to apoptosis were enriched in cluster 2. Terms related to hypoxia were enriched in clusters. By categorizing each cluster based on Arid1a expression level, we identified two clusters (clusters 2 and 3) that had lower expression of Arid1a than the remaining clusters, which we termed the “Arid1alow clusters” (Fig. 4 E). These clusters would likely represent cells that lost both copies of Arid1a.
By performing pathway enrichment analysis on the top markers of the Arid1alow clusters, we found an enrichment of the p53 signaling pathway (Fig. 4 F). Analysis of the GO terms related to apoptosis also showed an increase in association with markers for clusters 2 and 3 compared with other cluster markers (Fig. S4 D). To further examine the correlation between p53 signaling and Arid1a expression in a single tumor, we analyzed the expression of various p53 signaling target genes. Expression levels of various players in the p53 pathway, such as Cdkn1a, Cdkn2a, Bax, Igfbp3, and Ccng1, were also found to be up-regulated in the Arid1alow clusters compared with the Arid1ahigh clusters (Fig. 4 G). Therefore, we conclude that the loss of fitness in tumors with Arid1a homozygous deletion is likely due to the activation of the p53 apoptotic pathway. Corroborating these data, Trp53 expression was enriched in the Arid1alow cluster cells (Fig. S4 E). To confirm that the Arid1alow cells indeed have increased apoptosis, we performed immunofluorescence staining for ARID1A and Tdt-mediated dUTP-biotin nick end labeling (TUNEL) and found more apoptotic cells that were ARID1A− than were ARID1A+ (Fig. 4, H and I). Consistent with the decrease in number of ARID1A− cells during tumor progression, we found a reduced number of apoptotic cells in 20-wk-old Arid1a homozygous tumors compared with those found in 10-wk-old Arid1a homozygous tumors (Fig. S4, F and G). These data suggest that tumor cells continuing to express ARID1A possess a selective advantage over ARID1A− cells.
To explore the molecular mechanism of p53 activation in ARID1A− tumor cells, we performed H3K27ac ChIP-seq with gastric epithelial cells isolated from Atp4bCre;Rosa26NICD;Arid1aflox/flox mice at 10 wk, when the majority of cells are ARID1A− (Fig. 4 A). We found that while there is a global reduction of H3K27ac peaks in Arid1a homozygous tumors compared with Arid1a intact tumors, there is an increased number of H3K27ac peaks when compared with Arid1a heterozygous tumors (Fig. 4 J and Fig. S4 H). We then isolated H3K27ac peaks associated with enhancers in Arid1a homozygous tumors and compared them with the enhancer peaks in Arid1a heterozygous tumors (Table S5). Notably, we found that a subset of enhancer peaks associated with p53 signaling and apoptosis genes, which are absent in Arid1a heterozygous tumors compared with Arid1a intact tumors, are reactivated in Arid1a homozygous tumors (Fig. 4, K and L). Similarly, pathway enrichment analysis showed that the apoptotic pathway is enriched in Arid1a intact and Arid1a homozygous tumors but not Arid1a heterozygous tumors (Fig. 4 M). Moreover, there was a significant overlap between the H3K27ac peaks in Arid1a homozygous tumors and enhancers of apoptosis/p53 pathway genes that were not observed in Arid1a heterozygous tumors (Fig. 4 N).
To further analyze any changes in apoptosis between Arid1a heterozygous and Arid1a homozygous tumors, we performed TUNEL staining for tumors at 10 wk. We observed a trend of increased apoptotic cells without significance in Arid1a homozygous tumors when compared with Arid1a heterozygous tumors (Fig. S4, I and J). Consistent with this trend, within Arid1a homozygous tumors, we observed a significant increase in apoptosis in ARID1A− tumor cells compared with escaped ARID1A+ tumor cells (Fig. 4, H and I). This difference in survival would likely increase the number of ARID1A+ cells over time (Fig. 4 B). Taken together, these experiments show that the complete deletion of Arid1a in tumor cells leads to enhancer activation and the up-regulation of apoptotic/p53 pathway genes, which may underlie the competitive disadvantage observed in ARID1A− tumor cells.
Since ARID1A and ARID1B serve as mutually exclusive subunits of the BAF complex (Wu et al., 2014), we asked if the loss of Arid1a is compensated by an increase in Arid1b expression. By analyzing our RNA-seq data, we found no significant differences in Arid1b expression in Arid1a heterozygous tumors compared with Arid1a intact tumors (Fig. S4 K). In addition, analysis of scRNA-seq data showed no obvious changes in Arid1b expression between Arid1alow clusters and Arid1ahigh clusters (Fig. S4 L). To assess ARID1B expression in ARID1A− cells, we performed ARID1A and ARID1B staining of serial sections and found that ARID1B is indeed expressed in both ARID1A− and ARID1A+ regions in Arid1a homozygous tumors (Fig. S4 M). Together, these data suggest that the loss of Arid1a does not alter Arid1b gene expression in our gastric adenoma model.
Trp53 deletion rescues fitness disadvantage in ARID1A− cells and promotes tumor invasion
To functionally determine if p53 signaling is required to drive the competitive disadvantage observed in ARID1A− cells in vivo, we conditionally deleted both Trp53 and Arid1a in our adenoma model (Atp4bCre;Rosa26NICD;Trp53flox/flox;Arid1aflox/flox). Immunofluorescence staining of ARID1A in the tumors showed that loss of Trp53 significantly recovers the population of ARID1A− tumor cells, demonstrating a partial rescue of fitness disadvantage in ARID1A− cells (Fig. 5, A and B; and Fig. S5 A). Interestingly, we found that while single mutants bear tumors contained in the lumen of the stomach, some Trp53−/−Arid1a−/− mice have visible tumors outside of the stomach, suggesting the presence of invasion (Fig. 5 C). Furthermore, while none of the Arid1a single mutants analyzed contained invasive tumors, 20% (2 of 10) of double-mutant mice showed early signs of invasion (classified as T1a), and 30% (3 of 10) had tumors that invaded the submucosa (termed “T4”; Fig. 5, D and E). Costaining of ARID1A and the epithelial cell marker, E-cadherin, in the regions of submucosal invasion of Atp4bCre;Rosa26NICD;Trp53flox/flox;Arid1aflox/flox mice showed that most E-cadherin+ tumor cells were ARID1A−, suggesting that Trp53 deletion in Arid1a-deleted cells promoted their invasiveness (Fig. S5 B).

Analysis of Trp53 and Arid1a interaction during gastric tumor progression. (A) Representative immunofluorescence images of ARID1A staining in gastric adenomas with the deletion of Arid1a alone or Arid1a and Trp53 together; the white dotted lines outline the boundary between the epithelium and mesenchyme (n = 5–7 each). Scale bar, 100 µm. (B) Quantification of ARID1A-expressing cells in the adenomatous epithelium confirms a significant reduction in ARID1A+ cells in Arid1a and Trp53 doubly deleted tumors compared with Arid1a deleted tumors (*, P = 0.036, unpaired t test). Bars represent mean ± SEM. (C) Whole-mount images of stomachs from mice with single or double deletion of Arid1a and Trp53; the white dotted line demarcates the protrusion found in the stomach of mice with Arid1a and Trp53 double deletion. Scale bar, 5 mm. (D) Representative histological images of the gastric layers from mice with single or double deletion of Arid1a and Trp53, highlighting an example of submucosal invasion in the doubly deleted mice; the white dotted line demarcates the muscularis mucosa (MM) and the submucosa (S). Scale bar, 100 µm. (E) Quantification of the percentage of invasive tumors demonstrates increased incidents of invasion in Arid1a;Trp53 doubly deleted tumors compared with Arid1a singly deleted or Trp53 singly deleted tumors (n = 10, n = 7, and n = 6, respectively; *, P = 0.026 between Arid1a single mutant and double mutant; n.s., P = 0.18 between Trp53 single and double mutants, χ2 test for the occurrence of invasion including T1a and T4).
Analysis of Trp53 and Arid1a interaction during gastric tumor progression. (A) Representative immunofluorescence images of ARID1A staining in gastric adenomas with the deletion of Arid1a alone or Arid1a and Trp53 together; the white dotted lines outline the boundary between the epithelium and mesenchyme (n = 5–7 each). Scale bar, 100 µm. (B) Quantification of ARID1A-expressing cells in the adenomatous epithelium confirms a significant reduction in ARID1A+ cells in Arid1a and Trp53 doubly deleted tumors compared with Arid1a deleted tumors (*, P = 0.036, unpaired t test). Bars represent mean ± SEM. (C) Whole-mount images of stomachs from mice with single or double deletion of Arid1a and Trp53; the white dotted line demarcates the protrusion found in the stomach of mice with Arid1a and Trp53 double deletion. Scale bar, 5 mm. (D) Representative histological images of the gastric layers from mice with single or double deletion of Arid1a and Trp53, highlighting an example of submucosal invasion in the doubly deleted mice; the white dotted line demarcates the muscularis mucosa (MM) and the submucosa (S). Scale bar, 100 µm. (E) Quantification of the percentage of invasive tumors demonstrates increased incidents of invasion in Arid1a;Trp53 doubly deleted tumors compared with Arid1a singly deleted or Trp53 singly deleted tumors (n = 10, n = 7, and n = 6, respectively; *, P = 0.026 between Arid1a single mutant and double mutant; n.s., P = 0.18 between Trp53 single and double mutants, χ2 test for the occurrence of invasion including T1a and T4).
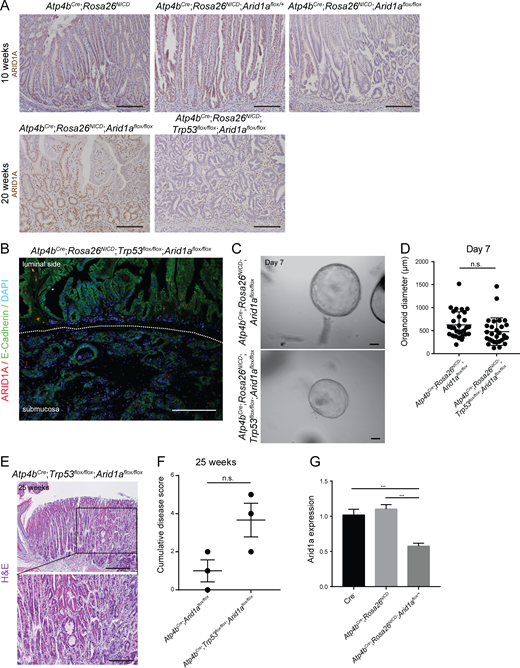
Analysis of Trp53 deletion in Arid1a homozygous tumors. (A) Representative images of ARID1A staining by histochemistry in 10-wk and 20-wk Arid1a intact, Arid1a heterozygous, and Arid1a homozygous tumors (n = 3 each). Scale bar, 100 µm. (B) Representative image of ARID1A and E-cadherin costaining in gastric tumor with double deletion of Arid1a and Trp53 (n = 3). Scale bar, 100 µm. (C) Representative images of organoids established from the epithelial cells of Arid1a homozygous tumors or Arid1a;Trp53 double-deletion tumors. Experiments were repeated twice with organoids obtained from two different mice for each genotype. Scale bars, 100 μm. (D) Quantification of the diameter of organoids established from the epithelial cells of Arid1a homozygous tumors and Arid1a;Trp53 double-deletion tumors (unpaired t test). Bars represent mean ± SD. (E) Representative histological images of stomach with double deletion of Arid1a and Trp53 in gastric parietal cells at 25 wk (n = 3). Scale bar, 100 µm. (F) Histopathological scoring of stomachs with Arid1a deletion and Arid1a;Trp53 double deletion in gastric parietal cells using features shown in Table S1 (P = 0.065, unpaired t test). Bars represent mean ± SEM. (G) RT-qPCR analysis of Arid1a expression in normal stomachs and tumor organoids on day 4 of culture confirms down-regulation of Arid1a in Arid1a heterozygous tumor organoids. Experiments were repeated at least twice with organoids obtained from two different mice for each genotype (***, P < 0.001; unpaired t test). Error bars represent SEM.
Analysis of Trp53 deletion in Arid1a homozygous tumors. (A) Representative images of ARID1A staining by histochemistry in 10-wk and 20-wk Arid1a intact, Arid1a heterozygous, and Arid1a homozygous tumors (n = 3 each). Scale bar, 100 µm. (B) Representative image of ARID1A and E-cadherin costaining in gastric tumor with double deletion of Arid1a and Trp53 (n = 3). Scale bar, 100 µm. (C) Representative images of organoids established from the epithelial cells of Arid1a homozygous tumors or Arid1a;Trp53 double-deletion tumors. Experiments were repeated twice with organoids obtained from two different mice for each genotype. Scale bars, 100 μm. (D) Quantification of the diameter of organoids established from the epithelial cells of Arid1a homozygous tumors and Arid1a;Trp53 double-deletion tumors (unpaired t test). Bars represent mean ± SD. (E) Representative histological images of stomach with double deletion of Arid1a and Trp53 in gastric parietal cells at 25 wk (n = 3). Scale bar, 100 µm. (F) Histopathological scoring of stomachs with Arid1a deletion and Arid1a;Trp53 double deletion in gastric parietal cells using features shown in Table S1 (P = 0.065, unpaired t test). Bars represent mean ± SEM. (G) RT-qPCR analysis of Arid1a expression in normal stomachs and tumor organoids on day 4 of culture confirms down-regulation of Arid1a in Arid1a heterozygous tumor organoids. Experiments were repeated at least twice with organoids obtained from two different mice for each genotype (***, P < 0.001; unpaired t test). Error bars represent SEM.
To further investigate the effect of Arid1a and Trp53 deletion on tumor cell growth, we established organoids using glands isolated from Arid1a homozygous tumors and Arid1a and Trp53 doubly deleted tumors, and we found no significant differences in the size of organoids formed (Fig. S5, C and D). The culture media, supplemented with various growth factors, might have masked their potential difference in vitro. To determine if the concurrent deletion of Arid1a and Trp53 is able to drive tumor formation in differentiated gastric epithelial cells, we simultaneously deleted Arid1a and Trp53 in parietal cells (Atp4bCre;Trp53flox/flox;Arid1aflox/flox). Histological analysis of the stomachs of these mice at 25 wk identified abnormal gland structures (Fig. S5 E). Although we observed a trend of increased disease scores in Arid1a;Trp53 double mutants compared with Arid1a single mutants (Fig. S5 F), we found no dysplasia in the mutants, suggesting that Trp53 deletion may not be able to efficiently drive tumor formation in Arid1a-deleted parietal cells.
Combined therapy targeting both the BAF complex and the p53 pathway
Given the loss of fitness observed in ARID1A− cells, we hypothesized that further disruption of the BAF complex would inhibit the growth of Arid1a heterozygous tumor cells. The epigenetic inhibitor, TP064, has recently been identified to be an inhibitor of CARM1, which regulates the methylation of the core BAF complex subunit, BAF155 (Nakayama et al., 2018). This methylation was shown to direct the complex to chromatin regions associated with oncogenic genes (Wang et al., 2014). Therefore, we hypothesized that TP064 may have therapeutic effects on Arid1a heterozygous tumors. To address this question, we treated gastric organoids established from tumor or normal (wild-type) stomach glands with TP064 at 1.5 µM and found significantly reduced size of Arid1a intact and Arid1a heterozygous tumor organoids compared with normal organoids (Fig. 6, A–C). In addition, to confirm if isolated Arid1a heterozygous tumor cells exhibit reduced Arid1a expression levels in tumor organoid culture, we conducted RT-qPCR on normal and tumor organoids before drug treatment. We found that Arid1a expression is significantly reduced in Arid1a heterozygous tumor organoids compared with either normal or Arid1a intact tumor organoids (Fig. S5 G).

Combinatorial drug treatment of gastric tumor organoids. (A) Experimental overview of the small molecule treatment in gastric organoid culture. (B) Representative images of Cre− wild-type, Arid1a intact tumor, and Arid1a heterozygous tumor organoids on day 7 after treatment with 1.5 µM TP064 or DMSO as a control. Experiments were repeated at least twice with organoids obtained from different mice for each genotype. Scale bar, 100 µm. (C) Quantification of organoid diameter on day 7 of treatment with 1.5 µM TP064 reveals a significant reduction in the size of Arid1a intact (P = 0.022, unpaired t test) and Arid1a heterozygous tumor organoids (*, P = 0.012, unpaired t test), but not of Cre− wild-type organoids, compared with DMSO treatment. Bars represent mean ± SEM. (D) The viability of tumor organoids on day 7 of combinatorial or lone treatment using the indicated concentration of TP064 and/or Nutlin-3 versus DMSO demonstrates a synergistic reduction in organoid viability after combined treatment (*, P < 0.05; ***, P < 0.001; unpaired t test). Combinatorial but not individual treatment of TP064 and Nutlin-3 at 1 µM significantly inhibits the viability of Cre− wild-type and Arid1a heterozygous tumor organoids, thus supporting a synergistic effect of the two small molecules. Organoid viability is further reduced with combinatorial treatment of 1.5 µM TP064 and 2 µM Nutlin-3. Each drug treatment was repeated with organoids established from at least two different mice for each genotype, and each biological replicate was treated with the same condition in at least three different wells. Error bars represent SEM. (E) Combinatorial treatment of 1.5 µM TP064 and 2 µM Nutlin-3 exhibits greater inhibition of viability in Arid1a heterozygous tumor organoids than Cre− wild-type organoids and Arid1a intact tumor organoids. Each data point represents the average percentage viability of an individual set of experiments using organoids established from a different mouse (*, P < 0.05; **, P < 0.01). Bars represent mean ± SEM. (F) Representative images of Arid1a heterozygous tumor organoids on day 4 of combinatory treatment of 1.5 µM TP064 and/or 2 µM Nutlin-3 or DMSO. Experiments were repeated twice with organoids obtained from two different mice. Scale bar, 100 µm. (G) Quantification of the diameter of Arid1a heterozygous tumor organoids after 4 d of treatment with either both 1.5 µM TP064 and 2 µM Nutlin-3 or separately shows a significant reduction in organoid size after simultaneous treatment of TP064 and Nutlin-3 compared with DMSO and single-compound treatment. Experiments were repeated twice with organoids obtained from two different mice (***, P < 0.001; unpaired t test). Bars represent mean ± SEM. (H) RT-qPCR analysis of Arid1a heterozygous tumor organoids on day 4 of treatment with DMSO, 1.5 μM TP064, 2 μM Nutlin-3, or both 1.5 μM TP64 and 2 μM Nutlin-3 shows significant up-regulation of p53 signaling and apoptosis genes after simultaneous treatment of TP064 and Nutlin-3 compared with DMSO. Experiments were repeated twice with organoids obtained from two different mice (***, P < 0.001; unpaired t test). Error bars represent SEM.
Combinatorial drug treatment of gastric tumor organoids. (A) Experimental overview of the small molecule treatment in gastric organoid culture. (B) Representative images of Cre− wild-type, Arid1a intact tumor, and Arid1a heterozygous tumor organoids on day 7 after treatment with 1.5 µM TP064 or DMSO as a control. Experiments were repeated at least twice with organoids obtained from different mice for each genotype. Scale bar, 100 µm. (C) Quantification of organoid diameter on day 7 of treatment with 1.5 µM TP064 reveals a significant reduction in the size of Arid1a intact (P = 0.022, unpaired t test) and Arid1a heterozygous tumor organoids (*, P = 0.012, unpaired t test), but not of Cre− wild-type organoids, compared with DMSO treatment. Bars represent mean ± SEM. (D) The viability of tumor organoids on day 7 of combinatorial or lone treatment using the indicated concentration of TP064 and/or Nutlin-3 versus DMSO demonstrates a synergistic reduction in organoid viability after combined treatment (*, P < 0.05; ***, P < 0.001; unpaired t test). Combinatorial but not individual treatment of TP064 and Nutlin-3 at 1 µM significantly inhibits the viability of Cre− wild-type and Arid1a heterozygous tumor organoids, thus supporting a synergistic effect of the two small molecules. Organoid viability is further reduced with combinatorial treatment of 1.5 µM TP064 and 2 µM Nutlin-3. Each drug treatment was repeated with organoids established from at least two different mice for each genotype, and each biological replicate was treated with the same condition in at least three different wells. Error bars represent SEM. (E) Combinatorial treatment of 1.5 µM TP064 and 2 µM Nutlin-3 exhibits greater inhibition of viability in Arid1a heterozygous tumor organoids than Cre− wild-type organoids and Arid1a intact tumor organoids. Each data point represents the average percentage viability of an individual set of experiments using organoids established from a different mouse (*, P < 0.05; **, P < 0.01). Bars represent mean ± SEM. (F) Representative images of Arid1a heterozygous tumor organoids on day 4 of combinatory treatment of 1.5 µM TP064 and/or 2 µM Nutlin-3 or DMSO. Experiments were repeated twice with organoids obtained from two different mice. Scale bar, 100 µm. (G) Quantification of the diameter of Arid1a heterozygous tumor organoids after 4 d of treatment with either both 1.5 µM TP064 and 2 µM Nutlin-3 or separately shows a significant reduction in organoid size after simultaneous treatment of TP064 and Nutlin-3 compared with DMSO and single-compound treatment. Experiments were repeated twice with organoids obtained from two different mice (***, P < 0.001; unpaired t test). Bars represent mean ± SEM. (H) RT-qPCR analysis of Arid1a heterozygous tumor organoids on day 4 of treatment with DMSO, 1.5 μM TP064, 2 μM Nutlin-3, or both 1.5 μM TP64 and 2 μM Nutlin-3 shows significant up-regulation of p53 signaling and apoptosis genes after simultaneous treatment of TP064 and Nutlin-3 compared with DMSO. Experiments were repeated twice with organoids obtained from two different mice (***, P < 0.001; unpaired t test). Error bars represent SEM.
Since, compared with Arid1a heterozygous tumors, genes up-regulated in Arid1a intact tumors were enriched for the p53 signaling pathway, we hypothesized that treatment with a p53 agonist may further inhibit the growth of Arid1a heterozygous tumor cells. To address this hypothesis, we treated gastric tumor organoids with both TP064 and Nutlin-3, a well characterized p53 agonist (Vassilev et al., 2004). We found that while treatment of 1 µM TP064 and 1 µM Nutlin-3 alone did not significantly alter the viability of normal or Arid1a heterozygous tumor organoids, their combined treatment had a synergistic effect in reducing the viability of these organoids (Fig. 6 D). When we treated the organoids with 1.5 µM TP064 and 2 µM Nutlin-3, we found further reduction in organoid viability, with a significantly greater effect in Arid1a heterozygous tumor organoids compared with either normal or Arid1a intact tumor organoids (Fig. 6, D and E). The size of Arid1a heterozygous tumor organoids also was greatly reduced after 3 d of combinatorial treatment with TP064 and Nutlin-3 (Fig. 6, F and G). To identify any changes in gene expression upon drug treatment at the concentrations used, we performed RT-qPCR and identified a number of p53 pathway genes, such as Ccng1, p21, and Trp53, that became up-regulated to a greater level after combinatorial treatment than with individual treatment alone (Fig. 6 H). Together, our work shows that the combined use of TP064 and Nutlin-3 may synergistically activate the p53 pathway and inhibit the growth of Arid1a heterozygous gastric tumors.
Discussion
Although ARID1A is one of the most commonly mutated genes in GC, the functional effects of ARID1A mutations in GC have not been addressed in vivo. Using our clinically relevant GC models and performing genomic and epigenomic profiling, we demonstrate in vivo that Arid1a heterozygosity in a Notch-activated gastric adenoma model sufficiently promotes tumor progression through the regulation of enhancers and genes involved in the p53 and apoptosis pathways.
Interestingly, the role of Arid1a is highly context and tissue dependent. Arid1a acted as a tumor suppressor in the colon but not in the small intestine (Mathur et al., 2017). However, loss of Arid1a delayed colon and ovarian cancer formation in the context of Apc mutations (Zhai et al., 2016). While pancreatic deletion of Arid1a alone initiated metaplastic and neoplastic lesions, these lesions only progressed to pancreatic ductal adenocarcinoma upon oncogenic cooperation with KRAS (Kimura et al., 2018; Wang et al., 2019). In the liver, Arid1a loss prevented tumor initiation, but Arid1a deletion in established tumors promoted cancer progression (Sun et al., 2017). Consistent with these data, while the heterozygous deletion of Arid1a in our gastric adenoma model promoted tumor progression, neither the Arid1a heterozygous deletion nor the Arid1a homozygous deletion in differentiated parietal cells and chief cells was able to efficiently initiate tumorigenesis.
Since Notch signaling is known to be activated in GC (Yao et al., 2017) and its activation in parietal cells induces their dedifferentiation targeting all stomach gland cells (Kim and Shivdasani, 2011), we used a Notch-activated gastric adenoma model in our study to specifically target Arid1a in the stomach. We also found that the Notch pathway genes are frequently amplified, and their expression is increased in ARID1A mutant GC, supporting the human relevance of using our Notch-activated model. Several studies have shown that MIST1 labels a slowly cycling stem cell population in the gastric corpus (Stange et al., 2013), and oncogenic mutations targeting MIST1+ cells lead to tumor initiation (Hayakawa et al., 2015). However, deletion of one or both copies of Arid1a in MIST1+ cells in the gastric epithelium was not able to efficiently drive tumor formation. Interestingly, a recent genomic and epigenomic profiling study showed that ARID1A is less frequently mutated in human intestinal metaplasia than in advanced GC (Huang et al., 2018). This finding is supportive of our result in which Arid1a loss alone may not efficiently initiate gastric tumorigenesis and requires oncogenic cooperation, such as that contributed by Notch signaling activation. Since inflammation is a critical step in gastric tumorigenesis (Correa and Piazuelo, 2012), diverse immune responses due to differences in genetic background between mouse strains may also contribute to variation in the tumor severity observed in our study.
To define the transcriptional and epigenetic mechanisms underlying Arid1a heterozygosity-mediated tumor progression, we performed H3K27ac/H3K4me3 ChIP-seq and RNA-seq experiments. Our genome-wide investigation revealed a significant global reduction in H3K27ac and H3K4me3 levels when Arid1a heterozygous loss was induced compared with Arid1a intact tumors. This surprising result suggests the importance of broad control of enhancer activity mediated by the BAF complex. Our GO analysis showed down-regulation of the p53 signaling and apoptotic pathway genes in Arid1a heterozygous tumors compared with Arid1a intact tumors. Consistent with our data, the previous studies in gynecological cancers showed that ARID1A activates p53 target genes and promotes apoptosis (Bitler et al., 2017; Guan et al., 2011). Although we observed suppression of enhancers and genes involved in p53 signaling in Arid1a heterozygous tumors, apoptosis was moderately affected, suggesting that this epigenetic suppression gradually influences apoptosis over time, leading to increased tumor growth and progression.
In contrast to Arid1a heterozygosity-mediated down-regulation of the p53 and apoptosis pathways, our mouse genetic and single-cell analyses demonstrated that Arid1a homozygous deletion surprisingly confers a competitive disadvantage through the abnormal activation of the p53 apoptotic pathway. The reduced fitness of Arid1a homozygous cells may also explain the observation that poorly differentiated GCs have an increased level of ARID1A protein expression compared with moderately differentiated GCs (Fig. 1 B), as ARID1A− cells may be eliminated in the later stages of cancer progression. This may be driven in part by the reactivation of enhancers associated with apoptotic genes that are inactivated in Arid1a heterozygous tumors. It has been proposed that the oncogenic effect of Arid1a loss is dependent on its mutually exclusive BAF complex subunit, Arid1b (Mathur et al., 2017). Therefore, in the absence of Arid1a, Arid1b may drive the reactivation of these enhancers. Consistently with the activation of p53 signaling in ARID1A− cells, double deletion of Arid1a and Trp53 in our tumor model not only partially rescued the competitive disadvantage of ARID1A− cells but also facilitated tumor progression and invasion. Our data may explain the low number of GC patients harboring homozygous alterations of both ARID1A and TP53, as they may experience early lethality caused by aggressive cancer.
Collectively, our data not only highlight distinct dosage-dependent roles of Arid1a but also reveal a targetable vulnerability in Arid1a heterozygous tumors, suggesting that further disruption of the BAF complex may have therapeutic potential. Consistent with this notion, TP064, which inhibits CARM1, a key regulator of the BAF complex (Nakayama et al., 2018), suppressed the growth of Arid1a heterozygous tumor organoids. Since p53 signaling was activated in Arid1a heterozygous tumors, we hypothesized that p53 activation also would enhance its therapeutic effects. Indeed, we found that the cotreatment of TP064 with Nutlin-3, a p53 agonist currently in clinical trial, significantly improved the inhibition of the growth and viability of Arid1a heterozygous tumor organoids compared with individual treatment alone. This suggests that a combined approach of these small molecules may be a viable option in treating Arid1a heterozygous GCs, which contribute to a large proportion of cases.
Materials and methods
Clinical samples and immunohistochemistry
Fifteen GC and five paracancerous formalin-fixed, paraffin-embedded samples were collected from the Department of Pathology, Second Hospital of Shandong University. The pathological grade of each sample was examined by pathological specialists. Immunohistochemistry was performed with a standard antigen retrieval protocol. Rabbit polyclonal anti-ARID1A antibody (Sigma-Aldrich; HPA005456) was used for immunohistochemistry. All stained slides were digitized with a NanoZoomer S60 Digital slide scanner (Hamamatsu Photonics; C13210-01). This study was reviewed and approved by the ethics committee of the Second Hospital of Shandong University with written informed consent received from all the patients.
Mouse experiments
All mouse experiments were performed in adherence to guidelines set forth by the Canadian Council on Animal Care and approved by The Centre for Phenogenomics. Trp53flox (stock no. 008462; Marino et al., 2000)/Rosa26NICD1-Ires-GFP (stock no. 008159; Murtaugh et al., 2003) and Atp4bCre (stock no. 030656; Syder et al., 2004) mice were gifts from R. Shivdasani (Dana Farber Cancer Institute, Boston, MA), J. Mills (Washington University, St. Louis, MO), and C.C. Hui (Hospital for Sick Children, Toronto, ON, Canada). Arid1aflox (stock no. 027717; Gao et al., 2008) and Mist1CreERT2 (stock no. 029228) mice were purchased from The Jackson Laboratory. To generate Atp4bCre;Arid1aflox/+ and Atp4bCre;Arid1aflox/flox mice, Atp4bCre mice were crossed to Arid1aflox mice and backcrossed for multiple generations to obtain the animals used in our experiments. Atp4bCre were first crossed to Rosa26NICD1-Ires-GFP, and the Atp4bCre;Rosa26NICD1-Ires-GFP litters were crossed to Arid1aflox, which were then intercrossed for multiple generations to generate Atp4bCre;Rosa26NICD1-Ires-GFP, Atp4bCre;Rosa26NICD1-Ires-GFP;Arid1aflox/+, and Atp4bCre;Rosa26NICD1-Ires-GFP;Arid1aflox/flox mice used for experiments. Similarly, Trp53flox mice were crossed to Atp4bCre;Rosa26NICD1-Ires-GFP mice and intercrossed to generate Atp4bCre;Rosa26NICD1-Ires-GFP;Trp53flox/flox mice, which were then crossed to Arid1aflox mice and intercrossed for multiple generations to generate the Atp4bCre;Rosa26NICD1-Ires-GFP;Trp53flox/flox and Atp4bCre;Rosa26NICD1-Ires-GFP;Trp53flox/flox;Arid1aflox/flox mice used for experiments. To activate Cre in Mist1CreERT2 mice, tamoxifen was injected intraperitoneally at 4 wk of age at 2 mg for 5 consecutive days. The mice were then dissected at 6 w.p.i. to match analysis with 10-wk-old mice.
Western blot analysis
Isolated gastric corpus epithelial cells were lysed in ice-cold lysis buffer (50 mM Tris-HCl, pH 7.5, 150 mM NaCl, 1 mM EDTA, 1% NP-40, 0.1% SDS, and 0.25% sodium deoxycholate) supplemented with 1 mM PMSF and protease inhibitor cocktail (Roche). The concentration of the isolated protein was determined using a detergent-compatible protein assay (Bio-Rad Laboratories). The samples were prepared by boiling in SDS loading buffer (100 mM Tris-HCl, pH 6.8, containing 4% SDS, 0.02% bromophenol blue, and 2% 2-mercaptoethanol). Whole-cell lysates were fractionated by SDS-PAGE and transferred to a nitrocellulose membrane (Bio-Rad Laboratories). The blotted membrane was blocked for 1 h in Tris-buffered saline with Tween 20 (10 mM Tris, pH 8.0, 150 mM NaCl, 0.5% Tween 20) containing 5% skim milk and then incubated with the primary antibodies against the ARID1A (Sigma-Aldrich; HPA005456) or GAPDH (Abcam; ab181602). Secondary peroxidase-labeled anti-mouse or anti-rabbit IgG antibodies were purchased from Thermo Fisher Scientific. Membranes were washed with Tris-buffered saline with Tween 20 and developed with SuperSignal West Pico Chemiluminescent Substrate (Thermo Fisher Scientific; 34080) using the ChemiDoc MP system (Bio-Rad Laboratories).
Immunofluorescence
Tissues were fixed in 4% PFA at 4°C overnight and embedded in paraffin. 5-µm sections (adult) and 3-µm sections (embryonic) were rehydrated through ethanol series. Antigen retrieval was performed in 10 mM sodium citrate, pH 6, using a microwave. Sections were blocked in 10% goat serum and incubated in primary antibody (1:200) overnight at 4°C (ARID1A, HPA005456, Sigma-Aldrich; H+-K+-ATPase,D032-3, MBL International Corporation; PCNA, sc-56, Santa Cruz Biotechnology; intrinsic factor, D. Alpers, Washington University). Sections were then washed thoroughly and incubated in secondary antibody (1:750) and DAPI for 1 h at room temperature. TUNEL staining was performed using the In Situ Cell Death Detection Kit, TMR red (Sigma-Aldrich; 12156792910) according to the manufacturer’s protocol. Sections were washed thoroughly and mounted in Anti-Fade Fluorescence Mounting Media (Abcam; ab104135).
Immunohistochemistry
5-µm sections were rehydrated through ethanol series. Antigen retrieval was performed in 10 mM sodium citrate, pH 6, using a microwave. Antigen retrieval was performed in 10 mM sodium citrate pH6 using a microwave. Sections were then treated with 3% H2O2 to remove endogenous peroxidase activities. Sections were blocked in 10% goat serum, followed by avidin and biotin. Sections were then incubated in primary antibody (1:500) overnight at 4°C (p53, NCL-L-p53-CM5p, Leica Biosystems; cleaved caspase-3, MilliporeSigma AB3623). Sections were then washed thoroughly and incubated in biotinylated secondary antibody for 1 h at room temperature (secondary antibody, 1:750), followed by avidin-biotin complex for 30 min, and developed in DAB. Sections were counterstained in hematoxylin and dehydrated through an ethanol series.
PAS staining
5-µm sections were rehydrated through ethanol series. Sections were stained using the PAS stain kit (StatLab; SSK-PAS[DIASTASE]) according to the provided protocol.
Stomach gland isolation and RNA isolation
The corpus regions of the stomach that have tumors (or analogous regions in normal stomachs) were dissected and incubated in 20 mM EDTA for 30 min. The glands were then extracted by gently scraping the surface using a glass slide. The glands were washed thoroughly in PBS before downstream application. Isolated epithelial cells were immediately frozen, and RNA isolation was conducted using an RNA isolation kit (Qiagen; 74104).
ChIP-seq
Fresh epithelial pellets were fixed in 1% PFA for 10 min at room temperature, quenched with a 1/20th volume of 2.5 M glycine for 5 min, washed twice with cold 1× PBS, and flash frozen. When enough sample was acquired (∼0.1 g of tissue per region), fixed pellets were pooled, dounced in cold PBS with protease inhibitor, and filtered through a 70-µm mesh. Samples were then incubated in cold cell membrane and nuclear lysis buffers containing nondenaturating detergents for 30 min each on a shaker at 4°C. Washed samples were pelleted and resuspended in 300 µl sonication buffer containing 0.1% SDS. Sonication was conducted using the Diagenode bioruptor (Diagenode; B01020001) at high power for 30 cycles, 30 s ON/OFF. Sonicated samples were cleared with a 1:10 dilution of 30% Triton X-100 and added to antibody-bound beads (rabbit anti-H3K27ac, ab4729; Abcam). The next day, beads were washed with high- and low-salt buffers and treated with proteinase K overnight at 65°C. DNA was isolated using phenol/chloroform extraction, and 10 ng immunoprecipitated DNA was used for cDNA library construction using the Rubicon DNA-seq Thruplex 48S kit. Libraries were size selected and submitted to be sequenced at 50-bp read length, single-end reads with 15–20 million reads per library.
ChIP-seq analysis
Single-end reads of H3K27ac and H3K4me3 ChIP-seq data were aligned to the GRCm38 mouse reference genome by Bowtie 2 with default parameters (Langmead and Salzberg, 2012). The aligned BAM files were then subjected to MASC2 for peak calling using “callpeak” mode with parameters “–keep-dup=1” and “–SPMR” (Zhang et al., 2008). ChIP-seq peaks were filtered by ENCODE mm10 blacklist regions (https://www.encodeproject.org/annotations/ENCSR636HFF/) for downstream analysis. The University of California Santa Cruz Genome Browser bedGraphToBigWig tool was used to convert resultant bedgraph files to big wiggle files for peak visualization in the Integrative Genomics Viewer (Robinson et al., 2011). The R packages “ChIPseeker” (Yu et al., 2015) and “clusterProfiler” (Yu et al., 2012) were used for the annotation and functional enrichment analysis of ChIP-seq peaks. Two replicates of H3K27ac ChIP-seq were conducted for wild-type stomachs and for Arid1a-intact, Arid1a-heterozygous, and Arid1a-deleted gastric tumors. Only the common peaks of two replicates for each group were used for downstream analysis. To determine whether a subset of H3K27ac peaks was enriched in gene enhancer regions of a specific pathway, we first calculated the overlapping ratio of pathway gene enhancer regions with H3K27ac peaks and then compared the ratio with the genome background ratios, which were calculated by randomly sampling the same number of gene enhancer regions from all protein coding gene lists for 1,000 times.
RNA-seq analysis
Single-end RNA-seq reads were aligned to the GRCm38 mouse reference genome by STAR 2.4.2a (Dobin et al., 2013). The reads per kilobase per million mapped reads (RPKM) method was used to quantify gene expression of RNA-seq data. Differentially expressed genes were selected by the threshold of absolute fold change (RPKM + 1) > 1.5 and P < 0.05. The R package “clusterProfiler” (Yu et al., 2012) was used for the functional enrichment analysis of RNA-seq data.
TCGA data analysis
ARID1A genomic alteration status, TNM stages, and Notch pathway gene amplification status for TCGA Stomach Adenocarcinoma data collection (TCGA-STAD) samples were retrieved from cBioPortal (https://www.cbioportal.org/). 407 TCGA-STAD RNA-seq data were downloaded from the Genomic Data Commons Data Portal (https://portal.gdc.cancer.gov/). The Notch pathway gene z-score of each participant was defined as the sum of z-scores of 32 genes of the “HALLMARK_NOTCH_SIGNALING” download from MSigDB (https://www.gsea-msigdb.org/gsea/msigdb). For each gene, z-score = (x − μ)/σ; x is the normalized gene expression value, μ is the average of gene expression, and σ is the standard deviation of gene expression.
RT-qPCR
Purified RNA was reverse transcribed using SuperScript III First-Strand Synthesis (Thermo Fisher Scientific; 11752050). qPCRs were performed with PowerUp SYBR Green (Applied Biosystems; A25742) and primers listed in Table S6 using the ViiA7 Real-Time PCR System (Applied Biosystems).
PCR analysis
DNA was purified from isolated glands using TRIzol following the manufacturer’s protocol. PCRs were performed using a fluorescein amidite–labeled forward primer according to a published protocol (Bacher et al., 2005). Amplicon sizes were obtained using Peak Scanner.
scRNA-seq
The stomach glands of an Atp4bCre;Rosa26NICD;Arid1aflox/flox mouse at 23 wk were isolated. Isolated glands were digested into a single-cell suspension using collagenase and dispase and stained using EPCAM (Ab95641) and Sytox Blue (Thermo Fisher Scientific; S34857). EPCAMhigh and Sytoxlow cells were sorted using the Moflo Astrios and submitted for scRNA-seq using the 10x Genomics platform.
scRNA-seq analysis
Raw reads were processed using the 10x Genomics CellRanger pipeline to align these to the reference transcriptome (mm10) and to generate gene cell count matrices. Initial quality control and clustering were performed with R package Seurat, version 2.3.0. To remove falsely identified cells, cells having a unique molecular identifier count <1,000 or genes that expressed <10% of cells were excluded from further analysis. For imputing missing expression values, we used the MAGIC (Markov affinity-based graph imputation of cells) program with optimal diffusion constant t = 2. Data normalization and scaling to remove unwanted sources of variation in principal component analysis were conducted using genes with highly variable expression. Identified clusters were represented using a t-distributed stochastic neighbor embedding plot. Differential gene expression analysis was then used to identify significantly differentially expressed genes within each cluster using the t test for significance.
Organoid treatment
The stomach glands were isolated and seeded in Matrigel Matrix GFR PhenolRF Mouse (Corning; 356231) in a 96-well plate. The organoids were cultured in a 1:4 dilution of conditioned media obtained from L-WRN cells (ATCC CRL-3276) according to a provided protocol (Miyoshi and Stappenbeck, 2013). To avoid selection of specific cell types from subculturing, organoids were analyzed at the indicated time point from the initial seeding of gastric glands without any passages. Viability was assayed using 3-(4,5-dimethylthiazol-2-yl)-2,5-diphenyltetrazolium bromide according to protocol, and the absorbance at 570 nm and 630 nm was read using a SpectraMax 340PC Microplate Reader (Hansen et al., 1989). The percentage viability was calculated by first subtracting the absorbance A570 nm–A630 nm value of each well by the A570 nm–A630 nm value of the negative control (only Matrigel), then divided by the value obtained for the DMSO-only control obtained in the same way. Combinatorial treatments of small molecules were performed in a minimum of three independent replicates at a low concentration of 0.05% DMSO to limit the effect of DMSO on organoid growth. To extract RNA, organoids were extracted from Matrigel using Cell Recovery Solution (Corning; 354253), and RNA was purified with the RNeasy Mini Kit (Qiagen; 74104) according to protocol.
Data availability
The scRNA-seq, RNA-seq, and ChIP-seq data used to support this study have been deposited in the Gene Expression Omnibus database (accession no. GSE144388).
Online supplemental material
Fig. S1 shows analysis of human GC data and characterizes Arid1a intact and Arid1a heterozygous tumors in vivo. Fig. S2 reports motif enrichment, apoptosis, mismatch repair, and microsatellite instability in Arid1a intact and Arid1a heterozygous tumors. Fig. S3 shows ARID1A expression in normal stomachs and characterizes parietal and MIST1+ cell–specific deletions of Arid1a. Fig. S4 shows analysis of p53 pathway and apoptosis in Arid1a homozygous tumors. Fig. S5 characterizes double deletion of Arid1a and Trp53 in gastric tumors. Table S1 shows the criteria used for histological scoring of mouse tumors. Table S2 provides information on enhancers in Arid1a intact and Arid1a heterozygous tumors. Table S3 shows expression of group A, group B, group C, and group D genes. Table S4 lists the markers of each cluster identified in the scRNA-seq of Arid1a homozygous tumors. Table S5 provides information on enhancers in Arid1a heterozygous and Arid1a homozygous tumors. Table S6 lists the primers used for RT-qPCR.
Acknowledgments
We thank Dr. Sean Egan for helpful discussion and Dr. David Alpers for the gift of gastric intrinsic factor antibody.
The work was supported by SickKids Foundation start-up funding, the Canadian Institutes of Health Research PJT-173266 grant, a Cancer Research Society grant, a SickKids Garron Family Cancer Centre Pitblado Basic/Translational Discovery grant, and a Concern Foundation award (T.H. Kim); the SickKids Restracomp and Canada graduate and Ontario graduate scholarships (A.K.H. Loe); Canadian Institutes of Health Research and University of Toronto Medicine by Design postdoctoral fellowships (J.-E. Kim); the Taishan Scholar Program of Shandong Province (tsqn201812136) and the National Key Research and Development Project of China (2019YFA0111400; H. Guo); and a Natural Sciences and Engineering Research Council of Canada discovery grant (498706), the Canadian Institutes of Health Research New Investigator Award, and the Ontario Ministry of Research, Innovation and Science Early Researcher Award (H.H. He).
Author contributions: A.K.H. Loe designed and performed experiments, analyzed data, and wrote the manuscript; R. Francis initiated the project, performed RNA-seq and ChIP-seq experiments, and revised the manuscript; J. Seo analyzed single-cell data; L. Du and Y. Wang analyzed human GC samples; Ji-Eun Kim performed scRNA-seq; S.W. Hakim analyzed the histology of tumors; Jung-Eun Kim helped with in vitro culture studies; H.H. He supervised RNA-seq and ChIP-seq data analyses; H. Guo performed and supervised RNA-seq and ChIP-seq data analyses; and T.-H. Kim conceived and supervised the study, analyzed data, and revised the manuscript.

