Different actin nucleation-promoting factors (NPFs) orchestrate different patterns of cell protrusions, likely reflecting their distinct patterns of self-organization. Here, we leveraged in vivo biochemical approaches to investigate how the WAVE complex instructs the formation of sheet-like lamellipodia. We show that the WAVE complex is a core constituent of a linear multilayered protein array at the plasma membrane, expected for an NPF that builds sheet-like actin-based protrusions. Negative membrane curvature is both necessary and sufficient for WAVE complex linear membrane association in the presence of upstream activators (Rac, Arf1/6, and PIP3) and the PRDs of both WAVE2 and Abi2, providing a potential mechanistic basis for templating of lamellipodia and their emergent behaviors, including barrier avoidance. Through computational modeling, we demonstrate that WAVE complex’s linear organization and preference for negative curvature both play important roles in robust lamellipodia formation. Our data reveal key features of mesoscale WAVE complex patterning and highlight an integral relation between NPF self-organization and cell morphogenesis.
Introduction
Plasma membrane shape changes are crucial for many aspects of cell physiology. For example, migratory cells build flat, sheet-like membrane protrusions called lamellipodia to power cell motility (Innocenti, 2018; Krause and Gautreau, 2014), and some cells also build finger-like membrane protrusions called invadopodia to focally degrade the extracellular matrix to support metastasis (García et al., 2012; Gligorijevic et al., 2012; Yu et al., 2012). Actin rearrangements play a key role in the spatial and temporal regulation of these membrane deformations. Nucleation-promoting factors (NPFs) help specify when and where actin is polymerized (Chesarone and Goode, 2009; Pollard and Borisy, 2003; Rottner et al., 2017; Takenawa and Suetsugu, 2007). The neural Wiskott–Aldrich syndrome protein (N-WASP) and the WASP family verprolin homologous protein (WAVE) complex both activate the actin-related protein 2/3 (Arp2/3) complex to seed actin nucleation but result in distinct membrane morphologies. N-WASP orchestrates actin networks that support finger-like podosomes, invadopodia, and filopodia (García et al., 2012; Gligorijevic et al., 2012; Linder et al., 2022; Miki et al., 1998; Nemethova et al., 2008; Ward et al., 2004; Yu et al., 2012), while the WAVE complex orchestrates sheet-like branched actin networks that underlie broad and thin lamellipodial structures (Fritz-Laylin et al., 2017a; Fritz-Laylin et al., 2017b; Leithner et al., 2016; Machesky and Insall, 1998; Machesky et al., 1999; Steffen et al., 2004; Weiner et al., 2007).
How do different NPFs instruct different patterns of membrane protrusion? Biochemical reconstitutions using different distributions of micropatterned surfaces coated with the same NPF have provided some insights into the relation between actin network structures and NPF organization patterns. While a dot-like NPF organization drives finger-like actin networks, a linear pattern of the same NPF drives lamellipodial-like actin networks in vitro (Boujemaa-Paterski et al., 2017; Carlier et al., 2003). This suggests that the spatial organization of NPFs could dictate the resulting morphology of actin assembly and cell protrusion.
For in vitro studies, NPF distribution is typically externally constrained (Boujemaa-Paterski et al., 2017; Carlier et al., 2003). For living cells, NPF distribution is internally specificized through self-organization. For example, N-WASP phase separate to form focal structures on the plasma membrane that direct the extension of invadopodia and filopodia (Banjade and Rosen, 2014; Case et al., 2019; Ditlev et al., 2012; Kim et al., 2019; Ward et al., 2004). In contrast, to build a flat, sheet-like lamellipodial protrusion, the WAVE complex needs to assemble into a linear pattern on the plasma membrane. The multivalent interactions that generate N-WASP phase transition are relatively well understood and have been reconstituted with purified proteins in vitro (Banjade and Rosen, 2014; Case et al., 2019). However, the mechanism of WAVE complex organization into linear distributions is not understood and has not proven amenable to biochemical reconstitutions of lamellipodia formation (Chen et al., 2010; Koronakis et al., 2011; Lebensohn and Kirschner, 2009).
In a migratory cell, the WAVE complex propagates as a “wave” pattern at the tips of lamellipodia, with expanding and contracting zones of WAVE complex accumulation marking the expansion and contraction of the lamellipod (Video 1; Pipathsouk et al., 2021; Steffen et al., 2004; Stradal et al., 2001; Weiner et al., 2006). These wave patterns arise from an excitable feedback network composed of WAVE complex self-recruitment activated by Rac GTPases and delayed inhibition from actin polymerization that strips the WAVE complex off of the plasma membrane (Chen et al., 2017; Millius et al., 2012; Pipathsouk et al., 2021; Weiner et al., 2007). However, neither the upstream activator Rac nor the downstream effector actin exhibits such restricted pattern at the tips of lamellipodia as the WAVE complex: Rac activation (assayed via the PBD [p21-binding domain] of PAK1 [p21-activated kinase 1]) and actin (through phalloidin staining) are broadly distributed at the front of the cell and span a broader permissive zone compared with the WAVE complex (Fig. S1, A–F). Furthermore, the WAVE complex but not its downstream nucleator the Arp2/3 complex is required for formation of lamellipodia (Buracco et al., 2024; Pipathsouk et al., 2021). Notably, the WAVE complex also forms stereotypic nanoscale ring structures in the absence of actin cytoskeleton, a phenomenon not observed for Rac or the Arp2/3 complex (Pipathsouk et al., 2021). Collectively, this evidence suggests a self-organizing propensity of the WAVE complex that is independent of the spatial pattern of upstream permissive inputs and downstream effectors, underscoring a crucial organizational role of the WAVE complex in lamellipodia formation.
WAVE complex organization pattern in HL-60 cells. Left shows the eGFP-labeled Sra1 subunits in a migratory HL-60 cell treated with chemoattractant (25 nM fMLP), where the WAVE complex forms a linear array at the tips of lamellipodia. Right shows the eGFP-labeled Sra1 subunits in an HL-60 cell treated with actin inhibitor (0.5 µM latB), where the WAVE complex forms nanoscale rings at membrane invagination sites. TIRF-SIM imaging; scale bar: 2 µm.
WAVE complex organization pattern in HL-60 cells. Left shows the eGFP-labeled Sra1 subunits in a migratory HL-60 cell treated with chemoattractant (25 nM fMLP), where the WAVE complex forms a linear array at the tips of lamellipodia. Right shows the eGFP-labeled Sra1 subunits in an HL-60 cell treated with actin inhibitor (0.5 µM latB), where the WAVE complex forms nanoscale rings at membrane invagination sites. TIRF-SIM imaging; scale bar: 2 µm.

The WAVE complex adopts a restricted linear pattern compared with WAVE complex activator (Rac) and lamellipodial components (actin). (A) The WAVE complex (eGFP-Sra1; green) specifically localizes to the tips of lamellipodia, while active Rac (PAK-PBD; magenta) spans a permissive region at the front of a migratory HL-60 cell. TIRF-SIM imaging; scale bars: 5 µm. (B) Linescan across the front half of the cells. Rac activity shows a gradual signal increase toward the front side of the cell, while the WAVE complex shows a sharp signal increase at the tips of lamellipodia. N = 17 cells. (C) The WAVE complex forms nanoring structures in HL-60 cells treated with latB while Rac activity (PAK-PBD) is localized throughout the ventral surface. TIRF-SIM imaging; scale bars: 5 µm. (D) Linescan across the middle section of the WAVE complex nanorings. The WAVE complex signal shows ring patterns while Rac activity is broadly distributed. N = 1,700 nanorings from 12 cells. (E) Images of HL-60 cells expressing eGFP-Sra1 (green) fixed and stained with phalloidin (magenta). TIRF-SIM imaging; scale bars: 5 µm. (F) The actin pattern in cells (quantified by phalloidin fluorescence) correlates with lamellipodial length (Pearson correlation coefficient r = 0.69) but exhibits a more significantly poorer linear relation compared with WAVE complex in lamellipodia (r = 0.96) (Fig. 1 D). Each grey dot corresponds to a data point for a single cell. Green triangles with error bars show the mean and standard deviation of binned actin intensity within successive ranges of lamellipodia length, quantified the same way as shown in Fig. 1, D and G. N = 67 cells. (G) The membrane-bounded protein droplets (Fyn-HoTag3) adapted from the SPARK-ON system developed by Chung et al. (2023). (H) Expression of Fyn-HoTag3 in HEK293T cells. Upper right inset shows magnified ROI with blue circles showing the quantified regions. TIRF-SIM imaging; scale bars: 2 and 1 µm (inset). (I) The membrane-tagged SPARK-ON system exhibits a quadratic relation to radius and a linear relation to area, as expected for a planar distribution pattern. N = 407 puncta from 30 cells acquired in three experiments.

The WAVE complex adopts a restricted linear pattern compared with WAVE complex activator (Rac) and lamellipodial components (actin). (A) The WAVE complex (eGFP-Sra1; green) specifically localizes to the tips of lamellipodia, while active Rac (PAK-PBD; magenta) spans a permissive region at the front of a migratory HL-60 cell. TIRF-SIM imaging; scale bars: 5 µm. (B) Linescan across the front half of the cells. Rac activity shows a gradual signal increase toward the front side of the cell, while the WAVE complex shows a sharp signal increase at the tips of lamellipodia. N = 17 cells. (C) The WAVE complex forms nanoring structures in HL-60 cells treated with latB while Rac activity (PAK-PBD) is localized throughout the ventral surface. TIRF-SIM imaging; scale bars: 5 µm. (D) Linescan across the middle section of the WAVE complex nanorings. The WAVE complex signal shows ring patterns while Rac activity is broadly distributed. N = 1,700 nanorings from 12 cells. (E) Images of HL-60 cells expressing eGFP-Sra1 (green) fixed and stained with phalloidin (magenta). TIRF-SIM imaging; scale bars: 5 µm. (F) The actin pattern in cells (quantified by phalloidin fluorescence) correlates with lamellipodial length (Pearson correlation coefficient r = 0.69) but exhibits a more significantly poorer linear relation compared with WAVE complex in lamellipodia (r = 0.96) (Fig. 1 D). Each grey dot corresponds to a data point for a single cell. Green triangles with error bars show the mean and standard deviation of binned actin intensity within successive ranges of lamellipodia length, quantified the same way as shown in Fig. 1, D and G. N = 67 cells. (G) The membrane-bounded protein droplets (Fyn-HoTag3) adapted from the SPARK-ON system developed by Chung et al. (2023). (H) Expression of Fyn-HoTag3 in HEK293T cells. Upper right inset shows magnified ROI with blue circles showing the quantified regions. TIRF-SIM imaging; scale bars: 2 and 1 µm (inset). (I) The membrane-tagged SPARK-ON system exhibits a quadratic relation to radius and a linear relation to area, as expected for a planar distribution pattern. N = 407 puncta from 30 cells acquired in three experiments.
Here, we investigate the rules of the WAVE complex organization through in vivo biochemistry. With quantitative fluorescent imaging and analysis, we demonstrate that the WAVE complex forms linear distributions on cell membranes as expected for an NPF that builds sheet-like actin networks. To further investigate the biophysical properties of the WAVE complex in a cellular context, we use single-molecule tracking in combination with fluorescent molecular counting and show that the WAVE complex forms solid-like linear arrays with a stereotypic multilayered organization pattern. Additionally, the WAVE complex organization pattern remains invariant regardless of its expression level, suggesting that the WAVE complex is a core and rate-limiting component of the linear array. We had previously demonstrated a correlation of WAVE complex enrichment to membrane curvature—the WAVE complex linear arrays are always associated with negative membrane curvature in the native cellular context (Drab et al., 2023; Pipathsouk et al., 2021). To functionally test how membrane curvature affects WAVE complex dynamics, we use nanobeads, nanopatterns, and cell compression to manipulate cellular membrane curvature. We find that negative membrane curvature is both sufficient and necessary for WAVE complex assembly on cell membranes in the presence of upstream activators (Rac, Arf1/6, and PIP3) and the proline-rich domains (PRD) of both WAVE2 and Abi2. Finally, through computational modeling, we demonstrate that the WAVE complex’s linear organization and preference for negative curvature both play important roles in robust lamellipodia formation.
Results
The WAVE complex forms linear distribution patterns on cell membranes
To build a sheet-like lamellipod, we expect the WAVE complex to organize into a linear distribution on cell membranes. To quantify the native accumulation patterns of the WAVE complex on cell membranes, we used fluorescent quantification to measure the relation between the number of subunits and the pattern of the structure. A linear distribution (that grows in one dimension) exhibits a linear relation between the length of the pattern and the number of subunits, while a planar distribution (that grows in two dimensions) exhibits a quadratic relation between the length of the pattern and the number of subunits (Fig. 1 A). To visualize the WAVE complex distribution patterns on cell membranes, we stably expressed eGFP-Sra1 (one of the WAVE complex subunits) in neutrophil-like HL-60 cells and imaged them with total internal reflection fluorescence–structured-illumination microscopy (TIRF-SIM). Quantification of the fluorescent intensities of the WAVE complex versus the lengths of the wave patterns at the tips of lamellipodia revealed a highly linear relation between them (Pearson correlation coefficient r = 0.96; Fig. 1, B–D). To study the intrinsic WAVE complex accumulation patterns freed from the constraints of the actin cytoskeleton, we used latrunculin B (latB) to deplete actin polymers. Under these conditions, the WAVE complex forms nanoscale ring structures (Fig. 1, E and F; and Video 1; Pipathsouk et al., 2021). As for lamellipodia, the fluorescent intensity of the WAVE complex nanorings also scales linearly with the radius (length) of the nanoring structures in cells treated with latB (Pearson correlation coefficient r = 0.86; Fig. 1 G). This linear relation between the fluorescent intensity (that indicates the number of monomers) and the length of the pattern suggests an underlying linear distribution of the WAVE complex. Additionally, the WAVE complex concentration per unit length in nanorings under latB treatment is consistent with that at the tips of lamellipodia (Fig. 1 H), suggesting an invariant pattern of WAVE complex linear assembly over a wide range of cellular conditions. As a comparison with other lamellipodia components, we also examined the distribution of polymerized actin as a function of lamellipodial length (Fig. S1 E). Actin correlates with lamellipodial length (r = 0.69) but exhibits a significantly poorer linear relation compared with WAVE complex in lamellipodia (Fig. S1 F). Lastly as a control for a planar structure (comparable with N-WASP focal droplets), we adapted the SPARK-ON system that drives protein separation in the cytosol through the multivalent interactions between HoTag3 and HoTag6 (Fig. S1 G; Chung et al., 2023). By adding a membrane Fyn tag (Xia and Götz, 2014) to one of the SPARK-ON system components, HoTag3, we found that it can self-oligomerize when targeted to the cell membrane in HEK293T cells even in the absence of HoTag6 (Fig. S1, G and H), possibly due to the high local concentration of HoTag3 upon membrane recruitment. Unlike the WAVE complex that forms linear patterns on cell membranes, HoTag3 exhibits a quadratic relation between the fluorescent intensities and the radius of the pattern and a linear relation to the area (Fig. S1 I), suggesting the formation of a planar structure in contrast to the linear distribution of the WAVE complex.

The WAVE complex is distributed linearly on cell membranes. Here, we sought to use quantitative fluorescence microscopy to probe the spatial organization of the WAVE complex in cells. (A) For a linear distribution of subunits, we expect a linear relation between the length of the structure and the number of subunits (green). For a planar distribution of subunits, we expect a quadratic relation between the length of the structure and the number of subunits (blue). (B) The WAVE complex localizes to the protruding tips of lamellipodia in a migratory cell. (C) eGFP-Sra1–labeled WAVE complex in a migrating neutrophil-like HL-60 cell. Green color marks the region of the lamellipod used for WAVE complex quantification. TIRF-SIM imaging; scale bar: 2 µm. (D) WAVE complex enrichment at the tips of the lamellipodia scales linearly with lamellipodial length with a very high r value, suggesting a highly linear distribution pattern of the WAVE complex. Green triangles with error bars show the mean and standard deviation of binned WAVE complex fluorescent intensity within successive ranges of lamellipodia length. N = 331 lamellipodia from 32 cells acquired in three experiments. Pearson correlation coefficient r = 0.96. (E) The WAVE complex forms nanoring structures in the absence of actin cytoskeleton. (F) eGFP-Sra1–labeled WAVE complex nanorings in an HL-60 cell treated with 0.5 µM actin inhibitor latB. Upper right shows the white boxed inset with WAVE complex nanorings marked in green for quantification. TIRF-SIM imaging; scale bar: 2 and 1 µm (inset). (G) WAVE complex nanorings scale linearly with radius, suggesting an underlying linear distribution pattern of the WAVE complex. Green triangles with error bars show the mean and standard deviation of binned WAVE complex nanoring fluorescent intensity within successive ranges of nanoring radius. N = 5,217 nanorings from 38 cells acquired in four experiments. Pearson correlation coefficient r = 0.86. (H) Comparison of the WAVE complex linear distribution patterns between the tips of lamellipodia and nanorings. The WAVE complex at the lamellipodia and nanorings were measured and compared within the same cell. Distribution patterns were quantified by conducting linescans across the WAVE complex at the tips of lamellipodia (top left) and nanorings (bottom left). The peak height of the fluorescent distribution along the linescans was calculated, using the average of two peaks for nanorings. No significant differences in the WAVE complex distribution pattern between the tips of lamellipodia and nanorings were observed, suggesting that the WAVE complex may adopt similar linear organizations under these distinct conditions. N = 35 cells acquired in three experiments. P = 0.64 by a paired two-tailed t test.
The WAVE complex is distributed linearly on cell membranes. Here, we sought to use quantitative fluorescence microscopy to probe the spatial organization of the WAVE complex in cells. (A) For a linear distribution of subunits, we expect a linear relation between the length of the structure and the number of subunits (green). For a planar distribution of subunits, we expect a quadratic relation between the length of the structure and the number of subunits (blue). (B) The WAVE complex localizes to the protruding tips of lamellipodia in a migratory cell. (C) eGFP-Sra1–labeled WAVE complex in a migrating neutrophil-like HL-60 cell. Green color marks the region of the lamellipod used for WAVE complex quantification. TIRF-SIM imaging; scale bar: 2 µm. (D) WAVE complex enrichment at the tips of the lamellipodia scales linearly with lamellipodial length with a very high r value, suggesting a highly linear distribution pattern of the WAVE complex. Green triangles with error bars show the mean and standard deviation of binned WAVE complex fluorescent intensity within successive ranges of lamellipodia length. N = 331 lamellipodia from 32 cells acquired in three experiments. Pearson correlation coefficient r = 0.96. (E) The WAVE complex forms nanoring structures in the absence of actin cytoskeleton. (F) eGFP-Sra1–labeled WAVE complex nanorings in an HL-60 cell treated with 0.5 µM actin inhibitor latB. Upper right shows the white boxed inset with WAVE complex nanorings marked in green for quantification. TIRF-SIM imaging; scale bar: 2 and 1 µm (inset). (G) WAVE complex nanorings scale linearly with radius, suggesting an underlying linear distribution pattern of the WAVE complex. Green triangles with error bars show the mean and standard deviation of binned WAVE complex nanoring fluorescent intensity within successive ranges of nanoring radius. N = 5,217 nanorings from 38 cells acquired in four experiments. Pearson correlation coefficient r = 0.86. (H) Comparison of the WAVE complex linear distribution patterns between the tips of lamellipodia and nanorings. The WAVE complex at the lamellipodia and nanorings were measured and compared within the same cell. Distribution patterns were quantified by conducting linescans across the WAVE complex at the tips of lamellipodia (top left) and nanorings (bottom left). The peak height of the fluorescent distribution along the linescans was calculated, using the average of two peaks for nanorings. No significant differences in the WAVE complex distribution pattern between the tips of lamellipodia and nanorings were observed, suggesting that the WAVE complex may adopt similar linear organizations under these distinct conditions. N = 35 cells acquired in three experiments. P = 0.64 by a paired two-tailed t test.
The WAVE complex is a core component of a linear array with a solid-like organization pattern
The WAVE-related NPF N-WASP undergoes liquid–liquid phase separation on cell membranes (Banjade and Rosen, 2014; Case et al., 2019). In contrast, the mechanism by which the WAVE complex forms linear organizations in cells is not known; purified WAVE complex does not assemble on its own (Chen et al., 2010). We envisioned two possibilities for the linear organization of the WAVE complex—either the WAVE complex binds to a pre-existing linear protein scaffold, like microtubule-associated proteins binding to microtubules (Bodakuntla et al., 2019), or the WAVE complex could represent a core component of a linear array, like tubulin subunits in microtubules. To differentiate between these possibilities, we titrated the expression level of the WAVE complex in cells. If the WAVE complex is associated with an independently formed protein scaffold, the WAVE complex concentration per unit length, which we measure by unit length fluorescent intensity on the scaffold, should scale within the WAVE complex expression level (Fig. 2 A). In contrast, if the WAVE complex is a core component of a linear array, the WAVE complex should exhibit invariant concentration per unit length (Fig. 2 B). We titrated the WAVE complex abundance via stable Hem1-eGFP expression in Hem1 KO HL-60 cells (Fig. S2, A–C): disruption of any WAVE complex subunit destabilizes the remaining subunits of the WAVE complex (Innocenti et al., 2004; Mendoza, 2013), resulting in loss of lamellipodia formation in HL-60 cells (Graziano et al., 2019); reintroduction of Hem1-eGFP in Hem1 KO cells titrates the WAVE complex expression level proportional to Hem1-eGFP rescue (Fig. S2 C). Our data show that the WAVE complex linear arrays at the tips of lamellipodia exhibit invariant fluorescent intensity per unit length at all levels of Hem1-eGFP expression (Fig. 2, C and D). A similar behavior was observed for WAVE complex nanorings in the absence of the actin cytoskeleton (Fig. S2, D and E). These data suggest that the WAVE complex is a core and rate-limiting component of the linear array rather than associating with a pre-existing scaffold.

The WAVE complex is a core component of a linear array with a solid-like organization. (A) For proteins that bind to a pre-existing linear structure (like MAPs binding to microtubules), the protein concentration per unit length scales with the expression level of the protein. (B) Proteins that are core components of a linear structure should exhibit an invariant concentration per unit length regardless of expression level (like tubulin monomers forming microtubules). (C) Titrating the WAVE complex abundance via Hem1-eGFP expression in Hem1 KO cells (see Fig. S2 C) shows that the WAVE complex exhibits an invariant concentration per unit length at the tips of lamellipodia, suggesting that the WAVE complex is a core component of the linear array in which it is organized. Each dot corresponds to the average unit length intensity of the WAVE complex at the tips of lamellipodia (y axis; TIRF-SIM imaging) and the corresponding Hem1-eGFP expression level (x axis; epi-fluorescence imaging–see Fig. S2 A for examples) in each cell. Pearson correlation coefficient between WAVE complex unit length intensity and Hem1-eGFP expression level is 0.14. The magenta line shows the linear relation between the unit length intensity of the WAVE complex and the Hem1-eGFP expression level that would be expected for a protein that binds a pre-existing array. N = 50 cells. (D) Example images of the WAVE complex linear array at the tips of lamellipodia corresponding to each diamond dot in C with different shades of green indicating different expression levels of Hem1-eGFP. TIRF-SIM imaging; scale bar: 2 µm. (E) We employed single-molecule tracking to differentiate between two different potential modes of protein organization structures—solid-like arrays (like actin filaments or microtubules) and diffusive protein associations (like liquid–liquid protein condensates such as N-WASP). Bottom shows the mock kymographs of the single particle dynamics in each mode. (F) Single-molecule tracking data of the Halo-tagged Sra1 cell line show that the WAVE complex subunits remain stationary in the latB-treated cells. Left: sparse labeling of the Halo-Sra1 HL-60 cells. Each magenta circle annotates a single Sra1 subunit of the WAVE complex at the rim of the cell. TIRF imaging; scale bar: 2 µm. Middle: selected tracks of Sra1 subunits in the background of fully labeled Halo-Sra1 signal. Scale bar: 2 µm. Right: kymographs of the Sra1 subunit indicating a solid-like organization of the WAVE complex within the linear array. Scale bars: 2 µm. (G) Single-molecule tracking data of the Halo-tagged CAAX cell line show the dynamic and diffusive behavior of the membrane-binding CAAX protein in latB-treated HL-60 cells. Left: sparse labeling of the Halo-CAAX HL-60 cells. Each magenta circle annotates a single CAAX protein. TIRF imaging; scale bar: 2 µm. Middle: selected tracks of single CAAX proteins in the background of fully labeled Halo-CAAX signal. Scale bar: 2 µm. Right: kymographs showing the diffusive nature of CAAX on the cell membrane. Scale bars: 2 µm. (H) Diffusion coefficient of the WAVE complex at the rim of latB-treated HL-60 cells (green; n = 144 from 12 cells) versus the CAAX protein (grey; n = 2,157 from 24 cells). P = 6.3e-13 by an unpaired two-tailed t test.
The WAVE complex is a core component of a linear array with a solid-like organization. (A) For proteins that bind to a pre-existing linear structure (like MAPs binding to microtubules), the protein concentration per unit length scales with the expression level of the protein. (B) Proteins that are core components of a linear structure should exhibit an invariant concentration per unit length regardless of expression level (like tubulin monomers forming microtubules). (C) Titrating the WAVE complex abundance via Hem1-eGFP expression in Hem1 KO cells (see Fig. S2 C) shows that the WAVE complex exhibits an invariant concentration per unit length at the tips of lamellipodia, suggesting that the WAVE complex is a core component of the linear array in which it is organized. Each dot corresponds to the average unit length intensity of the WAVE complex at the tips of lamellipodia (y axis; TIRF-SIM imaging) and the corresponding Hem1-eGFP expression level (x axis; epi-fluorescence imaging–see Fig. S2 A for examples) in each cell. Pearson correlation coefficient between WAVE complex unit length intensity and Hem1-eGFP expression level is 0.14. The magenta line shows the linear relation between the unit length intensity of the WAVE complex and the Hem1-eGFP expression level that would be expected for a protein that binds a pre-existing array. N = 50 cells. (D) Example images of the WAVE complex linear array at the tips of lamellipodia corresponding to each diamond dot in C with different shades of green indicating different expression levels of Hem1-eGFP. TIRF-SIM imaging; scale bar: 2 µm. (E) We employed single-molecule tracking to differentiate between two different potential modes of protein organization structures—solid-like arrays (like actin filaments or microtubules) and diffusive protein associations (like liquid–liquid protein condensates such as N-WASP). Bottom shows the mock kymographs of the single particle dynamics in each mode. (F) Single-molecule tracking data of the Halo-tagged Sra1 cell line show that the WAVE complex subunits remain stationary in the latB-treated cells. Left: sparse labeling of the Halo-Sra1 HL-60 cells. Each magenta circle annotates a single Sra1 subunit of the WAVE complex at the rim of the cell. TIRF imaging; scale bar: 2 µm. Middle: selected tracks of Sra1 subunits in the background of fully labeled Halo-Sra1 signal. Scale bar: 2 µm. Right: kymographs of the Sra1 subunit indicating a solid-like organization of the WAVE complex within the linear array. Scale bars: 2 µm. (G) Single-molecule tracking data of the Halo-tagged CAAX cell line show the dynamic and diffusive behavior of the membrane-binding CAAX protein in latB-treated HL-60 cells. Left: sparse labeling of the Halo-CAAX HL-60 cells. Each magenta circle annotates a single CAAX protein. TIRF imaging; scale bar: 2 µm. Middle: selected tracks of single CAAX proteins in the background of fully labeled Halo-CAAX signal. Scale bar: 2 µm. Right: kymographs showing the diffusive nature of CAAX on the cell membrane. Scale bars: 2 µm. (H) Diffusion coefficient of the WAVE complex at the rim of latB-treated HL-60 cells (green; n = 144 from 12 cells) versus the CAAX protein (grey; n = 2,157 from 24 cells). P = 6.3e-13 by an unpaired two-tailed t test.
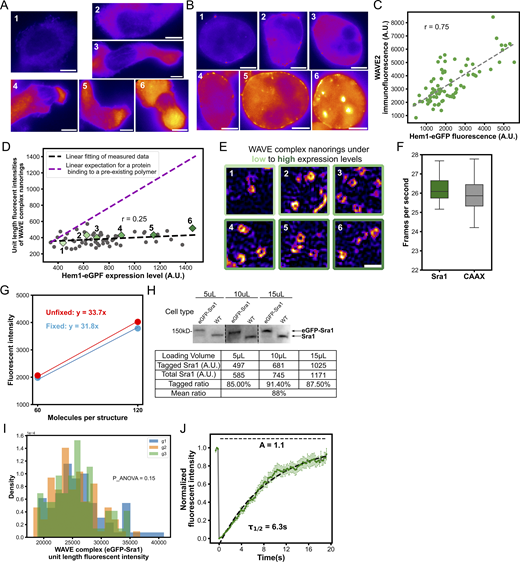
Supplemental data for Hem1 KO, single-molecule tracking, molecular counting, and FRAP experiments. (A) Epi-fluorescence imaging data showing the various expression levels, from low to high, of selected migratory cells in Fig. 2, C and D. Scale bars: 5 µm. (B) Epi-fluorescence imaging data showing the various expression levels, from low to high, of selected LatB-treated cells in D. Scale bars: 5 µm. (C) WAVE complex expression level scales with Hem1-eGFP fluorescence level. Hem1 KO cells expressing different levels of Hem1-eGFP were fixed and immunostained for WAVE2 protein. Cells were imaged with TIRF microscope, and each cell was quantified for the Hem1-eGFP fluorescence level and corresponding WAVE2 immunofluorescence. Pearson correlation coefficient between WAVE2 immunofluorescence and Hem1-eGFP expression level is 0.75. N = 79 cells. (D) Titrating the WAVE complex abundance via Hem1-eGFP expression in Hem1 KO cells treated with latB. The WAVE complex nanorings also exhibit an invariant concentration per unit length. Each dot corresponds to the average unit length intensity of the WAVE complex nanorings (y axis; TIRF-SIM imaging) and the corresponding Hem1-eGFP expression level (x axis; Epi-fluorescence imaging) in each cell, n = 58 cells. Pearson correlation coefficient between WAVE complex unit length intensity and Hem1-eGFP expression level is 0.25, suggesting minimal correlation between them. Examples of WAVE complex at the tips of lamellipodia for the green diamond dots are shown in E. Magenta line shows the linear relation between the unit length intensity of the WAVE complex and Hem1-eGFP expression level that would be expected for a protein that binds a pre-existing array. (E) Example images of the WAVE complex nanorings corresponding to each diamond dot in D with different shades of green indicating different expression levels. TIRF-SIM imaging; scale bar: 0.5 µm. (F) Image acquisition speed for the single-molecule tracking experiment. N = 12 for Halo-Sra1 cells, n = 24 for Halo-CAAX cells. (G) Correction for fluorescence loss after fixation. 60mer: n = 73 puncta from n = 6 fixed cells and n = 88 puncta from n = 8 unfixed cells. 120mer: n = 35 puncta from n = 7 fixed cells and n = 40 puncta from n = 6 unfixed cells. Ring-TIRF imaging. The fixed versus unfixed ratio was determined by the ratio between the slope coefficients of the two fitted curves (31.8/33.7 = 0.944). (H) Western blot with serial dilutions of the sample to calculate the percentage of eGFP-tagged Sra1 subunits in cells. The percentage of eGFP-tagged Sra1 subunits in the eGFP-Sra1 cell line used for molecular counting is 88%. (I) Statistical analysis on between-group variation of TIRF-SIM. Three groups of HL-60 cells expressing eGFP-Sra1 were imaged on TIRF-SIM on three different days. The unit length fluorescent intensities of eGFP-Sra1 at the tips of lamellipodia were quantified and compared between each group by a two-tailed, one-way ANOVA test. P = 0.15 suggests no significant between-group variation. N = 9 cells for each group. (J) The WAVE complex at the tips of lamellipodia in migratory HL-60 cells shows a fast and complete fluorescent recovery after photobleaching. N = 15 cells. Source data are available for this figure: SourceData FS2.

Supplemental data for Hem1 KO, single-molecule tracking, molecular counting, and FRAP experiments. (A) Epi-fluorescence imaging data showing the various expression levels, from low to high, of selected migratory cells in Fig. 2, C and D. Scale bars: 5 µm. (B) Epi-fluorescence imaging data showing the various expression levels, from low to high, of selected LatB-treated cells in D. Scale bars: 5 µm. (C) WAVE complex expression level scales with Hem1-eGFP fluorescence level. Hem1 KO cells expressing different levels of Hem1-eGFP were fixed and immunostained for WAVE2 protein. Cells were imaged with TIRF microscope, and each cell was quantified for the Hem1-eGFP fluorescence level and corresponding WAVE2 immunofluorescence. Pearson correlation coefficient between WAVE2 immunofluorescence and Hem1-eGFP expression level is 0.75. N = 79 cells. (D) Titrating the WAVE complex abundance via Hem1-eGFP expression in Hem1 KO cells treated with latB. The WAVE complex nanorings also exhibit an invariant concentration per unit length. Each dot corresponds to the average unit length intensity of the WAVE complex nanorings (y axis; TIRF-SIM imaging) and the corresponding Hem1-eGFP expression level (x axis; Epi-fluorescence imaging) in each cell, n = 58 cells. Pearson correlation coefficient between WAVE complex unit length intensity and Hem1-eGFP expression level is 0.25, suggesting minimal correlation between them. Examples of WAVE complex at the tips of lamellipodia for the green diamond dots are shown in E. Magenta line shows the linear relation between the unit length intensity of the WAVE complex and Hem1-eGFP expression level that would be expected for a protein that binds a pre-existing array. (E) Example images of the WAVE complex nanorings corresponding to each diamond dot in D with different shades of green indicating different expression levels. TIRF-SIM imaging; scale bar: 0.5 µm. (F) Image acquisition speed for the single-molecule tracking experiment. N = 12 for Halo-Sra1 cells, n = 24 for Halo-CAAX cells. (G) Correction for fluorescence loss after fixation. 60mer: n = 73 puncta from n = 6 fixed cells and n = 88 puncta from n = 8 unfixed cells. 120mer: n = 35 puncta from n = 7 fixed cells and n = 40 puncta from n = 6 unfixed cells. Ring-TIRF imaging. The fixed versus unfixed ratio was determined by the ratio between the slope coefficients of the two fitted curves (31.8/33.7 = 0.944). (H) Western blot with serial dilutions of the sample to calculate the percentage of eGFP-tagged Sra1 subunits in cells. The percentage of eGFP-tagged Sra1 subunits in the eGFP-Sra1 cell line used for molecular counting is 88%. (I) Statistical analysis on between-group variation of TIRF-SIM. Three groups of HL-60 cells expressing eGFP-Sra1 were imaged on TIRF-SIM on three different days. The unit length fluorescent intensities of eGFP-Sra1 at the tips of lamellipodia were quantified and compared between each group by a two-tailed, one-way ANOVA test. P = 0.15 suggests no significant between-group variation. N = 9 cells for each group. (J) The WAVE complex at the tips of lamellipodia in migratory HL-60 cells shows a fast and complete fluorescent recovery after photobleaching. N = 15 cells. Source data are available for this figure: SourceData FS2.
Next, we investigated the modes of WAVE complex subunit organization on cell membranes. These linear arrays could either be solid-like (like actin filaments or microtubules) or diffusive (like N-WASP condensates) (Fig. 2 E). Previous studies examining the WAVE subunit dynamics at the tips of lamellipodia have demonstrated their diffusive behavior on cell membranes with lateral movement driven by actin elongation (Mehidi et al., 2021). To explore the intrinsic modes of WAVE complex subunit organization in the absence of actin-applied forces, we employed single-molecule tracking to examine WAVE complex dynamics in latB-treated cells. Upon treatment with actin inhibitor, the WAVE complex organizes into nanorings as well as linear structures at the cell periphery. We focused our analysis on these linear structures at the cell periphery as they represent a larger substrate for lateral diffusion. We expressed Halo-tagged Sra1 in HL-60 cells and labeled the cells with two HaloTag ligand dyes, a high concentration of JF646 for full labeling of the WAVE complex and a lower concentration of JF549 (sparse labeling) for single-molecule tracking (Fig. 2 F). As a control for a protein that is diffusive in the membrane, we expressed Halo-tagged membrane-binding motif CAAX in HL-60 cells (Fig. 2 G). Cells were treated with an actin inhibitor latB and then imaged with TIRF microscopy at a rate of ∼26 frames per second (Fig. S2 F). The single-molecule traces indicate that the WAVE complex monomers in the linear WAVE complex arrays are mostly stationary and with minimal diffusion, whereas the CAAX-tagged proteins exhibit significant lateral diffusion (Fig. 2, F–H and Video 2). Compared with the WAVE complex subunit at the tips of propagating lamellipodia (D = 0.12 µm2/s; Mehidi et al., 2021), the WAVE complex in the absence of the actin cytoskeleton shows almost an order of magnitude decrease in diffusion (D = 0.014 µm2/s; Fig. 2 H). Particles with such low diffusion coefficient (<0.015 µm2/s) are usually defined as immobile particles (Mehidi et al., 2021; Orré et al., 2018), suggesting that the intrinsic property of WAVE complex linear arrays in the absence of actin assembly is solid-like, similar to protein polymers like actin filaments or microtubules.
Single-molecule tracking on sparse labeled Halo-tagged cell lines. Single-molecular tracking data of the Halo-Sra1 cells (left) and Halo-CAAX cells (right) sparse labeled with JF549 and treated with 0.5 µM latB. Magenta circles annotate the single molecules identified by TrackMate, and cyan lines show selected tracks. TIRF imaging; scale bar: 2 µm.
Single-molecule tracking on sparse labeled Halo-tagged cell lines. Single-molecular tracking data of the Halo-Sra1 cells (left) and Halo-CAAX cells (right) sparse labeled with JF549 and treated with 0.5 µM latB. Magenta circles annotate the single molecules identified by TrackMate, and cyan lines show selected tracks. TIRF imaging; scale bar: 2 µm.
The WAVE complex linear array exhibits a multilayered organization
The WAVE complex solid-like linear array could either adopt a single-layered or a multilayered arrangement. To investigate the subunit arrangement of the WAVE complex linear array, we performed molecular counting of the WAVE complex linear arrays on cell membranes. We leveraged fluorescent standard candles to calculate the number of fluorescent molecules using the microscopically measured fluorescent intensities to construct a fluorescence-based standard curve (Akamatsu et al., 2020; Hsia et al., 2016). The membrane-tagged fluorescent candles with 12, 60, or 120 copies of eGFP proteins were expressed in HL-60 cells (Fig. 3 A). We used TIRF-SIM to measure the fluorescence intensities of the standard candles in cells that were chemically fixed to limit the movement of the candles on the cell membrane (Fig. 3 A). We used this data to construct a fluorescence-based standard curve that confirms good linearity between the fluorescent intensities and the number of fluorescent molecules in each standard candle (Fig. 3 A).

The WAVE complex linear array has a multilayered organization. (A) To investigate the basis of WAVE complex subunit organization in linear arrays in cells, we performed molecular counting of the number of WAVE complexes in lamellipodia using the fluorescent standard candles developed by Hsia et al. (2016), Akamatsu et al. (2020) that contain known numbers of eGFPs. Left: Expression of the fluorescent standard candles in HL-60 cells. Cells were fixed with glutaraldehyde. TIRF-SIM imaging; scale bars: 1 µm. Middle: Histograms of the fluorescent distributions of 12-mer (n = 58 from 11 cells), 60-mer (n = 85 from 9 cells), and 120-mer (n = 64 from 10 cells) candles. Red lines show the kernel density estimation of each distribution. Right: Fluorescence-based standard curve showing the relation between the fluorescent intensities and the numbers of fluorescent molecules. Line shows a linear fit through zero. (B) If the WAVE complex is adopting a single-layered homopolymeric arrangement, this would require 50–125 copies of the WAVE complex to make an array of 1 µm, based on PDB 3p8c by Chen et al. (2010). (C) Histogram of the number of WAVE complexes with a mode of 680 per micron in lamellipodia. This number was calculated using the standard curve in B, corrected by the fixed versus unfixed fluorescence ratio (Fig. S2 G) and the percentage of eGFP-tagged WAVE complex as determined by western blot (Fig. S2 H). Black line shows the kernel density estimation of the distribution. Middle right inset shows the TIRF-SIM live imaging of the eGFP-Sra1–labeled WAVE complex at the tips of lamellipodia (scale bar: 5 µm) in living cells using the same imaging setup as the standard candles. N = 242 from 27 cells over three experiments. (D) Based on these data, the WAVE complex linear array must adopt a multilayered arrangement at least 5–14 layers thick (depending on the orientation of the WAVE complex and potential co-oligomerization with other binding partners[grey]). (E) We employed FRAP of the WAVE complex array to study its turnover dynamics. The bleached WAVE complex begins recovering within a couple of seconds in latB-treated HL-60 cells. Ring-TIRF imaging; scale bars: 2 µm. (F) Kymographs showing the recovery of the WAVE complex fluorescent signal within 5 s after photobleaching in latB-treated HL-60 cells. Data represent averages from 12 bleached sites from 12 cells. (G) Line scans of the kymographs at different time points show uniform recovery within the WAVE complex array. Grey dashed line shows normalized fluorescent intensity along the pre-bleached region. Black solid lines show normalized fluorescent intensities along the postbleached region at different time points. (H) Quantification of the WAVE complex FRAP in latB-treated cells. The WAVE complex shows partial recovery with a ratio of 68%. N = 12 cells. (I) Protein polymers (actin or microtubules) typically exchange at the end of the array (and not in the interior of the array). (J) Based on the FRAP data, we envision two possible organization patterns of the WAVE complex. Left: a single multilayered array that permits internal subunit exchanges. Right: a set of bundles where subunit exchanges occur at the end of each bundle.
The WAVE complex linear array has a multilayered organization. (A) To investigate the basis of WAVE complex subunit organization in linear arrays in cells, we performed molecular counting of the number of WAVE complexes in lamellipodia using the fluorescent standard candles developed by Hsia et al. (2016), Akamatsu et al. (2020) that contain known numbers of eGFPs. Left: Expression of the fluorescent standard candles in HL-60 cells. Cells were fixed with glutaraldehyde. TIRF-SIM imaging; scale bars: 1 µm. Middle: Histograms of the fluorescent distributions of 12-mer (n = 58 from 11 cells), 60-mer (n = 85 from 9 cells), and 120-mer (n = 64 from 10 cells) candles. Red lines show the kernel density estimation of each distribution. Right: Fluorescence-based standard curve showing the relation between the fluorescent intensities and the numbers of fluorescent molecules. Line shows a linear fit through zero. (B) If the WAVE complex is adopting a single-layered homopolymeric arrangement, this would require 50–125 copies of the WAVE complex to make an array of 1 µm, based on PDB 3p8c by Chen et al. (2010). (C) Histogram of the number of WAVE complexes with a mode of 680 per micron in lamellipodia. This number was calculated using the standard curve in B, corrected by the fixed versus unfixed fluorescence ratio (Fig. S2 G) and the percentage of eGFP-tagged WAVE complex as determined by western blot (Fig. S2 H). Black line shows the kernel density estimation of the distribution. Middle right inset shows the TIRF-SIM live imaging of the eGFP-Sra1–labeled WAVE complex at the tips of lamellipodia (scale bar: 5 µm) in living cells using the same imaging setup as the standard candles. N = 242 from 27 cells over three experiments. (D) Based on these data, the WAVE complex linear array must adopt a multilayered arrangement at least 5–14 layers thick (depending on the orientation of the WAVE complex and potential co-oligomerization with other binding partners[grey]). (E) We employed FRAP of the WAVE complex array to study its turnover dynamics. The bleached WAVE complex begins recovering within a couple of seconds in latB-treated HL-60 cells. Ring-TIRF imaging; scale bars: 2 µm. (F) Kymographs showing the recovery of the WAVE complex fluorescent signal within 5 s after photobleaching in latB-treated HL-60 cells. Data represent averages from 12 bleached sites from 12 cells. (G) Line scans of the kymographs at different time points show uniform recovery within the WAVE complex array. Grey dashed line shows normalized fluorescent intensity along the pre-bleached region. Black solid lines show normalized fluorescent intensities along the postbleached region at different time points. (H) Quantification of the WAVE complex FRAP in latB-treated cells. The WAVE complex shows partial recovery with a ratio of 68%. N = 12 cells. (I) Protein polymers (actin or microtubules) typically exchange at the end of the array (and not in the interior of the array). (J) Based on the FRAP data, we envision two possible organization patterns of the WAVE complex. Left: a single multilayered array that permits internal subunit exchanges. Right: a set of bundles where subunit exchanges occur at the end of each bundle.
If the WAVE complex is forming a single-layered array, it would necessitate at least 50–125 copies of the WAVE complex per micron, given the dimension (200 × 110 × 80 Å) of a single WAVE complex (Fig. 3 B; Z. Chen et al., 2010). To determine the number of the WAVE complexes within the linear array, we used the eGFP-Sra1 subunit of the WAVE complex to calculate the absolute abundance of the WAVE complex at the cell membrane in HL-60 cells. The total expression level of the WAVE complex in each cell was not affected by eGFP-Sra1, as any subunit not incorporated into the WAVE complex is degraded (Graziano et al., 2019; Pipathsouk et al., 2021; Weiner et al., 2006). We quantified the fluorescent intensities of the eGFP-Sra1 at the tips of lamellipodia with TIRF-SIM that allows highly consistent and reproducible TIRF image acquisition and quantification (Fig. S2 I). Correcting for fluorescence loss after fixation and the tagged ratio of the Sra1 subunits (Fig. S2, G and H) yielded a mode of 680 copies of the WAVE complex per micron at the tips of lamellipodia (Fig. 3 C). This value of 680 is much greater than the copies of WAVE complex that would be required to make a single-layered array (Fig. 3 B), suggesting that the WAVE complex forms a multilayered array at least 5–14 layers thick (considering potential co-oligomerization with other binding proteins) at the tips of lamellipodia (Fig. 3 D).
To investigate the mechanism of WAVE complex linear array assembly, we used FRAP to study the turnover dynamics of the WAVE complex on cell membranes. The WAVE complex exhibits rapid turnover dynamics at the tips of lamellipodia in migrating cells with a half-life of 6.3 s and complete exchange along the length of the array (Fig. S2 J and Video 3; Lai et al., 2008; Mehidi et al., 2021; Weiner et al., 2007). When treated with the actin inhibitor latB, the turnover dynamics of the WAVE complex are decreased to 22 s, with about one third of the WAVE complex molecules failing to exchange within the linear array (Fig. 3 H). The exchanging molecules exhibit a uniform recovery pattern along the bleached region (Fig. 3, E–G and Video 4), indicating that the molecule exchange occurs between the array and the cytosolic pool with minimal diffusion within the array itself (Fig. 2, F–H). This turnover behavior is notably distinct from actin or microtubule polymers, where subunits typically only exchange at the end of the protein array (Fig. 3 I; Katsuno et al., 2015; Smith et al., 2013; Vorobjev et al., 1999). This uniform but partial recovery pattern suggests that the WAVE complex could either be a single multilayered linear array like a microtubule that permits molecule exchange within the array as microtubules do under certain conditions (Kuo et al., 2022), or the WAVE complex could form a bundled array where molecular exchanges occur at the end of each short polymer within the array (Fig. 3 J).
FRAP on WAVE complex at the tips of lamellipodia in a migratory HL-60 cell. Photobleaching occurred at t = 0.6 s. The white circle annotates the region for photobleaching. Images were acquired at 200 ms/frame. Ring-TIRF imaging; scale bar: 5 µm.
FRAP on WAVE complex at the tips of lamellipodia in a migratory HL-60 cell. Photobleaching occurred at t = 0.6 s. The white circle annotates the region for photobleaching. Images were acquired at 200 ms/frame. Ring-TIRF imaging; scale bar: 5 µm.
FRAP on WAVE complex in a latB-treated HL-60 cell. Photobleaching happened at t = 2.0 s. The white box annotates the region for photobleaching. Images were acquired at 500 ms/frame. Ring-TIRF imaging; scale bar: 5 µm.
FRAP on WAVE complex in a latB-treated HL-60 cell. Photobleaching happened at t = 2.0 s. The white box annotates the region for photobleaching. Images were acquired at 500 ms/frame. Ring-TIRF imaging; scale bar: 5 µm.
Negative membrane curvature is both sufficient and necessary for WAVE complex membrane association
Some multilayered polymers, like microtubules, can polymerize into a curved parallel array where their lateral extension of polymerization is constrained by the intrinsic curvature of the polymer (Chrétien et al., 1995; Nogales and Wang, 2006). Is curvature playing a similar role for the assembly of the multilayered WAVE complex linear arrays? Consistent with this idea, there is a characteristic membrane curvature seen for WAVE complex recruitment in cells. The WAVE complex localizes to the tips of the lamellipodia that exhibit negative curvature of a radius of 65 nm in the axis of protrusion (x-z plane) and little-to-no curvature along the lamellipod (x-y plane) (Fig. 4 A; Pipathsouk et al., 2021; Schmeiser and Winkler, 2015). For cells treated with actin inhibitor, the WAVE complex forms nanorings localized to the saddle curvature neck of membrane invagination sites, consisting of a protruding negative curvature of a radius of 65 nm perpendicular to the invagination neck (x-z plane) and a positive curvature of a radius of 115 nm around the invagination neck (x-y plane) (Fig. 4 B; Pipathsouk et al., 2021). Despite dramatic differences in the overall membrane morphology, the 65 nm radius of negative curvature is preserved between both of these contexts. These correlative data suggest that this negative membrane curvature could be a key permissive factor in WAVE complex association on cell membranes.

Membrane curvature is both sufficient and necessary for WAVE complex membrane association. (A) The WAVE complex localizes to the tips of lamellipodia that exhibit a radius of negative curvature (x-z plane) of 65 nm and little to no curvature along the lamellipod (x-y plane). (B) The WAVE complex nanorings in cells treated with actin inhibitor localize to the neck of the membrane invagination site with a radius of negative curvature (x-z plane) of 65 nm and positive curvature (x-y plane) of 115 nm. (C) To test if membrane curvature is sufficient for WAVE complex membrane association, we used nanobeads to induce negative membrane curvatures in migrating HL-60 cells. The WAVE complex (eGFP-Sra1; green) colocalizes with and forms ring structures around the 200 nm beads (magenta). Insets are shown on the right. Scale bars: 2 and 1 µm (insets). (D) Quantification of the WAVE complex intensity (eGFP-Sra1) on beads compared with membrane marker (Cell Mask Deep Red). The WAVE complex shows significantly increased signals on beads, showing the ability of negative membrane curvature to induce WAVE complex membrane recruitment. P = 6.3e-6 by a paired two-tailed t test on the mean normalized WAVE complex and membrane intensity at all beads in each cell. N = 14 cells. (E) The WAVE complex (green) shows persistent association with beads over 60 s. N = 120 beads from 14 cells. (F) To test if membrane curvature is necessary for WAVE complex membrane association, we compressed the latB-treated HL-60 cells with an agarose pad to iron out membrane invagination sites. Persistence of WAVE complex nanorings would suggest that membrane curvature is dispensable for WAVE complex membrane association in linear arrays (Model A). Disappearance of WAVE complex nanorings following compression would suggest that membrane curvature is necessary for WAVE complex membrane association in linear arrays (Model B). (G) eGFP-Sra1 HL-60 cells before (left) and after (right) compression. The vast majority of the WAVE complex nanorings disappear following compression. The WAVE complex arrays are only maintained at the rim of the cell, where the negative membrane curvature persists following compression. TIRF-SIM imaging; scale bars: 5 µm. (H) WAVE complex nanoring abundance before (n = 16 cells) and after compression (n = 18 cells). P = 4.9e-10 by an unpaired two-tailed t test. (I) Rescuing WAVE complex membrane association after compression with nanopatterns that can induce negative membrane curvature. (J) WAVE complex (green) reassociates on the cell membrane with negative curvatures induced by nanopatterns even in the presence of the agarose-based compression. TIRF-SIM imaging; scale bars: 2 µm.
Membrane curvature is both sufficient and necessary for WAVE complex membrane association. (A) The WAVE complex localizes to the tips of lamellipodia that exhibit a radius of negative curvature (x-z plane) of 65 nm and little to no curvature along the lamellipod (x-y plane). (B) The WAVE complex nanorings in cells treated with actin inhibitor localize to the neck of the membrane invagination site with a radius of negative curvature (x-z plane) of 65 nm and positive curvature (x-y plane) of 115 nm. (C) To test if membrane curvature is sufficient for WAVE complex membrane association, we used nanobeads to induce negative membrane curvatures in migrating HL-60 cells. The WAVE complex (eGFP-Sra1; green) colocalizes with and forms ring structures around the 200 nm beads (magenta). Insets are shown on the right. Scale bars: 2 and 1 µm (insets). (D) Quantification of the WAVE complex intensity (eGFP-Sra1) on beads compared with membrane marker (Cell Mask Deep Red). The WAVE complex shows significantly increased signals on beads, showing the ability of negative membrane curvature to induce WAVE complex membrane recruitment. P = 6.3e-6 by a paired two-tailed t test on the mean normalized WAVE complex and membrane intensity at all beads in each cell. N = 14 cells. (E) The WAVE complex (green) shows persistent association with beads over 60 s. N = 120 beads from 14 cells. (F) To test if membrane curvature is necessary for WAVE complex membrane association, we compressed the latB-treated HL-60 cells with an agarose pad to iron out membrane invagination sites. Persistence of WAVE complex nanorings would suggest that membrane curvature is dispensable for WAVE complex membrane association in linear arrays (Model A). Disappearance of WAVE complex nanorings following compression would suggest that membrane curvature is necessary for WAVE complex membrane association in linear arrays (Model B). (G) eGFP-Sra1 HL-60 cells before (left) and after (right) compression. The vast majority of the WAVE complex nanorings disappear following compression. The WAVE complex arrays are only maintained at the rim of the cell, where the negative membrane curvature persists following compression. TIRF-SIM imaging; scale bars: 5 µm. (H) WAVE complex nanoring abundance before (n = 16 cells) and after compression (n = 18 cells). P = 4.9e-10 by an unpaired two-tailed t test. (I) Rescuing WAVE complex membrane association after compression with nanopatterns that can induce negative membrane curvature. (J) WAVE complex (green) reassociates on the cell membrane with negative curvatures induced by nanopatterns even in the presence of the agarose-based compression. TIRF-SIM imaging; scale bars: 2 µm.
To test the functional role of negative membrane curvature in WAVE complex linear assembly, we first investigated whether negative curvature is sufficient for WAVE complex membrane association. We exposed migrating cells to polystyrene beads of 200 nm that could induce membrane invaginations with negative curvature (Fig. 4 C). As eGFP-Sra1–tagged HL-60 cells migrate over these beads, the WAVE complex forms ring structures at the neck of membrane invagination sites (Fig. 4 C; and Videos 5 and 6). The WAVE complex signal is persistent on beads over time and significantly higher than the membrane dye signal (Fig. 4, D and E), indicating that the increase in WAVE signal is not due to excess membrane accumulation but rather reflects WAVE complex accumulation at the negative membrane curvature induced by the beads. These data suggest that negative curvature is sufficient to induce WAVE complex membrane association in the context of a migrating cell; though, as we show later, this recruitment depends on the permissive inputs of upstream activators (Fig. 5, F–H).
TIRF imaging of an HL-60 cell migrating on 200 nm beads. WAVE complex (eGFP-Sra1; green) colocalizes with and stays on 200 nm beads (magenta) as cells migrate. Ring-TIRF imaging; scale bar: 5 µm.
TIRF imaging of an HL-60 cell migrating on 200 nm beads. WAVE complex (eGFP-Sra1; green) colocalizes with and stays on 200 nm beads (magenta) as cells migrate. Ring-TIRF imaging; scale bar: 5 µm.
TIRF-SIM imaging of an HL-60 cell migrating on 200 nm beads. WAVE complex (eGFP-Sra1; green) forms ring structures around 200 nm beads (magenta) as cells migrate. TIRF-SIM imaging; scale bar: 5 µm.
TIRF-SIM imaging of an HL-60 cell migrating on 200 nm beads. WAVE complex (eGFP-Sra1; green) forms ring structures around 200 nm beads (magenta) as cells migrate. TIRF-SIM imaging; scale bar: 5 µm.

Testing co-requirement proteins for WAVE complex linear organization and curvature sensation in cells. (A) To test if the negative curvature-sensing I-BAR protein family is required for WAVE complex linear organization and curvature sensing, we expressed eGFP-Sra1 in B16-F1 melanoma cells lacking all four I-BAR family proteins (I-BAR 4×KO). We found that the WAVE complex can still form lamellipodia and nanorings in the absence of the I-BAR protein family. TIRF-SIM imaging; scale bars: 5 µm (upper) and 1 µm (lower). (B) The WAVE complex exhibits similar unit length fluorescent intensity (normalized by overall eGFP-Sra1 expression level in each cell measured by epi fluorescence) in WT and I-BAR 4×KO B16-F1 cells, suggesting that the linear organization and negative curvature preference of the WAVE complex at the tips of lamellipodia do not require I-BAR proteins. N = 43 cells for WT and n = 51 cells for I-BAR 4×KO. P = 0.46 by an unpaired two-tailed t test. (C) The WAVE complex nanorings exhibit similar size and fluorescent intensity in WT and I-BAR 4×KO B16-F1 cells, suggesting that I-BAR proteins are not required for WAVE complex linear organization and curvature sensing in the absence of actin cytoskeleton. N = 22 cells for WT and n = 20 cells for I-BAR 4×KO. Unpaired two-tailed t tests were performed. (D) We investigated the role of the WAVE complex PRD in its membrane recruitment by deleting the PRD in WAVE2(∆298–407) and Abi2(∆174–409) in HL-60 cells. WAVE2∆PRD and Abi2∆PRD both can be recruited to the tips of lamellipodia and form linear organization patterns in chemoattractant-stimulated migratory HL-60 cells. Under actin inhibitor treatment, WAVE2∆PRD and Abi2∆PRD both exhibit reduced nanoring formation compared with their full-length (FL) counterparts. TIRF-SIM imaging; scale bars: 5 µm. (E) Quantification of the number of WAVE complex nanorings versus cytosolic expression level in HL-60 cells expressing FL (green) or ∆PRD WAVE complex subunits (grey). Deletion of PRD in WAVE2 and Abi2 resulted in reduced WAVE complex nanoring formation and increased unrecruited WAVE complex (cytosolic localization), suggesting that the WAVE complex membrane incorporation efficiency is impaired in the absence of the PRD. P ≤ 0.0001 by multivariate ANOVA (MANOVA) test. (F) To investigate the upstream biochemical links for WAVE complex membrane recruitment, we used pharmacological inputs to disturb potential upstream WAVE complex activators (shown in upper graph) in HL-60 cells with eGFP-Sra1 expression: C. difficile toxin B (1 µg/ml) for inhibiting Rho GTPases (Rac, Cdc42, and Rho), EHT 1864 (25 µM) for inhibiting Rac, brefeldin A (BFA; 20 µM) and chlortetracycline (CTC; 100 µM) for inhibiting Arf1 and Arf6, respectively, and duvelisib (5 µM) for inhibiting PIP3K, and thus PIP3 accumulation. The WAVE complex organizations at the tips of lamellipodia and nanorings are severely impaired when treated with Rac inhibitor (toxin B and EHT 1864). Cells with inhibited Arf1/6 or PIP3 by CTC/BFA and duvelisib also exhibit reduced lamellipodia and nanorings formation but not as potently as for Rac inhibition. TIRF-SIM imaging; scale bars: 5 µm. (G) Membrane structures formed under different drug treatment conditions. Rac inhibitors toxin B and EHT 1864 completely abolish lamellipodial formation, while inhibiting Arf1/6 or PIP3K restrains most cells from forming lamellipodia but small membrane ruffles persist. N = 456 cells for control, n = 291 cells for toxin B treatment, n = 399 cells for EHT 1846 treatment, n = 381 cells for duvelisib treatment, and n = 417 cells for CTC/BFA treatment. (H) Number of WAVE complex nanorings formed under different drug treatment conditions. N = 14 cells for control, n = 14 cells for toxin B treatment, n = 19 cells for EHT 1864 treatment, n = 15 cells for duvelisib treatment, and n = 15 cells for CTC/BFA treatment.
Testing co-requirement proteins for WAVE complex linear organization and curvature sensation in cells. (A) To test if the negative curvature-sensing I-BAR protein family is required for WAVE complex linear organization and curvature sensing, we expressed eGFP-Sra1 in B16-F1 melanoma cells lacking all four I-BAR family proteins (I-BAR 4×KO). We found that the WAVE complex can still form lamellipodia and nanorings in the absence of the I-BAR protein family. TIRF-SIM imaging; scale bars: 5 µm (upper) and 1 µm (lower). (B) The WAVE complex exhibits similar unit length fluorescent intensity (normalized by overall eGFP-Sra1 expression level in each cell measured by epi fluorescence) in WT and I-BAR 4×KO B16-F1 cells, suggesting that the linear organization and negative curvature preference of the WAVE complex at the tips of lamellipodia do not require I-BAR proteins. N = 43 cells for WT and n = 51 cells for I-BAR 4×KO. P = 0.46 by an unpaired two-tailed t test. (C) The WAVE complex nanorings exhibit similar size and fluorescent intensity in WT and I-BAR 4×KO B16-F1 cells, suggesting that I-BAR proteins are not required for WAVE complex linear organization and curvature sensing in the absence of actin cytoskeleton. N = 22 cells for WT and n = 20 cells for I-BAR 4×KO. Unpaired two-tailed t tests were performed. (D) We investigated the role of the WAVE complex PRD in its membrane recruitment by deleting the PRD in WAVE2(∆298–407) and Abi2(∆174–409) in HL-60 cells. WAVE2∆PRD and Abi2∆PRD both can be recruited to the tips of lamellipodia and form linear organization patterns in chemoattractant-stimulated migratory HL-60 cells. Under actin inhibitor treatment, WAVE2∆PRD and Abi2∆PRD both exhibit reduced nanoring formation compared with their full-length (FL) counterparts. TIRF-SIM imaging; scale bars: 5 µm. (E) Quantification of the number of WAVE complex nanorings versus cytosolic expression level in HL-60 cells expressing FL (green) or ∆PRD WAVE complex subunits (grey). Deletion of PRD in WAVE2 and Abi2 resulted in reduced WAVE complex nanoring formation and increased unrecruited WAVE complex (cytosolic localization), suggesting that the WAVE complex membrane incorporation efficiency is impaired in the absence of the PRD. P ≤ 0.0001 by multivariate ANOVA (MANOVA) test. (F) To investigate the upstream biochemical links for WAVE complex membrane recruitment, we used pharmacological inputs to disturb potential upstream WAVE complex activators (shown in upper graph) in HL-60 cells with eGFP-Sra1 expression: C. difficile toxin B (1 µg/ml) for inhibiting Rho GTPases (Rac, Cdc42, and Rho), EHT 1864 (25 µM) for inhibiting Rac, brefeldin A (BFA; 20 µM) and chlortetracycline (CTC; 100 µM) for inhibiting Arf1 and Arf6, respectively, and duvelisib (5 µM) for inhibiting PIP3K, and thus PIP3 accumulation. The WAVE complex organizations at the tips of lamellipodia and nanorings are severely impaired when treated with Rac inhibitor (toxin B and EHT 1864). Cells with inhibited Arf1/6 or PIP3 by CTC/BFA and duvelisib also exhibit reduced lamellipodia and nanorings formation but not as potently as for Rac inhibition. TIRF-SIM imaging; scale bars: 5 µm. (G) Membrane structures formed under different drug treatment conditions. Rac inhibitors toxin B and EHT 1864 completely abolish lamellipodial formation, while inhibiting Arf1/6 or PIP3K restrains most cells from forming lamellipodia but small membrane ruffles persist. N = 456 cells for control, n = 291 cells for toxin B treatment, n = 399 cells for EHT 1846 treatment, n = 381 cells for duvelisib treatment, and n = 417 cells for CTC/BFA treatment. (H) Number of WAVE complex nanorings formed under different drug treatment conditions. N = 14 cells for control, n = 14 cells for toxin B treatment, n = 19 cells for EHT 1864 treatment, n = 15 cells for duvelisib treatment, and n = 15 cells for CTC/BFA treatment.
Unlike other negative curvature-sensing proteins, such as I-BAR domain proteins, the WAVE complex does not localize to sites of double-negative membrane curvatures like the tips of filopodia (Pipathsouk et al., 2021). This suggests that the WAVE complex organization may be influenced by another axis of curvature. To investigate whether the membrane curvature perpendicular to the negative curvature axis influences the linear membrane association of the WAVE complex, we exposed migrating cells to polystyrene beads of varying diameters of 200 or 500 nm. The WAVE complex was recruited to beads of both sizes but exhibits different association dynamics depending on the bead curvature: the WAVE complex associates persistently with 200 nm beads while showing only transient association on the 500 nm beads (Fig. S3, A–C). This preference for the 200 nm beads aligns with the stereotypic diameter (230 nm) of the WAVE complex nanorings formed in the absence of actin cytoskeleton (Pipathsouk et al., 2021), indicating a preference for positive curvature around 200 nm in diameter. These findings suggest that while negative curvature is the key geometric permissive feature for WAVE complex membrane association, the positive curvature in the perpendicular axis also plays a role in regulating WAVE complex membrane recruitment.

Supplemental data for WAVE complex curvature sensing and molecular mechanism. (A) The WAVE complex (eGFP-Sra1; green) can stably associate with 200 nm beads (red). (B) The WAVE complex (eGFP-Sra1; green) associates with 500 nm beads (red) transiently. (C) WAVE complex fluorescent intensity (normalized by membrane marker signal) on 200 nm (grey) and 500 nm (green) beads over 40 s. The WAVE complex associates with 200 nm more strongly and persistently compared with 500 nm beads, suggesting that positive curvature may also affect WAVE complex membrane association. N = 99 beads for 200 nm beads and n = 169 beads for 500 nm beads. (D) Linescan of WAVE complex and membrane dye on rectangular nanopillars in HL-60 cells treated with actin inhibitor under compression. The WAVE complex shows a sharp signal increase at the boundary where the plasma membranes exit the TIRF plane, corresponding to sites of negative membrane curvature induced by the nanopillars. N = 8 nanopillars. (E) The WAVE complex and the membrane dye on different nanopatterns in migratory HL-60 cells over time. In migratory HL-60 cells, the WAVE complex can also associate with negative curvature sites induced by nanopatterns. TIRF-SIM imaging; scale bars: 2 µm. (F) We investigated the role of positive curvature-sensing TOCA protein family in WAVE complex linear organization and membrane association by knocking out all three TOCA proteins (FBP17, CIP4, and Toca-1) in HL-60 cells expressing eGFP-Sra1. TOCA 3×KO HL-60 cells can still form lamellipodia and nanorings, suggesting that the TOCA family proteins are not required for WAVE complex linear organization at the cell membrane. Top: ring-TIRF imaging; scale bars: 5 µm. Bottom: TIRF-SIM imaging; scale bars: 2 µm. (G) To test if the TOCA protein family is involved in WAVE complex curvature sensation, we analyzed TOCA 3×KO HL-60 cells migration on 200 nm beads (magenta) and found that the WAVE complex (mCherry-Sra1; green) can still be recruited to beads, suggesting that the TOCA protein family is not required for WAVE complex curvature sensation. Ring-TIRF imaging; scale bars: 5 and 2 µm (insets). (H) Linescan of WAVE complex intensity (measured as shown on the right) on 200 nm beads in TOCA 3×KO HL-60 cells. N = 33 beads. (I) Deletion of the PRD in Abi2 results in a decreased lamellipodia enrichment and increased cytosolic localization of the WAVE complex, suggesting a lower incorporation efficiency of the WAVE complex into the lamellipodia. P = 5.9e-5 by an unpaired two-tailed t test.

Supplemental data for WAVE complex curvature sensing and molecular mechanism. (A) The WAVE complex (eGFP-Sra1; green) can stably associate with 200 nm beads (red). (B) The WAVE complex (eGFP-Sra1; green) associates with 500 nm beads (red) transiently. (C) WAVE complex fluorescent intensity (normalized by membrane marker signal) on 200 nm (grey) and 500 nm (green) beads over 40 s. The WAVE complex associates with 200 nm more strongly and persistently compared with 500 nm beads, suggesting that positive curvature may also affect WAVE complex membrane association. N = 99 beads for 200 nm beads and n = 169 beads for 500 nm beads. (D) Linescan of WAVE complex and membrane dye on rectangular nanopillars in HL-60 cells treated with actin inhibitor under compression. The WAVE complex shows a sharp signal increase at the boundary where the plasma membranes exit the TIRF plane, corresponding to sites of negative membrane curvature induced by the nanopillars. N = 8 nanopillars. (E) The WAVE complex and the membrane dye on different nanopatterns in migratory HL-60 cells over time. In migratory HL-60 cells, the WAVE complex can also associate with negative curvature sites induced by nanopatterns. TIRF-SIM imaging; scale bars: 2 µm. (F) We investigated the role of positive curvature-sensing TOCA protein family in WAVE complex linear organization and membrane association by knocking out all three TOCA proteins (FBP17, CIP4, and Toca-1) in HL-60 cells expressing eGFP-Sra1. TOCA 3×KO HL-60 cells can still form lamellipodia and nanorings, suggesting that the TOCA family proteins are not required for WAVE complex linear organization at the cell membrane. Top: ring-TIRF imaging; scale bars: 5 µm. Bottom: TIRF-SIM imaging; scale bars: 2 µm. (G) To test if the TOCA protein family is involved in WAVE complex curvature sensation, we analyzed TOCA 3×KO HL-60 cells migration on 200 nm beads (magenta) and found that the WAVE complex (mCherry-Sra1; green) can still be recruited to beads, suggesting that the TOCA protein family is not required for WAVE complex curvature sensation. Ring-TIRF imaging; scale bars: 5 and 2 µm (insets). (H) Linescan of WAVE complex intensity (measured as shown on the right) on 200 nm beads in TOCA 3×KO HL-60 cells. N = 33 beads. (I) Deletion of the PRD in Abi2 results in a decreased lamellipodia enrichment and increased cytosolic localization of the WAVE complex, suggesting a lower incorporation efficiency of the WAVE complex into the lamellipodia. P = 5.9e-5 by an unpaired two-tailed t test.
Next, we tested whether negative membrane curvature is necessary for WAVE complex membrane association by inhibiting negative membrane curvature. The native negative curvature that proved most amenable to manipulation was the membrane invaginations at the ventral surface of latB-treated cells. We overlaid cells with a precast agarose pad to induce compression and iron out the membrane invagination sites. If negative curvature is required for WAVE complex membrane association, disturbing membrane invagination sites should interfere with the WAVE recruitment to nanorings (Fig. 4 F). Indeed, the WAVE complex nanorings disappear following cell compression (Fig. 4, G and H). Because the WAVE complex persists at the rim of the cell where the negative curvature is maintained (Fig. 4 G), it is unlikely that compression exerts its effects by blocking the upstream regulators WAVE complex recruitment. This suggests that the disappearance of the WAVE complex nanorings is driven by membrane curvature changes, highlighting the necessity of negative membrane curvature for WAVE complex membrane association.
Finally, we tested whether WAVE complex membrane association can be rescued during compression by reintroducing negative membrane curvature to cells. For this purpose, we provided latB-treated cells with nanopatterns at the ventral surface that could sustain negative membrane deformations following compression with the agarose pad (Fig. 4 I; Cail et al., 2022). Under these conditions, the WAVE complex forms linear arrays around the regions of micropattern-induced negative curvature (Fig. 4 J and Fig. S3 D). Moreover, the WAVE complex is also recruited to regions of negative curvature around nanopatterns in migratory cells (Fig. S3 E and Video 7). Together, these data suggest that the negative membrane curvature plays a key role in controlling WAVE complex association on cell membranes.
HL-60 cells migrating on nanopatterns. The WAVE complex enriches at the rim of nanopillars (left) and nanoridges (right) as cells migrate. TIRF-SIM imaging; scale bar: 5 µm.
HL-60 cells migrating on nanopatterns. The WAVE complex enriches at the rim of nanopillars (left) and nanoridges (right) as cells migrate. TIRF-SIM imaging; scale bar: 5 µm.
Testing co-requirement proteins for WAVE complex linear organization and curvature sensation in cells
Here, we sought to investigate the molecular mechanism of WAVE complex organization into this linear curvature-sensitive array. Since purified WAVE complex does not oligomerize or sense curvature on its own, the WAVE complex is likely to associate with other membrane-bound partners. One of the most well-known binding partners of the WAVE complex is the I-BAR domain protein family that senses negative membrane curvature and associates with lamellipodia and filopodia (Frost et al., 2009; Miki et al., 2000; Nishimura et al., 2021; Suetsugu et al., 2006; Zhao et al., 2011). Previous studies have shown that one of the I-BAR proteins, iRsp53, requires interactions with the WAVE complex to enrich to lamellipodia but is dispensable for WAVE complex’s linear organization and patterning of lamellipodia (Pipathsouk et al., 2021). Because the BAR domain protein family is known to have redundant functions (Chou et al., 2017; Insinna et al., 2019; Nkosi et al., 2013; Park et al., 2010), we utilized a B16-F1 cell line (I-BAR 4×KO) lacking all four of the I-BAR family proteins (IRSp53, MIM, iRTKS, and ABBA) from Pokrant et al. (2023). We investigated how the I-BAR family proteins affect WAVE complex membrane organization by stably expressing eGFP-Sra1 in WT and I-BAR 4×KO B16-F1 cells. Knockout of the I-BAR family has no effect on the ability of the WAVE complex to form linear arrays at the tips of lamellipodia or nanorings in the absence of actin cytoskeleton (Fig. 5 A). Both the WT and the I-BAR 4×KO cells exhibit similar unit length fluorescent intensities of the WAVE complex at the tips of lamellipodia (Fig. 5 B) as well as similar nanoring fluorescent intensities and sizes (Fig. 5 C). These data indicate that the I-BAR protein family is dispensable for WAVE complex membrane organization and curvature sensation. In addition, we also generated a triple knockout of all the TOCA family proteins (FBP17, Toca-1, and CIP4) in HL-60 cells (TOCA 3×KO). These are the most well-known sensors of positive curvature for actin regulators and have been shown to interact with the WAVE complex (Bai and Grant, 2015; Gligorijevic et al., 2012). Stably expressing mCherry-Sra1 in TOCA 3×KO HL-60 cells shows that the WAVE complex exhibits normal localization to the tips of lamellipodia and forms nanorings in the absence of actin cytoskeleton (Fig. S3 F), indicating that the TOCA protein family is not required for WAVE complex linear organization. To further investigate if the TOCA protein family is involved in WAVE complex curvature sensation, we analyzed TOCA 3×KO HL-60 cells migrating on 200 nm beads. The WAVE complex can still be recruited to the 200 nm beads (Fig. S3, G and H) in the absence of TOCA protein family, suggesting that they are not required for WAVE complex curvature sensation.
The WAVE complex contains two PRDs in the WAVE2 and Abi2 subunits, which bind to Src-homology 3 domains and mediate interactions with other proteins (Joseph et al., 2017; Mendoza, 2013). Previous studies have shown that deletion of both PRDs in B16-F1 cells impairs lamellipodia formation (Buracco et al., 2024). Here, we investigated how the PRD affects WAVE complex linear organization and membrane association in HL-60 cells. We expressed eGFP-tagged WAVE2∆PRD (∆298–407) or Abi2∆PRD (∆174–409) in WT HL-60 cells in the presence of endogenous WAVE2 and Abi2. Both WAVE2∆PRD and Abi2∆PRD can be recruited to the tips of lamellipodia and form linear arrays (Fig. 5 D), although the Abi2∆PRD exhibits reduced membrane signal at the tips of lamellipodia and increased unrecruited WAVE complex (cytosolic localization) (Fig. S3 I). When treated with actin inhibitor, WAVE2∆PRD and Abi2∆PRD can still form nanorings, but both exhibit reduced nanoring formation and increased cytosolic localization (Fig. 5, D and E), suggesting a role for their PRDs in WAVE complex membrane association.
Lastly, WAVE complex is known to be activated by several upstream proteins for membrane association, including Rac, Arf, and PIP3 (B. Chen et al., 2017; Koronakis et al., 2011; Oikawa et al., 2004; Rottner et al., 2021; Suetsugu et al., 2006). We investigated how those upstream biochemical links could affect WAVE complex membrane recruitment by treating HL-60 cells stably expressing eGFP-Sra1 with inhibitors of these upstream activators (Fig. 5 F): Rac/Rho/Cdc42 inhibitor Clostridium difficile toxin B (Just et al., 1995; Pipathsouk et al., 2021), Rac inhibitor EHT 1864 (Onesto et al., 2008; Shutes et al., 2007), Arf1 inhibitor brefeldin A (Humphreys et al., 2012), Arf6 inhibitor chlortetracycline (Macia et al., 2021), and PI3K inhibitor duvelisib (Belly et al., 2024, Preprint). Cells treated with Rac inhibitor (toxin B or EHT 1864) show severely disrupted lamellipodia and WAVE complex nanoring formation. Arf1/6 or PIP3 inhibitor also impairs the formation of WAVE complex recruitment to lamellipodia and nanorings, but not as potently as for Rac inhibitors (Fig. 5, F–H). These data suggest that Rac plays an indispensable role in WAVE complex activation and membrane association, while Arf1/6 and PIP3 are involved but may be redundant with other WAVE complex activators.
Computational simulations suggest that both linear organization and negative membrane curvature preference of the WAVE complex are required for robust lamellipodia formation
Previous work (Drab et al., 2023; Sadhu et al., 2023b; Sadhu et al., 2021) have used computational simulations to show that linking actin nucleation with self-associating proteins that sense negative curvature suffices to induce lamellipodial-like protrusions. In addition to actin nucleation and a preference for negative curvature, our current work suggests a linear organization of the WAVE complex. Here, we explored how the negative curvature sensing and linear organization of actin nucleators influence lamellipodia formation in virtual cells. We compare the behavior of previous models (negative curvature preference + isotropic interactions of nucleators) with that of the WAVE complex (negative curvature preference + anisotropic/linear interactions of nucleators).
Our modeling approach is based on simulating the dynamics of a triangulated surface that represents the cell membrane, where we consider that each surface node to be either a bare membrane or occupied by a curved membrane protein complex (CMC) (Fig. S5 A). These CMCs diffuse on the membrane while also having some finite binding energy between them, such that they can form clusters. The dynamics of the membrane shape and organization of the curved proteins is calculated using the Monte Carlo method, where the system evolves to lower its global energy, while including the effects of thermal fluctuations. The energy of the system contains the bending energy (including the effects of the spontaneous curvature of the CMC), protein–protein binding energy, and adhesion to an external surface. In addition to these components, we include the protrusive forces exerted on the membrane by actin polymerization activity inside the cell, which we assume to be recruited to the membrane by the CMC. We therefore apply a constant protrusive force on the nodes that are occupied by the CMC, directed locally outward. This model was previously explored for isotropic protein–protein binding (Fig. 6 A). Here, we are motivated by our new experimental observations to explore the dynamics when the protein–protein binding is polymer-like (Fig. 6 B). By polymer-like, we mean that the CMC can only bind at most two neighboring CMCs, such that they naturally form linear clusters. This modification gives rise to major changes in the overall CMC organization and membrane shapes (Fig. 6 B).

Computational simulations suggest that both linear organization and negative membrane curvature preference of WAVE complex are required for robust lamellipodia formation. (A and B) Phase diagram showing the regime where a lamellipod (crescent or two arc-like shape) can form for isotropic protein interactions (A) (similar to I-BAR domain + nucleator), compared with polymer-like protein–protein interactions (B) (similar to WAVE complex). Both types of protein interactions have a preference for negative membrane curvature. The polymer-like organization of actin nucleators (B) gives more robust lamellipodia formation over a wider range of parameter space than isotropically associating nucleators (A). The Y axis denotes the amplitude of the protrusive force of actin polymerization initiated by the nucleators (Eq. 3), and the X axis denotes the binding energies between the nucleators (Eq. 2). Calculation of the shape transition lines (solid lines) is described in Methods. The dashed lines denote the transition lines from the neighboring panel for comparison. For the crescent (motile) shapes, we indicate the direction of the total active force (and migration) by the red arrow. Here, we use Ead = 1.5kBT for the cell-substrate adhesion energy per membrane node (Eq. 4), the protein density ρ = 3.45%, and the total number of vertices in the vesicle n = 1,447.
Computational simulations suggest that both linear organization and negative membrane curvature preference of WAVE complex are required for robust lamellipodia formation. (A and B) Phase diagram showing the regime where a lamellipod (crescent or two arc-like shape) can form for isotropic protein interactions (A) (similar to I-BAR domain + nucleator), compared with polymer-like protein–protein interactions (B) (similar to WAVE complex). Both types of protein interactions have a preference for negative membrane curvature. The polymer-like organization of actin nucleators (B) gives more robust lamellipodia formation over a wider range of parameter space than isotropically associating nucleators (A). The Y axis denotes the amplitude of the protrusive force of actin polymerization initiated by the nucleators (Eq. 3), and the X axis denotes the binding energies between the nucleators (Eq. 2). Calculation of the shape transition lines (solid lines) is described in Methods. The dashed lines denote the transition lines from the neighboring panel for comparison. For the crescent (motile) shapes, we indicate the direction of the total active force (and migration) by the red arrow. Here, we use Ead = 1.5kBT for the cell-substrate adhesion energy per membrane node (Eq. 4), the protein density ρ = 3.45%, and the total number of vertices in the vesicle n = 1,447.
We investigated the steady-state vesicle shapes from our simulations as a function of the strength of the protrusive forces (F) and the binding energy between the CMC (w) (Fig. 6). The lamellipodia phase (light green) is defined to be when the average number of clusters becomes less than four (Fig. S5, I and J) and the steady-state vesicles are either in a crescent (motile) or two-arc (immotile) shape. When there are more than four clusters, the phase is considered to be disordered (yellow regions in Fig. 6). The budding phase (dark green region in Fig. 6 A) is distinguished from the lamellipodia phase (light green regions in Fig. 6) in the following way: when the shape of the protein clusters becomes hemispherical (below a prescribed shape threshold, see Fig. S5, I and J), it is considered to be a bud, otherwise a lamellipod. For isotropic CMC interactions, when both the binding energy and protrusive force are low, the CMC clusters are small and disorganized (the “disordered” phase, yellow region in Fig. 6 A and Fig. S5 B and left column in Video 8). When the binding energy dominates over the protrusive force (large w small F regime, dark green region in Fig. 6 A and Fig. S5 C; and lower left panel in Video 9), the CMC tends to form spherical buds. Above a critical strength of actin-induced forces, the CMC self-organizes into lamellipodia-like leading-edge clusters, either as a single crescent (motile) shape or a two-arm (immotile) shape (green region in Fig. 6 A and upper left panel in Video 9).
Comparison between isotropic versus polymer-like interaction for small ω and F. Top panel: Both the isotropic and polymeric interaction form disordered protein clusters. Parameters: ω = 1.5kBT, F = 0.25kBT/lmin. Bottom panel: Isotropic interaction forms disordered clusters, while polymeric interaction forms lamellipodia-like structures. Parameters: ω = 4.0kBT, F = 0.50kBT/lmin.
Comparison between isotropic versus polymer-like interaction for small ω and F. Top panel: Both the isotropic and polymeric interaction form disordered protein clusters. Parameters: ω = 1.5kBT, F = 0.25kBT/lmin. Bottom panel: Isotropic interaction forms disordered clusters, while polymeric interaction forms lamellipodia-like structures. Parameters: ω = 4.0kBT, F = 0.50kBT/lmin.
Comparison between isotropic versus polymer-like interaction for large ω. Top panel: Under a large F, proteins with both kind of interactions form lamellipodia-like structures. Parameters: ω = 6.0kBT, F = 2.50kBT/lmin. Bottom panel: Under a small F, proteins with isotropic interaction form buds, while polymeric interaction forms lamellipodia-like structures. Parameters: ω = 6.50kBT, F = 0.25kBT/lmin.
Comparison between isotropic versus polymer-like interaction for large ω. Top panel: Under a large F, proteins with both kind of interactions form lamellipodia-like structures. Parameters: ω = 6.0kBT, F = 2.50kBT/lmin. Bottom panel: Under a small F, proteins with isotropic interaction form buds, while polymeric interaction forms lamellipodia-like structures. Parameters: ω = 6.50kBT, F = 0.25kBT/lmin.
When the CMC interacts with at most two neighbors, forming linear polymer-like chains, we find that the phase diagram changes significantly. The buds phase vanishes, and the lamellipodia-like shapes extend to lower values of both polymerization force and binding energy between CMC interaction (Fig. 6 B; and Fig. S5, D and E, and right column in Videos 8 and 9). This indicates that by having an intrinsic tendency to form linear chain-like clusters, the CMC can form more robust leading-edge clusters that initiate lamellipodia-like protrusions and cell polarity. In Fig. S5, F and G, we show that the linear aggregation tendency allows the lamellipodia-forming region to significantly extend to lower values of actin force and surface adhesion compared with the isotropic aggregation. Note that the spontaneous negative curvature still plays an essential role, and in its absence, the tendency to form chain-like clusters is not sufficient to initiate lamellipodia protrusions (Fig. S5 H and Video 10).
Vesicle with zero spontaneous curvature proteins with polymer-like interaction, comparing small and large F cases. For the left movie, we use Ead = 1.0kBT and F = 1.0kBT/lmin. For the right movie, we use Ead = 5.0kBT, and F = 5.0kBT/lmin. Shared parameters: ω = 10kBT, c0 = 0.
Vesicle with zero spontaneous curvature proteins with polymer-like interaction, comparing small and large F cases. For the left movie, we use Ead = 1.0kBT and F = 1.0kBT/lmin. For the right movie, we use Ead = 5.0kBT, and F = 5.0kBT/lmin. Shared parameters: ω = 10kBT, c0 = 0.
Discussion
The WAVE complex is an NPF that organizes many different cellular behaviors, including chemotaxis, macropinocytosis, phagocytosis, and cell integrity (King and Kay, 2019; Pipathsouk et al., 2021; Seastone et al., 2001; Williams et al., 2022). These processes all involve flat, sheet-like actin-based protrusions (Fritz-Laylin et al., 2017b; Humphreys et al., 2016; Mylvaganam et al., 2021; Veltman et al., 2016; Yang et al., 2021), but how the WAVE complex instructs this pattern of protrusion is not well understood. Since the WAVE complex does not form linear structures in cell-free biochemical reconstitutions (Chen et al., 2010; Koronakis et al., 2011; Lebensohn and Kirschner, 2009), our work leverages in vivo biochemistry approaches to understand the logic of lamellipodia formation. We reveal a highly consistent linear organization pattern of the WAVE complex at the cell membrane that could suggest a self-organizing template for these flat, sheet-like actin networks (Fig. 1). The organization pattern of the linear array is not dependent on the expression level of the WAVE complex (Fig. 2, C and D; and Fig. S2, D and E), suggesting that the WAVE complex is a core and rate-limiting component of these linear arrays. Unlike N-WASP, which undergoes phase separation to form focal liquid-like protein condensates (Banjade and Rosen, 2014; Case et al., 2019), WAVE complex monomers form ordered linear arrays in which the subunits exhibit a fixed position relative to one another (Fig. 2, F–H). Similar to microtubules that align multiple protofilaments in a naturally curved pattern closing at the other end to form a tube, these linear arrays of the WAVE complex also exhibit a multilayered organization (Fig. 3) whose lateral extent (and thus the width of the polymer) depends on the associated negative membrane curvature, possibly forming a half tube-like structure (Fig. 7 B; Chrétien et al., 1995; Gov and Gopinathan, 2006; Nogales and Wang, 2006). Upstream activators such as Rac, Arf1/6, and PIP3 are required for membrane curvature to recruit the WAVE complex (Fig. 5, F–H and Fig. 7 A). Through computational simulations, we show that WAVE complex’s linear organization and preference for negative curvature are both essential features for robust lamellipodia formation (Fig. 6).

The WAVE complex organizes into a multilayered linear array at negative membrane curvature. (A) WAVE complex needs activation by upstream biochemical links (Rac, Arf1/6, and PIP3) to be recruited to the cell membrane, forming a linear array, possibly with other binding partners through the PRD. (B) Our proposed model of how the WAVE complex organizes into linear arrays in cells: a multilayered, solid-like linear array whose lateral extension is restricted by negative membrane curvature. (C) Our model highlights the potential role of membrane curvature in barrier avoidance. When a cell runs into a barrier (upper branch), the negative curvature at the tips of the lamellipod is disturbed, resulting in WAVE complex dissociation and cell stalling or reorientation of movement along the barrier. For barriers that preserve the shape of the lamellipod (lower branch), cells fail to recognize the barrier and have sustained WAVE complex association at the negative membrane curvature provided by the barrier (Fig. 4 E).
The WAVE complex organizes into a multilayered linear array at negative membrane curvature. (A) WAVE complex needs activation by upstream biochemical links (Rac, Arf1/6, and PIP3) to be recruited to the cell membrane, forming a linear array, possibly with other binding partners through the PRD. (B) Our proposed model of how the WAVE complex organizes into linear arrays in cells: a multilayered, solid-like linear array whose lateral extension is restricted by negative membrane curvature. (C) Our model highlights the potential role of membrane curvature in barrier avoidance. When a cell runs into a barrier (upper branch), the negative curvature at the tips of the lamellipod is disturbed, resulting in WAVE complex dissociation and cell stalling or reorientation of movement along the barrier. For barriers that preserve the shape of the lamellipod (lower branch), cells fail to recognize the barrier and have sustained WAVE complex association at the negative membrane curvature provided by the barrier (Fig. 4 E).
The linear organization pattern of the WAVE complex plays a central role in lamellipodia formation. For neutrophils and many other cells, depletion of the WAVE complex abolishes cells’ ability to build lamellipodia (Graziano et al., 2019; Law et al., 2013; Leithner et al., 2016; Whitelaw et al., 2020). In some cell types, like Dictyostelium, WASP can compensate for the lack of Scar/WAVE by organizing into a linear pattern that builds lamellipodia (Veltman et al., 2012). However, in many other cell types, including the neutrophil-like cells studied here, neither WASP nor N-WASP can rescue lamellipodia in the absence of the WAVE complex (Buracco et al., 2024; Graziano et al., 2019). In these cells, WAVE plays a central role in templating lamellipodia formation—the WAVE complex stimulates activation of the Arp2/3 complex, but the Arp2/3 complex is not required for WAVE’s ability to generate lamellipodia (Pipathsouk et al., 2021); neither the Arp2/3 complex nor actin assembly is needed for the WAVE complex to form linear arrays at the cell membrane (Buracco et al., 2024; Pipathsouk et al., 2021). Furthermore, our results show that WAVE also appears to be a core component and rate-limiting for this assembly (Fig. 2, C and D; and Fig. S2, D and E). Although these linear arrays seem to be highly regular (Fig. 2) and likely self-organizing, purified WAVE complex does not oligomerize on its own (Chen et al., 2010). In the presence of upstream activators, motility mix, and complete cytosol, the WAVE complex initiates the actin polymerization but fails to form any self-organizing distributions (Chen et al., 2010; Koronakis et al., 2011; Lebensohn and Kirschner, 2009). One possibility is that these previous assays fail to provide the strong negative membrane curvature that we have found to be required for WAVE complex membrane recruitment (Fig. 4); previous assays have used positively curved surfaces like vesicles or lipid-coated beads (Humphreys et al., 2016; Lebensohn and Kirschner, 2009) or planar lipid bilayers (Banjade and Rosen, 2014; Lebensohn and Kirschner, 2009). Another possibility is that the WAVE complex is an obligate component of the linear array but copolymerizes with other essential components, similar to the way alpha- and beta-tubulin need one another to form microtubules. The PRDs of both WAVE2 and Abi2 may play a role in the formation of this array (Fig. 5, D and E; Fig. 7 A; and Fig. S3 I). In Dictyostelium, there could be an independent linear scaffold that recruits either WAVE complex or N-WASP to support lamellipodia formation. Our work suggests a regular, possibly polymer-like arrangement of the WAVE complex at the tip of lamellipodia. Future higher resolution work, such as in situ cryo-electron tomography, will be required to understand the precise arrangement of the WAVE complex during lamellipodial formation. This approach may also reveal the biochemical basis of the proposed array.
In addition to the membrane-bound upstream activators of the WAVE complex, such as Rac, Arf, and phosphoinositide (Fig. 5, F–H and Fig. 7 A; Koronakis et al., 2011; Oikawa et al., 2004; Suetsugu et al., 2006), our work suggests an additional requirement, strong negative curvature, for WAVE complex membrane recruitment. Negative curvature is not the only determinant—positive curvature along the other axis (corresponding for example to the lagging region of a lamellipod) also plays a role, but here a much wider range of curvatures are tolerated (Fig. S3, A–C) compared with the strict requirements for strong negative curvature (Fig. 4). This negative curvature dependence could also relate to and help explain some of the emergent behaviors in cell migration. For example, when cells undergo a collision with an obstacle, they cease migration and change directions (Roycroft and Mayor, 2016; Weiner et al., 2007; Yamada and Sixt, 2019). This barrier avoidance could be achieved through several possible mechanisms, including forces acting at the leading edge (Begemann et al., 2019; Diz-Muñoz et al., 2016; Nakamura, 2024; Prass et al., 2006; Saha et al., 2018; Uray and Uray, 2021) or the nucleus (Lomakin et al., 2020; Long and Lammerding, 2021; Venturini et al., 2020), cell stalling (Brunner et al., 2006), and/or perturbation of cell shapes and curvatures (Fig. 7 C; Begemann et al., 2019; Sadhu et al., 2024; Sadhukhan et al., 2025; Sitarska et al., 2023). If membrane curvature is a primary input to barrier avoidance, then the barriers will not be recognized if they do not change the morphology of the lamellipodia, in particular the strong negative curvature. Consistent with this idea, lamellipodia do not stall at the necks of membrane invaginations or nanopatterns, since the overall negative curvature of the lamellipodia is preserved at these barriers (Fig. 4 E; Fig. S3, A and C; and Videos 5, 6, and 7). Membrane curvature could also enable cell repolarization after collision, as computational modeling shows that negative membrane curvature-sensing proteins that recruit the actin cytoskeleton suffice to guide cell reorientation and spreading by selectively aligning with the substrate (Begemann et al., 2019; Sadhu et al., 2021; Sadhu et al., 2024; Sadhukhan et al., 2025).
How the WAVE complex recognizes negative curvature is not known. The WAVE complex does not have any well-characterized curvature-sensing motifs and may require interactions with other curvature-sensing partners. One family of candidates are the curvature-sensing BAR domain proteins that interact with the WAVE complex at the tips of lamellipodia (Bai and Grant, 2015; Frost et al., 2009; Gligorijevic et al., 2012; Miki et al., 2000; Nishimura et al., 2021; Pipathsouk et al., 2021; Suetsugu et al., 2006; Zhao et al., 2011). Given the possible redundancy of the BAR domain protein family, we removed all four of the negative curvature-sensing I-BAR proteins or all three of the positive curvature-sensing TOCA proteins and show that neither of them are required for lamellipodia formation (Pokrant et al., 2023) or WAVE complex linear organization and curvature sensation at the cell membrane (Fig. 5, A–C and Fig. S3, F–H). These results rule out the strongest candidates for WAVE complex curvature sensation. It is possible that the WAVE complex may interact with additional or unknown curvature-sensitive proteins (Frost et al., 2009; Hanawa-Suetsugu et al., 2019; S. Liu et al., 2015; Pykäläinen et al., 2011). Alternatively, assembly of the WAVE complex into a linear array could present the individual WAVE complexes in a geometry that is amenable to curvature sensation. Other curvature-sensing proteins, like septins or the BAR domain family, have been shown to exhibit dramatically different curvature preferences following oligomerization compared with the preferences of the isolated monomers (Bridges et al., 2016; Nepal et al., 2021).
Lamellipodia are frequently observed protrusive structures for a wealth of migratory and morphogenetic contexts (Fritz-Laylin et al., 2017a; Ibarra et al., 2006; Kunda et al., 2003; Leithner et al., 2016; Pollard and Borisy, 2003; Rakeman and Anderson, 2006; Weiner et al., 2006; Yolland et al., 2019), suggesting a potential value of these sheet-like protrusions in these settings. The broad actin networks that compose lamellipodia can generate greater protrusive forces compared with filopodia and ensure uniform advancing of the cell membrane (Dimchev et al., 2017; Fritz-Laylin et al., 2017b; Gardel et al., 2010; Pipathsouk et al., 2021), while their flat and thin geometry could enable efficient barrier avoidance, spreading along surfaces (Sadhu et al., 2023a), and regulation of membrane reservoirs (Gauthier et al., 2011; Mueller et al., 2017). The flat, sheet-like membrane structures built by the WAVE complex are also involved in other morphogenetic processes. During macropinocytosis/phagocytosis, the WAVE complex assembles at the rim of the macropinocytic/phagocytic cups (King and Kay, 2019; Seastone et al., 2001; Veltman et al., 2016). This discrete distribution depends on upstream biochemical activators like Ras and PIP3 (Buckley et al., 2020; Yang et al., 2021); our results suggest that this focused accumulation could also be informed by the local membrane curvature of the macropinosome.
Without a defined organization structure, the default protrusive pattern for NPF-based actin assembly at membranes is finger-like membrane protrusions (Liu et al., 2008). To generate different organizations of actin networks, in vitro biochemical reconstitutions have used the same NPF artificially arrayed into different patterns, like points to generate finger-like actin networks or lines to generate sheet-like actin networks (Boujemaa-Paterski et al., 2017; Carlier et al., 2003). In cells, different NPFs are used for different morphological structures, likely because these NPFs have different patterns of self-organization: N-WASP undergoes phase separation and forms focal protein droplet structures that orchestrate the finger-like invadopodia and filopodia formation (Banjade and Rosen, 2014; Case et al., 2019), while the WAVE complex oligomerizes into linear arrays that participate in a wide variety of membrane structures involving the flat, sheet-like membrane geometries (Fig. 7 B; Gov and Gopinathan, 2006; Pipathsouk et al., 2021; Seastone et al., 2001; Veltman et al., 2016; Yang et al., 2021). In future work, it will be important to define how other rules of nucleator (and other actin regulators) self-organization underlie other actin structures, including the cell cortex and stress fibers (Bovellan et al., 2014; Hotulainen and Lappalainen, 2006; Lehtimäki et al., 2021; Svitkina, 2020; Tojkander et al., 2012).
Materials and methods
Cell culture
HL-60 cells were cultured in RPMI 1640 media supplemented with l-glutamine and 25 mM HEPES (MT10041CV; Corning) containing 10% (vol/vol) heat-inactivated FBS (16140071; Gibco BRL). Cultures were maintained at a density of 0.2–1.0 million cells/ml at 37°C/5% CO2. HL-60 cells were differentiated with 1.3% (vol/vol) DMSO (358801; Santa Cruz Biotechnology) in culture media for 5 days before experiments. HEK293T cells were grown in DMEM (SH30243.01; Cytiva) containing 10% (vol/vol) heat-inactivated FBS and maintained at 37°C/5% CO2.
Transduction of HL-60 cells
HEK293T cells were seeded into 6-well plates (2.5 ml per well) and grown until about 70% confluent. For each well, 1.5 µg pHR vector (containing the appropriate transgene), 0.167 µg vesicular stomatitis virus-G vector, and 1.2 µg cytomegalovirus 8.91 vector were mixed and prepared for transfection using TransIT-293 transfection reagent (Mirus Bio) as per the manufacturer’s instructions. After transfection, cells were grown for ∼48 h, after which virus-containing supernatants were harvested and concentrated 30–40-fold using an Lenti-X Concentrator (Takara Bio) according to the manufacturer’s instructions. Lentivirus was used immediately or stored at −80°C. HL-60 cells were transduced by overnight incubation of 0.32 million cells with 4 µg/ml polybrene and 125 μl of concentrated virus. Cells expressing desired transgenes and expression levels were isolated using FACS (FACS Aria2 or FACS Aria3; BD Biosciences). For the cells expressing the fluorescent standard candles, the lowest expression cells above the background were selected to avoid multiple candle aggregation (more than one candle in each spot).
Transient transfection of HEK293T cells
HEK293T cells were seeded into 24-well glass-bottom plates (P24-1.5H-N; Cellvis) and grown until about 70% confluent. For each well, 0.5 µg plasmid containing the appropriate transgene was used for transfection using TransIT-293 transfection reagent (Mirus Bio) according to the manufacturer’s instructions. After transfection, cells were grown for 24 h before imaging.
Plasmids
Plasmids were constructed using standard molecular biology protocols. DNA segments were PCR amplified and cloned into a pHR lentiviral backbone and driven by a promoter from spleen focus-forming virus (SFFV) via standard Gibson assembly. The membrane-tagged Hotag3 construct was modified from Chung et al. (2023), by inserting a membrane-bounded Fyn tag into the N terminus of the original coding sequence. The fluorescent standard candle constructs were modified from Akamatsu et al. (2020), by switching the fluorescent protein from tag2GFP to eGFP, followed by subcloning into the pHR lentiviral backbone. The ∆PRD constructs were made by deleting the PRD region (298–407 for WAVE2 and 174–409 for Abi2) of the eGFP-tagged WAVE complex subunits.
Immunoblotting
Protein content from one million HL-60 cells was extracted by chilled TCA precipitation and resuspended in 2× Laemmli sample buffer. Protein samples were separated via SDS–PAGE, followed by transfer onto PVDF membranes (#1620177; BIO-RAD). Membranes were blocked at RT for 1 h in a 1:1 solution of TBS (20 mM Tris, 500 mM NaCl, pH 7.4), and Odyssey Blocking Buffer (#927-40000; LI-COR), followed by overnight incubation at 4°C with primary antibodies in a solution of 1:1 TBS + 0.2% wt/vol Tween 20 (TBST) and Odyssey Blocking Buffer. Membranes were then washed three times with TBST and incubated for 45 min at RT with secondary antibodies diluted 1:10,000 in 1:1 solution of Odyssey Blocking Buffer and TBST. Membranes were then washed three times with TBST, one time with TBS, and imaged using an Odyssey Fc (LI-COR). Primary antibodies Sra1 (rabbit; 1:200; #NBP2-16060; Novus) and secondary antibodies IRDye 680RD goat anti-mouse (926-68070; 1:10,000; LI-COR) and HRP-conjugated goat anti-rabbit (1:5,000, 65-6120; Invitrogen) were used for this study.
Cell preparation for imaging
Membrane labeling
Membrane-labeling solution was made with CellMask Deep Red (Invitrogen) freshly diluted 1:500 in imaging media (Leibovitz’s L-15 [Gibco] with 2% FBS). 1 ml of differentiated HL-60 cells was spun down at 200 × g for 3 min and resuspended in 500 μl of the labeling solution. Immediately after resuspension, cells were washed twice with imaging media before plating.
Sparse labeling cells for single-molecule tracking
To label the Halo-Sra1 cells, 0.05 nM JF549 (GA1110; Promega) dye was mixed with 10 nM JF646 dye (GA1120; Promega). To label the Halo-CAAX cells, 0.001 nM JF549 with 10 nM JF646 was used. Cells were incubated with the dyes diluted in imaging media in a 37°C/5% CO2 incubator for 20 min followed by two washes with imaging media.
Cell migration on fibronectin-coated coverslips
The desired number of wells in a 96-well plate (MGB096-1-2-LG-L; Matrical, Inc.) or an 8-well Lab-Tek II chamber (155409; Thermo Fisher Scientific) were coated with 100 or 200 μl of 40 µg/μl porcine fibronectin (prepared from whole blood) diluted in imaging media for 20 min at RT, followed by two to three times with imaging media. Differentiated cells (∼0.8 million/μl) were resuspended in the imaging media of the same volume. 100 μl of cells per well were used for a 96-well plate, and 200 μl of cells per well were used for an 8-well chamber. For cell migration on beads, 200 μl of cells were mixed with 0.8 μl of 0.2-µm red fluorescent (580/605) carboxylate-modified microspheres (F8887; Invitrogen) or 1.5 μl of 0.5-µm red fluorescent (580/605) carboxylate-modified microspheres (F8887; Invitrogen) or 0.8 μl of 0.2-µm blue fluorescent (365/415) carboxylate-modified microspheres (F8805; Invitrogen; for Sra1-mCherry labeled TOCA 3×KO cells only) before plating. The imaging plate was then transferred to a 37°C/5% CO2 incubator for 15 min to allow cells to adhere. The plate was next transferred to the microscope, which had been preheated to 37°C for imaging. For chemoattractant stimulation, a 2× stock of 50 nM N-formyl-L-methionyl-L-leucyl-L-phenylalanine (fMLP; Sigma-Aldrich) was added. For F-actin inhibition, a 2× stock of 1 µM latB (Sigma-Aldrich) and 25 nM fMLP was used. All initial stocks were dissolved in 100% dry DMSO and freshly diluted in imaging media before experiments.
Imaging cells on nanopatterned substrates
Coverslips with nanopatterns were obtained from Cail et al. (2022). The nanopatterned coverslips were held in Attofluor Cell Chambers (A7816; Thermo Fisher Scientific) and coated with 200 μl of 40 µg/μl porcine fibronectin dissolved in imaging buffer for 20 min at RT. The fibronectin solution was then removed and washed twice with the imaging buffer. 500 μl of differentiated HL-60 s (∼0.8 million/ml) labeled with CellMask Deep Red (Invitrogen) were plated onto the coverslip. The chamber with the coverslip was then transferred to a 37°C/5% CO2 incubator for 15 min to allow cells to adhere. The coverslip was then gently washed twice with imaging buffer to remove unattached cells and finally exchanged for 500 μl of fresh imaging media. For the agarose compression experiment, the imaging media was removed, and a precast agarose pad with 1 µM latB was gently placed on top of the cells on nanopatterns right before imaging. For cell migration on nanopatterns, 20 nM fMLP was added to cells before imaging.
Pharmacological perturbations on the upstream activators
Cells were prepared and plated on a fibronectin-coated 96-well plate as described above. 2× drug solution diluted in imaging buffer was added to cells for 40 min and imaged with TIRF microscope. Drugs used in the experiments are C. difficile toxin B (#SML1153; 1 µg/ml; Sigma-Aldrich), EHT 1864 (#HY-16659; 25 µM; MedChemExpress), Brefeldin A (#SIALB6542; 20 µM; Sigma-Aldrich), Chlortetracycline (#C4881l; 100 µM; Sigma-Aldrich), and Duvelisib (#HY-17044; 5 µM; MedChemExpress).
Fixation
Cells were fixed by adding 2× fixation buffer (4% glutaraldehyde [Sigma-Aldrich] in PBS) and incubation at RT for 10 min. Cells were washed twice with PBS and then quenched with 0.1% sodium borohydride (Sigma-Aldrich) for 7 min, followed by two or three 10-min PBS washes.
Phalloidin staining
Cells were fixed as described above and stained with Alexa Fluor 647 phalloidin (5 μl/ml; A22287; Invitrogen) in PBS for 30 min and washed twice with PBS buffer.
Immunofluorescence
Cells were fixed as described above and blocked with 3% BSA and 0.1% Triton X-100 diluted in PBS for 1 h at RT. Primary antibody was diluted in blocking solution at 4°C overnight, washed three times with PBS, and then incubated with the secondary antibody and washed three times with PBS. WAVE2 (rabbit; #3659; Cell Signaling Technology) primary antibody was used at 1:50 dilution with secondary antibody goat anti-rabbit IgG conjugated to Alexa Fluor 647 (#A-21245; Invitrogen) at 1:1,000 dilution.
Cell compression with agarose pad
A solution of 4% low-melt agarose (A-204; Gold Biotechnology) was made in imaging media and microwaved in a loosely capped conical tube placed in a water reservoir. Heating was done in short increments to promote melting while preventing the solution from boiling over. Once completely melted, the gel was kept at RT to allow cooling while preventing solidification. 1 µM of latB was then added to the gel solution after cooling. The mold for gel casting was made by cutting the back end (that goes into a pipette) of a 1,000-μl pipette tip to get a cylinder of ∼0.7-cm tall. The mold was then placed in a 35-mm dish with the uncut (smooth) edge facing the bottom. ∼700 μl of gel solution was added to each mold and left at RT for solidification for 10–15 min. The mold was then removed carefully to let the gel keep solidifying for another 30 min at RT. To compress the cells, the imaging solution was removed, and the agarose pad was handled with a tweezer and placed directly on top of the cells.
Microscopy
All TIRF and epifluorescence images (except Fig. 2, F and G) were acquired at 37°C/5% CO2 with the DeltaVision OMX SR microscope (GE Healthcare) with a 60×/1.42 NA oil Plan Apochromat objective (Olympus) and 1.518 refractive index oil (Cargille). Images were acquired with Acquire SR software and processed with softWoRx. TIRF-SIM images were reconstructed using OMX SI Reconstruction with the default parameters. TIRM imaging was performed using the ring TIRF light path on the DeltaVision OMX SR. Epi-fluorescence imaging was performed with the conventional fluorescent light path on the DeltaVision OMX SR. FRAP experiments were performed using the ring TIRF light path combined with the FRAP/photoactivation module on the DeltaVision OMX SR.
The single-particle tracking experiments (Fig. 2, F and G) were performed on a Nikon Eclipse Ti microscope equipped with a Borealis beam-condition unit (Andor Technology), a 100× Plan Apochromat TIRF 1.49 NA objective (Nikon), and an iXon Ultra EMCCD camera. Environmental control (37°C/5% CO2; Okolab) was used. Acquisition was controlled with Micro-Manager.
Image analysis
Quantification of the distribution patterns of the WAVE complex and other lamellipodial components
The WAVE complex at the tips of lamellipodia or the other lamellipodial components (PAK-PBD and phalloidin-stained actin) was segmented based on the fluorescence intensity from the desired channels. Segmented regions at the desired location were manually selected and quantified with the Python package scikit-image (Van Der Walt et al., 2014). For identification of the WAVE complex nanorings, each segmented region was fitted to a circle and filtered based on the fitting score (Fig. S4), followed by quantification as described above. For the membrane-bounded droplets, the images were segmented based on the fluorescence intensity from the Fyn-Hotag3 channel. The radius was calculated by taking the average of the long and the short axes of the segmented region. The fluorescent intensities of the segmented regions were binned (data points showing the average and standard deviation) and plotted against the length of the structure (length of the lamellipodia or radius for the nanorings and droplets). The linear correlation was measured by the Pearson correlation coefficient.

Identifying WAVE complex nanoring structures by circle fitting. The raw images were first segmented based on a certain threshold based on the eGFP-Sra1 fluorescence level. Each segmented region was then fitted to a circle with a radius optimized to achieve the highest filtering score, defined as the ratio between the intersection and union of the segmentation and the fitted circle. The segmentations above a certain score were used for quantification. The fluorescent intensity of each nanoring is defined as the sum of the intensity values within the fitted circle minus the background.

Identifying WAVE complex nanoring structures by circle fitting. The raw images were first segmented based on a certain threshold based on the eGFP-Sra1 fluorescence level. Each segmented region was then fitted to a circle with a radius optimized to achieve the highest filtering score, defined as the ratio between the intersection and union of the segmentation and the fitted circle. The segmentations above a certain score were used for quantification. The fluorescent intensity of each nanoring is defined as the sum of the intensity values within the fitted circle minus the background.
Comparison of the distribution pattern of the WAVE complex at the tips of lamellipodia and nanorings
To compare the WAVE complex organization pattern between the tips of lamellipodia and nanorings (Fig. 1 H), images for each cell were first acquired during migration under fMLP treatment and then acquired again after latB treatment. For quantification, linescans across the lamellipodia at multiple sites for each cell were averaged and fitted to a Gaussian curve with one peak; linescans across multiple nanorings for each cell were averaged and fitted to a Gaussian curve with two peaks. The heights of the Gaussian curves for the lamellipodia and nanorings (average of two peaks) in each cell were normalized and plotted.
Plotting WAVE complex unit length intensity against different expression levels of Hem1-eGFP
To calculate the WAVE complex unit length intensity, the WAVE complex fluorescent intensity at the tips of lamellipodia or nanorings was quantified as described above and then divided by the length of lamellipodia or the radius of the nanorings. The overall Hem1-eGFP expression level for each cell was determined by the mean Hem1-eGFP fluorescent intensity segmented and calculated through the epi-fluorescence channel. The WAVE complex unit length intensity against the Hem1-eGFP expression level for each cell was then plotted and linearly fitted to determine the Pearson correlation coefficient. The linear expectation curve for a protein binding to a pre-existing polymer was plotted using two data points: the background fluorescence (where the Hem1-eGFP fluorescence level is 0) of the TIRF images and the WAVE complex intensity at the lowest measured Hem1-eGFP expression level.
WAVE complex expression level scales with Hem1-eGFP fluorescence level
Hem1 KO cells expressing different levels of Hem1-eGFP were fixed and immunostained for WAVE2 protein. The WAVE complex expression level for each cell was determined by segmenting and calculating the mean WAVE2 immunofluorescence level, plotted against the corresponding Hem1-eGFP fluorescence level. Pearson correlation coefficient was calculated to determine if the WAVE complex expression level scales with Hem1-eGFP fluorescence level.
Single-molecular tracking
The diffusion coefficient of the WAVE complex (Halo-Sra1) and the diffusive Halo-CAAX were calculated as described above and plotted.
Quantification of the standard fluorescent candles
Fixed cells were imaged five consecutive times and bleach-corrected by fitting into a decaying exponential curve. The fluorescent candles were then segmented based on multi-otsu thresholding. Each fluorescent spot was fitted with a 2D Gaussian, and the background-independent signal was calculated using the equation for volume under the fitted Gaussian curve. The spots were then filtered based on the fitting quality and the amplitude of the Gaussian curve to remove the spots that could contain more than one candle. Finally, the spots were tracked using the Python package Trackpy, and the mean fluorescent intensities of the spots that could be detected for more than three frames were used for histogram plotting. To generate the fluorescent standard curve, the median of the histogram distribution for each fluorescent candle was calculated by kernel density estimation and plotted against the fluorescent molecules contained in each structure and finally fitted through linear regression.
Fixed versus unfixed fluorescence ratio
HL-60 cells stably expressing the 60mer and 120mer were used for determining the fluorescence difference after fixation. For fixed cells, cells were first fixed as described above and then imaged with ring-TIRF microscope. For unfixed cells, live cells were plated on fibronectin and then imaged with ring-TIRF microscope. The fixed and unfixed puncta were then quantified as described above, and the median fluorescent intensities for the fixed and unfixed cells were plotted and linearly fitted separately. The fixed versus unfixed fluorescence ratio was determined by the ratio between the slope coefficients of the fixed and unfixed linear curves.
Statistical analysis on between-group variation of TIRF-SIM
Three groups of HL-60 cells expressing eGFP-Sra1 were imaged on TIRF-SIM on three different days. The unit length fluorescent intensities of eGFP-Sra1 at the tips of lamellipodia were quantified as described above and plotted as a histogram.
Quantification of the number of the WAVE complex per micron at the tips of lamellipodia
The WAVE complex fluorescent signal at the tips of lamellipodia was segmented and quantified as described above, then divided by the length of the lamellipodia. For each lamellipod, the number of the WAVE complex per micron was calculated based on the fluorescent standard curve, the ratio of fluorescently tagged WAVE subunit, as well as fixed versus unfixed fluorescence ratio determined as described above. The numbers of the WAVE complex per micron were then plotted as a histogram, where the mode of the distribution was calculated by kernel density estimation.
FRAP analysis
For the recovery pattern analysis (Fig. 3, F and G), a 1 × 30-pixel region along the middle region of the bleached array was extracted for each cell in Fiji, and the fluorescent intensities at each time point were then averaged between all the cells. For the recovery kinetics analysis (Fig. 3 H and Fig. S2 J), the normalized fluorescent intensity of the bleached region is determined using the mean fluorescent intensity of the top 10 pixels within the bleached region, normalized by the average fluorescent intensity (top 10 pixels) of a neighboring unbleached region at the corresponding time point. The half-time and amplitude of WAVE complex recovery were determined by plotting the normalized fluorescence within the bleached region as a function of time and fitting the data with an exponential function using the Stowers Institute ImageJ Plugins.
Quantification of WAVE complex on beads
The beads under the cells were identified by finding the overlap between the beads and the cells. Beads were segmented based on the bead channel. And cells were segmented based on the eGFP-Sra1 channel. Tracking of the beads under the cells was performed using the Python package Trackpy. The fluorescent intensity of the WAVE complex/membrane dye on each bead was normalized by the WAVE signal/membrane dye surrounding that bead (not on the bead). The data used for plotting were filtered and aligned based on the peak WAVE complex signal. For tracking the fluorescent intensity of the WAVE complex (eGFP-Sra1 channel) on beads over time, the normalized WAVE complex and membrane dye signal on each bead was plotted as a function of time. For comparison between the WAVE complex and membrane signal, the average of three top fluorescent signals for each channel was calculated and then averaged for each cell.
Quantification of WAVE complex on nanopillars
Linescans of the membrane dye and the WAVE complex (eGFP-Sra1) channel were generated by projection of the fluorescent signal onto the long axis of each nanopillar, followed by 1D Gaussian smoothing of the linescan curve.
Statistical analysis
For Fig. 1 H and Fig. 4 D, paired two-tailed t tests were performed to compare different conditions/measurements in the same cells. For Fig. 2 H; Fig. 4 H; Fig. 5, B and C; and Fig. S3 I, unpaired two-tailed t tests were performed to compare different conditions/treatments on different groups of cells. For Fig. 5 E, a MANOVA test was performed to compare multiple dependent variables between the FL and the ∆PRD WAVE subunits. For Fig. S2 I, an ANOVA test was performed to compare the TIRF performance between three groups. Normality was assumed under the central limit theorem but was not formally tested.
Computational modeling
Theoretical model
Our theoretical model consists of a closed vesicle that is described by a triangulated network as shown in Fig. S5 A (Fošnaricˇ et al., 2019; Sadhu et al., 2023a; Sadhu et al., 2021; Sadhu et al., 2022; Sadhu et al., 2024). The vesicle membrane is a 2D surface, and we do not consider its thickness. The triangulated surface is formed by N vertices connected by bonds. The vertices of this triangulated surface are displaced by random Monte Carlo moves, driving the dynamics of the membrane. The bonds are also allowed to flip to allow diffusion of the vertices on the vesicle surface. In the simulation, the displacement of the vertices or the bond flip is accepted if the total energy of the system decreases by the displacement. However, if the energy is increased by the displacement, the move is only accepted with a probability that decreases exponentially with increased energy. We use here a coarse-grained model, such that we deal with length scales where the continuum description of the membrane is valid (i.e., larger than tens of nanometers) and do not include details of the molecular scale.

Model description and supplementary data for computational simulation. (A) Schematic representation of our theoretical model. (i) The vesicle is formed by a closed triangulated surface, with N number of vertices connected to its neighbors with bonds. The red dots on the surface of the vesicle represent the membrane protein complexes that tend to form a linear chain-like polymer, while the blue part represents bare membrane. Left image shows polymer formation on a spherical vesicle, while the right image shows a migrating vesicle with proteins forming linear aggregates. A zoomed version of a small section of the vesicle surface is also shown in the inset. (ii) Vertex movement: The vertex i′ is moved to i. (iii) Bond flip: The bond i-k is flipped to bond j-l. (B) Snapshots of a vesicle with isotropic interaction under a small protein–protein binding energy ω = 1.0kBT. Values of other parameters used in B–E are Ead = 1.0kBT, N = 1,447, κ = 20kBT, c0 = 1/lmin, ρ = 3.45%. (C) Vesicles with isotropic interaction under large binding energy ω = 10.0kBT form buds. (D) Snapshots of a vesicle with anisotropic (polymer-like) interaction under small protein–protein binding energy ω = 1.0kBT. (E) Snapshots of a vesicle with anisotropic interaction under large protein–protein binding energy ω = 10.0kBT. (F) Formation of lamellipodia for isotropic interaction between proteins in the Ead-F plane. The background color shows the probability of formation of a motile crescent shape (cells with a single cluster). The figure is reproduced from Sadhu et al. (2021) with minor edits. ω = 1.0kBT. (G) Fraction of mean cluster size (colormap), which corresponds to the inverse of the number of clusters. A single cluster corresponds to a value of 1 for this quantity and represents here crescent-shaped (motile) cells. Snapshots are shown for Ead = 0.5, 1.0, 1.5kBT and for F = 0, 0.5, 1.0kBT/lmin. Here, we use ω = 10.0kBT. Other parameters are N = 1,447, κ = 20kBT, c0 = 1/lmin, ρ = 3.45%. Note that our simulations do not include any in-plane bending stiffness of the CMC polymer-like clusters, which could be interesting to investigate in future work. (H) Proteins with zero spontaneous curvature (c0 = 0) and polymer-like interactions, as function of the actin protrusive force (F = 0.1, 0.5, 1.0, 2.0,4.0kBT/lmin from left to right). For small F, the proteins form ring-like aggregations, while for large F, they form filopodia-like protrusions. We use here Ead = 1.0kBT, while other parameters are the same as in B–E. (I) Quantification of the transition line between disordered clusters and lamellipodia (large leading-edge cluster), shown in Fig. 6. Here, we plot the average number of clusters as a function of F for isotropic and polymeric cases, with ω = 3.0kBT. The dashed horizontal line denotes the threshold below which we consider the system to exhibit lamellipodia. The linear clusters undergo this transition at lower magnitude of the active force. (J) Quantification of the transition line between buds and lamellipodia for the proteins with isotropic interactions (shown in Fig. 6). We plot here the average ratio of Rmax to the square root of the area of a protein cluster, where Rmax is defined as the maximum distance of a protein from the center of mass of the protein cluster. The threshold is shown in dashed horizontal lines, above which the lamellipodia phase appears. Other parameters are the same as Fig. 6.

Model description and supplementary data for computational simulation. (A) Schematic representation of our theoretical model. (i) The vesicle is formed by a closed triangulated surface, with N number of vertices connected to its neighbors with bonds. The red dots on the surface of the vesicle represent the membrane protein complexes that tend to form a linear chain-like polymer, while the blue part represents bare membrane. Left image shows polymer formation on a spherical vesicle, while the right image shows a migrating vesicle with proteins forming linear aggregates. A zoomed version of a small section of the vesicle surface is also shown in the inset. (ii) Vertex movement: The vertex i′ is moved to i. (iii) Bond flip: The bond i-k is flipped to bond j-l. (B) Snapshots of a vesicle with isotropic interaction under a small protein–protein binding energy ω = 1.0kBT. Values of other parameters used in B–E are Ead = 1.0kBT, N = 1,447, κ = 20kBT, c0 = 1/lmin, ρ = 3.45%. (C) Vesicles with isotropic interaction under large binding energy ω = 10.0kBT form buds. (D) Snapshots of a vesicle with anisotropic (polymer-like) interaction under small protein–protein binding energy ω = 1.0kBT. (E) Snapshots of a vesicle with anisotropic interaction under large protein–protein binding energy ω = 10.0kBT. (F) Formation of lamellipodia for isotropic interaction between proteins in the Ead-F plane. The background color shows the probability of formation of a motile crescent shape (cells with a single cluster). The figure is reproduced from Sadhu et al. (2021) with minor edits. ω = 1.0kBT. (G) Fraction of mean cluster size (colormap), which corresponds to the inverse of the number of clusters. A single cluster corresponds to a value of 1 for this quantity and represents here crescent-shaped (motile) cells. Snapshots are shown for Ead = 0.5, 1.0, 1.5kBT and for F = 0, 0.5, 1.0kBT/lmin. Here, we use ω = 10.0kBT. Other parameters are N = 1,447, κ = 20kBT, c0 = 1/lmin, ρ = 3.45%. Note that our simulations do not include any in-plane bending stiffness of the CMC polymer-like clusters, which could be interesting to investigate in future work. (H) Proteins with zero spontaneous curvature (c0 = 0) and polymer-like interactions, as function of the actin protrusive force (F = 0.1, 0.5, 1.0, 2.0,4.0kBT/lmin from left to right). For small F, the proteins form ring-like aggregations, while for large F, they form filopodia-like protrusions. We use here Ead = 1.0kBT, while other parameters are the same as in B–E. (I) Quantification of the transition line between disordered clusters and lamellipodia (large leading-edge cluster), shown in Fig. 6. Here, we plot the average number of clusters as a function of F for isotropic and polymeric cases, with ω = 3.0kBT. The dashed horizontal line denotes the threshold below which we consider the system to exhibit lamellipodia. The linear clusters undergo this transition at lower magnitude of the active force. (J) Quantification of the transition line between buds and lamellipodia for the proteins with isotropic interactions (shown in Fig. 6). We plot here the average ratio of Rmax to the square root of the area of a protein cluster, where Rmax is defined as the maximum distance of a protein from the center of mass of the protein cluster. The threshold is shown in dashed horizontal lines, above which the lamellipodia phase appears. Other parameters are the same as Fig. 6.
We consider four energy terms described below.
2. Protein–protein interaction energy: The protein complexes on the lipid membrane can bind with other neighboring complexes and form clusters. We consider two different cases here: An isotropic interaction between proteins that allows them to bind with proteins on neighboring nodes without any directional bias (Fošnaricˇ et al., 2019; Sadhu et al., 2023a; Sadhu et al., 2021; Sadhu et al., 2022; Sadhu et al., 2024), and an anisotropic or polymer-like interaction, where they bind to form linear chain-like aggregates. We added an extra constraint for the polymer-like interactions, such that a protein can only bind with a maximum of two of its neighbors.
For the polymer-like interaction, there is a possibility that a closed loop of proteins can form with three or more proteins. To avoid this, we do not allow all three vertices of a triangle to be simultaneously occupied with proteins. No constraints were used on clusters containing more than three proteins, as the probability that they will form closed loops over a single triangle sharply decreases as their size increases.
We did not introduce a bending energy for the shape of the linear polymer-like protein cluster itself (different from the bending energy of the membrane [Eq. 1]).
The total energy cost ∆E for a particular movement is calculated by adding all these individual energy costs. If this energy cost is negative, the movement is always accepted; otherwise, it is accepted with a probability exp(−∆E/kBT) where kB is the Boltzmann constant and T is the absolute temperature at which the system is kept. We express all the energy terms in units of kBT for simplicity.
We perform Monte Carlo simulations of the vesicle with a total number of vertices N = 1,447 and the number of proteins Nc = 50, such that the density of proteins is ρ 3.45%. We choose these values based on our previous study (Sadhu et al., 2021), where these values of parameters give lamellipodia-like structures for a wide range of Ead and F (Fig. S5 F). We consider both the isotropic and polymer-like interaction cases and compare these results for a range of adhesion strength Ead and the magnitude of active force F.
Formation of lamellipodia for polymer-like interaction between proteins
When isotropic interactions are allowed between the membrane proteins, a lamellipodia-like structure forms only when the adhesion strength Ead and the magnitude of active force F are sufficiently large. In Sadhu et al. (2021), we showed this for small protein–protein interaction strength (Fig. S5 F).
In Fig. S5 B, we show a few snapshots for isotropic protein–protein interactions ω = 1kBT for small Ead and F, where no lamellipodial structures form. When we increase the interaction strength between proteins to ω = 10.0kBT (Fig. S5 C) small buds and finger-like protrusions form.
Next, we consider polymer-like interactions between proteins and compare the results with the isotropic case. For small ω = 1kBT, we note that there is no qualitative difference between the isotropic and polymeric cases (Fig. S5, B and D). However, as w increases, lamellipodia-like structures form, as shown in Fig. S5 E. Thus, polymer-like interactions increase the parameter range where lamellipodia can form compared with the isotropic interactions, as shown in Fig. 6.
Shape of vesicle with zero spontaneous curvature proteins and polymeric interactions
For proteins with zero spontaneous curvature and isotropic clustering interactions, no lamellipodia formation was observed in earlier studies (Sadhu et al., 2021) even with large Ead and F. The lamellipodia formation for isotropic interaction is mainly due to the aggregation of curvature-sensitive proteins close to the adhesive substrate or due to large active protrusive forces. For a protein with zero spontaneous curvature, since there is no such aggregation, there is no lamellipodia formation.
For polymer-like interaction among the proteins, there is a tendency to form linear clusters that might help them form lamellipodia. For small ω, the tendency to form linear aggregates is weak; thus, we choose here only large ω. We note that proteins form circular ring-like aggregation for small F (Fig. S5 H). For large F, these proteins pull the vesicle and form filopodia-like structures, and vesicles often get detached from the substrate if Ead is not high enough (Fig. S5 H, two left-most snapshots corresponding to F = 2.0, 4.0kBT/lmin respectively).
Quantification of the transition lines between disordered, buds, and lamellipodia phases
Here, we discuss the quantification of the different phases and the transition lines between these phases, as shown in Fig. 6.
To distinguish between a disordered cluster from lamellipodia, we measure the average number of clusters and plot it as a function of F for a given value of ω. We set the threshold to 4 such that if the average number of clusters is smaller (larger) than four, the phase will be considered as a lamellipodia (disordered protein cluster). We show in Fig. S5 I such an example for ω = 3.0kBT. Other parameters are the same as in Fig. 6.
For large ω with isotropic interaction between proteins, the proteins can form buds for small value of F, while a lamellipodia-like structure is formed for large F. Thus, there is another transition line that separates the lamellipodia phase from the bud-like structures. In this case, even for small values of F, the average number of clusters is never larger than four. To distinguish between these two phases (buds and lamellipodia), we use additional criteria by quantifying the shape of the protein clusters. We measure the ratio between the quantity Rmax to the square root of the area of the protein cluster, where Rmax is defined as the maximum distance of a protein from the center of mass of the protein cluster to which it belongs. For a hemispherical aggregation, this value is smaller than 1/2, while for a perfect linear aggregation, this value can be >1. We set a threshold of 0.8, above which the shape looks like the elongated cluster at the leading-edge of a lamellipodia, while below this threshold, the proteins can form hemispherical buds (Fig. S5 J).
Online supplemental material
Fig. S1 shows the WAVE complex adopts a restricted linear pattern compared with WAVE complex activator (Rac) and lamellipodial components (actin). Fig. S2 shows the supplemental data for Hem1 KO, single-molecule tracking, molecular counting, and FRAP experiments. Fig. S3 shows the supplemental data for WAVE complex curvature sensing and molecular mechanism. Fig. S4 shows identifying WAVE complex nanoring structures by circle fitting. Fig. S5 shows the model description and supplementary data for computational simulation. Video 1 shows the WAVE complex organization pattern in HL-60 cells. Video 2 shows the single-molecule tracking on sparse labeled Halo-tagged cell lines. Video 3 shows the FRAP on WAVE complex at the tips of lamellipodia in a migratory HL-60 cell. Video 4 shows the FRAP on WAVE complex in a latB-treated HL-60 cell. Video 5 shows the TIRF imaging of an HL-60 cell migrating on 200 nm beads. Video 6 shows the TIRF-SIM imaging of an HL-60 cell migrating on 200 nm beads. Video 7 shows the HL-60 cells migrating on nanopatterns.Video 8 shows the comparison between isotropic versus polymer-like interaction for small ω and F. Video 9 shows the comparison between isotropic versus polymer-like interaction for large ω. Video 10 shows the vesicle with zero spontaneous curvature proteins with polymer-like interaction, comparing small and large F cases.
Data availability
All image analysis code and CSV files of all data are available at https://github.com/MuziyueWu/WAVE.
Acknowledgments
We thank the Woolfson lab and the Weiner lab for helpful discussion. We thank Sue Sim, Dong Li, and Evelyn Strickland for a critical reading of the manuscript. We thank the Drubin lab and the Shu lab for providing the plasmids. We thank the Faix lab for providing the I-BAR 4×KO B16-F1 cell line. We thank Rachel Brunetti for providing the TOCA 3×KO cell line. We thank Kari Herrington and SoYeon Kim of the UCSF Imaging Core for their microscopy expertise.
This work was supported by an American Heart Association Predoctoral Fellowship 23PRE1018810 (M. Wu.), the National Institute of General Medical Sciences GM118167 (O.D. Weiner), National Science Foundation/Biotechnology and Biological Sciences Research Council grant 2019598 (O.D. Weiner and D.N. Woolfson), the National Science Foundation Center for Cellular Construction (DBI-1548297), and the Royal Society Wolfson Visiting Fellowship (N.S. Gov). Data for this study were acquired at the Center for Advanced Light Microscopy at UCSF on an OMX-SR obtained using grants from the NIH (5R35GM118119), the UCSF Program for Breakthrough Biomedical Research funded in part by the Sandler Foundation, the UCSF Research Resource Fund Award, and HHMI. The funders had no role in study design, data collection and analysis, decision to publish, or preparation of the manuscript. N.S. Gov is the incumbent of the Lee and William Abramowitz Professorial Chair of Biophysics, and acknowledges support by the Israel Science Foundation (Grant No. 207/22).
Author contributions: M. Wu: conceptualization, data curation, formal analysis, funding acquisition, investigation, methodology, project administration, resources, software, supervision, validation, visualization, and writing—original draft, review, and editing. R.K. Sadhu: formal analysis, methodology, resources, software, visualization, and writing—review and editing. K. Meyer: methodology. Z. Tang: data curation, formal analysis, software, and writing—review and editing. P. Marchando: resources. D.N. Woolfson: funding acquisition, supervision, and writing—review and editing. N.S. Gov: conceptualization, formal analysis, investigation, methodology, supervision, and writing—review and editing. O.D. Weiner: conceptualization, funding acquisition, project administration, supervision, visualization, and writing—original draft, review, and editing.