Cells coordinate diverse events at anaphase onset, including separase activation, cohesin cleavage, chromosome separation, and spindle reorganization. Regulation of the XMAP215 family member and microtubule polymerase, Stu2, at the metaphase-anaphase transition determines a redistribution from kinetochores to spindle microtubules. We show that cells modulate Stu2 kinetochore-microtubule localization by Polo-like kinase1/Cdc5-mediated phosphorylation of T866, near the Stu2 C-terminus, thereby promoting dissociation from the kinetochore Ndc80 complex. Cdk/Cdc28 likely primes Cdc5:Stu2 interaction. Cdc28 activity is also required for Stu2 nuclear import. PP2ACdc55 actively opposes Cdc5 activity on Stu2T866 during metaphase. This counter-regulation allows for switch-like redistribution of Stu2pT866 at anaphase onset when separase inhibits PP2ACdc55. Blocking Stu2T866 phosphorylation disrupts anaphase spindle progression, and we infer that PP2ACdc55 regulates the mitotic spindle by dephosphorylating multiple MAPs, including Stu2. These data support a model in which increased phosphorylation at anaphase onset results from phosphatase inhibition and point to a larger regulatory network that facilitates rapid cytoskeletal modulation required for anaphase spindle function.
Introduction
Accurate chromosome segregation during cell division ensures equal partitioning of genetic information into daughter cells. Cells must therefore exert precise temporal control on the complex set of regulatory events that determine proper segregation. At anaphase onset in particular, cells must coordinate separase activation and subsequent removal of cohesin, chromosome movement, spindle reorganization, and preparation for cytokinesis (De Gramont and Cohen-Fix, 2005). Multiple factors, including microtubule-associated proteins (MAPs) and motor proteins, are also required during anaphase to maintain the integrity of the microtubule cytoskeleton (Goshima and Vale, 2003; Khmelinskii et al., 2007; Amin et al., 2019).
The XMAP215 family member and microtubule polymerase Stu2 are among the proteins that cells must regulate at anaphase onset. Stu2 is a MAP that is essential for proper chromosome segregation, performing multiple important roles in the cell. Stu2 binds to the plus ends of microtubules to regulate microtubule dynamics (Kosco et al., 2001; van Breugel et al., 2003; Al-Bassam et al., 2006; Ayaz et al., 2012; Ayaz et al., 2014), but it also must localize to kinetochores through an interaction with the Ndc80 complex (Ndc80c) to carry out functions essential for chromosome biorientation (Hsu and Toda, 2011; Tang et al., 2013; Miller et al., 2016; Vasileva et al., 2017; Miller et al., 2019; Herman et al., 2020; Zahm et al., 2021). It also has important functions at microtubule-organizing centers to support microtubule nucleation (Wang and Huffaker, 1997; Gunzelmann et al., 2018) and at the spindle midzone to promote anaphase spindle elongation (Severin et al., 2001). This diversity of function requires dramatic relocalization of Stu2 during the cell cycle. Fluorescently labeled Stu2 shifts between various cellular locations, including kinetochores, microtubule tips, and the spindle midzone, as well as into and out of the nucleus at different cell cycle stages (Usui et al., 2003; Ma et al., 2007; Van Der Vaart et al., 2017). Furthermore, photobleaching studies show changes in Stu2 dynamics at kinetochores-proximal puncta from metaphase to anaphase (Aravamudhan et al., 2014). Understanding how cells alter Stu2’s activity and localization in the cell cycle is important for uncovering how it facilitates proper spindle maintenance and chromosome segregation and how aneuploidy might result when these processes go awry.
Strict coordination with the cell cycle implicates phosphoregulation by cell cycle kinases. We show here that phosphorylation by Cdk (Cdk/Cdc28 in yeast) of a conserved serine in Stu2’s NLS promotes nuclear import. Once in the nucleus, Stu2 associates with numerous factors, including the kinetochore. Stu2:kinetochore interaction is mediated through an interaction between Stu2’s C-terminal segment (CTS) and the Ndc80c. At anaphase onset, phosphorylation of a conserved threonine near the C-terminus of Stu2 (Stu2T866) reduces the amount of Stu2 bound to Ndc80c. We show that Stu2T866 phosphorylation depends on Polo-like kinase (Cdc5 in yeast) and that phosphorylation of a conserved serine (Stu2S603) in the basic-linker region of Stu2 primes it for Cdc5 interaction. Phosphorylation of Stu2S603 is the same modification that promotes nuclear import, showing multiple functions for this region of Stu2’s basic linker. The protein phosphatase PP2ACdc55 opposes Cdc5 modification of Stu2T866 during metaphase and sets up proper timing of Stu2T866 modification at anaphase onset. Phosphorylation of Stu2T866 corresponds with relocalization of a pool of Stu2 from kinetochores to interpolar spindle microtubules. Blocking this modification leads to defects in anaphase spindle progression and synthetic phenotypes with cellular spindle regulators, including IPL1, BIM1, and KAR3. Constitutively mimicking phosphorylation of Stu2T866 results in cell viability and chromosome segregation defects as well, highlighting the importance of dephosphorylation by PP2ACdc55. Finally, Stu2 appears to be one component of a larger network of MAPs that are regulated in a similar manner. Disrupting this entire network by blocking PP2ACdc55 activity leads to spindle defects in metaphase and anaphase, indicating this phosphatase broadly regulates the microtubule cytoskeleton during mitosis. These findings illustrate an interconnected and likely conserved network of kinases and phosphatases that regulate Stu2 activity, along with many other factors, to ensure precise timing of the numerous events that unfold in rapid succession at anaphase onset.
Results
Stu2:Ndc80c colocalization changes in the cell cycle
To assess changes in the subcellular localization of Stu2 across the cell cycle, we monitored the colocalization of Stu2 and Ndc80c. We measured signal from fluorescently labeled Stu2 and Ndc80 in yeast strains grown synchronously from a G1 arrest-release. For this and other in vivo assays, we made use of an auxin-inducible degron (AID), in which the endogenous STU2 locus is fused with IAA7 (hereafter stu2-AID) and degraded upon treatment with auxin, uncovering phenotypes of ectopic mutants or fusion proteins (Nishimura et al., 2009). We released G1-arrested stu2-AID NDC80-mKate cells harboring ectopic STU2-GFP and monitored both total cellular Stu2-GFP signal as well as the kinetochore-proximal Stu2-GFP throughout the cell cycle (Fig. 1 A). To quantify the kinetochore-proximal Stu2-GFP signal, we calculated the ratio of the intensities of Stu2-GFP and Ndc80-mKate in kinetochore-proximal puncta, as in previous studies (Aravamudhan et al., 2014). Because Ndc80c is Stu2’s kinetochore receptor, changes in the Stu2/Ndc80c ratios will reflect dynamic regulation. Total cell Stu2-GFP levels rise steadily through G1/S phases and reach a peak in mitosis. This trend is consistent with previous reports that total Stu2 expression increases as cells progress through the cell cycle (Guo et al., 2006; Santos et al., 2015). The kinetochore-proximal Stu2-GFP pool also increases through G1/S phases, mirroring total Stu2-GFP, but as the cells enter anaphase, which marks the peak in the level of total cell Stu2-GFP, kinetochore-proximal Stu2 decreases substantially (time point 75 min, Fig. 1 A; and Fig. S1, A and B). Both total cell and kinetochore Stu2-GFP levels then fall and reach a stable signal in the new G1 phase. These data suggest that during M phase, specific mechanisms cause Stu2 to dissociate from Ndc80c, despite the continuing rise in total Stu2.
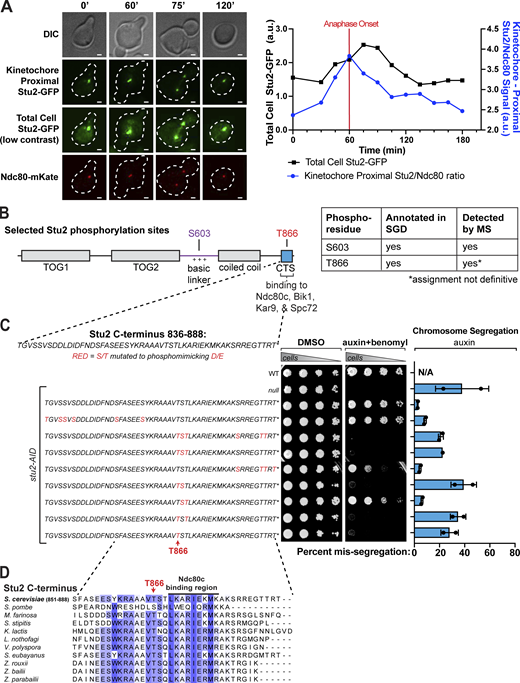
Evidence for regulation of Stu2-Ndc80c assembly in the cell cycle and identification of phosphorylated Stu2 T866. (A) Exponentially growing stu2-AID cells expressing STU2-GFP and NDC80-mKate (M3774) were arrested in G1 and released into auxin-containing media. Samples were taken every 15 min, fixed, and imaged. Left: Representative images of cells fixed at indicated time points. Scale bar is 1 µm. Right: Total GFP signal from individual cells was quantified for each time point (black line). Kinetochore-proximal Stu2-GFP signal and Ndc80-mKate signal were measured for individual puncta at each time point. Ratio of Stu2/Ndc80c signal plotted over the time course (blue line). All measurements for each time point (total cell Stu2-GFP, kinetochore-proximal Stu2/Ndc80 ratio) are an average from two replicate time-course experiments. The total number of cells for each measurement ranges from 184 to 236. Data points are mean. Error bars are SEM, but error values are too small to easily visualize. Note 75′ panels also appear in Fig. 6 A. (B) Illustrated residues on the domain-map of Stu2 indicate phosphorylated serine and threonine residues identified by mass spectrometry (for a full list of identified residues, see Fig. S1 C; and Tables S3 and S4). Exponentially growing STU2-3FLAG (M498) cultures were harvested, lysed to produce protein sample, subjected to α-Flag IP, and analyzed by mass spectrometry. Table shows which residues were also previously annotated in the Saccharomyces Genome Database (SGD). (C) Left: WT (M3), stu2-AID (no covering allele, M619), and stu2-AID cells expressing various STU2-3HA alleles from an ectopic locus (STU2WT, M2898; stu2T836E S839D S840D S842D S852D S855D S858D, M3352; stu2T866E S867D T868E S880D T885E T886E, M3353; stu2T866E S867D T868E, M3354; stu2S880D T885E T886E T888E, M3355; stu2T866E S867D, M3356; stu2S867D T868E, M3357; stu2T866E T868E, M3358; and stu2T866E, M2829) were serially diluted (fivefold) and spotted on plates containing DMSO (control) or 500 μM auxin + 5 μg/ml benomyl. Residues shown in red indicate S/T amino acids mutated to D/E. Right: Exponentially growing WT cells (M3) and stu2-AID cells harboring (CEN3.L.YA5.1)MATα on a mini chromosome as well as MFA1-3xGFP, with or without STU2-3HA covering alleles, (no covering allele, M3276; STU2WT, M3451; stu2T836E S839D S840D S842D S852D S855D S858D, M3592; stu2T866E S867D T868E S880D T885E T886E, M3593; stu2T866E S867D T868E, M3594; stu2S880D T885E T886E T888E, M3595; stu2T866E S867D, M3596; stu2S867D T868E, M3597; stu2T866E T868E, M3598; and stu2T866E, M3452) were diluted into nonselective media containing 500 μM auxin. Cells were cultured for 16 h, fixed, and then analyzed by flow cytometry to determine the percentage of cells mis-segregating the mini chromosome. Bars are means of two biological replicates. Error bars are SEM. (D) Multiple sequence alignment of the Stu2 C-terminus and C-termini from Stu2 fungal homologs. Hydrophobic residues important for Ndc80c binding (Zahm et al., 2021) are indicated under the labeled black line. IP, immunoprecipitation.
Evidence for regulation of Stu2-Ndc80c assembly in the cell cycle and identification of phosphorylated Stu2 T866. (A) Exponentially growing stu2-AID cells expressing STU2-GFP and NDC80-mKate (M3774) were arrested in G1 and released into auxin-containing media. Samples were taken every 15 min, fixed, and imaged. Left: Representative images of cells fixed at indicated time points. Scale bar is 1 µm. Right: Total GFP signal from individual cells was quantified for each time point (black line). Kinetochore-proximal Stu2-GFP signal and Ndc80-mKate signal were measured for individual puncta at each time point. Ratio of Stu2/Ndc80c signal plotted over the time course (blue line). All measurements for each time point (total cell Stu2-GFP, kinetochore-proximal Stu2/Ndc80 ratio) are an average from two replicate time-course experiments. The total number of cells for each measurement ranges from 184 to 236. Data points are mean. Error bars are SEM, but error values are too small to easily visualize. Note 75′ panels also appear in Fig. 6 A. (B) Illustrated residues on the domain-map of Stu2 indicate phosphorylated serine and threonine residues identified by mass spectrometry (for a full list of identified residues, see Fig. S1 C; and Tables S3 and S4). Exponentially growing STU2-3FLAG (M498) cultures were harvested, lysed to produce protein sample, subjected to α-Flag IP, and analyzed by mass spectrometry. Table shows which residues were also previously annotated in the Saccharomyces Genome Database (SGD). (C) Left: WT (M3), stu2-AID (no covering allele, M619), and stu2-AID cells expressing various STU2-3HA alleles from an ectopic locus (STU2WT, M2898; stu2T836E S839D S840D S842D S852D S855D S858D, M3352; stu2T866E S867D T868E S880D T885E T886E, M3353; stu2T866E S867D T868E, M3354; stu2S880D T885E T886E T888E, M3355; stu2T866E S867D, M3356; stu2S867D T868E, M3357; stu2T866E T868E, M3358; and stu2T866E, M2829) were serially diluted (fivefold) and spotted on plates containing DMSO (control) or 500 μM auxin + 5 μg/ml benomyl. Residues shown in red indicate S/T amino acids mutated to D/E. Right: Exponentially growing WT cells (M3) and stu2-AID cells harboring (CEN3.L.YA5.1)MATα on a mini chromosome as well as MFA1-3xGFP, with or without STU2-3HA covering alleles, (no covering allele, M3276; STU2WT, M3451; stu2T836E S839D S840D S842D S852D S855D S858D, M3592; stu2T866E S867D T868E S880D T885E T886E, M3593; stu2T866E S867D T868E, M3594; stu2S880D T885E T886E T888E, M3595; stu2T866E S867D, M3596; stu2S867D T868E, M3597; stu2T866E T868E, M3598; and stu2T866E, M3452) were diluted into nonselective media containing 500 μM auxin. Cells were cultured for 16 h, fixed, and then analyzed by flow cytometry to determine the percentage of cells mis-segregating the mini chromosome. Bars are means of two biological replicates. Error bars are SEM. (D) Multiple sequence alignment of the Stu2 C-terminus and C-termini from Stu2 fungal homologs. Hydrophobic residues important for Ndc80c binding (Zahm et al., 2021) are indicated under the labeled black line. IP, immunoprecipitation.

Stu2 phosphorylation and mutant viability phenotypes. (A) Exponentially growing stu2-AID cells expressing STU2-GFP and NDC80-mKate (M3774) were released from a G1 arrest into auxin-containing media. Samples were taken every 15 min, fixed, and imaged as in Fig. 1 A. Percent binucleate cells were plotted for each time point. Data points are mean from two biological replicates and n = 92–118 individual measurements. Error bars are SEM. (B) Exponentially growing stu2-AID cells expressing STU2-GFP and NDC80-mKate (M3774) were released from a G1 arrest into auxin-containing media. Samples were taken every 15 min, lysed and subjected to western blot analysis. Percent binucleate cells from a parallel time course were also determined. Stu2-GFP western blot signal persists at the end of the time course as some cells in the population remain in mitosis when Stu2 levels are much higher than G1. (C) Exponentially growing STU2-3FLAG (M498) cultures were harvested, lysed to produce protein samples, subjected to α-Flag IP, and analyzed by mass spectrometry as in Fig. 1 B. Illustrated residues on the domain map of Stu2 indicate phosphorylated serine and threonine residues identified by mass spectrometry. (D) Cell viability of STU2 mutants as in Fig. 1 C, but with more conditions. WT (M3), stu2-AID (no covering allele, M619), and stu2-AID cells expressing various STU2-3HA alleles from an ectopic locus (STU2WT, M2898; stu2T836E S839D S840D S842D S852D S855D S858D, M3352; stu2T866E S867D T868E S880D T885E T886E, M3353; stu2T866E S867D T868E, M3354; stu2S880D T885E T886E T888E, M3355; stu2T866E S867D, M3356; stu2S867D T868E, M3357; stu2T866E,T868E, M3358; and stu2T866E, M2829) were serially diluted (fivefold) and spotted on plates containing DMSO, 500 μM auxin, 5 μg/ml benomyl, or 500 μM auxin + 5 μg/ml benomyl. (E) Schematic representation of qCTF assay adapted from Zhu et al.(2015). IP, immunoprecipitation. Source data are available for this figure: SourceData FS1.
Stu2 phosphorylation and mutant viability phenotypes. (A) Exponentially growing stu2-AID cells expressing STU2-GFP and NDC80-mKate (M3774) were released from a G1 arrest into auxin-containing media. Samples were taken every 15 min, fixed, and imaged as in Fig. 1 A. Percent binucleate cells were plotted for each time point. Data points are mean from two biological replicates and n = 92–118 individual measurements. Error bars are SEM. (B) Exponentially growing stu2-AID cells expressing STU2-GFP and NDC80-mKate (M3774) were released from a G1 arrest into auxin-containing media. Samples were taken every 15 min, lysed and subjected to western blot analysis. Percent binucleate cells from a parallel time course were also determined. Stu2-GFP western blot signal persists at the end of the time course as some cells in the population remain in mitosis when Stu2 levels are much higher than G1. (C) Exponentially growing STU2-3FLAG (M498) cultures were harvested, lysed to produce protein samples, subjected to α-Flag IP, and analyzed by mass spectrometry as in Fig. 1 B. Illustrated residues on the domain map of Stu2 indicate phosphorylated serine and threonine residues identified by mass spectrometry. (D) Cell viability of STU2 mutants as in Fig. 1 C, but with more conditions. WT (M3), stu2-AID (no covering allele, M619), and stu2-AID cells expressing various STU2-3HA alleles from an ectopic locus (STU2WT, M2898; stu2T836E S839D S840D S842D S852D S855D S858D, M3352; stu2T866E S867D T868E S880D T885E T886E, M3353; stu2T866E S867D T868E, M3354; stu2S880D T885E T886E T888E, M3355; stu2T866E S867D, M3356; stu2S867D T868E, M3357; stu2T866E,T868E, M3358; and stu2T866E, M2829) were serially diluted (fivefold) and spotted on plates containing DMSO, 500 μM auxin, 5 μg/ml benomyl, or 500 μM auxin + 5 μg/ml benomyl. (E) Schematic representation of qCTF assay adapted from Zhu et al.(2015). IP, immunoprecipitation. Source data are available for this figure: SourceData FS1.
Phosphorylation of T866 near the Stu2 C-terminus
We have shown previously that the CTS of Stu2 binds the tetramerization junction of the Ndc80c (Zahm et al., 2021). The CTS contains several serine and threonine residues, and we hypothesized that phosphorylation of the CTS could affect its association with Ndc80c, as reversible phosphorylation regulates the function of many kinetochore proteins, especially by modulating their association with larger complexes (Ciferri et al., 2008; Sundin et al., 2011; London et al., 2012; Sarangapani et al., 2013; Zaytsev et al., 2015; Jenni and Harrison, 2018; Gutierrez et al., 2020; Dudziak et al., 2021). To determine if any residues in the CTS were phosphorylated, we conducted phosphoproteomic analysis of Stu2 purified from yeast. We detected many phosphorylated Stu2 peptides, including one containing CTS residues T866, S867, and T868 (Fig. 1 B and Fig. S1 C). Phosphorylation at T866 was previously reported in a proteome-wide study from yeast (Lanz et al., 2021). To determine which of the CTS residues is phosphorylated in vivo, we turned to a phenotypic screen.
Our previous work showed that mutations that perturb the binding of Stu2’s C-terminus with Ndc80c result in cellular growth and chromosome segregation defects (Zahm et al., 2021). We made phosphomimetic substitutions throughout the Stu2 CTS by replacing serines and threonines with aspartates and glutamates, respectively. We then examined the cell growth phenotype of these mutations expressed ectopically in stu2-AID cells (Fig. 1 C). We generated combinations of mutations and found that cells harboring the phosphomimetic T866E mutation were defective in growth on auxin, especially in the presence of the microtubule poison benomyl (Fig. 1 C and Fig. S1 D). We also examined chromosome segregation phenotypes of the same panel of phosphomimetic mutants using a quantitative chromosome transmission fidelity (qCTF) assay (Zhu et al., 2015) (Fig. 1 C and Fig. S1 E). Mutant constructs harboring T866E showed chromosome segregation defects that aligned with cell growth defects. Highlighting the importance of T866 in vivo, multiple sequence alignments also show that T866 is conserved across fungal species (Fig. 1 D). These results, along with the mass spectrometry data described above, support the idea that Stu2’s CTS is phosphorylated at T866 in yeast cells.
Phosphorylation of Stu2T866 reduces its association with Ndc80c
T866 is adjacent to the Ndc80c-binding region of Stu2 (Fig. 1 D). Inspection of the structure shows that it lies above a hydrophobic patch that mediates interaction with the CTS (Fig. 2, A and B) (Zahm et al., 2021). Modeling a phosphothreonine at T866 (pT866) appears to place a highly charged side chain unfavorably close to this hydrophobic surface (Fig. 2 B). Moreover, neighboring surfaces of Ndc80c have a net negative charge, likely to further destabilize association of Stu2 bearing a phosphate at T866 (Fig. S2 A). As shown in Fig. 2, C and D, fluorescence polarization–binding experiments, in which we measured displacement of an Oregon Green–labeled Stu2 CTS peptide from Ndc80cDwarf by an unlabeled CTS peptide with either unmodified T866 or pT866, showed about a sixfold lower affinity of the phosphorylated peptide (unmodified 34 ± 7.2 μM versus pT866 200 ± 70 μM). A control scrambled C-terminus peptide sequence showed no detectable binding to Ndc80Dwarf (Fig. 2 D). These data provide direct evidence that pT866 lowers the affinity of Stu2 for Ndc80c.

Phosphorylated T866 decreases binding of Stu2 to Ndc80c. (A) The crystal structure of Stu2 C-terminus bound to Ndc80Dwarf (PDB 7KDF); see Zahm et al. (2021). Ndc80cDwarf in grey, Stu2 C-terminus in blue. (B) Zoom in of crystal structure showing hydrophobicity of Stu2 and Ndc80c amino acids rendered using ChimeraX on the Kyte–Doolittle scale (kdHydrophobicity). Ndc80c proteins in surface representation; Stu2 in ribbon representation. Left: Unmodified Stu2T866 as in PDB 7KDF. Right: Modeling of Stu2pT866. (C) Schematic representation of fluorescence polarization competition assay. Oregon Green–labeled Stu2 CTS peptide prebound to Ndc80Dwarf was then incubated with unlabeled Stu2 peptide with or without pT866, and fluorescence polarization was measured. (D) A Stu2 CTS peptide (855–888), a Stu2 CTS peptide containing a phosphothreonine at position 866, and a peptide with a randomized CTS sequence were subjected to serial twofold dilutions, and each dilution was mixed 1:1 with a solution containing 30 µM Ndc80Dwarf and 200 nM Oregon Green–labeled CTS peptide, also in resuspension buffer. Fluorescence polarization was measured in triplicate in 96-well plates. Error bars are SD. Kd calculated with four parameter logistic curve fitting in Prism. (E) Exponentially growing stu2-AID cultures expressing an ectopic copy of STU2 (STU2WT, M622; stu2T866E, M1448; stu2T866V, M4398) as well as DSN1-6His-3Flag at the genomic locus were treated with auxin 30 min prior to harvesting. Kinetochore particles were purified from lysates by anti-Flag immunoprecipitation (IP) and analyzed by immunoblotting. (F) Exponentially growing stu2-AID pMET-CDC20 cultures with an ectopically expressed STU2-GFP allele (STU2WT-GFP, M2599; stu2T866E-GFP, M2600; and stu2T866V-GFP, M4447) that also contained SPC110-mCherry (spindle pole) were shifted to auxin-containing media to degrade Stu2-AID and supplemented with methionine to arrest cells in metaphase by depleting Cdc20. Cells were fixed and imaged to determine kinetochore-proximal Stu2-GFP. Bars represent the mean of n = 96–111 individual measurements. Error bars are SEM. P values from two-tailed unpaired t tests. Source data are available for this figure: SourceData F2.
Phosphorylated T866 decreases binding of Stu2 to Ndc80c. (A) The crystal structure of Stu2 C-terminus bound to Ndc80Dwarf (PDB 7KDF); see Zahm et al. (2021). Ndc80cDwarf in grey, Stu2 C-terminus in blue. (B) Zoom in of crystal structure showing hydrophobicity of Stu2 and Ndc80c amino acids rendered using ChimeraX on the Kyte–Doolittle scale (kdHydrophobicity). Ndc80c proteins in surface representation; Stu2 in ribbon representation. Left: Unmodified Stu2T866 as in PDB 7KDF. Right: Modeling of Stu2pT866. (C) Schematic representation of fluorescence polarization competition assay. Oregon Green–labeled Stu2 CTS peptide prebound to Ndc80Dwarf was then incubated with unlabeled Stu2 peptide with or without pT866, and fluorescence polarization was measured. (D) A Stu2 CTS peptide (855–888), a Stu2 CTS peptide containing a phosphothreonine at position 866, and a peptide with a randomized CTS sequence were subjected to serial twofold dilutions, and each dilution was mixed 1:1 with a solution containing 30 µM Ndc80Dwarf and 200 nM Oregon Green–labeled CTS peptide, also in resuspension buffer. Fluorescence polarization was measured in triplicate in 96-well plates. Error bars are SD. Kd calculated with four parameter logistic curve fitting in Prism. (E) Exponentially growing stu2-AID cultures expressing an ectopic copy of STU2 (STU2WT, M622; stu2T866E, M1448; stu2T866V, M4398) as well as DSN1-6His-3Flag at the genomic locus were treated with auxin 30 min prior to harvesting. Kinetochore particles were purified from lysates by anti-Flag immunoprecipitation (IP) and analyzed by immunoblotting. (F) Exponentially growing stu2-AID pMET-CDC20 cultures with an ectopically expressed STU2-GFP allele (STU2WT-GFP, M2599; stu2T866E-GFP, M2600; and stu2T866V-GFP, M4447) that also contained SPC110-mCherry (spindle pole) were shifted to auxin-containing media to degrade Stu2-AID and supplemented with methionine to arrest cells in metaphase by depleting Cdc20. Cells were fixed and imaged to determine kinetochore-proximal Stu2-GFP. Bars represent the mean of n = 96–111 individual measurements. Error bars are SEM. P values from two-tailed unpaired t tests. Source data are available for this figure: SourceData F2.

Stu2:Ndc80c-binding details, stu2T866Amutant, and Bik1-binding phenotypes. (A) The crystal structure of Stu2 C-terminus bound to Ndc80Dwarf (PDB 7KDF) showing electrostatic potential surface of Ndc80Dwarf. Stu2 illustrated as ribbon. (B) Zoom in of crystal structure (PDB 7KDF) showing hydrophobic interaction between gamma carbon of Stu2T866 and Spc24F14. This carbon is lost in an stu2T866A mutation but preserved in stu2T866V. (C) Exponentially growing stu2-AID pMET-CDC20 cultures with an ectopically expressed STU2-GFP allele (STU2WT-GFP, M2599; stu2T866E-GFP, M2600; and stu2T866A-GFP, M2601) that also contained SPC110-mCherry (spindle pole) were cultured in methionine- and auxin-containing media to arrest cells in metaphase. Cells were fixed and imaged to determine kinetochore-proximal Stu2-GFP. Bars represent the mean of n = 102–126 individual measurements. Error bars are SEM. P values from two-tailed unpaired t tests. (D) Exponentially growing stu2-AID cultures expressing an ectopic copy of STU2-3V5 (STU2WT, M622; stu2T866E, M1448; and stu2T866A, M2108) as well as DSN1-6His-3Flag from the genomic locus were treated with auxin 30 min prior to harvesting. Kinetochore particles were purified from lysates by anti-Flag immunoprecipitation (IP) and analyzed by immunoblotting. (E) WT (M3) and stu2-AID cells expressing various STU2-3HA alleles from an ectopic locus (STU2WT, M2898; stu2T866E, M2829; stu2T866A, M2830; and stu2T866V, M4444) were serially diluted (fivefold) and spotted on plates containing DMSO, 500 μM auxin, 5 μg/ml benomyl, and 500 μM auxin + 5 μg/ml benomyl. (F) To analyze expression levels, exponentially growing stu2-AID strains with various T866 mutations and fusion tags (STU2WT-V5, M622; stu2T866E-V5, M1448; stu2T866A-V5, M2108; stu2T866V-V5, M4398; STU2WT-HA, M2898; stu2T866E-HA, M2829; stu2T866A-HA, M2830; stu2T866V-HA, M4444; STU2WT-GFP, M3774; stu2T866E-GFP, M6524; stu2T866A-GFP, M3775; and stu2T866V-GFP, M4429) were lysed and subjected to immunoblot analysis. (G) Exponentially growing stu2-AID BIK1-3FLAG cells expressing STU2-3V5 variants (STU2WT, M1035; stu2Δ855–888, M1037; stu2L869E I873E M876E, M2285; and stu2T866E, M2286) were treated with auxin 30 min prior to harvesting. Bik1 complexes were purified from lysates by anti-Flag immunoprecipitation (IP) and analyzed by immunoblotting. The loss of Stu2:Bik1 interaction in stu2T866E mutant cells implies that phosphorylation of Stu2T866 may alter interaction with Bik1 and potentially other Stu2 interactors that bind to Stu2’s C-terminus. (H) AlphaFold 3 prediction of full-length Bik1 dimer bound to Stu2(855–888). Zoom in shows hydrophobic residues on Stu2 interacting with hydrophobic Bik1 surface. (I) Structure prediction as in F but colored to show plDDT confidence score. (J)fpr1Δ TOR1-1 cells (M1375) and stu2-AID fpr1Δ TOR1-1 cells expressing STU2-FRB alleles at an ectopic locus with and without NUF2-FKBP12 or BIK1-FKBP12 (STU2WT, M1513; stu2Δ855–888, M1587; STU2WTNUF2-FKBP12, M1505; stu2Δ855–888NUF2-FKBP12, M6473; STU2WTBIK1-FKBP12, M4516; and stu2Δ855–888BIK1-FKBP12, M6474) were serially diluted (fivefold) and spotted on plates containing the indicated drugs. Tethering Stu2Δ855–888-FRB to Nuf2-FKBP has been previously shown to restore cell viability; however, tethering Stu2Δ855–888-FRB to other cellular interactors of the Stu2 CTS does no rescue growth defects (Zahm et al., 2021; Abouelghar et al., 2022, Preprint). These and prior results suggest that the Ndc80c:Stu2 interaction is the most important CTS interaction for cell viability, and we thus primarily considered T866 phosphorylation in the context of Stu2:Ndc80c binding. Source data are available for this figure: SourceData FS2.
Stu2:Ndc80c-binding details, stu2T866Amutant, and Bik1-binding phenotypes. (A) The crystal structure of Stu2 C-terminus bound to Ndc80Dwarf (PDB 7KDF) showing electrostatic potential surface of Ndc80Dwarf. Stu2 illustrated as ribbon. (B) Zoom in of crystal structure (PDB 7KDF) showing hydrophobic interaction between gamma carbon of Stu2T866 and Spc24F14. This carbon is lost in an stu2T866A mutation but preserved in stu2T866V. (C) Exponentially growing stu2-AID pMET-CDC20 cultures with an ectopically expressed STU2-GFP allele (STU2WT-GFP, M2599; stu2T866E-GFP, M2600; and stu2T866A-GFP, M2601) that also contained SPC110-mCherry (spindle pole) were cultured in methionine- and auxin-containing media to arrest cells in metaphase. Cells were fixed and imaged to determine kinetochore-proximal Stu2-GFP. Bars represent the mean of n = 102–126 individual measurements. Error bars are SEM. P values from two-tailed unpaired t tests. (D) Exponentially growing stu2-AID cultures expressing an ectopic copy of STU2-3V5 (STU2WT, M622; stu2T866E, M1448; and stu2T866A, M2108) as well as DSN1-6His-3Flag from the genomic locus were treated with auxin 30 min prior to harvesting. Kinetochore particles were purified from lysates by anti-Flag immunoprecipitation (IP) and analyzed by immunoblotting. (E) WT (M3) and stu2-AID cells expressing various STU2-3HA alleles from an ectopic locus (STU2WT, M2898; stu2T866E, M2829; stu2T866A, M2830; and stu2T866V, M4444) were serially diluted (fivefold) and spotted on plates containing DMSO, 500 μM auxin, 5 μg/ml benomyl, and 500 μM auxin + 5 μg/ml benomyl. (F) To analyze expression levels, exponentially growing stu2-AID strains with various T866 mutations and fusion tags (STU2WT-V5, M622; stu2T866E-V5, M1448; stu2T866A-V5, M2108; stu2T866V-V5, M4398; STU2WT-HA, M2898; stu2T866E-HA, M2829; stu2T866A-HA, M2830; stu2T866V-HA, M4444; STU2WT-GFP, M3774; stu2T866E-GFP, M6524; stu2T866A-GFP, M3775; and stu2T866V-GFP, M4429) were lysed and subjected to immunoblot analysis. (G) Exponentially growing stu2-AID BIK1-3FLAG cells expressing STU2-3V5 variants (STU2WT, M1035; stu2Δ855–888, M1037; stu2L869E I873E M876E, M2285; and stu2T866E, M2286) were treated with auxin 30 min prior to harvesting. Bik1 complexes were purified from lysates by anti-Flag immunoprecipitation (IP) and analyzed by immunoblotting. The loss of Stu2:Bik1 interaction in stu2T866E mutant cells implies that phosphorylation of Stu2T866 may alter interaction with Bik1 and potentially other Stu2 interactors that bind to Stu2’s C-terminus. (H) AlphaFold 3 prediction of full-length Bik1 dimer bound to Stu2(855–888). Zoom in shows hydrophobic residues on Stu2 interacting with hydrophobic Bik1 surface. (I) Structure prediction as in F but colored to show plDDT confidence score. (J)fpr1Δ TOR1-1 cells (M1375) and stu2-AID fpr1Δ TOR1-1 cells expressing STU2-FRB alleles at an ectopic locus with and without NUF2-FKBP12 or BIK1-FKBP12 (STU2WT, M1513; stu2Δ855–888, M1587; STU2WTNUF2-FKBP12, M1505; stu2Δ855–888NUF2-FKBP12, M6473; STU2WTBIK1-FKBP12, M4516; and stu2Δ855–888BIK1-FKBP12, M6474) were serially diluted (fivefold) and spotted on plates containing the indicated drugs. Tethering Stu2Δ855–888-FRB to Nuf2-FKBP has been previously shown to restore cell viability; however, tethering Stu2Δ855–888-FRB to other cellular interactors of the Stu2 CTS does no rescue growth defects (Zahm et al., 2021; Abouelghar et al., 2022, Preprint). These and prior results suggest that the Ndc80c:Stu2 interaction is the most important CTS interaction for cell viability, and we thus primarily considered T866 phosphorylation in the context of Stu2:Ndc80c binding. Source data are available for this figure: SourceData FS2.
To assess the effect of T866 mutations on Ndc80c binding in yeast, we continued to use stu2T866E to mimic constitutively phosphorylated T866 and also generated a stu2T866V allele to prevent T866 phosphorylation. A valine mutation preserves an interaction between the gamma carbon of Stu2 T866 and Spc24 F14 seen in the crystal structure (Fig. S2 B); a smaller residue would leave an unfavorable hole, consistent with the phenotype of a stu2T866A mutant (Fig. S2, B–F). We purified kinetochores from asynchronously growing stu2-AID yeast harboring STU2WT-V5, stu2T866E-V5, and stu2T866V-V5 by immunoprecipitation of the kinetochore component Dsn1 (Akiyoshi et al., 2010). Consistent with the fluorescence polarization results, we observed less kinetochore-associated Stu2T866E than Stu2WT (Fig. 2 E). We also examined the colocalization of Stu2-GFP with kinetochores in metaphase-arrested cells. Metaphase cells have bilobed clusters of Stu2-GFP, closely corresponding to kinetochore-proximal localization (Fig. 1 A). These clusters have diminished intensity in stu2 mutants that cannot bind Ndc80c (Zahm et al., 2021). Metaphase-arrested cells expressing stu2T866E-GFP had lower levels of kinetochore-proximal Stu2 than STU2WT-GFP, and stu2T866V-GFP cells had higher levels (Fig. 2 F). These results are consistent with the conclusion that Stu2T866 phosphorylation reduces Stu2 association with Ndc80c.
We note that Stu2 localizes to various subcellular locations through its CTS and other domains, including the basic linker (Geyer et al., 2018; Gunzelmann et al., 2018; Stangier et al., 2018; Zheng et al., 2025). While other protein–protein interactions mediated by the Stu2 CTS may also be modulated by T866 phosphorylation (Fig. S2, G–I), Ndc80c is the key interactor essential for cell viability (Fig. S2 J) (Zahm et al., 2021; Abouelghar et al., 2022, Preprint). Therefore, we primarily considered regulation of Stu2T866 phosphorylation in the context of changes in Stu2:Ndc80c binding.
Cdc5 phosphorylates Stu2T866
Which kinase phosphorylates Stu2T866? Standard bioinformatics tools (Wang et al., 2020) produced no strongly matched kinase consensus motif, but the apparent timing of this modification implied that we should search for a mitotic kinase. We therefore devised a fluorescence microscopy assay to assess Stu2:Ndc80c colocalization after local activation of a panel of mitotic kinases at the kinetochore. In STU2-GFP cells, we made fusions of the mitotic kinases to the TOR subunit FRB and also expressed NUF2-FKBP so that we could use rapamycin to recruit each kinase to Ndc80c (Fig. 3 A) (Haruki et al., 2008). The C-terminus of Nuf2 is very close to the endogenous Stu2-binding site on Ndc80c, so recruiting the correct kinase to Nuf2 should result in phosphorylation of Stu2 and reduction of Stu2-GFP kinetochore-proximal signal, as we observed in the phosphomimetic stu2T866E cells (Fig. 2 F). To remove any confounding effect of cell cycle regulation of these kinases, we performed these assays in cells arrested in G1 or metaphase. Recruitment of Bub1-FRB, Mps1-FRB, and Ipl1-FRB to kinetochores resulted in no changes in Stu2-GFP levels (Fig. S3, A and B). However, recruitment of Cdc5-FRB to kinetochores resulted in a significantly lower Stu2-GFP signal that matched the magnitude of signal reduction we observed in stu2T866E cells (Fig. 3 B compare Fig. 2 F). Cdc5-FRB recruitment to kinetochores decreased the Stu2-GFP signal in both G1 and mitotically arrested cells (Fig. 3 B and Fig. S3 C) and depended on the presence of Nuf2-FKBP and dosage of rapamycin (Fig. S3, D and E). Importantly, cells harboring stu2T866V-GFP showed no reduction of kinetochore Stu2-GFP signal upon tethering of Cdc5-FRB to kinetochores, consistent with T866 as the critical Cdc5 target (Fig. 3 B; and Fig. S3, C and D). Additional evidence for the role of Cdc5 came from knockdown experiments using the cdc5-1 temperature-sensitive allele. Mitotically arrested cells were shifted to a nonpermissive 37°C for 1 h. cdc5-1 cells exhibited a higher Stu2-GFP signal at the kinetochore than did CDC5 control cells, indicating that Stu2 removal from the kinetochore depends on Cdc5 activity (Fig. 3 C). Moreover, the increase in Stu2-GFP signal observed in cdc5-1 cells was abolished in stu2T866Ecdc5-1 cells, further supporting Stu2T866 as a Cdc5 target site (Fig. S3 F). While these cell-based assays strongly suggest direct Cdc5 phosphorylation of Stu2, we sought to confirm this activity biochemically. We performed in vitro–binding assays and in vitro kinase assays, demonstrating that Cdc5 interacts with Stu2 (Fig. 3 D) and can phosphorylate the Stu2 CTS (Fig. S3 G). Additionally, mass spectrometry analysis of Stu2 purified from cells, with and without Cdc5-FRB recruitment to kinetochores, revealed phospho-T866 only in the presence of recruited Cdc5-FRB (Fig. 3 E). This finding supports the idea that Cdc5 directly modifies this site. Finally, ectopic Cdc5 recruitment to kinetochores resulted in a severe growth defect that could be rescued by expression of stu2T866V (Fig. 3 F and Fig. S3 H). These results all support our conclusion that Cdc5 phosphorylates Stu2 at T866.

Cdc5 phosphorylates Stu2T866. (A) Schematic illustrating activation of kinases at the kinetochore by chemical-genetic tethering. Ndc80 and Spc24 are shown in light grey, and Nuf2 and Spc25 are shown in dark grey. In the presence of rapamycin, the kinase-FRB fusion is induced to bind Nuf2-FKBP12, localizing the kinase to the kinetochore. If the kinase is able to phosphorylate Stu2T866, we postulated that Stu2 will unbind Ndc80c and delocalize from the kinetochore. (B) Exponentially growing stu2-AID cells harboring TOR1-1 fpr1Δ NUF2-FKBP12 CDC5-FRB and an ectopic STU2-GFP variant (STU2WT-GFP, M4968; stu2T866V-GFP, M4969) were arrested in α-factor for 3 h. Cells received either 500 µM auxin + 200 ng/ml rapamycin or 500 µM auxin + DMSO for 30 min prior to being fixed and imaged. Stu2-GFP puncta intensity was quantified using ImageJ. Bars are an average of n = 114–166 individual measurements. Error bars are SEM. P values from an unpaired t test. (C) Exponentially growing cells harboring endogenous STU2-GFP and pMET-CDC20, with or without the cdc5-1 temperature-sensitive allele (CDC5WT, M2827; cdc5-1, M3138), were cultured in methionine-containing media to arrest cells in metaphase for 2 h. Cells were then transferred to 37°C to inhibit cdc5-1 for 1 h. Cells were fixed and imaged to determine kinetochore-proximal Stu2-GFP. Bars are an average of n = 106–116 individual measurements. Error bars are SEM. P values from two-tailed unpaired t tests. (D) Cdc5:Stu2-binding assay. Anti-FLAG magnetic beads were incubated with control (untagged, M3) or Cdc5-FLAG (M4032) lysate and subjected to anti-FLAG IP. Purified Stu2-V5 protein was incubated with beads for 30 min, washed, and eluted with SDS-PAGE sample buffer. Samples were analyzed by SDS-PAGE and immunoblotting. (E) Phosphorylated serine and threonine residues identified by mass spectrometry from Stu2-V5 IP. Exponentially growing cells harboring TOR1-1 fpr1Δ NUF2-FKBP12 CDC5-FRB stu2-AID and STU2WT-V5 (M5003) were treated with either 500 μM auxin + DMSO or 500 μM auxin + 0.05 μg/ml rapamycin 30 min prior to harvesting, lysed to produce protein sample, subjected to α-V5 IP, and analyzed by mass spectrometry. Table shows which phospho-residues were identified in each sample, as well as the putative kinase and reference for each phosphorylation event. (F) Cells harboring TOR1-1 & fpr1Δ (M1375) and TOR1-1 fpr1Δ NUF2-FKBP12 CDC5-FRB stu2-AID cells with either STU2WT-GFP (M4968) or stu2T866V-GFP (M4969) were serially diluted and spotted on plates containing DMSO, 500 μM auxin, 0.05 μg/ml rapamycin, or 500 μM auxin + 0.05 μg/ml rapamycin. Note some panels appear in Fig. S3 H. IP, immunoprecipitation. Source data are available for this figure: SourceData F3.
Cdc5 phosphorylates Stu2T866. (A) Schematic illustrating activation of kinases at the kinetochore by chemical-genetic tethering. Ndc80 and Spc24 are shown in light grey, and Nuf2 and Spc25 are shown in dark grey. In the presence of rapamycin, the kinase-FRB fusion is induced to bind Nuf2-FKBP12, localizing the kinase to the kinetochore. If the kinase is able to phosphorylate Stu2T866, we postulated that Stu2 will unbind Ndc80c and delocalize from the kinetochore. (B) Exponentially growing stu2-AID cells harboring TOR1-1 fpr1Δ NUF2-FKBP12 CDC5-FRB and an ectopic STU2-GFP variant (STU2WT-GFP, M4968; stu2T866V-GFP, M4969) were arrested in α-factor for 3 h. Cells received either 500 µM auxin + 200 ng/ml rapamycin or 500 µM auxin + DMSO for 30 min prior to being fixed and imaged. Stu2-GFP puncta intensity was quantified using ImageJ. Bars are an average of n = 114–166 individual measurements. Error bars are SEM. P values from an unpaired t test. (C) Exponentially growing cells harboring endogenous STU2-GFP and pMET-CDC20, with or without the cdc5-1 temperature-sensitive allele (CDC5WT, M2827; cdc5-1, M3138), were cultured in methionine-containing media to arrest cells in metaphase for 2 h. Cells were then transferred to 37°C to inhibit cdc5-1 for 1 h. Cells were fixed and imaged to determine kinetochore-proximal Stu2-GFP. Bars are an average of n = 106–116 individual measurements. Error bars are SEM. P values from two-tailed unpaired t tests. (D) Cdc5:Stu2-binding assay. Anti-FLAG magnetic beads were incubated with control (untagged, M3) or Cdc5-FLAG (M4032) lysate and subjected to anti-FLAG IP. Purified Stu2-V5 protein was incubated with beads for 30 min, washed, and eluted with SDS-PAGE sample buffer. Samples were analyzed by SDS-PAGE and immunoblotting. (E) Phosphorylated serine and threonine residues identified by mass spectrometry from Stu2-V5 IP. Exponentially growing cells harboring TOR1-1 fpr1Δ NUF2-FKBP12 CDC5-FRB stu2-AID and STU2WT-V5 (M5003) were treated with either 500 μM auxin + DMSO or 500 μM auxin + 0.05 μg/ml rapamycin 30 min prior to harvesting, lysed to produce protein sample, subjected to α-V5 IP, and analyzed by mass spectrometry. Table shows which phospho-residues were identified in each sample, as well as the putative kinase and reference for each phosphorylation event. (F) Cells harboring TOR1-1 & fpr1Δ (M1375) and TOR1-1 fpr1Δ NUF2-FKBP12 CDC5-FRB stu2-AID cells with either STU2WT-GFP (M4968) or stu2T866V-GFP (M4969) were serially diluted and spotted on plates containing DMSO, 500 μM auxin, 0.05 μg/ml rapamycin, or 500 μM auxin + 0.05 μg/ml rapamycin. Note some panels appear in Fig. S3 H. IP, immunoprecipitation. Source data are available for this figure: SourceData F3.

Effects of tethering mitotic kinases on Stu2 kinetochore association. (A) Exponentially growing stu2-AID cells harboring TOR1-1 fpr1Δ NUF2-FKBP12, ectopic STU2-GFP, and a kinase-FRB allele (BUB1-FRB, M4970; IPL1-FRB, M4972; and MPS1-FRB, M4792) were arrested in α-factor for 3 h. Cells received either 500 µM auxin + 200 ng/ml rapamycin or 500 µM auxin + DMSO for 30 min prior to being fixed and imaged. Bar represents the mean of n = 94–123 individual measurements. Error bars are SEM. P values from two-tailed unpaired t tests. (B) Strains as in A were arrested in nocodazole for 2.5 h. Cells received either 500 µM auxin + 200 ng/ml rapamycin or 500 µM auxin + DMSO for 30 min prior to being fixed and imaged. Bar represents the average of n = 99–113 individual measurements. Error bars are SEM. P values from two-tailed unpaired t tests. (C) Exponentially growing stu2-AID cells harboring TOR1-1 fpr1Δ NUF2-FKBP12 CDC5-FRB and an ectopic STU2-GFP variant (STU2WT-GFP, M4968; stu2T866V-GFP, M4969) were arrested in nocodazole for 2.5 h. Cells received either 500 µM auxin + 200 ng/ml rapamycin or 500 µM auxin + DMSO for 30 min prior to being fixed and imaged. Bar represents the mean of n = 108–131 individual measurements. Error bars are SEM. P values from two-tailed unpaired t tests. (D) Exponentially growing stu2-AID cells harboring TOR1-1 fpr1Δ CDC5-FRB were arrested in α-factor for 3 h. Cells also contained Stu2WT-GFP with NUF2WT (M5094) or NUF2-FKBP12 (M4968) or ectopic stu2T866V-GFP with NUF2WT (M5095) or NUF2-FKBP12 (M4969) and received either 500 µM auxin + 200 ng/ml rapamycin or 500 µM auxin + DMSO for 30 min prior to being fixed and imaged. Bar represents the mean of n = 104–132 individual measurements. Error bars are SEM. P values from two-tailed unpaired t tests. (E) Exponentially growing stu2-AID cells harboring TOR1-1 fpr1Δ NUF2-FKBP12 CDC5-FRB and ectopic STU2WT-GFP (M4968) were arrested in α-factor for 3 h. Cells received 500 µM auxin + varying dose of rapamycin (800, 200, 50, 12.5, 3.12, 0.78, and 0 ng/ml) 30 min prior to being fixed and imaged. Points represent the mean of n = 120–208 individual measurements. Error bars are SEM. (F) Exponentially growing cells harboring endogenous stu2-AID cdc20-AID cdc5-1 and STU2-GFP alleles (STU2WT, M3650; stu2T866E, M3651) were cultured in auxin-containing media to arrest cells in metaphase for 2 h. Cells were then transferred to 37°C to inhibit cdc5-1 for 1 h. Cells were fixed and imaged to determine kinetochore-proximal Stu2-GFP. Bars are average of n = 98–100 individual measurements. Error bars are SEM. P values from two-tailed unpaired t tests. (G) In vitro Cdc5 kinase assay. Yeast cells harboring CDC5-FLAG (M4032) were subjected to α-FLAG IP, then the Cdc5-FLAG beads were incubated with purified recombinant Stu2-GFP or Stu2 Δ761–888-GFP along with [γ-32P] ATP and histone H1. Samples were incubated for 1 h and then analyzed by SDS-PAGE and autoradiography. Stu2-GFP–loading western blot control is shown. (H) Cells harboring TOR1-1 and fpr1Δ (M1375), with NUF2-FKBP12 MPS1-FRB stu2-AID and STU2WT-GFP (M4792) or stu2T866V-GFP (M4793), or with NUF2-FKBP12 CDC5-FRB stu2-AID and STU2WT-GFP (M4968) or stu2T866V-GFP (M4969) were serially diluted and spotted on plates containing DMSO, auxin, rapamycin, and auxin + rapamycin. Tethering Mps1 to kinetochores has been previously shown to result in spindle assembly checkpoint-dependent cell death (Aravamudhan et al., 2015). Note some panels appear in Fig. 3 D. IP, immunoprecipitation. Source data are available for this figure: SourceData FS3.
Effects of tethering mitotic kinases on Stu2 kinetochore association. (A) Exponentially growing stu2-AID cells harboring TOR1-1 fpr1Δ NUF2-FKBP12, ectopic STU2-GFP, and a kinase-FRB allele (BUB1-FRB, M4970; IPL1-FRB, M4972; and MPS1-FRB, M4792) were arrested in α-factor for 3 h. Cells received either 500 µM auxin + 200 ng/ml rapamycin or 500 µM auxin + DMSO for 30 min prior to being fixed and imaged. Bar represents the mean of n = 94–123 individual measurements. Error bars are SEM. P values from two-tailed unpaired t tests. (B) Strains as in A were arrested in nocodazole for 2.5 h. Cells received either 500 µM auxin + 200 ng/ml rapamycin or 500 µM auxin + DMSO for 30 min prior to being fixed and imaged. Bar represents the average of n = 99–113 individual measurements. Error bars are SEM. P values from two-tailed unpaired t tests. (C) Exponentially growing stu2-AID cells harboring TOR1-1 fpr1Δ NUF2-FKBP12 CDC5-FRB and an ectopic STU2-GFP variant (STU2WT-GFP, M4968; stu2T866V-GFP, M4969) were arrested in nocodazole for 2.5 h. Cells received either 500 µM auxin + 200 ng/ml rapamycin or 500 µM auxin + DMSO for 30 min prior to being fixed and imaged. Bar represents the mean of n = 108–131 individual measurements. Error bars are SEM. P values from two-tailed unpaired t tests. (D) Exponentially growing stu2-AID cells harboring TOR1-1 fpr1Δ CDC5-FRB were arrested in α-factor for 3 h. Cells also contained Stu2WT-GFP with NUF2WT (M5094) or NUF2-FKBP12 (M4968) or ectopic stu2T866V-GFP with NUF2WT (M5095) or NUF2-FKBP12 (M4969) and received either 500 µM auxin + 200 ng/ml rapamycin or 500 µM auxin + DMSO for 30 min prior to being fixed and imaged. Bar represents the mean of n = 104–132 individual measurements. Error bars are SEM. P values from two-tailed unpaired t tests. (E) Exponentially growing stu2-AID cells harboring TOR1-1 fpr1Δ NUF2-FKBP12 CDC5-FRB and ectopic STU2WT-GFP (M4968) were arrested in α-factor for 3 h. Cells received 500 µM auxin + varying dose of rapamycin (800, 200, 50, 12.5, 3.12, 0.78, and 0 ng/ml) 30 min prior to being fixed and imaged. Points represent the mean of n = 120–208 individual measurements. Error bars are SEM. (F) Exponentially growing cells harboring endogenous stu2-AID cdc20-AID cdc5-1 and STU2-GFP alleles (STU2WT, M3650; stu2T866E, M3651) were cultured in auxin-containing media to arrest cells in metaphase for 2 h. Cells were then transferred to 37°C to inhibit cdc5-1 for 1 h. Cells were fixed and imaged to determine kinetochore-proximal Stu2-GFP. Bars are average of n = 98–100 individual measurements. Error bars are SEM. P values from two-tailed unpaired t tests. (G) In vitro Cdc5 kinase assay. Yeast cells harboring CDC5-FLAG (M4032) were subjected to α-FLAG IP, then the Cdc5-FLAG beads were incubated with purified recombinant Stu2-GFP or Stu2 Δ761–888-GFP along with [γ-32P] ATP and histone H1. Samples were incubated for 1 h and then analyzed by SDS-PAGE and autoradiography. Stu2-GFP–loading western blot control is shown. (H) Cells harboring TOR1-1 and fpr1Δ (M1375), with NUF2-FKBP12 MPS1-FRB stu2-AID and STU2WT-GFP (M4792) or stu2T866V-GFP (M4793), or with NUF2-FKBP12 CDC5-FRB stu2-AID and STU2WT-GFP (M4968) or stu2T866V-GFP (M4969) were serially diluted and spotted on plates containing DMSO, auxin, rapamycin, and auxin + rapamycin. Tethering Mps1 to kinetochores has been previously shown to result in spindle assembly checkpoint-dependent cell death (Aravamudhan et al., 2015). Note some panels appear in Fig. 3 D. IP, immunoprecipitation. Source data are available for this figure: SourceData FS3.
Stu2 basic linker interacts with Cdc5 polo-box domain
Cells have diverse mechanisms to ensure proper targeting of many Cdc5 substrates. One such mechanism is “priming” phosphorylation, in which a substrate must first be phosphorylated at a distal site before Cdc5 can act upon it (Elia et al., 2003; Örd et al., 2020; Singh et al., 2021). For such substrates, the priming site of the substrate frequently consists of a Cdk/Cdc28 phosphorylation site that, when phosphorylated, interacts with the polo-box domains of Cdc5 with high affinity (Fig. S4 A). Recent work suggests that in addition to binding to phosphorylated serines/threonines, the polo-box domains harbor an additional binding interface on the face distal to the phosphopeptide-binding surface, which interacts with hydrophobic residues in a substrate (Sharma et al., 2019; Almawi et al., 2020). It is not known whether substrates interact with both the phosphopeptide-binding surface and hydrophobic surface at the same time. Stu2 harbors a consensus Cdc28 phosphorylation site in its basic-linker region, comprising residues 602–606 (Fig. S4 A). Both we and others have detected phosphorylation of the consensus Cdc28 site (serine 603) by mass spectrometry (Fig. 1 B; see also Ubersax et al., 2003; Aoki et al., 2006; Humphrey et al., 2018). Does Stu2’s basic-linker region mediate an interaction with the Cdc5 polo-box domains? We used AlphaFold 3 to generate a predicted structure of the interaction of the Stu2 basic-linker region (Stu2560–657(pS603)) with the Cdc5 polo-box domains. While AlphaFold models can be unreliable with point mutants, the predicted structure shows two putative Stu2:Cdc5-interacting regions with high confidence (Fig. 4, A and B). One region, Stu2592–607, binds to the phosphopeptide-binding domain through pS603 and shows strong similarity with Spc72, another phosphorylated Cdc5 substrate previously determined by X-ray crystallography (Fig. S4 B) (Almawi et al., 2020). This prediction suggests that pS603 contacts Cdc5 H641 and K643, which are critical for phosphorylated substrate binding (Fig. 4 B). The second predicted interaction region is between another conserved basic-linker patch (Stu2634–639) and the Cdc5 polo-box domain at the hydrophobic-binding site (Fig. 4 B). This binding mode is similar to another Cdc5 interactor (Dbf4) that binds the hydrophobic site (Fig. S4 B) (Almawi et al., 2020). AlphaFold makes these predictions with high confidence based on predicted local difference distance test and predicted template modeling score (plDDT and pTM) metrics, and a non-phosphorylated Stu2592–609 is not predicted to bind Cdc5 polo-box domains (Fig. S4, C and D). Both the phospho-binding motif and the hydrophobic-binding motif of the Stu2 basic linker are conserved in fungi (Fig. 4 A).

Different regions of Stu2 basic linker associate with Cdc5 polo-box domain. (A) Schematic representation of Cdk/Cdc28 priming substrates to interact with Cdc5. First, an unprimed substrate has low affinity or no interaction with Cdc5. Following Cdc28 phosphorylation (P in circle), substrates can interact with Cdc5 with higher affinity, and Cdc5 adds its catalytic phosphorylation (P in star). (B) Left: Crystal structure of Cdc5 polo-box domain bound to Spc72 (PDB 6MF5) (Almawi et al., 2020). Zoom in shows phosphorylated serine bound by lysine and histidine in Cdc5. Middle: AlphaFold 3 prediction of Stu2 basic linker with pS603 (Stu2560–657,pS603) bound to Cdc5 polo-box domain, as in Fig. 4 B. Left shows pS603 binding to phosphopeptide-binding residues on Cdc5 as in 6MF5. Right shows hydrophobic residues interacting with a hydrophobic patch on Cdc5. Right: Crystal structure of Cdc5 polo-box domain bound to Dbf4 (PDB 6MF6) (Almawi et al., 2020). Zoom in shows Dbf4 interacting with hydrophobic surface on Cdc5. Stu2600–607 shows good agreement with the binding mode of Spc72 (left), and Stu2633–647 interacts similarly to the binding mode of Dbf4 (right). (C) AlphaFold 3 prediction of Stu2 basic linker with pS603 (Stu2560–657,pS603) bound to Cdc5 polo-box domain. Left: pS603 binding to phosphopeptide residues on Cdc5 as in 6MF5. Right: Hydrophobic residues interacting with a hydrophobic patch on Cdc5. Colored by plDDT confidence score. Arrows indicate which surfaces Stu2 binds to Cdc5. (D) Left: AlphaFold 3 prediction of Stu2 basic linker patch with pS603 (Stu2592–607,pS603) bound to Cdc5 polo-box domain. Arrow indicates which surfaces Stu2 binds to Cdc5. Right: AlphaFold 3 prediction of Stu2 basic linker patch without pS603 (Stu2592–607) bound to Cdc5 polo-box domain. Arrow indicates which surfaces Stu2 binds to Cdc5. iPTM and PTM binding scores shown. Structures colored by plDDT confidence score.
Different regions of Stu2 basic linker associate with Cdc5 polo-box domain. (A) Schematic representation of Cdk/Cdc28 priming substrates to interact with Cdc5. First, an unprimed substrate has low affinity or no interaction with Cdc5. Following Cdc28 phosphorylation (P in circle), substrates can interact with Cdc5 with higher affinity, and Cdc5 adds its catalytic phosphorylation (P in star). (B) Left: Crystal structure of Cdc5 polo-box domain bound to Spc72 (PDB 6MF5) (Almawi et al., 2020). Zoom in shows phosphorylated serine bound by lysine and histidine in Cdc5. Middle: AlphaFold 3 prediction of Stu2 basic linker with pS603 (Stu2560–657,pS603) bound to Cdc5 polo-box domain, as in Fig. 4 B. Left shows pS603 binding to phosphopeptide-binding residues on Cdc5 as in 6MF5. Right shows hydrophobic residues interacting with a hydrophobic patch on Cdc5. Right: Crystal structure of Cdc5 polo-box domain bound to Dbf4 (PDB 6MF6) (Almawi et al., 2020). Zoom in shows Dbf4 interacting with hydrophobic surface on Cdc5. Stu2600–607 shows good agreement with the binding mode of Spc72 (left), and Stu2633–647 interacts similarly to the binding mode of Dbf4 (right). (C) AlphaFold 3 prediction of Stu2 basic linker with pS603 (Stu2560–657,pS603) bound to Cdc5 polo-box domain. Left: pS603 binding to phosphopeptide residues on Cdc5 as in 6MF5. Right: Hydrophobic residues interacting with a hydrophobic patch on Cdc5. Colored by plDDT confidence score. Arrows indicate which surfaces Stu2 binds to Cdc5. (D) Left: AlphaFold 3 prediction of Stu2 basic linker patch with pS603 (Stu2592–607,pS603) bound to Cdc5 polo-box domain. Arrow indicates which surfaces Stu2 binds to Cdc5. Right: AlphaFold 3 prediction of Stu2 basic linker patch without pS603 (Stu2592–607) bound to Cdc5 polo-box domain. Arrow indicates which surfaces Stu2 binds to Cdc5. iPTM and PTM binding scores shown. Structures colored by plDDT confidence score.

Stu2 basic linker regions mediate interaction between Stu2 and Cdc5. (A) Schematic of Stu2 domain structure as well as multiple sequence alignment of fungal species showing conservation of two patches of Stu2 basic-linker region. 592–607 is predicted to interact with Cdc5 phosphopeptide-binding surface, while 633–648 is predicted to interact with Cdc5 hydrophobic-binding surface. (B) AlphaFold 3 prediction of Stu2 basic linker with pS603 (Stu2560–657 pS603) bound to Cdc5 polo-box domain. Left: pS603 binding to phosphopeptide-binding residues on Cdc5. Right: hydrophobic residues interacting with a hydrophobic patch on Cdc5. (C) Cdc5:Stu2-binding assay. Anti-FLAG magnetic beads were incubated with control (untagged, M3) or Cdc5-FLAG (M4032) lysate and subjected to anti-FLAG IP. Stu2-V5 protein variants were incubated with beads for 30 min, washed, and eluted with SDS-PAGE sample buffer. Samples were analyzed by SDS-PAGE and immunoblotting. (D) Exponentially growing stu2-AID cdc20-AID cultures with an ectopically expressed STU2-NLSSV40-GFP allele (STU2WT-NLS-GFP, M5145; stu2S603A-NLS-GFP, M5147; stu2Δ600–605-NLS-GFP, M5149; and stu2Δ633–647-NLS-GFP, M5980) that also contained SPC110-mCherry (spindle pole) were cultured in auxin-containing media to arrest cells in metaphase. Cells were fixed and imaged to determine kinetochore-proximal Stu2-GFP. Bars represent the average of n = 104–112 individual measurements. Error bars are SEM. P values from two-tailed unpaired t tests. (E) Exponentially growing stu2-AID cells with ectopically expressed STU2-NLS-GFP and either CDC28WT (M5554) or cdc28-as1 (M5555) were arrested in mitosis by nocodazole treatment, then treated with 500 µM auxin and 2.5 µM 1NA-PP1 for 30 min prior to harvesting. Cells were fixed and imaged to determine kinetochore-proximal Stu2-GFP. Bars represent the average of n = 103–112 individual measurements. Error bars are SEM. P values from two-tailed unpaired t tests. (F) Exponentially growing stu2-AID cells harboring TOR1-1 fpr1Δ NUF2-FKBP12 CDC5-FRB and an ectopic STU2-NLSSV40-GFP variant (STU2WT-NLS-GFP, M5150; stu2Δ600–605-NLS-GFP, M5154; and stu2Δ633–647-NLS-GFP, M5989) were arrested in α-factor for 3 h. Cells received either 500 µM auxin + 200 ng/ml rapamycin or 500 µM auxin + DMSO for 30 min prior to fixation and imaging. Bars represent the average of three biological replicates normalized to STU2WT and n = 205–374 individual measurements. Outliers were removed from data by robust regression and outlier removal (ROUT) analysis in Prism with Q = 1%. Error bars are SEM. P values from an unpaired t test. IP, immunoprecipitation. Source data are available for this figure: SourceData F4.
Stu2 basic linker regions mediate interaction between Stu2 and Cdc5. (A) Schematic of Stu2 domain structure as well as multiple sequence alignment of fungal species showing conservation of two patches of Stu2 basic-linker region. 592–607 is predicted to interact with Cdc5 phosphopeptide-binding surface, while 633–648 is predicted to interact with Cdc5 hydrophobic-binding surface. (B) AlphaFold 3 prediction of Stu2 basic linker with pS603 (Stu2560–657 pS603) bound to Cdc5 polo-box domain. Left: pS603 binding to phosphopeptide-binding residues on Cdc5. Right: hydrophobic residues interacting with a hydrophobic patch on Cdc5. (C) Cdc5:Stu2-binding assay. Anti-FLAG magnetic beads were incubated with control (untagged, M3) or Cdc5-FLAG (M4032) lysate and subjected to anti-FLAG IP. Stu2-V5 protein variants were incubated with beads for 30 min, washed, and eluted with SDS-PAGE sample buffer. Samples were analyzed by SDS-PAGE and immunoblotting. (D) Exponentially growing stu2-AID cdc20-AID cultures with an ectopically expressed STU2-NLSSV40-GFP allele (STU2WT-NLS-GFP, M5145; stu2S603A-NLS-GFP, M5147; stu2Δ600–605-NLS-GFP, M5149; and stu2Δ633–647-NLS-GFP, M5980) that also contained SPC110-mCherry (spindle pole) were cultured in auxin-containing media to arrest cells in metaphase. Cells were fixed and imaged to determine kinetochore-proximal Stu2-GFP. Bars represent the average of n = 104–112 individual measurements. Error bars are SEM. P values from two-tailed unpaired t tests. (E) Exponentially growing stu2-AID cells with ectopically expressed STU2-NLS-GFP and either CDC28WT (M5554) or cdc28-as1 (M5555) were arrested in mitosis by nocodazole treatment, then treated with 500 µM auxin and 2.5 µM 1NA-PP1 for 30 min prior to harvesting. Cells were fixed and imaged to determine kinetochore-proximal Stu2-GFP. Bars represent the average of n = 103–112 individual measurements. Error bars are SEM. P values from two-tailed unpaired t tests. (F) Exponentially growing stu2-AID cells harboring TOR1-1 fpr1Δ NUF2-FKBP12 CDC5-FRB and an ectopic STU2-NLSSV40-GFP variant (STU2WT-NLS-GFP, M5150; stu2Δ600–605-NLS-GFP, M5154; and stu2Δ633–647-NLS-GFP, M5989) were arrested in α-factor for 3 h. Cells received either 500 µM auxin + 200 ng/ml rapamycin or 500 µM auxin + DMSO for 30 min prior to fixation and imaging. Bars represent the average of three biological replicates normalized to STU2WT and n = 205–374 individual measurements. Outliers were removed from data by robust regression and outlier removal (ROUT) analysis in Prism with Q = 1%. Error bars are SEM. P values from an unpaired t test. IP, immunoprecipitation. Source data are available for this figure: SourceData F4.
If Stu2T866 is phosphorylated by Cdc5 to regulate its interaction with Ndc80c, several predictions emerge. First, mutating either of the putative polo-box–binding motifs in Stu2’s basic linker would prevent interaction with Cdc5’s polo-box domain. As a result, Stu2 would not be phosphorylated at T866, leading to higher kinetochore localization, similar to Stu2T866V. Second, removal of Stu2 from kinetochores would require Cdk-dependent priming. To test the first prediction, we made mutants to both conserved regions of Stu2’s basic linker (Fig. 4 A). We then performed in vitro–binding assays using Stu2 and Cdc5 purified from yeast. WT Stu2 binds to Cdc5 in vitro, whereas Stu2 constructs lacking residues 602–607 or 633–648 show dramatically reduced Cdc5 association (Fig. 4 C). To test these mutations in cells, we introduced them into an STU2-NLS–containing construct, allowing us to assess their effects independently of any confounding impacts on nuclear localization (Abouelghar et al., 2022, Preprint). Consistent with the hypothesis above, Stu2S603A-NLS-GFP, Stu2Δ600–605-NLS-GFP, and Stu2Δ633–647-NLS-GFP all showed more Stu2 at kinetochores than did Stu2WT-NLS-GFP in mitotically arrested cells (Fig. 4 D). To test the second prediction, we inhibited Cdc28 activity using cdc28-as1 and the addition of 1NA-PP1 (Ubersax et al., 2003). This experiment also showed higher levels of Stu2-NLS-GFP at kinetochores in cdc28-as1 cells than in cells expressing CDC28WT (Fig. 4 E), consistent with Cdc28-dependent priming of Stu2:Cdc5 association.
We also tested whether mutations in the conserved, putative polo-box–binding motifs in Stu2 would disrupt its displacement from kinetochores by tethered Cdc5, using cells expressing Stu2WT-NLS-GFP, Stu2Δ600–605-NLS-GFP, and Stu2 Δ633–647-NLS-GFP. Consistent with results in experiments described above, Stu2WT-NLS-GFP levels decreased at kinetochores when Cdc5-FRB was tethered to Nuf2-FKBP (Fig. 4 F). Mutation of the basic patch, either to stu2Δ600–605 or stu2Δ633–647, rendered Stu2 “resistant” to kinetochore-associated Cdc5 activity. These data strongly suggest that the basic patch residues Stu2600–607 and Stu2633–647 mediate the interaction between Stu2 and the Cdc5 polo-box domains in cells, and furthermore, that Stu2T886 is a direct target of Cdc5.
Stu2 nuclear localization is regulated by Cdc28 phosphorylation of the conserved basic linker patch
The finding that Stu2600–607 is a polo-box binding motif for Cdc5 was somewhat surprising, as we had previously characterized this same region of Stu2 as its NLS (Abouelghar et al., 2022, Preprint). Furthermore, our data suggest that S603 within this region is phosphorylated, likely by Cdc28, to facilitate Cdc5 binding. This observation prompted us to investigate whether S603 phosphorylation could also regulate Stu2 nuclear import in addition to priming an interaction with Cdc5 (Usui et al., 2003; Ma et al., 2007; Abouelghar et al., 2022, Preprint). As before, to show that this conserved basic patch region of Stu2 is sufficient to ensure nuclear localization, we fused these residues to a GFP-GST construct and monitored nuclear localization. In the absence of Stu2592–607, GFP-GST is diffuse throughout the cell; however, a construct containing Stu2592–607-GFP-GST accumulates in the nucleus (marked by the nuclear pore protein Nup2; Fig. 5, A and B, see also Abouelghar et al., 2022, Preprint). Furthermore, the nuclear localization activity of Stu2’s basic linker is cell cycle dependent. Cells arrested in G1 contain less nuclear Stu2592–607-GFP-GST than cells arrested in mitosis (Fig. 5 B). The positive control SV40NLS-containing fusion does not exhibit cycle-dependent nuclear import, showing similarly high levels in both G1 and mitosis. Mutating residues required for importin α interaction (stu2K598A R599A, i.e., “KR/AA”) (Abouelghar et al., 2022, Preprint) also disrupts this regulation, resulting in consistently low nuclear import across both cell cycle stages (Fig. 5 B). Furthermore, an S603A mutation resulted in impaired NLS function of Stu2592–607-GFP-GST, while a phosphomimetic S603E partially rescued nuclear localization (Fig. 5 C). We propose that the rescue was only partial because a charged amino acid in this case is a poor mimic of phosphorylated serine. We also observed lower mitotic nuclear accumulation of full-length Stu2-GFP in stu2S603A cells than in STU2WT cells, showing that the same regulation also occurs in the full protein context (Fig. 5 D).

Phosphorylated Stu2 S603 and Cdc28 activity are required for Stu2 nuclear import. (A) Exponentially growing stu2-AID cdc20-AID NUP2-mKate cells ectopically expressing GFP-GST fused constructs (GFP-GST, M2390; Stu2592–607-GFP-GST, M2392) were treated with 500 µM auxin for 2 h to arrest cells in metaphase. Cells were fixed, and the Nup2-mKate and GFP signals were imaged. Left: Schematic of the constructs used. Right: Representative images of DIC, Nup2-mKate, and GFP signals for each strain with an outlined nucleus. Scale bar is 1 µm. (B) Exponentially growing stu2-AID cells ectopically expressing GFP-GST fused constructs (GFP-GST, M2441; NLSSV40-GFP-GST, M2442; Stu2592–607-GFP-GST, M2443; or Stu2592–607(KR/AA)-GFP-GST, M2439) as well as NUP2-mKate were treated with α-factor for 2.5 h to arrest cells in G1 and then auxin for 30 min to degrade Stu2-AID. And exponentially growing stu2-AID cdc20-AID cells ectopically expressing GFP-GST fused constructs (GFP-GST, M2390; NLSSV40-GFP-GST, M2391; Stu2592–607-GFP-GST, M2392; or Stu2592–607(KR/AA)-GFP-GST, M2437) as well as NUP2-mKate were treated with auxin for 2 h to degrade Stu2-AID and Cdc20-AID to arrest cells in metaphase. Cells were fixed, and Nup2-mKATE and -GFP-GST construct signals were imaged. The ratios of nuclear to cytoplasmic GFP intensities were quantified. Each data point represents this ratio for a single cell. Mean and SD are shown. n = 107–139 cells; P values were determined using two-tailed unpaired t tests. (C) Exponentially growing stu2-AID cdc20-AID cells ectopically expressing a GFP-GST fusion construct (Stu2592–607, M2392; Stu2592–607(S603A), M2438; and Stu2592–607(S603E), M2726) were treated with auxin for 2 h to degrade Stu2-AID and Cdc20-AID to arrest cells in metaphase. Cells were fixed, and Nup2-mKATE and GFP signals were imaged. The ratios of nuclear to cytoplasmic GFP intensities were quantified. Each data point represents this ratio for a single cell. Bars represent median. Error bars are 95% confidence interval. n = 104–124 cells; P values were determined using a two-tailed unpaired. (D) Exponentially growing stu2-AID cells ectopically expressing full-length STU2-GFP alleles (STU2WT-GFP, M2298 or stu2S603A-GFP, M2351) were treated with α-factor for 2.5 h to arrest cells in G1 and then with auxin for 30 min to degrade Stu2-AID, or cells as above but with cdc20-AID (STU2WT-GFP, M2208; or stu2S603A-GFP, M2217) were treated with auxin for 2 h to degrade Stu2-AID and Cdc20-AID to arrest cells in metaphase. Cells were fixed, and Nup2-mKATE and Stu2-GFP signals were imaged. The ratios of nuclear to cytoplasmic GFP intensities were quantified. Each data point represents this ratio for a single cell. The median and the 95% confidence interval are shown. n = 100–165 cells; P values were determined using a two-tailed unpaired t test. (E) Exponentially growing stu2-AID Nup2-mKate cells with ectopic STU2-GFP and CDC28WT (M5762) or cdc28-as1 (M5770) were treated with nocodazole for 2.5 h to arrest in mitosis. Auxin and 1NA-PP1 were added 30 min prior to harvesting; cells were fixed, and Nup2-mKate and GFP signals were imaged. The ratios of nuclear to cytoplasmic GFP intensities were quantified. Each data point represents this ratio for a single cell. Bars represent the mean of n = 100 individual measurements. Error bars are SEM. P values were determined using a two-tailed unpaired t test.
Phosphorylated Stu2 S603 and Cdc28 activity are required for Stu2 nuclear import. (A) Exponentially growing stu2-AID cdc20-AID NUP2-mKate cells ectopically expressing GFP-GST fused constructs (GFP-GST, M2390; Stu2592–607-GFP-GST, M2392) were treated with 500 µM auxin for 2 h to arrest cells in metaphase. Cells were fixed, and the Nup2-mKate and GFP signals were imaged. Left: Schematic of the constructs used. Right: Representative images of DIC, Nup2-mKate, and GFP signals for each strain with an outlined nucleus. Scale bar is 1 µm. (B) Exponentially growing stu2-AID cells ectopically expressing GFP-GST fused constructs (GFP-GST, M2441; NLSSV40-GFP-GST, M2442; Stu2592–607-GFP-GST, M2443; or Stu2592–607(KR/AA)-GFP-GST, M2439) as well as NUP2-mKate were treated with α-factor for 2.5 h to arrest cells in G1 and then auxin for 30 min to degrade Stu2-AID. And exponentially growing stu2-AID cdc20-AID cells ectopically expressing GFP-GST fused constructs (GFP-GST, M2390; NLSSV40-GFP-GST, M2391; Stu2592–607-GFP-GST, M2392; or Stu2592–607(KR/AA)-GFP-GST, M2437) as well as NUP2-mKate were treated with auxin for 2 h to degrade Stu2-AID and Cdc20-AID to arrest cells in metaphase. Cells were fixed, and Nup2-mKATE and -GFP-GST construct signals were imaged. The ratios of nuclear to cytoplasmic GFP intensities were quantified. Each data point represents this ratio for a single cell. Mean and SD are shown. n = 107–139 cells; P values were determined using two-tailed unpaired t tests. (C) Exponentially growing stu2-AID cdc20-AID cells ectopically expressing a GFP-GST fusion construct (Stu2592–607, M2392; Stu2592–607(S603A), M2438; and Stu2592–607(S603E), M2726) were treated with auxin for 2 h to degrade Stu2-AID and Cdc20-AID to arrest cells in metaphase. Cells were fixed, and Nup2-mKATE and GFP signals were imaged. The ratios of nuclear to cytoplasmic GFP intensities were quantified. Each data point represents this ratio for a single cell. Bars represent median. Error bars are 95% confidence interval. n = 104–124 cells; P values were determined using a two-tailed unpaired. (D) Exponentially growing stu2-AID cells ectopically expressing full-length STU2-GFP alleles (STU2WT-GFP, M2298 or stu2S603A-GFP, M2351) were treated with α-factor for 2.5 h to arrest cells in G1 and then with auxin for 30 min to degrade Stu2-AID, or cells as above but with cdc20-AID (STU2WT-GFP, M2208; or stu2S603A-GFP, M2217) were treated with auxin for 2 h to degrade Stu2-AID and Cdc20-AID to arrest cells in metaphase. Cells were fixed, and Nup2-mKATE and Stu2-GFP signals were imaged. The ratios of nuclear to cytoplasmic GFP intensities were quantified. Each data point represents this ratio for a single cell. The median and the 95% confidence interval are shown. n = 100–165 cells; P values were determined using a two-tailed unpaired t test. (E) Exponentially growing stu2-AID Nup2-mKate cells with ectopic STU2-GFP and CDC28WT (M5762) or cdc28-as1 (M5770) were treated with nocodazole for 2.5 h to arrest in mitosis. Auxin and 1NA-PP1 were added 30 min prior to harvesting; cells were fixed, and Nup2-mKate and GFP signals were imaged. The ratios of nuclear to cytoplasmic GFP intensities were quantified. Each data point represents this ratio for a single cell. Bars represent the mean of n = 100 individual measurements. Error bars are SEM. P values were determined using a two-tailed unpaired t test.
Because our mutational analysis suggested that Cdc28 phosphorylation is required to drive Stu2 nuclear localization, we tested the importance of Cdc28 activity directly. We arrested CDC28WT and cdc28-as1 cells in mitosis and added the inhibitor 1NA-PP1 (Ubersax et al., 2003; Mortensen et al., 2005; Rodriguez-Rodriguez et al., 2016). In cdc28-as1 cells, Stu2 nuclear accumulation in mitosis was lower than in CDC28WT cells, indicating that Cdc28 activity is required for proper Stu2 nuclear localization during mitosis (Fig. 5 E). These results are consistent with Cdc28 regulation of Stu2 nuclear localization through phosphorylation of S603. They also indicate that the same region and the same phosphorylated residue facilitate both nuclear import and priming of Stu2:Cdc5 association.
PP2ACdc55 counteracts Cdc5 phosphorylation of Stu2 during metaphase
To examine the precise timing of kinetochore-proximal Stu2 relocalization, we determined the Stu2 signal relative to Ndc80 in cells harboring NDC80-mKate and either STU2WT-GFP or stu2T866V-GFP after release from a G1 arrest, as previously described (Fig. 1 A). To correlate any observed changes with cell cycle stage, we considered the ratio of Stu2:Ndc80 and the distance between the associated bilobed Ndc80 foci. In mitosis, Ndc80c distance is a close proxy of spindle length, with “short” distances (<1.5 µm) indicating pre-anaphase cells and “long” distances (>1.5 µm) indicating anaphase cells (Joglekar et al., 2009; Marco et al., 2013). We found no difference in Stu2:Ndc80c colocalization levels between STU2WT-GFP and stu2T866V-GFP cells before anaphase onset, either when Ndc80c appeared as a single, non-bilobed focus or with short (pre-anaphase) Ndc80c distance (Fig. 6 A and Fig. S5 A). In cells with longer (anaphase-like) Ndc80c distance, STU2WT-GFP cells had sharply lower Stu2:Ndc80c colocalization than stu2T866V-GFP cells (Fig. 6 A). This difference was consistent across cells at every “anaphase-like” Ndc80c distance, suggesting that phosphorylation of Stu2 T866 occurs rapidly at anaphase onset (Fig. 6 B and Fig. S5 B).

Stu2 T866 phosphorylation is opposed by PP2A Cdc55 until anaphase onset. (A) Exponentially growing stu2-AID NDC80-mKate cells expressing STU2-GFP (M3774) or stu2T866V-GFP (M4429) were released from a G1 arrest into auxin-containing media. Samples were taken every 15 min, fixed, and imaged. Left: Representative images of mitotic cells with pre-anaphase–like Ndc80 distance (short, <1.5 µm) and anaphase-like Ndc80 distance (long, >1.5 µm). Scale bars are 1 µm. The dotted line indicates how Ndc80 distance was measured. Right: Kinetochore-proximal Stu2-GFP signal and Ndc80-mKate signal were measured for individual puncta. Ratio of Stu2/Ndc80c signal plotted for cells with short (<1.5 µm) or long (>1.5 µm) Ndc80 distance. Measurements are an average from two replicate time-course experiments. Bars represent the mean of n = 212–492 individual measurements. Error bars are SEM. P values from unpaired t tests. Note long Ndc80 distance panels also appear in Fig. 1 A. (B) Cells grown and imaged as in A. Ratio of Stu2/Ndc80c signal was plotted for cells binned together by Ndc80 distance (0 µm: 0 µm ≤ × ≤ 1.5 µm; 1.5 µm: 1.5 µm < × ≤ 3 µm, etc.). Data points are means of many individual measurements (STU2WT: 0 µm n = 337, 1.5 µm n = 345, 3.0 µm n = 42, 4.5 µm n = 111, 6.0 µm n = 108, 7.5 µm n = 104, 9.0 µm n = 110. stu2T866V: 0 µm n = 274, 1.5 µm n = 182, 3.0 µm n = 63, 4.5 µm n = 48, 6.0 µm n = 58, 7.5 µm n = 50, 9.0 µm n = 38). Error bars are SEM. (C) Exponentially growing stu2-AID cdc20-AID cells with an ectopically expressed STU2-GFP allele (M5335) and stu2-AID cdc20-AID cdc55Δ cells with ectopic STU2WT-GFP (M5337) or stu2T866V-GFP (M5611) were cultured in auxin-containing media to arrest cells in metaphase. Cells were fixed and imaged to determine kinetochore-proximal Stu2-GFP. Bars represent the average of n = 98–104 individual measurements. Error bars are SEM. P values from two-tailed unpaired t tests. (D) Model of PP2ACdc55 opposing Cdc5 activity against Stu2T866. Left: In metaphase, PP2ACdc55 is highly active and removes phosphorylation from Stu2T866; this cycling results in a steady-state low level of pT866. Right: In anaphase, separase inhibits PP2ACdc55, allowing Cdc5 to win and resulting in rapid net phosphorylation of Stu2T866.
Stu2 T866 phosphorylation is opposed by PP2A Cdc55 until anaphase onset. (A) Exponentially growing stu2-AID NDC80-mKate cells expressing STU2-GFP (M3774) or stu2T866V-GFP (M4429) were released from a G1 arrest into auxin-containing media. Samples were taken every 15 min, fixed, and imaged. Left: Representative images of mitotic cells with pre-anaphase–like Ndc80 distance (short, <1.5 µm) and anaphase-like Ndc80 distance (long, >1.5 µm). Scale bars are 1 µm. The dotted line indicates how Ndc80 distance was measured. Right: Kinetochore-proximal Stu2-GFP signal and Ndc80-mKate signal were measured for individual puncta. Ratio of Stu2/Ndc80c signal plotted for cells with short (<1.5 µm) or long (>1.5 µm) Ndc80 distance. Measurements are an average from two replicate time-course experiments. Bars represent the mean of n = 212–492 individual measurements. Error bars are SEM. P values from unpaired t tests. Note long Ndc80 distance panels also appear in Fig. 1 A. (B) Cells grown and imaged as in A. Ratio of Stu2/Ndc80c signal was plotted for cells binned together by Ndc80 distance (0 µm: 0 µm ≤ × ≤ 1.5 µm; 1.5 µm: 1.5 µm < × ≤ 3 µm, etc.). Data points are means of many individual measurements (STU2WT: 0 µm n = 337, 1.5 µm n = 345, 3.0 µm n = 42, 4.5 µm n = 111, 6.0 µm n = 108, 7.5 µm n = 104, 9.0 µm n = 110. stu2T866V: 0 µm n = 274, 1.5 µm n = 182, 3.0 µm n = 63, 4.5 µm n = 48, 6.0 µm n = 58, 7.5 µm n = 50, 9.0 µm n = 38). Error bars are SEM. (C) Exponentially growing stu2-AID cdc20-AID cells with an ectopically expressed STU2-GFP allele (M5335) and stu2-AID cdc20-AID cdc55Δ cells with ectopic STU2WT-GFP (M5337) or stu2T866V-GFP (M5611) were cultured in auxin-containing media to arrest cells in metaphase. Cells were fixed and imaged to determine kinetochore-proximal Stu2-GFP. Bars represent the average of n = 98–104 individual measurements. Error bars are SEM. P values from two-tailed unpaired t tests. (D) Model of PP2ACdc55 opposing Cdc5 activity against Stu2T866. Left: In metaphase, PP2ACdc55 is highly active and removes phosphorylation from Stu2T866; this cycling results in a steady-state low level of pT866. Right: In anaphase, separase inhibits PP2ACdc55, allowing Cdc5 to win and resulting in rapid net phosphorylation of Stu2T866.

Cell cycle timing of Stu2 T866 modification and PP2A regulatory subunit activity on Stu2. (A) Exponentially growing stu2-AID NDC80-mKate cells expressing STU2-GFP (M3774) or stu2T866V-GFP (M4429) were released from a G1 arrest into auxin-containing media. Samples were taken every 15 min, fixed, and imaged. Ratio of Stu2/Ndc80c signal plotted for cells without separated/bilobed Ndc80 signal. Bars represent mean of n = 274–337 individual measurements. Error bars are SEM. P values from using a two-tailed unpaired t test. (B) Data as in Fig. 6 A but without binning by Ndc80c distance. Exponentially growing stu2-AID cells expressing STU2-GFP and NDC80-mKate (M3774) or stu2T866V-GFP and NDC80-mKate (M4429) were released from a G1 arrest into auxin-containing media. Samples were taken every 15 min, fixed, and imaged. Ratio of Stu2/Ndc80c signal plotted against the distance between corresponding Ndc80 puncta for cells with bilobed Ndc80 signal. (C) Exponentially growing stu2-AID cells expressing ectopic STU2-GFP (M5505) or with cdc55-AID (M5527) or rts1-AID (M5506) were treated with nocodazole for 2.5 h to arrest in mitosis. Cells treated with auxin 30 min prior to harvesting were fixed and imaged. Kinetochore- proximal Stu2-GFP signal was quantified. Bars represent the mean from n = 100–106 individual measurements. P values are from an unpaired two-tailed t test. (D) Exponentially growing stu2-AID NDC80-mKate cells expressing STU2-GFP (M3774) or stu2T866E-GFP (M6524) were released from a G1 arrest into auxin-containing media. Samples were taken every 15 min, fixed, and imaged to determine interpolar Stu2-GFP signal for STU2-GFPWT and stu2T866E-GFP cells in anaphase. Bar represents the mean of n = 161–171 individual measurements. Error bar is SEM. P values from two-tailed unpaired t test. (E) Cells grown as in D were imaged to determine distance between Ndc80 puncta for STU2WT-GFP and stu2T866E-GFP cells in anaphase. Bar represents the mean of n = 161–171 individual measurements. Error bar is SEM. P values from two-tailed unpaired t test. (F) Cells grown and imaged in Fig. 7 D were analyzed to determine maximum rates of spindle elongation over a 2-min period for each individual cell. Each data point represents a single cell. Bars represent the average of n = 25–26 individual measurements. Error bars are SEM. P values from two-tailed unpaired t test. (G) GO analysis of 319 phosphosites that were shown to be affected by Cdc55 activity in mitosis. See Touati et al. (2019).
Cell cycle timing of Stu2 T866 modification and PP2A regulatory subunit activity on Stu2. (A) Exponentially growing stu2-AID NDC80-mKate cells expressing STU2-GFP (M3774) or stu2T866V-GFP (M4429) were released from a G1 arrest into auxin-containing media. Samples were taken every 15 min, fixed, and imaged. Ratio of Stu2/Ndc80c signal plotted for cells without separated/bilobed Ndc80 signal. Bars represent mean of n = 274–337 individual measurements. Error bars are SEM. P values from using a two-tailed unpaired t test. (B) Data as in Fig. 6 A but without binning by Ndc80c distance. Exponentially growing stu2-AID cells expressing STU2-GFP and NDC80-mKate (M3774) or stu2T866V-GFP and NDC80-mKate (M4429) were released from a G1 arrest into auxin-containing media. Samples were taken every 15 min, fixed, and imaged. Ratio of Stu2/Ndc80c signal plotted against the distance between corresponding Ndc80 puncta for cells with bilobed Ndc80 signal. (C) Exponentially growing stu2-AID cells expressing ectopic STU2-GFP (M5505) or with cdc55-AID (M5527) or rts1-AID (M5506) were treated with nocodazole for 2.5 h to arrest in mitosis. Cells treated with auxin 30 min prior to harvesting were fixed and imaged. Kinetochore- proximal Stu2-GFP signal was quantified. Bars represent the mean from n = 100–106 individual measurements. P values are from an unpaired two-tailed t test. (D) Exponentially growing stu2-AID NDC80-mKate cells expressing STU2-GFP (M3774) or stu2T866E-GFP (M6524) were released from a G1 arrest into auxin-containing media. Samples were taken every 15 min, fixed, and imaged to determine interpolar Stu2-GFP signal for STU2-GFPWT and stu2T866E-GFP cells in anaphase. Bar represents the mean of n = 161–171 individual measurements. Error bar is SEM. P values from two-tailed unpaired t test. (E) Cells grown as in D were imaged to determine distance between Ndc80 puncta for STU2WT-GFP and stu2T866E-GFP cells in anaphase. Bar represents the mean of n = 161–171 individual measurements. Error bar is SEM. P values from two-tailed unpaired t test. (F) Cells grown and imaged in Fig. 7 D were analyzed to determine maximum rates of spindle elongation over a 2-min period for each individual cell. Each data point represents a single cell. Bars represent the average of n = 25–26 individual measurements. Error bars are SEM. P values from two-tailed unpaired t test. (G) GO analysis of 319 phosphosites that were shown to be affected by Cdc55 activity in mitosis. See Touati et al. (2019).
How do cells exert precise temporal control to achieve rapid phosphorylation of Stu2T866 at anaphase onset? Since specific upregulation of Cdc5 activity seemed unlikely, we considered the possibility that a counteracting mechanism to Cdc5 phosphorylation is abruptly inactivated. The activity of a phosphatase that counteracts Cdc5 phosphorylation could provide the “switch-like” response observed if such a phosphatase were inhibited precisely at anaphase onset. One major class of phosphatases active in mitosis are members of the PP2A family (Queralt et al., 2006; Yellman and Burke, 2006; Clift et al., 2009; Yaakov et al., 2012; Moyano-Rodriguez and Queralt, 2019). These heterotrimeric phosphatases have distinct regulatory subunits, such as Cdc55 and Rts1, to specify the substrate to be dephosphorylated. If PP2A counteracted Cdc5 phosphorylation of Stu2T866 in metaphase, we would predict that depletion of the proper PP2A regulatory subunit would result in higher levels of pT866 and lower Stu2 signal at kinetochores. We therefore monitored the Stu2 kinetochore signal in metaphase-arrested cells with both cdc55-AID and rts1-AID. While the effect was smaller than that produced by the phosphomimetic stu2T866E allele, possibly due to inefficiency of these AID alleles (data not shown), depletion of Cdc55-AID but not Rts1-AID led to a decrease in Stu2 kinetochore colocalization (Fig. S5 C). As a more robust test for whether PP2ACdc55 affects Stu2T866 phosphorylation, we constructed yeast strains harboring a deletion of CDC55 and measured Stu2-GFP levels in metaphase. Consistent with the idea that PP2ACdc55 opposes Stu2T866 phosphorylation, cdc55Δ cells showed lower Stu2 levels at kinetochores than did WT cells; the effect depended on Stu2T866 phosphorylation, as cdc55Δ stu2T866V cells showed higher kinetochore-proximal Stu2 levels than did WT cells (Fig. 6 C). These results suggest that PP2ACdc55 counters Cdc5 phosphorylation of Stu2T866 during metaphase.
If this model is correct, how is PP2ACdc55 rapidly downregulated at anaphase onset? Prior genetic and phosphoproteomic studies suggest a plausible mechanism. They indicate that phosphatase PP2ACdc55 counteracts general Cdc5 phosphorylation in metaphase (Touati et al., 2019) and that threonine residues phosphorylated by Cdc5 appear to be more actively targeted. This counter-regulation by PP2ACdc55 ends abruptly at the onset of anaphase, driven by the activation of separase, which inhibits PP2ACdc55 in a proteolysis-independent manner (Queralt et al., 2006; Calabria et al., 2012; Touati et al., 2019). Loss of PP2A activity allows Cdc5 to “win” and results in net phosphorylation of many Cdc5 substrates, including the mitotic exit regulator Net1 and likely also Stu2 (Fig. 6 D). Our results are in good agreement with these prior studies and support the model of PP2ACdc55 inhibition of Cdc5 activity through our extensive mutational analysis of a substrate, Stu2.
Stu2T866 modification is important for proper mitotic spindle function
Finally, we sought to determine the cellular role of Stu2T866 phosphorylation. Stu2 has been previously implicated in anaphase spindle elongation (Severin et al., 2001; Al-Bassam et al., 2006). Because Stu2T866 phosphorylation appears to occur at the metaphase-anaphase transition, its relocation from the kinetochore may be crucial for anaphase spindle function. Disruption of this process could therefore lead to cellular defects. As previously observed (Usui et al., 2003; Ma et al., 2007), we saw Stu2-GFP signal at the spindle midzone (i.e., between the kinetochore-proximal foci), which increases significantly at the onset of anaphase. These observations suggest that Stu2 relocates along interpolar microtubules once it is released from kinetochores (Fig. 6 A, left panels). We investigated whether the increased kinetochore localization of Stu2T866V corresponded with reduced localization to the spindle midzone and indeed found, in cells with elongated spindles, less midzone-localized Stu2-GFP in stu2T866V cells than in STU2WT cells (Fig. 7, A and B). There was no difference in the overall length of anaphase spindles between STU2WT and stu2T866V cells, showing that decreased Stu2 signal along microtubules was not due to differences in anaphase spindle length (Fig. 7 C). Furthermore, cells expressing stu2T866E showed no difference in midzone-localized Stu2-GFP compared with STU2WT cells, consistent with the midzone-localized Stu2 pool being predominantly phosphorylated at T866 during anaphase (Fig. S5, D and E).

Stu2 T866 phosphorylation is important for of anaphase spindle function. (A) Exponentially growing stu2-AID NDC80-mKate cells expressing STU2-GFP (M3774) or stu2T866V-GFP (M4429) were released from a G1 arrest into auxin-containing media. Samples were taken every 15 min, fixed, and imaged. Representative images of anaphase cells showing interpolar Stu2-GFP signal as dashed white line. Scale bars are 1 µm. (B) Cells grown as in A were imaged to determine interpolar Stu2-GFP signal for STU2-GFPWT and stu2T866V-GFP cells in anaphase. Bar represents the mean of n = 85–108 individual measurements. Error bar is SEM. P values from two-tailed unpaired t test. (C) Cells grown as in A were imaged to determine distance between Ndc80 puncta for STU2WT-GFP and stu2T866V-GFP cells in anaphase. Bar represents the mean of n = 85–108 individual measurements. Error bar is SEM. P values from two-tailed unpaired t test. (D) Exponentially growing stu2-AID SPC110-mCherry cells ectopically expressing STU2-GFP variants (STU2WT-GFP, M2429; stu2T866V-GFP, M5309) were treated with auxin for 30 min. Spc110-mCherry and Stu2-GFP signals were imaged every minute. Representative time course of a cell progressing through anaphase beginning 5 min prior to anaphase onset until 15 min postanaphase onset. The white dotted line indicates anaphase onset. Arrow indicates instance of spindle collapse/regression. Proportion of cells that showed spindle regression phenotype indicated below time courses. (E) Cells harboring stu2-AID ipl1–321 (M1995) or also expressing STU2WT-3HA (M4627) or stu2T866V-3HA (M4628) were serially diluted (fivefold) and spotted on plates containing DMSO (control), 500 μM auxin, or 500 μM auxin + 5 μg/ml benomyl. Plates were grown at 23°C or 34°C (i.e., semi-permissive temperature for ipl1–321). (F) WT (M3), bim1Δ (M6558), and bim1Δ stu2-AID cells with various STU2-3HA covering alleles (null, M6463; STU2WT, M6546; stu2T866V, M6547) were serially diluted (fivefold) and spotted on plates containing DMSO or 500 μM auxin. (G) WT (M3), kar3-AID (M6465), kar3-AID stu2-AID cells with various STU2-3HA covering alleles (null, M6467; STU2WT, M6538; stu2T866V, M6539) were serially diluted (fivefold) and spotted on plates containing DMSO, 500 μM auxin, or 500 μM auxin + 5 μg/ml benomyl.
Stu2 T866 phosphorylation is important for of anaphase spindle function. (A) Exponentially growing stu2-AID NDC80-mKate cells expressing STU2-GFP (M3774) or stu2T866V-GFP (M4429) were released from a G1 arrest into auxin-containing media. Samples were taken every 15 min, fixed, and imaged. Representative images of anaphase cells showing interpolar Stu2-GFP signal as dashed white line. Scale bars are 1 µm. (B) Cells grown as in A were imaged to determine interpolar Stu2-GFP signal for STU2-GFPWT and stu2T866V-GFP cells in anaphase. Bar represents the mean of n = 85–108 individual measurements. Error bar is SEM. P values from two-tailed unpaired t test. (C) Cells grown as in A were imaged to determine distance between Ndc80 puncta for STU2WT-GFP and stu2T866V-GFP cells in anaphase. Bar represents the mean of n = 85–108 individual measurements. Error bar is SEM. P values from two-tailed unpaired t test. (D) Exponentially growing stu2-AID SPC110-mCherry cells ectopically expressing STU2-GFP variants (STU2WT-GFP, M2429; stu2T866V-GFP, M5309) were treated with auxin for 30 min. Spc110-mCherry and Stu2-GFP signals were imaged every minute. Representative time course of a cell progressing through anaphase beginning 5 min prior to anaphase onset until 15 min postanaphase onset. The white dotted line indicates anaphase onset. Arrow indicates instance of spindle collapse/regression. Proportion of cells that showed spindle regression phenotype indicated below time courses. (E) Cells harboring stu2-AID ipl1–321 (M1995) or also expressing STU2WT-3HA (M4627) or stu2T866V-3HA (M4628) were serially diluted (fivefold) and spotted on plates containing DMSO (control), 500 μM auxin, or 500 μM auxin + 5 μg/ml benomyl. Plates were grown at 23°C or 34°C (i.e., semi-permissive temperature for ipl1–321). (F) WT (M3), bim1Δ (M6558), and bim1Δ stu2-AID cells with various STU2-3HA covering alleles (null, M6463; STU2WT, M6546; stu2T866V, M6547) were serially diluted (fivefold) and spotted on plates containing DMSO or 500 μM auxin. (G) WT (M3), kar3-AID (M6465), kar3-AID stu2-AID cells with various STU2-3HA covering alleles (null, M6467; STU2WT, M6538; stu2T866V, M6539) were serially diluted (fivefold) and spotted on plates containing DMSO, 500 μM auxin, or 500 μM auxin + 5 μg/ml benomyl.
To assess directly the effects of Stu2 localization on anaphase spindle elongation, we used live-cell imaging of STU2WT-GFP and stu2T866V-GFP cells, which also had spindle poles marked with SPC110-mCherry. We imaged cells every minute during mitosis and tracked the distance between Spc110 foci to measure mitotic spindle elongation. Both STU2WT and stu2T866V cells showed some frequency of transient mitotic spindle regression under our imaging conditions, but spindle regression occurred almost twice as frequently in stu2T866V cells (7/26 STU2WT, 16/32 stu2T866V; Fig. 7 D). Moreover, the maximum spindle elongation rate was lower in stu2T866V than in STU2WT cells (Fig. S5 F). These observations suggest that Stu2T866 is phosphorylated at anaphase onset, causing a portion of the cellular Stu2 to relocalize to interpolar microtubules and regulate anaphase spindle elongation. This switch-like modification of Stu2 may play a part in regulating the rapid cytoskeletal reorganization during anaphase.
Blocking Stu2T866 modification leads to synthetic growth phenotypes with spindle regulators
If Stu2T866 phosphorylation is important for anaphase spindle function, we reasoned that additional mutations affecting anaphase spindle dynamics would result in synthetic growth phenotypes. The kinase Ipl1/Aurora B acts as a critical regulator of anaphase spindle dynamics, specifically at the spindle midzone, where it destabilizes microtubules (Buvelot et al., 2003; Pereira and Schiebel, 2003). When we examine cell viability of stu2T866V cells that also contain the ipl1–321 temperature-sensitive mutation, we observe a decrease in cellular viability compared with STU2WT cells at semi-permissive temperatures (Fig. 7 E). Interestingly, we also found contexts where stu2T866V results in a significant growth advantage. When combined with bim1∆, the stu2T866V allele rescues cell growth, and when combined with Kar3 depletion, stu2T866V shows benomyl dependence for cell growth (Fig. 7, F and G). Bim1 and Kar3 are thought to stabilize anaphase microtubules, making it notable that these strains display the opposite phenotype of mutants of the microtubule destabilizer Ipl1 when combined with stu2T866V (Allingham et al., 2007; Gardner et al., 2008; Blake-Hodek et al., 2010; Chen et al., 2011). These phenotypic results are consistent with our microcopy results and support the notion that Stu2T866 phosphorylation plays an important role in modulating anaphase microtubule function.
PP2ACdc55 regulates the mitotic spindle
Our findings indicate that Stu2T866 phosphorylation is regulated by a Cdc5-PP2ACdc55 network at the metaphase-anaphase transition. However, Stu2T866 is likely just one of many phosphosites this network regulates to control anaphase spindle function (Fig. 8 A). We therefore asked whether cells use this pathway to regulate other MAPs to drive large microtubule cytoskeletal remodeling during anaphase. We performed a gene ontology (GO) term analysis of 316 sites, previously identified as regulated by PP2ACdc55 during metaphase (Touati et al., 2019). This analysis showed that many microtubule and actin cytoskeleton remodelers, including the MAPs Bim1, Stu1, and Ase1, are among the metaphase targets of Cdc55 (Fig. S5 G). This is consistent with the idea that PP2ACdc55 activity is important for regulating the cytoskeleton changes that happen at anaphase onset and that Stu2T866 is one of a multitude of phosphorylation events that may control this activity.

PP2A Cdc55 regulation of mitotic spindle and model of phosphoregulation of Stu2 subcellular localization and function. (A) Model of PP2ACdc55 substrates involved in spindle regulation detected by mass spectrometry (see Fig. S5 G). Putative activity of Cdc5/Plk1 indicated by question mark. (B) Exponentially growing SPC110-mCherry MTW1-3GFP cells containing CDC55WT (M1174) or cdc55Δ (M5848) were imaged every minute. Spindle length of cells in metaphase was determined by measuring the distance between Spc110-mCherry foci. Each data point represents an individual cell. Bars represent the average of n = 20–23 individual measurements. Error bars are SEM. P values from two tailed unpaired t test. (C) Cells grown and imaged as in B were analyzed to determine maximum rates of spindle elongation over a 2-min period for each individual cell. Each data point represents a single cell. Bars represent the average of n = 20–23 individual measurements. Error bars are SEM. P values from two-tailed unpaired t test. (D) Model of phosphoregulation of Stu2 localization. In G1 phase, Stu2 is predominantly localized to the cytoplasm. As Cdk activity increases in the cell cycle, Stu2S603 becomes phosphorylated, and Stu2 is imported into the nucleus. In the nucleus, Stu2 binds to many factors, including Ndc80c (as well as +TIP factor Bik1, Kip3, Kar9, and others), and carries out a required function for chromosome biorientation. During metaphase, Plk1/Cdc5 interacts with Stu2 via binding phosphorylated Stu2S603. Plk1 phosphorylates Stu2T866, and PP2ACdc55 opposes this phosphorylation. At anaphase onset, PP2ACdc55 activity is inhibited by separase, and Stu2T866 becomes predominantly phosphorylated. This leads to reduced Stu2:Ndc80c association and relocalization of some Stu2 to spindle microtubules to regulate anaphase spindle function. Stu2 localization at spindle-pole bodies (via Spc72) is also indicated. Reduced association with +TIP factor Bik1 may also be possible upon Stu2T866 phosphorylation.
PP2A Cdc55 regulation of mitotic spindle and model of phosphoregulation of Stu2 subcellular localization and function. (A) Model of PP2ACdc55 substrates involved in spindle regulation detected by mass spectrometry (see Fig. S5 G). Putative activity of Cdc5/Plk1 indicated by question mark. (B) Exponentially growing SPC110-mCherry MTW1-3GFP cells containing CDC55WT (M1174) or cdc55Δ (M5848) were imaged every minute. Spindle length of cells in metaphase was determined by measuring the distance between Spc110-mCherry foci. Each data point represents an individual cell. Bars represent the average of n = 20–23 individual measurements. Error bars are SEM. P values from two tailed unpaired t test. (C) Cells grown and imaged as in B were analyzed to determine maximum rates of spindle elongation over a 2-min period for each individual cell. Each data point represents a single cell. Bars represent the average of n = 20–23 individual measurements. Error bars are SEM. P values from two-tailed unpaired t test. (D) Model of phosphoregulation of Stu2 localization. In G1 phase, Stu2 is predominantly localized to the cytoplasm. As Cdk activity increases in the cell cycle, Stu2S603 becomes phosphorylated, and Stu2 is imported into the nucleus. In the nucleus, Stu2 binds to many factors, including Ndc80c (as well as +TIP factor Bik1, Kip3, Kar9, and others), and carries out a required function for chromosome biorientation. During metaphase, Plk1/Cdc5 interacts with Stu2 via binding phosphorylated Stu2S603. Plk1 phosphorylates Stu2T866, and PP2ACdc55 opposes this phosphorylation. At anaphase onset, PP2ACdc55 activity is inhibited by separase, and Stu2T866 becomes predominantly phosphorylated. This leads to reduced Stu2:Ndc80c association and relocalization of some Stu2 to spindle microtubules to regulate anaphase spindle function. Stu2 localization at spindle-pole bodies (via Spc72) is also indicated. Reduced association with +TIP factor Bik1 may also be possible upon Stu2T866 phosphorylation.
To test the notion that PP2ACdc55 broadly regulates the mitotic spindle in both metaphase and anaphase, we performed live-cell imaging of CDC55WT and cdc55Δ cells expressing SPC110-mCherry and MTW1-GFP, tracking the distance between Spc110 foci during mitosis. Consistent with our hypothesis, cdc55Δ cells had longer spindles in metaphase than CDC55WT and had lower maximum spindle elongation rates in anaphase (Fig. 8, B and C). From our Stu2 mutational analysis, we expected a spindle defect in metaphase because PP2ACdc55 actively counteracts Cdc5 phosphorylation at that stage. The persistence of spindle defects into anaphase suggests that the precise timing of phosphorylation events regulated by Cdc5-PP2ACdc55 is critical for spindle function. Overall, these findings are in line with the notion that PP2ACdc55 activity supports mitotic spindle maintenance, likely through posttranslational modification of many microtubule-associated substrates, including Stu2.
Discussion
The XMAP215 family member Stu2 has multiple cellular roles and functions at microtubule-organizing centers, kinetochores, and microtubules during different points in the cell cycle (van Breugel et al., 2003; Al-Bassam et al., 2006; Hsu and Toda, 2011; Miller et al., 2016; Zahm et al., 2021). We have studied their regulation, including the import into the nucleus and modulation of kinetochore and microtubule localization. In particular, we have investigated how phosphorylation of Stu2 at two specific sites governs its subcellular activities. We find that Cdk/Cdc28 activity facilitates nuclear import of Stu2 through phosphorylation of Stu2S603 in the nuclear localization sequence in Stu2’s basic linker. We further find that phosphorylation of a threonine in Stu2’s CTS (Stu2T866) reduces association of Stu2 with Ndc80c. Stu2T866 phosphorylation depends on the polo-like kinase, Cdc5, and Cdc28 phosphorylation of S603 primes the Stu2:Cdc5 interaction. PP2ACdc55 opposes Stu2T866 phosphorylation in metaphase. Upon inhibition by the newly activated separase, downregulation of PP2ACdc55 (Queralt et al., 2006) leads to rapid accumulation of phosphorylated Stu2T866 at anaphase onset (Fig. 8 D). Modification of this site allows cells to relocalize a pool of Stu2 to the spindle midzone during anaphase for maintenance of anaphase spindle function. This regulatory event is likely one of many modifications that the Cdc5-PP2ACdc55 network catalyzes to elicit the rapid cytoskeletal changes required for entry into anaphase (Touati et al., 2019).
The phenotypic effects of blocking Stu2T866 phosphorylation are consistent with a role for this modification in anaphase spindle function. Cell harboring stu2T866V had anaphase spindle defects and striking cell viability alterations when combined with mutants of other spindle regulators (Fig. 7, A–G). The dependence of kar3-AID stu2T866V cells on benomyl for growth is particularly notable, and it is reminiscent of the phenotype associated with tubulin mutants that produce hyperstable microtubules (Thomas et al., 1985; Richards et al., 2000; Macaluso et al., 2025). The tub2–150 allele in particular displays hyperstable microtubules and is both benomyl dependent for growth and defective for anaphase spindle elongation (Thomas et al., 1985; Macaluso et al., 2025). Given the similarity in cellular phenotypes between hyperstable tubulin mutants and stu2T866V, which is further exacerbated with Kar3 depletion (Fig. S2 E and Fig. 7, A–G), we propose Stu2T866 phosphorylation, and the resulting changes in Stu2 localization, may also play a role in modulating microtubule stability. Further work will be needed to confirm this hypothesis. Why stu2T866V does not produce more dramatic cell viability defects on its own is unknown. This could be either because rapid anaphase spindle elongation is dispensable in yeast (Abouelghar et al., 2022, Preprint) or possibly because Stu2T866 is just one of many sites that Cdc5-PP2ACdc55 modify to regulate the anaphase spindle (Fig. 8 A and Fig. S5 G), and the effects of blocking just one of these sites is relatively small.
The rapid phosphorylation of Stu2T866 at anaphase onset could also serve other cellular purposes. One mechanism we considered is whether Stu2-dependent kinetochore functions are affected by Stu2T866 phosphorylation, including Stu2’s proposed role in error correction (Miller et al., 2016; Miller et al., 2019). Kinetochore error-correction mechanisms are thought to be downregulated at anaphase onset to address the “anaphase problem” (Vázquez-Novelle et al., 2010), as kinetochore-microtubule attachments are under low tension during anaphase. Ipl1, a main effector of error-correction in metaphase, is relocalized from centromeres to the midzone at anaphase onset through Cdc14-mediated dephosphorylation of Sli15 (Buvelot et al., 2003; Khmelinskii et al., 2007; Zimniak et al., 2012; Cairo et al., 2023). It is attractive to propose that phosphorylation of Stu2T866 could serve as a mechanism to control Stu2’s putative error-correction activity, but our data suggest that Stu2T866 modification is not the sole regulator of Stu2-dependent kinetochore function. The phenotypes observed in stu2T866V cells are not consistent with hyper-activated error correction, such as tethering Ipl1 to outer kinetochore substrates (Li et al., 2023), which severely compromises cell viability. Instead, it is more likely that Stu2T866 phosphorylation plays a role in redistributing Stu2 between kinetochores and microtubules to regulate the mitotic spindle, as our data show. Our results also do not exclude the possibility that other posttranslational modifications of Stu2 or Ndc80c may influence their association and/or kinetochore function (Greenlee et al., 2022), and this is an important topic for future studies.
Another role for rapid Stu2T866 phosphorylation could be to regulate non-kinetochore subpopulations of Stu2. This is possible because the Stu2 CTS facilitates multiple protein–protein interactions with various coiled-coil–containing proteins (including Bik1 and Spc72). The best available structure predictions suggest that Stu2’s CTS interacts with Bik1 and Spc72 using similar modes as the Stu2:Ndc80c interaction; however, robust biochemical and structural studies are needed to conclusively demonstrate this (Fig. S2 G) (Zheng et al., 2025). If all CTS:protein interactions modes are identical, then phosphorylation of the Stu2 CTS at T866 by Cdc5 would be expected to disrupt all such interactions. While direct structural evidence for the Stu2:Bik1 interaction is currently lacking, we cannot rule out the possibility that it is also regulated by T866 phosphorylation. Changes in Stu2:Bik1 binding could offer an alternative explanation for our results. However, our data clearly demonstrate that T866 phosphorylation modulates Stu2:Ndc80c interactions. Further work will be needed to definitively determine how these pathways influence Stu2’s subcellular localization.
Subcellular localization of Cdc5 or PP2ACdc55 could also differentially regulate Stu2 subpopulations, even if they share similar CTS-binding modes. For instance, Cdc5 transitions from the nucleus to the cytoplasm during late anaphase potentially lead to differential regulation of nuclear versus cytoplasmic Stu2 pools (Botchkarev et al., 2014; Botchkarev et al., 2017). This dynamic localization, coupled with a drop in Cdc5 activity during mitotic exit (Touati et al., 2018; Touati et al., 2019), could result in distinct regulation of cytoplasmic Stu2 bound to Spc72 versus nuclear Stu2 bound to Ndc80c. Additionally, other Stu2 domains, such as the basic linker, mediate protein interactions and may define CTS-independent Stu2 pools that are regulated differently. A subset of nuclear and kinetochore-proximal Stu2 has also been shown to vary in its dynamism across the cell cycle (Aravamudhan et al., 2014). It remains unclear how Stu2T866 phosphorylation affects these dynamics versus stable Stu2 pools or whether this regulation influences dynamism at all. These questions warrant further investigation.
Our work provides new, detailed information concerning mechanisms for specifying substrates of Plk1/Cdc5. Many Cdc5 substrates require priming through proline-directed phosphorylation before they can interact with Cdc5 polo-box domain (Elia et al., 2003), while others depend on hydrophobic interactions between the substrate and a distal face of the Cdc5 polo-box domain, separate from the canonical phosphopeptide-binding region (Almawi et al., 2020). A recent report also suggests a different mode of human Plk1:substrate interaction, mediated by electrostatic interactions on the canonical phosphopeptide-binding surface of Plk1 but independent of substrate phosphorylation (Conti et al., 2024, Preprint). This interaction has been shown to be important for Plk1 to assist in nucleosome deposition in G1, a time at which Cdk activity is very low (reviewed in Bloom and Cross [2007]). Our finding that Cdc5-FRB can reduce Stu2 colocalization with kinetochores in both G1 and mitotic cells is surprising given the previous literature suggesting ectopically expressed Cdc5 is inactive in G1 due to low Cdc28 activity (Mortensen et al., 2005; Rodriguez-Rodriguez et al., 2016). However, the effect we observe relies only on relocalizing Cdc5 and not on ectopically expressing it, perhaps suggesting there are more control mechanisms for Cdc5 activity than just Cdc28 priming. In agreement with this idea and with new findings in Conti et al. (2024) (Preprint), our results show that Stu2 has two polo-box interacting motifs: one dependent on phosphorylation of a Cdk/Cdc28 consensus site (Stu2S603) and another driven by hydrophobic interactions independent of Cdc28 phosphorylation. An important direction for future research will be to determine whether both interaction motifs are always used or if they are specifically engaged during different stages of the cell cycle, when Cdc28 activity levels vary. We also note that a previous study has suggested that Stu2 is a Cdc5 substrate, findings that nicely complement our mechanistic work here (Park et al., 2008).
Our in-depth mutational analysis is consistent with the notion of a kinase-phosphatase network that controls the timing of many cellular events at anaphase onset. For Stu2, this phosphorylation appears to follow a switch-like response in the cell cycle, with phosphorylation of Stu2T866 increasing rapidly at anaphase onset. We therefore propose Stu2 is a newly identified Cdc5-PP2ACdc55 substrate, as it behaves like the prototypical Cdc5-PP2ACdc55 substrate Net1 (Queralt et al., 2006; Touati et al., 2019). Certainly, Stu2T866 is not the only site regulated within this network. Phosphoproteomics experiments also showed that Cdc5 and PP2ACdc55 modify many microtubule- and actin-cytoskeleton–associated factors during the metaphase-anaphase transition (Fig. S5 G, see also Touati et al., 2019). More targeted studies show that PP2ACdc55 regulates the actin cytoskeleton during the cell cycle (Jonasson et al., 2016; Moyano-Rodríguez et al., 2022). Complementing these findings, we show that PP2ACdc55 also regulates the microtubule cytoskeleton, in part by controlling Stu2 localization. Additional microtubule regulators, such as Bim1, Stu1, and Ase1, which are also PP2ACdc55 targets (Touati et al., 2019), likely contribute to the large changes in the cytoskeleton during anaphase. We believe that misregulation of these factors may account for the spindle defects observed in cells induced to enter anaphase via TEV-Scc1 cleavage in the absence of separase activity (Uhlmann et al., 2000). Furthermore, it is unknown if other important substrates in this pathway may have thus far escaped detection (Baro et al., 2018; Touati et al., 2019). In particular, several kinetochore, motor, and MAP proteins are predicted to be Cdc5 substrates, including Ndc80, Spc24, Kar3, Bim1, Sli15, and Cse4 (Ólafsson and Thorpe, 2015, 2020). Whether the Cdc5-PP2ACdc55 network also regulates these or other proteins at anaphase onset could be addressed by the kinase-tethering tools and mutational analyses described here and remain important avenues for future work.
Finally, there are reports from studies on human cells indicating anaphase-specific phosphorylation of Plk1 targets, particularly the microtubule regulator Prc1 (homolog of yeast Ase1). These studies show that Prc1T602 is phosphorylated by Plk1 in metaphase and that phosphorylated T602 accumulates rapidly in anaphase to facilitate proper function of the spindle midzone (Neef et al., 2007; Hu et al., 2012; Holder et al., 2020; Lim et al., 2024; Tai et al., 2025) and support the notion that posttransitional modifications of MAPs tune microtubule dynamics in anaphase. This pattern is reminiscent of the behavior of Stu2T866 and other Cdc5-PP2ACdc55 threonine substrates in yeast. Furthermore, evidence suggests a similar inactivation of human PP2AB55 dephosphorylation during anaphase (Játiva et al., 2019). The mechanisms described here may therefore represent a conserved strategy to enhance phosphorylation of Plk1 substrates rapidly at anaphase onset.
Materials and methods
Strain construction and microbial techniques
Yeast strains
Saccharomyces cerevisiae strains used in this study, all derivatives of M3 (W303), are described in Table S1. Standard media and microbial techniques were used (Sherman et al., 1974). Yeast strains were constructed by standard genetic techniques. Construction of DSN1-6His-3Flag is described by Akiyoshi et al. (2010), STU2-3FLAG and stu2-3V5-IAA7 by Miller et al. (2016), and TOR1-1, fpr1∆, and MPS1-FRB:KanMX by Haruki et al. (2008), Aravamudhan et al. (2015). Construction of MTWI-3GFP is described by Pinsky et al. (2006). NUF2-FKBP12:HisMX construction was described by Zahm et al. (2021), BIK1-FRB construction is detailed by Abouelghar et al. (2022), Preprint. CDC5-FRB:KanMX, BUB1-FRB:KanMX, IPL1-FRB:KanMX, cdc55-3HA-IAA7, rts1-3HA-IAA7, NDC80-mKate, BIK1-3FLAG, and CDC5-FLAG were constructed by PCR-based methods (Longtine et al., 1998). The kar3-AID, bim1∆, and ipl1–321 strains were provided by Sue Biggins. Strains containing the previously described pMET-CDC20 allele were provided by Frank Uhlmann. CDC20-AID– and cdc55Δ-containing strains were gifts from Adèle Marston. The cdc5-1 allele was provided by David Morgan. For qCTF, strains with MFA1-3XGFP and the (CEN3.L.YA5.1)MATα:LEU2 mini chromosome were generously provided by Rong Li. SPC110-mCherry–containing strains were provided by Trisha Davis.
Plasmid construction
pGPD1-TIR1 integration plasmids (pM76 for integration at HIS3 or pM78 for integration at TRP1) were provided by Leon Chan (Miller et al., 2016). Construction of a 3HA-IAA7–tagging plasmid (pM69) as well as a LEU2-integrating plasmid containing WT pSTU2-STU2-3V5 (pM225) and pSTU2-stu2Δ855–888-3V5 (pM267) are described by Miller et al. (2016), Miller et al. (2019). Plasmid construction for STU2-NLS-GFP (pM659), Stu2592–607-GFP-GST (pM774), and STU2-GFP-GST (pM772), as well as mutants of these plasmids, Stu2592–607(S603A)-GFP-GST (pM1362) and Stu2592–607(S603E)-GFP-GST (pM1410), are described by Carrier et al. (2022), Preprint. stu2L869E,I873E,M876E-3V5 construction is described by Zahm et al. (2021). STU2-GFP (pM488) and STU2-3HA (pM227) plasmids for this study were constructed by megaprimer mutagenesis as described by Liu and Naismith (2008), Tseng et al. (2008). STU2 variants were constructed by mutagenizing the above plasmids. Primers used in the construction of the above plasmids are listed in Table S2, and further details of plasmid construction, including plasmid maps, are available upon request.
Yeast culture
Standard culture conditions for S. cerevisiae (W303) were followed for all experiments unless otherwise indicated. Strains were grown to be in the logarithmic growth phase for all experiments unless otherwise noted. Strains containing the temperature-sensitive allele cdc5-1 were grown at the permissive temperature of 23°C to maintain cell viability, then shifted to 37°C for 60 min to inhibit cdc5-1. For Cdk inhibition, strains harboring the analog-sensitive cdc28-as1 allele were treated with 2.5 µM 1NA-PP1 for 30 min. To deplete Cdc20-AID for metaphase arrests, IAA7 treatment was used as described below for 2.5 h. For metaphase arrests using pMET-CDC20, cells were arrested in rich media containing 8 mM methionine for 2.5 h. To arrest cells in mitosis using nocodazole, cells were treated with 10 μg/ml nocodazole for 2.5 h α-factor arrests were performed by treating cells with 10 μg/ml α-factor for 3.5 h.
Auxin-inducible degradation
The AID system was used essentially as described (Nishimura et al., 2009). Briefly, cells expressed C-terminal fusions of the protein of interest to an auxin-responsive protein (IAA7) at the endogenous locus. Cells also expressed TIR1, which is required for auxin-induced degradation. 500 μM IAA (indole-3-acetic acid dissolved in DMSO; Sigma-Aldrich) was added to media to induce degradation of the AID-tagged protein. Auxin was added for 30 min prior to harvesting cells or as indicated in figure legends.
Spotting assay
For the spotting assay, the desired strains were grown for 2 days on plates containing yeast extract peptone plus 2% glucose (YPAD) medium. Cells were then resuspended to OD600 ∼1.0, from which a serial 1:5 dilution series was made and spotted on YPAD+DMSO, YPAD+500 μM IAA (indole-3-acetic acid dissolved in DMSO), or plates containing 3.5–5.0 μg/ml benomyl or 0.05 μg/ml rapamycin as indicated. Plates were incubated at 23°C for 2–3 days unless otherwise noted.
qCTF
CTF assay was carried out as described by Zhu et al. (2015). Briefly, exponentially growing stu2-AID strains containing MFA1-3XGFP and MC(CEN3.L.YA5.1)MATα:LEU2 and STU2-3HA variants were diluted into synthetic complete media containing auxin and grown for 16 h. Loss of the mini-chromosome fragment was observed by measuring GFP signal by flow cytometry and quantified for 10,000 cells.
FRB/FKBP tethering
For re-tethering in culture, exponentially growing cultures were treated with 500 μM auxin and 0.20 μg/ml (200 ng/ml rapamycin) 30 min prior to harvesting. For spotting assays on plates, 0.05 μg/ml rapamycin was used.
Fluorescence microscopy
For imaging of fixed cells, cells were treated with 3.5% formaldehyde in Kpi (e.g., 0.1 M potassium phosphate) buffer for 5 min. Cell images were collected with a DeltaVision Elite wide-field microscope system (GE Healthcare) equipped with a scientific CMOS camera, using a 60× objective (Olympus; NA = 1.42 PlanApoN) and immersion oil with a refractive index of n = 1,516. A Z-stack was acquired over a 3-µm width with 0.2-µm Z-intervals. Images were deconvolved using the DeltaVision algorithm, maximally projected, and analyzed using the Fiji image processing package (ImageJ). Intensity of whole-cell Stu2-GFP and Stu2-GFP and Ndc80-mKate kinetochore puncta was determined using Fiji. For live-cell imaging, exponentially growing cultures, grown in synthetic complete media, were treated with 500 μM auxin 30 min prior to imaging to degrade Stu2-AID and analyzed for Stu2-GFP distribution and spindle length or left untreated to observe Mtw1-GFP and spindle length. For each strain, an aliquot of cells was pelleted and resuspended in a volume of synthetic complete media with 500 μM auxin to optimize cell density for imaging (OD600 ≈ 5). Cells were adhered to a coverslip coated in concanavalin A as described by Fees et al. (2017), and the chamber was sealed using petroleum jelly. Cells were imaged using a DeltaVision Ultra as described above. Images of the Spc110-mCherry signal, Stu2-GFP signal, and differential interference contrast (DIC) were acquired through the thickness of the cells using Z-stacks 0.3-µM apart. These images were acquired every 1 min. All frames were deconvolved using standard settings. Image stacks were maximally projected for analysis of spindle lengths and Stu2 distribution. softWoRx image processing software was used for image acquisition and processing. Projected images were imported into FIJI for analysis. Distance between Spc110-mCherry puncta was measured every minute beginning 5 min prior to anaphase onset until 15 min postanaphase onset. Anaphase onset was determined for a given cell by selecting the spindle length at the time point prior to which an increase in spindle length of at least 0.2 µM was observed and followed by an increase in spindle length over the next three time points. Spindle collapse events were defined as events of spindle regression measuring 0.2 µM or more between images. The maximum rate of spindle elongation for a given cell was calculated by determining the maximum difference in spindle length over a 2-min time period and calculating the rate of spindle elongation over that time period. Metaphase spindle length was determined as the average spindle length of the five time points prior to anaphase onset.
GO term analysis
Genes for GO analysis were compiled from mass spectrometry data of phosphosites that changed in the presence of cdc55Δ (see Touati et al. [2019], Fig. S5 G, also Table S5). GO terms determined as described by Ashburner et al. (2000) using the GO Reference Server.
Multiple sequence alignment
Fungal proteins related to S. cerevisiae Stu2 were identified using a PSI-BLAST (Altschul et al., 1997) search on NCBI. Multiple sequence alignments of the entire proteins were generated with ClustalOmega default parameters and displayed in JalView 1.8.
Structure prediction and modeling
AlphaFold Server was used to produce AlphaFold 3 structural predictions of indicated protein complexes containing phosphorylated and unphosphorylated polypeptides (Abramson et al., 2024). Protein structures were modeled and compared in UCSF Chimera and ChimeraX. Building phosphates onto threonine in structure models was accomplished using ChimeraX.
Protein biochemistry
Purification of native yeast protein
Native kinetochore particles were purified from asynchronously growing S. cerevisiae cells as described below. Dsn1-6His-3Flag was immunoprecipitated with anti-Flag essentially as described by Akiyoshi et al. (2010). Tagged yeast proteins (Bik1-FLAG, Cdc5-FLAG, Stu2-V5, and Stu2-FLAG) were similarly purified from yeast as follows. Cells were grown in yeast YPAD-rich medium. For strains containing stu2-AID, cells were treated with 500 μM auxin 30 min prior to harvesting. Protein lysates were prepared by mechanical disruption in the presence of lysis buffer using glass beads and a bead beater (Biospec Products) or freezer mill (Spex Sample Prep). Lysed cells were resuspended in buffer H (BH; 25 mM HEPES, pH 8.0, 2 mM MgCl2, 0.1 mM EDTA, 0.5 mM EGTA, 0.1% NP-40, and 15% glycerol with 150 mM KCl) containing protease inhibitors at 20 μg/ml final concentration each for leupeptin, pepstatin A, chymostatin, and 200 μM phenylmethylsulfonyl fluoride and phosphatase inhibitors (0.1 mM Na-orthovanadate, 0.2 μM microcystin, 2 mM β-glycerophosphate, 1 mM Na pyrophosphate, and 5 mM NaF), followed by centrifugation at 16,100 g for 30 min at 4°C to clarify lysate. Stu2-FLAG lysates were processed by centrifugation at 24,000 g for 90 min at 4°C to clarify the lysate. Dynabeads (10-003-D; Invitrogen) conjugated with anti-Flag or anti-V5 antibodies were incubated with extract for 3 h with constant rotation, followed by three washes with BH containing protease inhibitors, phosphatase inhibitors, 2 mM DTT, and varying concentrations of KCl (Dsn1-FLAG 150 mM, Bik1-FLAG 150 mM, Stu2-FLAG 750 mM, Stu2-V5 750 mM, and Cdc5-FLAG 750 mM). Beads were further washed twice with BH containing 150 mM KCl and protease inhibitors. Associated proteins were eluted from the beads by boiling in 2X SDS sample buffer. Stu2-3Flag protein for mass spec analysis was eluted from beads with rapigest (product #186001861; Waters).
Cdc5:Stu2-binding assay
Beads with immobilized Cdc5-FLAG were prepared as described above (prior to elution of bound proteins). Negative control beads incubated with lysate without tagged proteins were also prepared. Previously purified Stu2-V5 proteins were incubated with Cdc5-FLAG–immobilized beads or negative control beads at room temperature with mixing for 30 min. Beads were washed twice with BH buffer containing 150 mM KCl, then complexes were eluted from beads by boiling in 1× SDS sample buffer. Samples and Stu2-V5 inputs were analyzed by SDS-PAGE and immunoblotting.
In vitro Cdc5 kinase assay
For kinase assays, beads containing immobilized Cdc5-FLAG were prepared as described above. Cdc5-FLAG beads were washed twice in 50 mM HEPES buffer. Then beads were incubated in a solution containing recombinant Stu2-GFP (5 mM), ATP (50 μM), histone H1 (5 μg/ml), ATP [γ-32P] (2.5 μCi), HEPES (20 μM), EDTA (0.5 mM), DTT (0.5 mM), and MgCl2 (5 mM). Kinase reaction was incubated for 30 min, then SDS sample buffer was added, beads were boiled, and samples were analyzed by SDS-PAGE and autoradiography.
Immunoblot analysis
For immunoblot analysis, cell lysates were prepared as described above or by pulverizing cells with glass beads in SDS buffer using a bead beater (Biospec Products). Standard procedures for SDS-PAGE and immunoblotting were followed as described by Towbin et al. (1979); Burnette (1981). A nitrocellulose membrane (Bio-Rad) was used to transfer proteins from polyacrylamide gels. Commercial antibodies used for immunoblotting were as follows: α-Flag, M2 (F3165; Sigma-Aldrich) 1:3,000; α-V5 (46–0705; Invitrogen) 1:5,000. Antibodies to Ndc80 (OD4) were a kind gift from Arshad Desai (Department of Cellular & Molecular Medicine, University of California, San Diego, La Jolla, CA, USA) and used at 1:10,000. The secondary antibodies used were a sheep anti-mouse antibody conjugated to HRP (NA931V; GE Biosciences) at a 1:10,000 dilution or a donkey anti-rabbit antibody conjugated to HRP (NA934V; GE Biosciences) at a 1:10,000 dilution. Antibodies were detected using the SuperSignal West Dura Chemiluminescent Substrate (Thermo Fisher Scientific).
Mass spectrometry
For detection of phosphopeptides from Stu2-3FLAG immunoprecipitations, rapigest-eluted Stu2-3Flag protein was subjected to trypsin digestion prior to liquid chromatography tandmen mass spectrometry (LC-MS/MS) analysis. LC-MS/MS was performed on an Easy-nLC 1000 (Thermo Fisher Scientific) coupled to an LTQ-Orbitrap Elite mass spectrometer (Thermo Fisher Scientific) operated in positive ion mode. The LC system consisted of a fused-silica nanospray needle (PicoTip emitter, 50 µm ID × 20 cm, New Objective) packed in-house with Magic C18-AQ, 5 mm, and a trap (IntegraFrit Capillary, 100 µm ID × 2 cm, New Objective) containing the same resin as in the analytical column with mobile phases of 0.1% formic acid (FA) in water (buffer A) and 0.1% FA in acetonitrile (MeCN) (buffer B). The peptide sample was diluted in 20 μl of 0.1% FA and 2% MeCN, and 8 μl was loaded onto the column and separated over 81 min at a flow rate of 300 nl/min with a gradient from 5 to 7% B for 2 min, 7–35% B for 60 min, 35–50% B for 1 min, hold 50% B for 8 min, 50–95% B for 1 min, and hold 95% B for 9 min. A spray voltage of 2,500 V was applied to the nanospray tip. MS/MS analysis was performed for 80 min and consisted of 1 full scan MS from 400 to 1,800 m/z at a resolution of 240,000, followed by data-dependent MS/MS scans using 35% normalized collision energy of the 20 most abundant ions. Selected ions were dynamically excluded for 30 s. Raw MS/MS spectra from the analysis were searched against a W303 yeast strain protein database (downloaded 6/9/2022) containing common contaminants using Proteome Discoverer v3.1, with tryptic enzyme constraint set for up to two missed cleavages; oxidized methionine and phosphorylated serine, threonine, and tyrosine set as a variable modification; carbamidomethylated cysteine set as a static modification; and peptide MH+ mass tolerances set at 10 ppm. The peptide false discovery rate was set at ≤1%.
For detection of phosphopeptides from Stu2-3V5 immunoprecipitations with Cdc5-FRB tethering, SDS buffer–eluted Stu2-3V5 protein was run into a gel and stained with Coomassie. Protein was excised from the Coomassie-stained gel and washed in 50% acetonitrile and 50% 50 mM ammonium bicarbonate until the protein bands were clear. Protein was reduced with 20 mM DTT at 37°C for 30 min, followed by alkylation with 50 mM iodoacetamide for 45 min at room temperature and proteolytic digestion in 50 mM ammonium bicarbonate buffer with 1 μg of trypsin overnight. The peptides were extracted from the gel in 50% acetonitrile and 5% FA and dried to completion. The samples were dried to completion, resuspended in 300 μl of 0.1% TFA, and desalted using Pierce Peptide Desalting Spin Columns according to the manufacturer’s instructions (Thermo Fisher Scientific). Phospho-peptide enrichment was performed using the High Select Fe-NTA Phosphopeptide Enrichment Kit according to the manufacturer’s instructions (Thermo Fisher Scientific). The peptides were desalted again and resuspended in 40 μl of 0.1% FA for LC-MS/MS analysis. Reversed-phase nano-LC-MS/MS was performed on a nanoElute 2 (Bruker Daltonics) coupled to a Bruker timsTOF Pro2 mass spectrometer equipped with a nanoelectrospray source. 200 ng of each sample was injected onto the liquid chromatograph reverse-phase ReproSil C18 150 × 0.10-mm nanocolumn (Bruker Daltonics) heated to 50°C. The peptides were eluted with a gradient of reversed-phase buffers (buffer A: 0.1% FA in 100% water; buffer B: 0.1% FA in 100% acetonitrile) at a flow rate of 0.5 μl/min. The LC run lasted for 42 min with a starting concentration of 5% buffer B increasing to 28% buffer B over 40 min and held at 95% B for 3 min. The timsTOF was operated in parallel accumulation-serial fragmentation (PASEF) data-dependent acquisition MS/MS scan mode. The thermal ionization mass spectrometry (TIMS) section was operated with a 75-ms ramp time at a rate of 9.42 Hz and a scan range of 0.6–1.4 V·s/cm2. One cycle was composed of 1 MS scan followed by 10 PASEF MS/MS scans. MS and MS/MS spectra were recorded from m/z 100 to 1,700. A polygon filter was applied to not select singly charged ions. The quadrupole isolation width was set to 3 Da. The raw data were analyzed using Fragpipe v20.0 software against the uniprot_ref_yeast database (12-18-2023 version with 6,727 proteins). An allowance was made for two missed cleavages following trypsin/Lys C digestion. No fixed modifications were considered. The variable modifications of methionine oxidation and cysteine carbamidomethylation (IAA) were considered with a mass tolerance of 20 ppm for precursor ions and a mass tolerance of 10 ppm for fragment ions. The results were filtered with a false discovery rate of 0.01 for both proteins and peptides. A minimum of one unique peptide should be reported for all proteins identified.
Recombinant protein expression and purification
Ndc80dwarf protein was expressed and purified as described by Valverde et al. (2016), Zahm et al. (2021).
Fluorescence polarization binding assay
A Stu2 CTS peptide (855–888), a CTS peptide containing a phosphothreonine at position 866, and a CTS peptide with a randomized sequence, all containing a C-terminal cysteine residue and synthesized by the Tufts University Core Facility, were resuspended in a volume of buffer containing 100 mM Hepes, pH 7.5, 100 mM NaCl, and 0.5 mM TCEP (resuspension buffer) sufficient to yield a 2 mM peptide concentration. For labeling, the Stu2 CTS peptide was diluted to 100 µM in resuspension buffer to a final volume of 7 ml. To this solution was added 1 ml of 10 mM Oregon Green maleimide dissolved in DMSO. After a 24-h incubation at 4°C, the labeled peptide was separated from unreacted dye by cation exchange chromatography with Source 15S resin (Cytiva). For the competition experiment, the peptides were subjected to serial twofold dilutions in resuspension buffer, and each dilution was mixed 1:1 with a solution containing 30 µM Ndc80dwarf and 200 nM Oregon Green–labeled CTS peptide, also in resuspension buffer. Fluorescence polarization was measured in triplicate in 96-well plates with an EnVision multi-mode plate reader (Perkin Elmer) located in the Institute of Chemistry and Cell Biology (ICCB-Longwood) Screening Facility at Harvard Medical School.
Online supplemental material
Fig. S1 shows the Stu2 phosphorylation and mutant viability phenotypes. Fig. S2 shows the Stu2:Ndc80c-binding details, stu2T866A mutant, and Bik1-binding phenotypes. Fig. S3 shows the effects of tethering mitotic kinases on Stu2 kinetochore association. Fig. S4 shows the different regions of Stu2 basic linker associated with Cdc5 polo-box domain. Fig. S5 shows the cell cycle timing of Stu2T866 modification and PP2A regulatory subunit activity on Stu2. Table S1 shows the yeast strains used in this study. Table S2 shows the plasmids and oligos used in this study. Table S3 shows the phosphopeptides determined from Stu2-FLAG immunoprecipitation by mass spectrometry—1. Table S4 shows the phosphopeptides determined from Stu2-FLAG immunoprecipitation by mass spectrometry—2. Table S5 shows the gene lists for GO analysis. Table S6 shows the phosphopeptides determined from Stu2-V5 immunoprecipitation with Cdc5-FRB tethering by mass spectrometry.
Data availability
Acknowledgments
We thank Arshad Desai for providing antibodies and Sue Biggins (Fred Hutch Cancer Center, Seattle, WA, USA), David Morgan (UC San Francisco, San Francisco, CA, USA), Frank Uhlmann (The Francis Crick Institute, London, UK), Adèle Marston (University of Edinburgh, Edinburgh, UK), Rong Li (National University of Singapore, Singapore), Trisha Davis (University of Washington, Seattle, WA, USA), and Leon Chan (UC Berkeley, Berkeley, CA, USA) for strains and/or plasmids. We would like to thank Sue Biggins and members of the Miller lab for critical reading of the manuscript. Luke Rice (UT Southwestern, Dallas, TX, USA) generously provided Stu2 protein for in vitro kinase assays. We also thank the University of Utah Cell Imaging Core for maintaining the DeltaVision microscope facility. Proteomics mass spectrometry analysis for Fig. 3 E was performed at the Mass Spectrometry and Proteomics Core Facility at the University of Utah. Mass spectrometry equipment was obtained through a Shared Instrumentation Grant #S10 OD018210 01A1.
This work was also supported in part by the Proteomics & Metabolomics Core Shared Resource of the Fred Hutch/University of Washington Cancer Consortium (P30 CA015704) as well as the National Institutes of Health (NIH) Grants F31CA2717405 (to M.G. Stewart) and T32GM141848 (to M.G. Stewart), American Cancer Society Postdoctoral Fellowship PF-21-188-01-CCB (to J.A. Zahm), 5 For the Fight (to M.P. Miller), Pew Biomedical Scholars (to M.P. Miller), and NIH grant R35GM142749 (to M.P. Miller). S.C. Harrison is an investigator at the Howard Hughes Medical Institute.
Author contributions: M.G. Stewart: conceptualization, data curation, formal analysis, funding acquisition, investigation, methodology, validation, visualization, and writing—original draft, review, and editing. J.S. Carrier: conceptualization and investigation. J.A. Zahm: investigation. S.C. Harrison: funding acquisition, resources, supervision, and writing—review and editing. M.P. Miller: conceptualization, funding acquisition, methodology, project administration, resources, supervision, validation, visualization, and writing—original draft, review, and editing.