


Cytoplasmic dynein-1 (dynein) is a microtubule-associated, minus end–directed motor that traffics hundreds of different cargos. Dynein must discriminate between cargos and traffic them at the appropriate time from the correct cellular region. How dynein’s trafficking activity is regulated in time or cellular space remains poorly understood. Here, we identify CCSer2 as the first known protein to gate dynein activity in the spatial dimension. CCSer2 promotes the migration of developing zebrafish primordium cells, macrophages, and cultured human cells by facilitating the trafficking of cargos that are acted on by peripherally localized dynein. Our data suggest that CCSer2 disfavors the interaction between dynein and its regulator Ndel1 at the cell edge, resulting in localized dynein activation. These findings support a model where the spatial specificity of dynein is achieved by the localization of proteins that trigger Ndel1’s release from dynein. We propose that CCSer2 defines a broader class of proteins that activate dynein in distinct microenvironments via regulating Ndel1–dynein interaction.
Introduction
Microtubules, microtubule-associated proteins, and microtubule motors form a complex system of proteins that extend throughout the cytoplasm of most eukaryotic cells, facilitating molecular exchange between distinct cellular regions (Bodakuntla et al., 2019). The activities of motor proteins must be dynamically controlled for the system to support intracellular trafficking. For example, to move cargo, motors must receive and integrate signals that relay identity, spatial, and temporal information. In other words, motor machinery must decipher whether the right cargo is being moved from the correct region of the cell at the appropriate time.
There are two classes of microtubule-associated motors: kinesins and cytoplasmic dynein-1 (dynein, hereafter) (Hirokawa et al., 2009; Cianfrocco et al., 2015). To properly traffic cargo, both classes of motors must robustly and accurately respond to spatiotemporal cues. There are over 20 different kinesins that traffic cargo during interphase (Hirokawa et al., 2009; Miki et al., 2005). These kinesins have diverged and specialized to meet the trafficking requirements of different kinds of cargo, which means that kinesins’ ability to interpret spatiotemporal information about cargo is, in part, determined at the protein sequence level (Hirokawa et al., 2009). In contrast, dynein—as the primary minus end–directed microtubule motor—traffics every cargo that moves in the retrograde direction (Cianfrocco et al., 2015; Reck-Peterson et al., 2018). Therefore, dynein’s ability to traffic cargo with specificity is not encoded within dynein’s protein sequence and is instead conferred by interaction with dynein regulators.
We have a good understanding of how cargo-identity information is conveyed to dynein. To transport cargo, dynein must bind to the multi-subunit complex, dynactin, as well as a protein called an activating adaptor (adaptor, hereafter) (Reck-Peterson et al., 2018). Together, dynein–dynactin–adaptor complexes form an active transport complex (Fig. S1 A) (Schlager et al., 2014; McKenney et al., 2014). Formation of the active transport complex converts dynein from an autoinhibited conformation, called Phi, to an active conformation that can move processively on the microtubule (Zhang et al., 2017; Torisawa et al., 2014). There are ∼20 confirmed or putative adaptors, which associate with distinct cargo types and thus convey cargo-identity information to dynein (Reck-Peterson et al., 2018). However, many adaptors localize in close or overlapping cellular regions and therefore do not convey spatial information to the dynein motor (Reck-Peterson et al., 2018). Finally, we know very little about how dynamic cellular events influence dynein’s association with cargo, so it is unclear how dynein activity is regulated temporally. As such, our understanding of dynein regulation is one-dimensional; we lack information about how dynein activity is gated in both space and time.
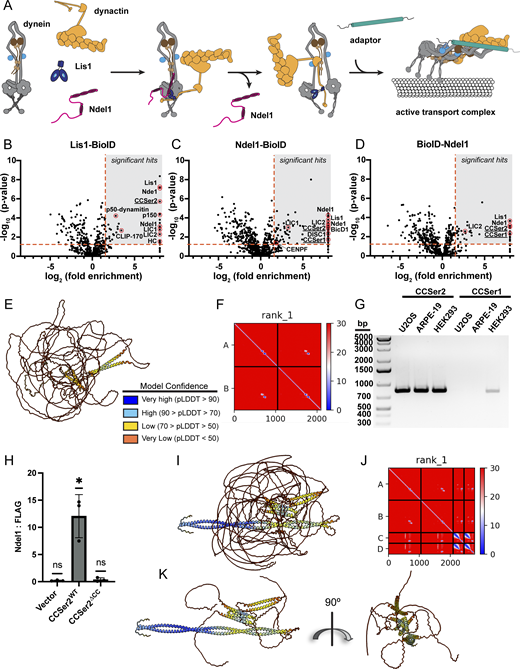
CCSer2 is a highly disordered protein identified in the Lis1 and Ndel1 interactomes through binding to Ndel1.(A) Schematic for how Lis1 and Ndel1 promote dynein activation. Ndel1 (pink) tethers Lis1 (blue) to dynein (mostly gray) in the autoinhibited Phi conformation. Here, Ndel1 is likely bound to dynein intermediate chain N terminus (dark brown) and Lis1 is bound to dynein motor domain. Because Lis1’s dimerization domain can bind dynactin p150 subunit, we show dynactin (yellow) also tethered to this complex. Ndel1 and dynactin p150 subunit compete for binding to dynein intermediate chain, so Ndel1 must unbind for dynein intermediate chain–p150 direct binding. Adaptor (teal) must also associate with dynein–dynactin to fully facilitate formation of the activated transport complex. (B–D) Volcano plots for Lis1-BioID (B), Ndel1-BioID (C), and BioID-Ndel1 (D). Enrichment over the BioID control versus significance between replicates is plotted. Significant hits used for interactome in (Fig. 1 A) are indicated by the gray box bounded by a P value of 0.05 and threefold enrichment over control (red dotted lines). Red circles denote protein hits that are known interaction partners, as well as CCSer2 and CCSer1. Hits on the far right of the x axis represent proteins that were not detected in the control. (E) AlphaFold prediction for two copies of CCSer2 colored by pLDDT as indicated. (F) Predicted alignment error for the AlphaFold model shown in E. (G) PCR products of CCSER2 and CCSER1 amplified from cDNA libraries generated from the cell types indicated, showing that CCSer2 is expressed to a higher extent and in more cell types than CCSer1. (H) Quantification of Ndel1 co-immunoprecipitation with GFP vector, CCSer2WT, or CCSer2ΔCC. n = 3 biological replicates. Error bars shown are the mean ± SD. Statistical analysis was performed with one-sample t and Wilcoxon’s tests. (I) AlphaFold prediction of CCSer2 and Ndel1 colored by pLDDT score as indicated in E. (J) Predicted alignment error for the AlphaFold model shown in I. (K) Model shown in I with disordered regions of CCSer2 removed for clarity. Source data are available for this figure: SourceData FS1.

CCSer2 is a highly disordered protein identified in the Lis1 and Ndel1 interactomes through binding to Ndel1.(A) Schematic for how Lis1 and Ndel1 promote dynein activation. Ndel1 (pink) tethers Lis1 (blue) to dynein (mostly gray) in the autoinhibited Phi conformation. Here, Ndel1 is likely bound to dynein intermediate chain N terminus (dark brown) and Lis1 is bound to dynein motor domain. Because Lis1’s dimerization domain can bind dynactin p150 subunit, we show dynactin (yellow) also tethered to this complex. Ndel1 and dynactin p150 subunit compete for binding to dynein intermediate chain, so Ndel1 must unbind for dynein intermediate chain–p150 direct binding. Adaptor (teal) must also associate with dynein–dynactin to fully facilitate formation of the activated transport complex. (B–D) Volcano plots for Lis1-BioID (B), Ndel1-BioID (C), and BioID-Ndel1 (D). Enrichment over the BioID control versus significance between replicates is plotted. Significant hits used for interactome in (Fig. 1 A) are indicated by the gray box bounded by a P value of 0.05 and threefold enrichment over control (red dotted lines). Red circles denote protein hits that are known interaction partners, as well as CCSer2 and CCSer1. Hits on the far right of the x axis represent proteins that were not detected in the control. (E) AlphaFold prediction for two copies of CCSer2 colored by pLDDT as indicated. (F) Predicted alignment error for the AlphaFold model shown in E. (G) PCR products of CCSER2 and CCSER1 amplified from cDNA libraries generated from the cell types indicated, showing that CCSer2 is expressed to a higher extent and in more cell types than CCSer1. (H) Quantification of Ndel1 co-immunoprecipitation with GFP vector, CCSer2WT, or CCSer2ΔCC. n = 3 biological replicates. Error bars shown are the mean ± SD. Statistical analysis was performed with one-sample t and Wilcoxon’s tests. (I) AlphaFold prediction of CCSer2 and Ndel1 colored by pLDDT score as indicated in E. (J) Predicted alignment error for the AlphaFold model shown in I. (K) Model shown in I with disordered regions of CCSer2 removed for clarity. Source data are available for this figure: SourceData FS1.
Together, dynein, dynactin, and adaptors represent the core dynein trafficking machinery. The proteins Lis1 and Ndel1 (and its paralog, Nde1) constitute a second sphere of regulatory factors that have two key functions (Fig. S1 A) (Garrott et al., 2022; Markus et al., 2020). First, Lis1 and Ndel1 support dynein localization to many cellular regions, including the microtubule plus-end, the nuclear envelope, and the kinetochore (Coquelle et al., 2002; Splinter et al., 2012; Sitaram et al., 2012; Stehman et al., 2007; Liang et al., 2007b; Wynne and Vallee, 2018; Raaijmakers et al., 2013). Importantly, Lis1 and Ndel1 promote dynein localization to multiple cellular microenvironments in a way that is likely independent of adaptor identity. Second, Lis1 and Ndel1 seem to work in tandem to promote dynein activation (Htet et al., 2020; Elshenawy et al., 2020; Gutierrez et al., 2017; Okada et al., 2023a, Preprint; Garrott et al., 2023; McKenney et al., 2011; Zhao et al., 2023a, Preprint; Qiu et al., 2019; Lam et al., 2010; Wang et al., 2013; Zyłkiewicz et al., 2011). They bind each other with high affinity, and the presence of Ndel1 increases Lis1–dynein association (Garrott et al., 2023; Wang et al., 2013; Yamada et al., 2008). Additionally, studies probing how dynein responds to Lis1 or Ndel1 depletion suggest that these proteins can complement each other. For example, some cargo trafficking defects or dynein mislocalization caused by either Lis1 or Ndel1 depletion can be rescued by the overexpression of the other protein (Lam et al., 2010; Shu et al., 2004; Moon et al., 2014; Wang and Zheng, 2011; Efimov and Morris, 2000; Efimov, 2003).
The molecular mechanism of how Lis1 and Ndel1 coordinate to regulate dynein has been harder to establish. However, a model is emerging that suggests that Ndel1 acts as a tether to link Lis1 to Phi-dynein (Fig. S1 A) (Garrott et al., 2022, 2023; Zyłkiewicz et al., 2011; Okada et al., 2023b; Zhao et al., 2023b). This complex can drive dynein–dynactin–adaptor association because Lis1 also binds dynactin (Singh et al., 2024). This model is supported by work in filamentous fungi that shows the requirement for Lis1 or Ndel1 (NudE in fungi) is lessened when mutations that disrupt dynein autoinhibition are introduced (Qiu et al., 2019). The dynein–Ndel1–Lis1 or dynein–Ndel1–Lis1–dynactin complex is likely transient (Yang et al., 2025, Preprint). For bona fide dynein activation to occur, Ndel1 must eventually unbind from dynein to allow dynactin to bind, as it is well established that Ndel1 and dynactin bind dynein intermediate chain competitively (McKenney et al., 2011; Nyarko et al., 2012). In support of this, preincubation of Ndel1 with dynein or high concentrations of Ndel1 inhibit dynein activation in vitro (Garrott et al., 2023; Zhao et al., 2023b). Whether or not Ndel1 can ever function as an inhibitor of dynein activation in cells likely depends on the relative abundance of Ndel1 and dynactin in different cellular regions.
To understand dynein function, we must identify additional factors that regulate dynein’s ability to traffic cargo with spatial or temporal specificity. Because Lis1 and Ndel1 modulate both dynein activity and localization in cellular space, we hypothesized that Lis1 and Ndel1 are likely nodes through which spatial information is transmitted to dynein and set out to identify and characterize the activity of Lis1 or Ndel1 binding partners. To do this, we used proximity-dependent biotinylation coupled with mass spectrometry (MS) to establish the interactome of Lis1 and Ndel1. We identified CCSer2, which we find binds to Ndel1 directly. We find that depletion of CCSer2 causes dramatic cell migration defects, both in developing zebrafish embryos and in cell culture. Unexpectedly, we find that CCSer2 function is not broadly acting but instead appears to promote dynein activation only at the cell periphery. The outcome of this is that CCSer2 depletion causes aberrant dynein-driven centrosome positioning and early endosome trafficking, which are both cargos that are operated on by dynein localized near the cell periphery. We also establish that CCSer2 functions at the molecular level to disfavor dynein–Ndel1 association. Because CCSer2 depletion leads to dynein activation defects, we reason that CCSer2 functions to drive dynein–Ndel1 unbinding exclusively at the cell periphery to enable localized activation of populations of dynein. Our work suggests that CCSer2 activity represents a novel regulatory gate that conveys information about cellular location, rather than cargo identity, to the dynein motor. These findings deepen our understanding of how dynein activity can be deployed locally to promote cargo trafficking specificity.
Results
CCSer2 interacts with Lis1 and Ndel1 by binding directly to Ndel1
To identify proteins that modulate dynein’s response to spatial cellular cues, we determined the interactome of Lis1 and Ndel1 using proximity-dependent biotinylation coupled with MS (Roux et al., 2013; Redwine et al., 2017). We fused the promiscuous biotin-ligase tag, BioID, to Lis1 or Ndel1 and generated stable HEK293 cell lines. For these experiments, we appended BioID to the β-propeller at the C terminus of Lis1 as this is the domain that Lis1 uses to interact with most of its known binding partners. Because Ndel1 is a long coiled coil and interacts with proteins using domains that are found throughout the protein, we generated two Ndel1 constructs: one with BioID on the N terminus and one with BioID on the C terminus (Bradshaw et al., 2013). After culturing cells in the presence of biotin for 16 h, we performed a streptavidin immunoprecipitation followed by MS to identify near neighbors of both proteins. Many known and well-characterized binding partners of Lis1 and Ndel1 were enriched at levels above the BioID control in each dataset, which gave us confidence that our screen could identify bona fide interactors of Lis1 and Ndel1 (Fig. 1 A, Fig. S1, B–D, and Data S1).

CCSer2 is in the interactome of Lis1 and Ndel1 via a direct binding interaction with Ndel1’s C-terminal coiled coil. (A) Significant and enriched hits shown as spheres and color-coded according to the dataset they were found in: Lis1-BioID (red), Ndel1-BioID (green), BioID-Ndel1 (blue), Lis1-BioID/BioID-Ndel1 (orange), Lis1-BioID/Ndel1-BioID (purple), BioID-Ndel1/Ndel1-BioID (teal), or all datasets (yellow). The identity of the hits found in all datasets is indicated and discussed in the text. Hits are considered enriched if they are ≥threefold over the control and have a P value <0.05. (B) GFP vector, CCSer2WT, or CCSer2ΔCC was expressed in and co-immunoprecipitated from U2OS cells with anti-FLAG resin. Membranes were probed with α-FLAG, α-DHC, α-Lis1, α-Ndel1, and α-GAPDH antibodies. (C) Domain schematics of CCSer2 (green) and Ndel1 (pink) constructs used. Interaction between the two proteins is shown with a colored line above the schematics. (D) AlphaFold prediction of CCSer2 and Ndel1 shown in A with most disordered regions of CCSer2 removed for clarity. (E) Binding curve between Ndel1 (circles) or NT-Ndel1 (triangles) and CCSer2. n = 3 for both samples. Error bars are the mean ± SD. DHC, dynein heavy chain. Source data are available for this figure: SourceData F1.
CCSer2 is in the interactome of Lis1 and Ndel1 via a direct binding interaction with Ndel1’s C-terminal coiled coil. (A) Significant and enriched hits shown as spheres and color-coded according to the dataset they were found in: Lis1-BioID (red), Ndel1-BioID (green), BioID-Ndel1 (blue), Lis1-BioID/BioID-Ndel1 (orange), Lis1-BioID/Ndel1-BioID (purple), BioID-Ndel1/Ndel1-BioID (teal), or all datasets (yellow). The identity of the hits found in all datasets is indicated and discussed in the text. Hits are considered enriched if they are ≥threefold over the control and have a P value <0.05. (B) GFP vector, CCSer2WT, or CCSer2ΔCC was expressed in and co-immunoprecipitated from U2OS cells with anti-FLAG resin. Membranes were probed with α-FLAG, α-DHC, α-Lis1, α-Ndel1, and α-GAPDH antibodies. (C) Domain schematics of CCSer2 (green) and Ndel1 (pink) constructs used. Interaction between the two proteins is shown with a colored line above the schematics. (D) AlphaFold prediction of CCSer2 and Ndel1 shown in A with most disordered regions of CCSer2 removed for clarity. (E) Binding curve between Ndel1 (circles) or NT-Ndel1 (triangles) and CCSer2. n = 3 for both samples. Error bars are the mean ± SD. DHC, dynein heavy chain. Source data are available for this figure: SourceData F1.
To narrow down the list of potential interactors, we examined hits that were enriched in all three datasets. In addition to Lis1 and Ndel1, there were four other proteins enriched in all datasets (Fig. 1 A). These hits include the Ndel1 paralog, Nde1, which can form a complex with Ndel1 and also binds Lis1 (Soares et al., 2012); dynein intermediate chain, which is an integral subunit of the dynein motor machinery; TCPD, which is a subunit of the TriC chaperone complex and may facilitate Lis1 β-propeller folding (Grantham, 2020); and CCSer2, which was a largely unstructured protein (Fig. S1, E and F). CCSer2 was a particularly strong hit with peptides found in all experimental replicates for each dataset, but not in the control (Data S1). We also identified the CCSer2 homolog, CCSer1, in both Ndel1 datasets (Fig. 1 A; and Fig. S1, C and D). We focused our attention on CCSer2 rather than CCSer1 because it was a robust hit in all datasets, expressed in all cultured cell lines we tested, and the mouse homolog, Gcap14, was shown to coprecipitate Ndel1 in neurons (Fig. S1 G) (Mun et al., 2023). CCSer1, in contrast, was undetectable in most cell culture lines and is generally expressed at a lower level in humans (Fig. S1 G) (Wang et al., 2015).
Next, we set out to map the interaction between CCSer2, Ndel1, and Lis1. First, we tested whether CCSer2 co-immunoprecipitated Ndel1, Lis1, or dynein in U2OS cells using an N-terminally sfGFP- and C-terminally FLAG-tagged construct of CCSer2 (CCSer2WT) (Fig. 1 B and Fig. S1 H). While CCSer2WT did coprecipitate Ndel1, we did not detect specific immunoprecipitation of Lis1 or dynein, suggesting that CCSer2 strongly interacts with Ndel1 (Fig. 1 B and Fig. S1 H). We next used AlphaFold to predict potential sites of interaction between Ndel1 or Lis1 and CCSer2 (Jumper et al., 2021; Mirdita et al., 2022). Consistent with the co-immunoprecipitation results, no high-confidence interactions were predicted to form between CCSer2 and Lis1. However, AlphaFold predicted a high-confidence interaction between CCSer2 and Ndel1 (Fig. 1, C and D; and Fig. S1, I–K). The putative interface is comprised of a four-helix bundle formed from amino acids 657–687 in CCSer2 and amino acids 246–278 in Ndel1 (Fig. 1, C and D; and Fig. S1 K). In both proteins, these regions are predicted to form coiled coils in the absence of any binding partners.
To test the validity of the CCSer2-Ndel1 four-helix bundle predicted by AlphaFold, we generated a CCSer2 construct missing the coiled coil that contains the potential Ndel1 binding site (CCSer2ΔCC) (Fig. 1 C). As predicted, CCSer2ΔCC no longer co-immunoprecipitated Ndel1 (Fig. 1 B and Fig. S1 H). Next, we recombinantly expressed and purified a minimal construct of CCSer2 that contains only the Ndel1-binding region (amino acids 650–850) fused to a HaloTag (CCSer2650–850) and tested binding to Ndel1 in vitro using a bead-based depletion assay (Fig. 1 C). We found that the Ndel1-CCSer2650–850 interaction was of high affinity, with a Kd of ∼14 nM (Fig. 1 E and Fig. S2 A). CCSer2650–850 did not interact with a truncation of Ndel1 (NT-Ndel1) that has the predicted CCSer2 binding region deleted, which confirms the specificity of the interaction (Fig. 1, C and E; and Fig. S2 B). Additionally, neither Lis1 nor dynein showed any appreciable binding to CCSer2650–850 (Fig. S2, C–E). Together, these findings are consistent with the AlphaFold prediction and suggest that CCSer2 binds directly to Ndel1’s C-terminal coiled coil. Further, these results suggest that CCSer2 is found within the Lis1 interactome likely due to Lis1-Ndel1 association.
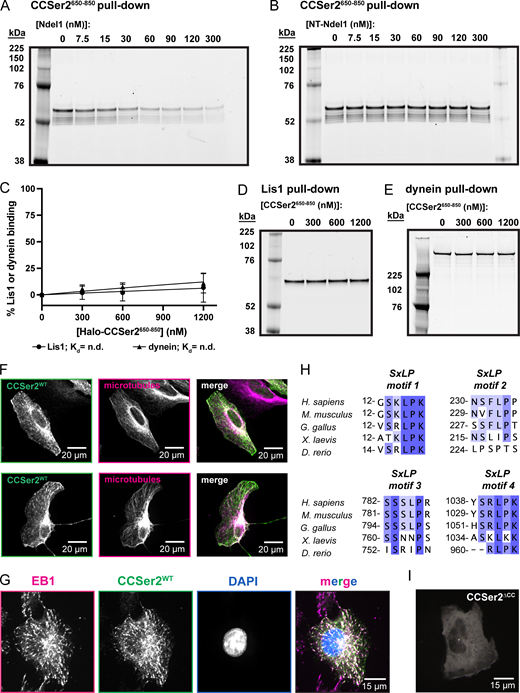
CCSer2 directly binds to the C-terminal coiled coil of Ndel1 and localizes to the cell periphery and microtubule plus-ends through four conserved SxLP motifs.(A and B) SDS-PAGE gel images of CCSer2650–850 depletion assay. 5 nM CCSer2650–850 (∼57.2 kDa) depletion by Ndel1 or NT-Ndel1. (C) Binding curve between Lis1 (circle) or dynein (triangle) and CCSer2650–850. n = 3 for both samples. Error bars are the mean ± SD. (D) SDS-PAGE gel image of Lis1 depletion assay. 5 nM Lis1 (∼66.4 kDA) depletion by Halo-CCSer2650–850. (E) SDS-PAGE gel image of dynein depletion assay. 1.67 nM dynein (∼551.7 kDa) depletion by Halo-CCSer2650–850. (F) Additional representative images of U2OS WT cells transfected with CCSer2WT and stained for microtubules as shown in Fig. 2 A. (G) Fluorescence microscopy image of fixed WT cells transfected with CCSer2WT and stained with α-GFP to visualize CCSer2WT (green), α-EB1 (magenta), and DAPI (blue). (H) Alignment of CCSer2 S-x-L-P motifs 1–4 with the species indicated. (I) Temporal hyperstack colored as in Fig. 2 C for WT cells transfected with CCSer2ΔCC. Source data are available for this figure: SourceData FS2.

CCSer2 directly binds to the C-terminal coiled coil of Ndel1 and localizes to the cell periphery and microtubule plus-ends through four conserved SxLP motifs.(A and B) SDS-PAGE gel images of CCSer2650–850 depletion assay. 5 nM CCSer2650–850 (∼57.2 kDa) depletion by Ndel1 or NT-Ndel1. (C) Binding curve between Lis1 (circle) or dynein (triangle) and CCSer2650–850. n = 3 for both samples. Error bars are the mean ± SD. (D) SDS-PAGE gel image of Lis1 depletion assay. 5 nM Lis1 (∼66.4 kDA) depletion by Halo-CCSer2650–850. (E) SDS-PAGE gel image of dynein depletion assay. 1.67 nM dynein (∼551.7 kDa) depletion by Halo-CCSer2650–850. (F) Additional representative images of U2OS WT cells transfected with CCSer2WT and stained for microtubules as shown in Fig. 2 A. (G) Fluorescence microscopy image of fixed WT cells transfected with CCSer2WT and stained with α-GFP to visualize CCSer2WT (green), α-EB1 (magenta), and DAPI (blue). (H) Alignment of CCSer2 S-x-L-P motifs 1–4 with the species indicated. (I) Temporal hyperstack colored as in Fig. 2 C for WT cells transfected with CCSer2ΔCC. Source data are available for this figure: SourceData FS2.
CCSer2 localizes to the microtubule plus-end and cell periphery
To explore the cellular function of CCSer2, we first determined the localization in human cells. In fixed samples, we observed strong colocalization with microtubules, often accompanied by notable enrichment in CCSer2 signal around the cell perimeter (Fig. 2, A and B; and Fig. S2 F). When imaged live, as was observed with the mouse homolog Gcap14, CCSer2WT displayed many dynamic, comet-like structures reminiscent of proteins that track microtubule plus-ends (+Tips) (Fig. 2 C; and Videos 1 and 2) (Mun et al., 2023). Consistent with microtubule plus-end localization, CCSer2WT puncta colocalized with the master plus-end regulator, EB1 (Fig. S2 G). CCSer2 contains four EB1-binding S-x-I/L-P motifs, where “x” corresponds to any amino acid (Fig. 2 D and Fig. S2 H) (Honnappa et al., 2009; Jiang et al., 2012). We found that mutation of all four motifs or just the two most conserved (CCSer2-SXNNALL and CCSer2-SXNN1,4, respectively) significantly reduced plus-end localization of exogenously expressed CCSer2, suggesting that CCSer2’s plus-end localization is EB1-dependent (Fig. 2, C–E). CCSer2ΔCC also showed a reduction in comet-like structures, suggesting that the coiled coil that contains the Ndel1 binding site also promotes plus-end localization (Fig. 1 C and Fig. S2 I).

CCSer2 localizes to the cell periphery and microtubule plus-ends. (A) Fluorescence microscopy images of U2OS cells expressing CCSer2WT, stained with α-GFP and α-tubulin antibodies. (B) Ratio of the intensity around the cell perimeter to the cytoplasmic intensity for CCSer2WT and microtubules. n = 50 cells analyzed. The Wilcoxon t test was performed, and error bars are the mean with standard deviation. (C) Temporal hyperstacks colored as indicated for overexpressed CCSer2WT, CCSer2-SxNNALL, and CCSer2-SxNN1,4. (D) Domain schematics of CCSer2 showing the relative position of S-x-L-P motifs and associated mutants used. (E) Number of plus-end comet structures in cells expressing CCSer2WT, CCSer2-SxNNALL, or CCSer2-SxNN1,4. n = 26, 21, or 19 cells analyzed for CCSer2WT, CCSer2-SxNNALL, or CCSer2-SxNN1,4, respectively. Error bars are the median ± interquartile range. Statistical analysis was performed with a Kruskal–Wallis test with Dunn’s multiple comparisons.
CCSer2 localizes to the cell periphery and microtubule plus-ends. (A) Fluorescence microscopy images of U2OS cells expressing CCSer2WT, stained with α-GFP and α-tubulin antibodies. (B) Ratio of the intensity around the cell perimeter to the cytoplasmic intensity for CCSer2WT and microtubules. n = 50 cells analyzed. The Wilcoxon t test was performed, and error bars are the mean with standard deviation. (C) Temporal hyperstacks colored as indicated for overexpressed CCSer2WT, CCSer2-SxNNALL, and CCSer2-SxNN1,4. (D) Domain schematics of CCSer2 showing the relative position of S-x-L-P motifs and associated mutants used. (E) Number of plus-end comet structures in cells expressing CCSer2WT, CCSer2-SxNNALL, or CCSer2-SxNN1,4. n = 26, 21, or 19 cells analyzed for CCSer2WT, CCSer2-SxNNALL, or CCSer2-SxNN1,4, respectively. Error bars are the median ± interquartile range. Statistical analysis was performed with a Kruskal–Wallis test with Dunn’s multiple comparisons.
Related toFig. 2 . Representative movie of U2OS WT cells expressing GFP-CCSer2WT. Cells were imaged live, 48 h after transfection, with a 60X objective at one frame per second for 1 min.
Related toFig. 2 . Representative movie of U2OS WT cells expressing GFP-CCSer2WT. Cells were imaged live, 48 h after transfection, with a 60X objective at one frame per second for 1 min.
Related toFig. 2 . Additional representative movie of U2OS WT cells expressing GFP-CCSer2WT. Cells were imaged live, 48 h after transfection, with a 60X objective at one frame per second for 1 min.
Related toFig. 2 . Additional representative movie of U2OS WT cells expressing GFP-CCSer2WT. Cells were imaged live, 48 h after transfection, with a 60X objective at one frame per second for 1 min.
CCSer2 depletion causes cell migration defects in two models of migration in zebrafish
To investigate the role of CCSer2 in vivo, we analyzed CCSer2 expression and function in zebrafish. Zebrafish have two ccser2 genes, ccser2a and ccser2b. First, we characterized the expression of ccser2a and ccser2b at 30 h after fertilization (30 hpf) and observed that they both are ubiquitously expressed (Fig. S3 A) and highly maternally deposited in developing zygotes (Fig. S3 B). To probe CCSer2 function, we created a ccser2a;ccser2b double mutant using CRISPR-Cas9 mutagenesis to disrupt both genes. In ccser2a;ccser2b double heterozygous crosses, double mutant offspring survived at sub-Mendelian ratios, consistent with the loss of the Gcap14 in mouse litters (Fig. S3 C) (Mun et al., 2023). However, surviving double mutant animals were grossly normal. This bimodal effect, where the double mutant is lethal in most embryos but escapers are healthy, is likely due to variable genetic compensation by ccser2’s paralog, ccser1. Gene paralogs, such as ccser1, are often upregulated to compensate for genetic deletion in stable mutant lines (El-Brolosy et al., 2019).
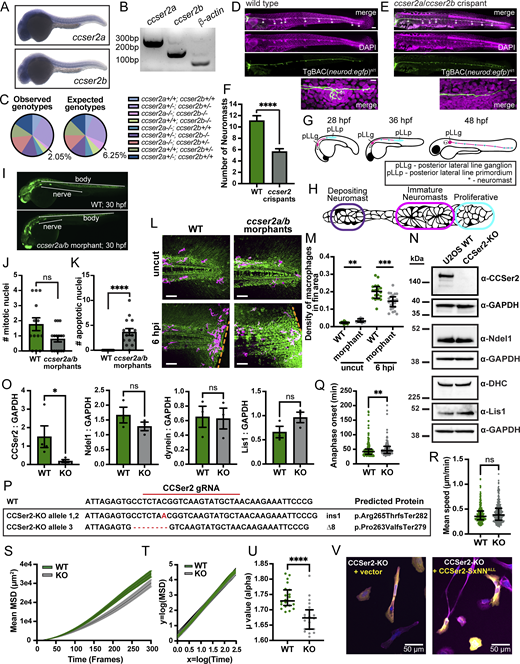
CCSer2 depletion results in migration defects in two zebrafish migration models and human cell culture.(A) In situ hybridization showing ccser2a and ccser2b expression at 30 hpf in the zebrafish embryo. (B) Maternal deposition of ccser2a and ccser2b mRNA compared with control β-actin mRNA, which is known to be maternally deposited at high levels. (C) Observed and expected genotypes for ccser2a;ccser2b double heterozygous crosses. (D and E) DAPI (magenta) and neurons (green) of fixed WT 4 dpf zebrafish larva (D) and ccser2a/b crispant (E). High magnification image of pLL nerve end shown below for each. Scale bar = 100 μm in whole trunk image; 10 μm in high magnification image below. (F) Number of pLL neuromasts in WT or ccser2 crispants, n = 8 and 25 zebrafish, respectively. Error bars are the mean ± SEM (chi-square; P < 0.001). (G and H) Schematic showing pLL development (G) and organization of the pLL primordium (H). (I) Measurement axis used for quantification of data in Fig. 3 E. (J) Number of mitotic nuclei for WT of ccser2a/b morphants, n = 13 and 15 embryos, respectively. Error bars are the mean ± SEM (chi-square; P = 0.2514). (K) Number of cells undergoing apoptosis for WT and ccser2a/b morphants, n = 13 and 15 embryos, respectively. Error bars are the mean ± SEM (chi-square; P < 0.005). (L) Fixed fluorescence microscopy images of the fin region of uninjured (uncut) or 6 hpi in WT and ccser2a/b morphants. Injury is denoted by the orange dashed line. DIC imaging is shown in green, and macrophages are labeled in magenta. Scale bar is 50 µm. (M) Quantification of macrophage accumulation at the fin injury site compared with uncut fins. n = 12 for uncut WT and ccser2a/b morphants; n = 18 and 23 for WT 6 hpi and ccser2a/b morphants 6 hpi, respectively. Error bars represent the median and 95% CI, and statistics were determined with Brown–Forsythe and Welch ANOVA tests with Dunnett’s T3 multiple comparisons. (N) Representative western blot using whole-cell lysate from WT and CCSer2-KO cell lines. Membranes were probed with α-CCSer2, α-Ndel1, α-DHC, α-Lis1, and α-GAPDH as a loading control. (O) Quantification of western blots in N reporting the ratio of CCSer2, Ndel1, dynein, and Lis1 to GAPDH. n = 4 biological replicates for CCSer2; n = 3 biological replicates for Ndel1, dynein, and Lis1. Error bars are the mean ± SEM, and statistics were determined with Mann–Whitney tests. (P) Results of indel analysis of the CCSer2-KO. Two frameshift (fs) mutations identified in the CCSer2 gene result in early stop codons and truncation of the protein (Ter282 and Ter279). The single base pair insertion occurred in 80% of the alleles sequenced (24/30 alleles), and the 8 base pair deletion mutation occurred in 20% of the alleles sequenced (6/30 alleles). No WT alleles were found in the CCSer2-KO. (Q) Time to anaphase of dividing WT and CCSer2-KO cells is quantified. n = 170 and 102 mitotic cells analyzed for WT and CCSer2-KOs, respectively. Error bars are the median ± interquartile range (Mann–Whitney test; P = 0.0047). (R) Mean speed of individually migrating WT or CCSer2-KO cells on fibronectin over 24 h. SIR-DNA–labeled nuclei were tracked using the TrackMate plugin in FIJI to obtain cell paths. n = 267 and 301 cells tracked for WT and CCSer2-KO cell, respectively. Error bars are the median ± interquartile range. Statistical analysis was determined with a Mann–Whitney test. (S) Plot of the MSD values over the first 300 frames of live wound-healing assay (Fig. 3, L and M). n = 20 fields of view per cell type, across two biological replicates. Error bars are the mean ± SEM. (T) MSD data in S are transformed into a log–log plot of log (MSD) over log (Time(frames)). n = 20 fields of view per cell type, across two biological replicates. Error bars are the mean ± SEM. (U) Linear regressions were applied to the log–log-transformed data in T to extract the µ value (or slope), where MSD(t) ∼ tµ. Error bars are the median ± interquartile range. Statistical significance was determined with a Mann–Whitney test. n = 20 fields of view per cell type, across two biological replicates. (V) Fluorescence microscopy images of fixed CCSer2-KOs transfected with a GFP vector or CCSer2-SxNNALL quantified in Fig. 3 H. Cells were stained with phalloidin to visualize actin (pink), α-GFP to visualize vector and CCSer2-SXNNALL (yellow), and DAPI to visualize nuclei (blue). DHC, dynein heavy chain; hpi, hours after injury. Source data are available for this figure: SourceData FS3.

CCSer2 depletion results in migration defects in two zebrafish migration models and human cell culture.(A) In situ hybridization showing ccser2a and ccser2b expression at 30 hpf in the zebrafish embryo. (B) Maternal deposition of ccser2a and ccser2b mRNA compared with control β-actin mRNA, which is known to be maternally deposited at high levels. (C) Observed and expected genotypes for ccser2a;ccser2b double heterozygous crosses. (D and E) DAPI (magenta) and neurons (green) of fixed WT 4 dpf zebrafish larva (D) and ccser2a/b crispant (E). High magnification image of pLL nerve end shown below for each. Scale bar = 100 μm in whole trunk image; 10 μm in high magnification image below. (F) Number of pLL neuromasts in WT or ccser2 crispants, n = 8 and 25 zebrafish, respectively. Error bars are the mean ± SEM (chi-square; P < 0.001). (G and H) Schematic showing pLL development (G) and organization of the pLL primordium (H). (I) Measurement axis used for quantification of data in Fig. 3 E. (J) Number of mitotic nuclei for WT of ccser2a/b morphants, n = 13 and 15 embryos, respectively. Error bars are the mean ± SEM (chi-square; P = 0.2514). (K) Number of cells undergoing apoptosis for WT and ccser2a/b morphants, n = 13 and 15 embryos, respectively. Error bars are the mean ± SEM (chi-square; P < 0.005). (L) Fixed fluorescence microscopy images of the fin region of uninjured (uncut) or 6 hpi in WT and ccser2a/b morphants. Injury is denoted by the orange dashed line. DIC imaging is shown in green, and macrophages are labeled in magenta. Scale bar is 50 µm. (M) Quantification of macrophage accumulation at the fin injury site compared with uncut fins. n = 12 for uncut WT and ccser2a/b morphants; n = 18 and 23 for WT 6 hpi and ccser2a/b morphants 6 hpi, respectively. Error bars represent the median and 95% CI, and statistics were determined with Brown–Forsythe and Welch ANOVA tests with Dunnett’s T3 multiple comparisons. (N) Representative western blot using whole-cell lysate from WT and CCSer2-KO cell lines. Membranes were probed with α-CCSer2, α-Ndel1, α-DHC, α-Lis1, and α-GAPDH as a loading control. (O) Quantification of western blots in N reporting the ratio of CCSer2, Ndel1, dynein, and Lis1 to GAPDH. n = 4 biological replicates for CCSer2; n = 3 biological replicates for Ndel1, dynein, and Lis1. Error bars are the mean ± SEM, and statistics were determined with Mann–Whitney tests. (P) Results of indel analysis of the CCSer2-KO. Two frameshift (fs) mutations identified in the CCSer2 gene result in early stop codons and truncation of the protein (Ter282 and Ter279). The single base pair insertion occurred in 80% of the alleles sequenced (24/30 alleles), and the 8 base pair deletion mutation occurred in 20% of the alleles sequenced (6/30 alleles). No WT alleles were found in the CCSer2-KO. (Q) Time to anaphase of dividing WT and CCSer2-KO cells is quantified. n = 170 and 102 mitotic cells analyzed for WT and CCSer2-KOs, respectively. Error bars are the median ± interquartile range (Mann–Whitney test; P = 0.0047). (R) Mean speed of individually migrating WT or CCSer2-KO cells on fibronectin over 24 h. SIR-DNA–labeled nuclei were tracked using the TrackMate plugin in FIJI to obtain cell paths. n = 267 and 301 cells tracked for WT and CCSer2-KO cell, respectively. Error bars are the median ± interquartile range. Statistical analysis was determined with a Mann–Whitney test. (S) Plot of the MSD values over the first 300 frames of live wound-healing assay (Fig. 3, L and M). n = 20 fields of view per cell type, across two biological replicates. Error bars are the mean ± SEM. (T) MSD data in S are transformed into a log–log plot of log (MSD) over log (Time(frames)). n = 20 fields of view per cell type, across two biological replicates. Error bars are the mean ± SEM. (U) Linear regressions were applied to the log–log-transformed data in T to extract the µ value (or slope), where MSD(t) ∼ tµ. Error bars are the median ± interquartile range. Statistical significance was determined with a Mann–Whitney test. n = 20 fields of view per cell type, across two biological replicates. (V) Fluorescence microscopy images of fixed CCSer2-KOs transfected with a GFP vector or CCSer2-SxNNALL quantified in Fig. 3 H. Cells were stained with phalloidin to visualize actin (pink), α-GFP to visualize vector and CCSer2-SXNNALL (yellow), and DAPI to visualize nuclei (blue). DHC, dynein heavy chain; hpi, hours after injury. Source data are available for this figure: SourceData FS3.
To avoid the influence of genetic compensation, we used two approaches to silence CCSer2 in zebrafish: (1) analysis of G0 animals injected with Cas9 protein and guide RNAs at the one-cell stage (crispants) (Shah et al., 2015); and (2) morpholino-mediated CCSer2 knockdown. First, we silenced both ccser2 genes in crispants, raised them to 4 days after fertilization (dpf), and assessed phenotypes. Indeed, we observed that 4 dpf ccser2a;ccser2b crispants had overt defects in the posterior lateral line (pLL) system. The zebrafish pLL is a mechanosensory system composed of sensory neurons and the mechanosensory organs they innervate, called neuromasts. Axons in the pLL of ccser2a;ccser2b crispants were significantly truncated, and fewer sensory organs were formed compared with uninjected siblings (Fig. S3, D–F). To confirm this phenotype, we attenuated CCSer2a and CCSer2b protein levels with morpholino antisense oligonucleotides targeting the start codon of ccser2a and ccser2b mRNA. Because morpholinos sterically inhibit protein translation, they are another suitable approach to explore functions of genes that may have compensatory paralogs. ccser2a;ccser2b morphants displayed defects in pLL structure that were identical to ccser2a;ccser2b crispants (Fig. 3, A–C). Together, these data demonstrate that loss of CCSer2 in zebrafish causes a specific defect in the formation of the pLL.

CCSer2 regulates cell migration. (A) Fluorescence microscopy image of fixed 4 dpf WT and ccser2a/b zebrafish morphants stained for DAPI (magenta) and neurons (green). Arrowheads indicate the end of the pLL, and asterisks mark neuromasts. Three individual 10X images were taken with 10% overlap and projected using standard deviation z-projection. Images were then stitched together using tissue landmarks. (B) Number of neuromasts in WT and ccser2a/b morphants as shown in A, n = 24 and 32 zebrafish, respectively. Error bars are the mean ± SEM (chi-square; P < 0.001). (C) Percentage of WT of ccser2a/b morphants with truncated lateral lines, as shown in A, n = 24 and 32 zebrafish, respectively (chi-square; P < 0.0001). (D) DAPI (magenta) and neurons (green) in the single plane image of the pLL primordium at 30 hpf for WT embryos or ccser2a/b morphants. Arrows indicate apoptotic nuclei. The cropped primordium area was determined by tissue elevation and placed on a black background for visualization. (E) pLL length at 30 hpf for WT or ccser2a/b morphants, n = 21 and 23 embryos, respectively. Error bars are the mean ± SEM (Mann–Whitney test; P < 0.0001). (F) pLLp area for WT or ccser2a/b morphants, n = 13 and 14 embryos, respectively. Error bars shown are the mean ± SEM (Mann–Whitney test; P < 0.0001). Scale bar = 100 mm in A; 10 mm in D. (G) Fluorescence microscopy images of fixed U2OS WT, CCSer2-KO, and CCSer2-KO with exogenous expression of CCSer2WT or CCSer2∆CC, stained with phalloidin to visualize actin (pink), α-GFP to visualize CCSer2WT and CCSer2∆CC (yellow), and DAPI to visualize nuclei (blue). (H) Average circularity of cells in a field of view for WT and CCSer2-KO cells (left of line). n = 73 fields of view analyzed across three biological replicates for WT and CCSer2-KO cells. Statistical analysis was performed with a Mann–Whitney test. Average circularity of CCSer2-KO cells transfected with vector, CCSer2WT, CCSer2∆CC, or CCSer2-SxNNALL (right of line). n = 40 fields of view analyzed across three biological replicates for CCSer2-KO expressing vector, CCSer2WT, CCSer2∆CC, or CCSer2-SxNNALL. Significance was determined with a Kruskal–Wallis test with Dunn’s multiple comparisons. All error bars are the median ± interquartile range. (I) Maximum length of each projection (protrusion that is thinner than 10 µm and lasts for at least 18 min) formed in WT and CCSer2-KO cells over a period of 24 h. n = 64 and 127 for WT and CCSer2-KO cells, respectively. (J) Percentage of WT or CCSer2-KO cells that formed projections within the field of view. n = 13 fields of view analyzed for both WT and CCSer2-KO cells across two biological replicates. (K) Speed of collective wound closure for WT and CCSer2-KO cells. n = 20 and 23 fields of view, respectively, across three biological replicates. (L) Directionality ratio (net displacement/total distance) of individual tracks of WT or CCSer2-KO cells migrating during a wound-healing assay. SIR-DNA–labeled nuclei were used as a fiducial for tracking. n = 20 fields of view analyzed for both WT and CCSer2-KOs across two biological replicates with two technical replicates (P = 0.012). Error bars are the median ± interquartile range for (I–L). Statistical analysis was performed with a Mann–Whitney test for (I–L). (M) Representative migratory tracks of WT and CCSer2-KO nuclei as cells migrate to fill a wound at the top of the image. Each color designates an individual cell trajectory. pLLp, pLL primordium.
CCSer2 regulates cell migration. (A) Fluorescence microscopy image of fixed 4 dpf WT and ccser2a/b zebrafish morphants stained for DAPI (magenta) and neurons (green). Arrowheads indicate the end of the pLL, and asterisks mark neuromasts. Three individual 10X images were taken with 10% overlap and projected using standard deviation z-projection. Images were then stitched together using tissue landmarks. (B) Number of neuromasts in WT and ccser2a/b morphants as shown in A, n = 24 and 32 zebrafish, respectively. Error bars are the mean ± SEM (chi-square; P < 0.001). (C) Percentage of WT of ccser2a/b morphants with truncated lateral lines, as shown in A, n = 24 and 32 zebrafish, respectively (chi-square; P < 0.0001). (D) DAPI (magenta) and neurons (green) in the single plane image of the pLL primordium at 30 hpf for WT embryos or ccser2a/b morphants. Arrows indicate apoptotic nuclei. The cropped primordium area was determined by tissue elevation and placed on a black background for visualization. (E) pLL length at 30 hpf for WT or ccser2a/b morphants, n = 21 and 23 embryos, respectively. Error bars are the mean ± SEM (Mann–Whitney test; P < 0.0001). (F) pLLp area for WT or ccser2a/b morphants, n = 13 and 14 embryos, respectively. Error bars shown are the mean ± SEM (Mann–Whitney test; P < 0.0001). Scale bar = 100 mm in A; 10 mm in D. (G) Fluorescence microscopy images of fixed U2OS WT, CCSer2-KO, and CCSer2-KO with exogenous expression of CCSer2WT or CCSer2∆CC, stained with phalloidin to visualize actin (pink), α-GFP to visualize CCSer2WT and CCSer2∆CC (yellow), and DAPI to visualize nuclei (blue). (H) Average circularity of cells in a field of view for WT and CCSer2-KO cells (left of line). n = 73 fields of view analyzed across three biological replicates for WT and CCSer2-KO cells. Statistical analysis was performed with a Mann–Whitney test. Average circularity of CCSer2-KO cells transfected with vector, CCSer2WT, CCSer2∆CC, or CCSer2-SxNNALL (right of line). n = 40 fields of view analyzed across three biological replicates for CCSer2-KO expressing vector, CCSer2WT, CCSer2∆CC, or CCSer2-SxNNALL. Significance was determined with a Kruskal–Wallis test with Dunn’s multiple comparisons. All error bars are the median ± interquartile range. (I) Maximum length of each projection (protrusion that is thinner than 10 µm and lasts for at least 18 min) formed in WT and CCSer2-KO cells over a period of 24 h. n = 64 and 127 for WT and CCSer2-KO cells, respectively. (J) Percentage of WT or CCSer2-KO cells that formed projections within the field of view. n = 13 fields of view analyzed for both WT and CCSer2-KO cells across two biological replicates. (K) Speed of collective wound closure for WT and CCSer2-KO cells. n = 20 and 23 fields of view, respectively, across three biological replicates. (L) Directionality ratio (net displacement/total distance) of individual tracks of WT or CCSer2-KO cells migrating during a wound-healing assay. SIR-DNA–labeled nuclei were used as a fiducial for tracking. n = 20 fields of view analyzed for both WT and CCSer2-KOs across two biological replicates with two technical replicates (P = 0.012). Error bars are the median ± interquartile range for (I–L). Statistical analysis was performed with a Mann–Whitney test for (I–L). (M) Representative migratory tracks of WT and CCSer2-KO nuclei as cells migrate to fill a wound at the top of the image. Each color designates an individual cell trajectory. pLLp, pLL primordium.
The pLL develops early, between 20 and 48 hpf, through the migration of the pLL primordium (Fig. S3, G and H). The primordium undergoes repetitive rounds of cell division in the leading region followed by organ patterning and deposition of neuromasts from the trailing region as it migrates from the embryonic head to the tail. As the primordium migrates, it tows the growth cones of the pLL axons (Fig. S3, G and H). We hypothesized that failed pLL development resulted from defects in pLL primordium migration upon CCSer2 knockdown. To test this, we determined the impact of CCSer2 loss of function on pLL primordium migration in ccser2a;ccser2b morphants at 30 hpf, when the primordium should have migrated ∼50% of the way through the trunk. ccser2a;ccser2b morphants displayed a significant reduction in pLL primordium migration, as indicated by shorter pLL nerves (Fig. 3, D and E; and Fig. S3 I). In addition, pLL primordium area and cell proliferation were reduced and more apoptotic cells were observed compared with wild-type (WT) controls (Fig. 3, D and F; and Fig. S3, J and K). Together, these data implicate CCSer2 in collective migration in vivo.
The pLL primordium migrates as a collective group of cells. To determine whether CCSer2 also regulates migration of individual cells in zebrafish, we asked if ccser2a;ccser2b morphants displayed defects in macrophage migration in response to a local injury (Barros-Becker et al., 2017; Miskolci et al., 2019). To analyze macrophage motility, we transected the caudal fin of 3 dpf larvae and monitored macrophage accumulation at the transection site 6 h after injury. While the ccser2a;ccser2b morphants had slightly more macrophages before injury, we see a reduction in the density of macrophages at the injury site in ccser2a;ccser2b morphants after injury, which is consistent with a cell migration defect (Fig. S3, L and M). Consistent with these results, mouse Gcap14 depletion impairs neuronal progenitor migration during neurodevelopment (Mun et al., 2023). Collectively, these results suggest that CCSer2 is a regulator of collective and individual cell migration.
CCSer2 deletion causes a reduction in directional persistence during migration
To determine the cellular defect that gave rise to failed migration in vivo, we used CRISPR-Cas9 to delete CCSer2 from U2OS cells (CCSer2-KO) (Fig. S3, N–P). CCSer2-KOs showed moderately slower growth compared with control cells, which is likely because of a mild delay in anaphase onset (Fig. S3 Q). However, the most noticeable phenotype was that CCSer2-KO cells had a striking, hyper-elongated cell shape, resulting in a significant reduction in circularity as compared to control cells (Fig. 3, G and H).
To understand the basis for the change in cell shape, we imaged WT control and CCSer2-KO cells live for 24 h. For control cells, we observed mesenchymal-style migration, with a large flat lamellipodium at the leading edge and a short, retracting tail at the back of the cell (Videos 3 and 4). CCSer2-KO cells, in contrast, displayed highly aberrant migratory behavior, which is consistent with the migratory defect observed in zebrafish (Videos 5, 6, and 7). The KO cells did not appear to form lamellipodia and instead generated long projections that routinely exceeded 100 µm in length and were almost never observed in control cells (Fig. 3, I and J). The projections were often dynamic and seemed to actively extend away from the cell body or failed to retract as the cell changed direction. The propensity for the CCSer2-KO to form projections explained the elongated cell morphology we observed in the fixed samples, as we could directly observe the cells elongate as they failed to retract the projections during migration (white arrow, Video 7). We also observed that the projections would sometimes snap back rapidly, resulting in a cell that appeared rounder and more akin to control cell shapes (Video 7). The aberrant morphology did not affect migration rates as the KO cells migrated at the same speed as control cells (Fig. S3 R).
Related toFig. 3 . Representative movie of U2OS WT cells plated on fibronectin and imaged in DIC at 20X with a frame rate of one frame every 3 min.
Related toFig. 3 . Representative movie of U2OS WT cells plated on fibronectin and imaged in DIC at 20X with a frame rate of one frame every 3 min.
Related toFig. 3 . Additional representative movie of U2OS WT cells plated on fibronectin and imaged in DIC at 20X with a frame rate of one frame every 3 min. Arrows designate lamellipodia of individual migrating cells.
Related toFig. 3 . Additional representative movie of U2OS WT cells plated on fibronectin and imaged in DIC at 20X with a frame rate of one frame every 3 min. Arrows designate lamellipodia of individual migrating cells.
Related toFig. 3 . Representative movie of U2OS CCSer2-KO cells plated on fibronectin and imaged at 20X with a frame rate of one frame every 3 min.
Related toFig. 3 . Representative movie of U2OS CCSer2-KO cells plated on fibronectin and imaged at 20X with a frame rate of one frame every 3 min.
Related toFig. 3 . Additional representative movie of U2OS CCSer2-KO cells plated on fibronectin and imaged at 20X with a frame rate of one frame every 3 min.
Related toFig. 3 . Additional representative movie of U2OS CCSer2-KO cells plated on fibronectin and imaged at 20X with a frame rate of one frame every 3 min.
Related toFig. 3,. Additional representative movie of U2OS CCSer2-KO cells plated on fibronectin and imaged at 20X with a frame rate of one frame every 3 min. The arrow in Video 7 depicts a growing projection getting pinched.
We also observed that CCSer2-KO cells seemed to change direction more often when migrating, suggesting a decrease in directional persistence. To probe directional migration, we utilized a live wound-closure assay and found that CCSer2-KO cells had reduced directional persistence shown by a lower directionality ratio and mean squared displacement over time (MSD(t)), resulting in slower speed of wound closure (Fig. 3, K–M; Fig. S3, S–U; and Videos 8 and 9). Together, these results suggest that CCSer2 deletion results in aberrant cell morphology during migration and causes a decrease in directional persistence.
Related toFig. 3 . Representative movie of U2OS WT, plated on fibronectin around 2-well silicone inserts. Nuclei labeled with SiR-DNA dye. 10X imaging began approximately an hour after removal of the silicone insert with a frame rate of one frame every 3 min.
Related toFig. 3 . Representative movie of U2OS WT, plated on fibronectin around 2-well silicone inserts. Nuclei labeled with SiR-DNA dye. 10X imaging began approximately an hour after removal of the silicone insert with a frame rate of one frame every 3 min.
Related toFig. 3 . Representative movie of CCSer2-KO cells, plated on fibronectin around 2-well silicone inserts. Nuclei labeled with SiR-DNA dye. 10X imaging began approximately an hour after removal of the silicone insert with a frame rate of one frame every 3 min.
Related toFig. 3 . Representative movie of CCSer2-KO cells, plated on fibronectin around 2-well silicone inserts. Nuclei labeled with SiR-DNA dye. 10X imaging began approximately an hour after removal of the silicone insert with a frame rate of one frame every 3 min.
To verify that CCSer2 deletion was the cause of the observed migration defects, we carried out rescue experiments and measured cell shape in fixed samples as a proxy for the migration defects we observed live. Indeed, the exogenous expression of CCSer2WT but not vector alone rescued the elongation defect in CCSer2-KO cells and resulted in circularity comparable to control (Fig. 3, G and H; and Fig. S3 V). We next transfected CCSer2-KOs with CCSer2ΔCC or CCSer2-SxNNALL to determine whether CCSer2’s ability to bind Ndel1 or EB1 is important for cell migration. CCSer2ΔCC was unable to rescue the cell shape defect caused by CCSer2 deletion, suggesting that the coiled coil containing the Ndel1 interaction site is important for CCSer2 function during migration (Fig. 3, G and H). In contrast, CCSer2-SxNNALL was able to partially rescue the elongated shape in CCSer2-KO cells (Fig. 3 H and Fig. S3 V). This result indicates that impairment of CCSer2’s plus-end localization does not severely abrogate its function and suggests that CCSer2 does not operate from the microtubule plus-end to support cell migration.
CCSer2 knockout causes a defect in microtubule polarization and integrin trafficking by decreasing dynein localization at the leading edge
Since we found that CCSer2 binds Ndel1 directly and CCSer2 depletion causes cell migration defects, we hypothesized that CCSer2 may function to regulate dynein activity during migration. Dynein has two main roles during cell migration. First, in many cell types, dynein helps to establish the nucleus–centrosome axis (Luxton and Gundersen, 2011). Here, populations of dynein and dynactin are recruited to cell–cell contacts and the leading edge of migratory cells where they pull on microtubules to reposition the centrosome such that it is between the leading edge and the nucleus (Fig. 4 A) (Schmoranzer et al., 2009; Etienne-Manneville and Hall, 2001; Palazzo et al., 2001; Levy and Holzbaur, 2008; Dujardin and Vallee, 2002; Dujardin et al., 2003; Fructuoso et al., 2020). During this process, dynein also contributes to rotational movement of the nuclei (Levy and Holzbaur, 2008). Centrosome repositioning ensures that the microtubule network becomes polarized and is aligned with the vector of migration (Fig. 4 A). A polarized microtubule network is essential for persistent directional movement because it allows for efficient trafficking of signaling proteins and focal adhesion (FA) components to and from the leading edge (Luxton and Gundersen, 2011). Disruption of this process leads to a reduction in directional persistence during migration. Dynein’s second function during migration is to traffic cargo, including endocytosed FA components, away from the cell periphery (Fig. 4 B) (Shafaq-Zadah et al., 2016).

CCSer2 knockout causes a decrease in microtubule polarization during migration and retrograde-trafficking defects of integrins. (A) Illustration of dynein’s role in microtubule polarization during cell migration. Dynein anchored to the leading edge of a migrating cell facilitates the polarization of the nucleus–centrosome axis by pulling on the cortical microtubules. The Golgi apparatus is localized near the centrosome and reports on centrosome position. (B) Internalized integrins are trafficked by dynein before being shuttled to recycling endosomes or the lysosome. (C and D) Fluorescence microscopy images of fixed WT (C) or CCSer2-KO (D) cells at 0 and 4 h after wounding or 4 h after wounding with the expression of exogenous CCSer2WT. Cells were stained with α-GM130 (green) to label Golgi apparatus, phalloidin (pink) to label actin, DAPI (blue) to label the nucleus, and α-GFP to label CCSer2WT-transfected cells (yellow). Rose histogram plots next to each image indicate the probability of finding Golgi signal 360° around the nucleus, relative to the leading edge. Each concentric circle corresponds to the fraction of the total signal found at a given angle and 90° indicates the direction perpendicular to the angle of the wound. n = 90 cells for nontransfected samples across three biological replicates. n = 98 and 112 cells for WT and CCSer2-KOs expressing CCSer2WT from 4 to 3 biological replicates, respectively. (E) Fluorescence microscopy images of fixed WT and CCSer2-KO cells, stained with α-paxillin (green) and α-β1-integrin (magenta) to label intracellular and transmembrane FA components, respectively, and DAPI (blue). Grayscale images are set to the same LUT for each antibody; however, LUTs of merged images have been selected for clarity of viewing. (F) Quantification of the raw integrin intensity values per cell, reporting either total cellular intensity (Total), intensity exclusively at paxillin puncta (FAs), or intensity outside paxillin puncta (Outside FAs). n = 74 cells analyzed, across three biological replicates. Error bars are the median ± interquartile range, and statistics were determined with a Kruskal–Wallis test with Dunn’s multiple comparisons. (G) Quantification of the average FA size (paxillin puncta) per cell of WT and CCSer2-KOs. n = 71 cells analyzed, across three biological replicates. Error bars are the median ± interquartile range. Statistical analysis was performed with a Mann–Whitney test. (H) Schematic of a cell in a confluent layer migrating upward to fill in a wound. The orientation of the polarized microtubule network within the dashed box establishes upward moving vesicles as anterograde (pink arrow) and downward moving vesicles as retrograde (green arrow). (I) Representative tracks (>5 μm) of integrin-containing vesicles in WT (top) or CCSer2-KO (bottom) cells. 17 tracks are shown from the WT cell, and 14 tracks are shown from the CCSer2-KO cell. (J) Directional change rate of both anterograde and retrograde individual integrin tracks averaged per cell. n = 62 and 66 track averages analyzed for 31 and 33 WT and CCSer2-KO cells, respectively, across three biological replicates. The error bars are the median ± interquartile range, and statistics were determined with a Mann–Whitney test. (K) Percentage of retrograde events in WT and CCSer2 KO cells. n = 31 and 33 cells analyzed for WT and CCSer2-KO cells, respectively, across three biological replicates. Error bars are the median ± interquartile range. Statistical analysis was performed with a Mann–Whitney test. (L) Maximum speed of the averaged retrograde and anterograde integrin tracks per cell of WT and CCSer2-KO cells. n = 31 and 33 cells analyzed for WT and CCSer2-KO cells, respectively, across three biological replicates. Error bars are the median ± interquartile range. Statistical analysis was performed with a Kruskal–Wallis test with Dunn’s multiple comparisons.
CCSer2 knockout causes a decrease in microtubule polarization during migration and retrograde-trafficking defects of integrins. (A) Illustration of dynein’s role in microtubule polarization during cell migration. Dynein anchored to the leading edge of a migrating cell facilitates the polarization of the nucleus–centrosome axis by pulling on the cortical microtubules. The Golgi apparatus is localized near the centrosome and reports on centrosome position. (B) Internalized integrins are trafficked by dynein before being shuttled to recycling endosomes or the lysosome. (C and D) Fluorescence microscopy images of fixed WT (C) or CCSer2-KO (D) cells at 0 and 4 h after wounding or 4 h after wounding with the expression of exogenous CCSer2WT. Cells were stained with α-GM130 (green) to label Golgi apparatus, phalloidin (pink) to label actin, DAPI (blue) to label the nucleus, and α-GFP to label CCSer2WT-transfected cells (yellow). Rose histogram plots next to each image indicate the probability of finding Golgi signal 360° around the nucleus, relative to the leading edge. Each concentric circle corresponds to the fraction of the total signal found at a given angle and 90° indicates the direction perpendicular to the angle of the wound. n = 90 cells for nontransfected samples across three biological replicates. n = 98 and 112 cells for WT and CCSer2-KOs expressing CCSer2WT from 4 to 3 biological replicates, respectively. (E) Fluorescence microscopy images of fixed WT and CCSer2-KO cells, stained with α-paxillin (green) and α-β1-integrin (magenta) to label intracellular and transmembrane FA components, respectively, and DAPI (blue). Grayscale images are set to the same LUT for each antibody; however, LUTs of merged images have been selected for clarity of viewing. (F) Quantification of the raw integrin intensity values per cell, reporting either total cellular intensity (Total), intensity exclusively at paxillin puncta (FAs), or intensity outside paxillin puncta (Outside FAs). n = 74 cells analyzed, across three biological replicates. Error bars are the median ± interquartile range, and statistics were determined with a Kruskal–Wallis test with Dunn’s multiple comparisons. (G) Quantification of the average FA size (paxillin puncta) per cell of WT and CCSer2-KOs. n = 71 cells analyzed, across three biological replicates. Error bars are the median ± interquartile range. Statistical analysis was performed with a Mann–Whitney test. (H) Schematic of a cell in a confluent layer migrating upward to fill in a wound. The orientation of the polarized microtubule network within the dashed box establishes upward moving vesicles as anterograde (pink arrow) and downward moving vesicles as retrograde (green arrow). (I) Representative tracks (>5 μm) of integrin-containing vesicles in WT (top) or CCSer2-KO (bottom) cells. 17 tracks are shown from the WT cell, and 14 tracks are shown from the CCSer2-KO cell. (J) Directional change rate of both anterograde and retrograde individual integrin tracks averaged per cell. n = 62 and 66 track averages analyzed for 31 and 33 WT and CCSer2-KO cells, respectively, across three biological replicates. The error bars are the median ± interquartile range, and statistics were determined with a Mann–Whitney test. (K) Percentage of retrograde events in WT and CCSer2 KO cells. n = 31 and 33 cells analyzed for WT and CCSer2-KO cells, respectively, across three biological replicates. Error bars are the median ± interquartile range. Statistical analysis was performed with a Mann–Whitney test. (L) Maximum speed of the averaged retrograde and anterograde integrin tracks per cell of WT and CCSer2-KO cells. n = 31 and 33 cells analyzed for WT and CCSer2-KO cells, respectively, across three biological replicates. Error bars are the median ± interquartile range. Statistical analysis was performed with a Kruskal–Wallis test with Dunn’s multiple comparisons.
The reduction in directional persistence observed in the CCSer2-KO cells is consistent with impaired dynein activity during cell migration (Etienne-Manneville and Hall, 2001; Palazzo et al., 2001; Dujardin et al., 2003). Therefore, we set out to determine whether CCSer2 depletion affects migration-specific dynein functions. First, we tested whether CCSer2 deletion affects centrosome positioning during migration. To test this, we monitored confluent sheets of cells as they migrated to fill a wound. Initially, we stained the Golgi network as a reporter for microtubule polarization because its position relative to the nucleus is easy to visualize and because it becomes repositioned with the centrosome. Immediately after generating the wound, the probability of finding Golgi was equal at all angles around the nucleus in both control and CCSer2-KO cells, which is indicative of a nonpolarized microtubule network (Fig. 4, C and D, top). After 4 h, all control cells displayed a polarized microtubule network, with the Golgi positioned immediately in front of the nucleus and oriented toward the leading edge (Fig. 4 C, middle). In contrast, CCSer2-KO cells rarely achieved a polarized microtubule network, with the Golgi network remaining radially distributed around the nucleus (Fig. 4 D, middle). The exogenous expression of CCSer2WT rescued the polarization defect and generated Golgi positioning profiles in CCSer2-KO cells that were indistinguishable from control samples (Fig. 4, C and D, bottom). To ensure that the polarization defect we observed was a result of centrosome mispositioning and not a loss of Golgi–centrosome tethering, we repeated the polarization assay and stained for γ-tubulin to report on the centrosome position directly. Consistent with a polarization defect rather than a Golgi-tethering defect, WT cells nearly always positioned their centrosome in front of the nucleus, while the centrosome in the CCSer2-KO cells was randomly oriented around or on the top of the nucleus (Fig. S4, A and B).
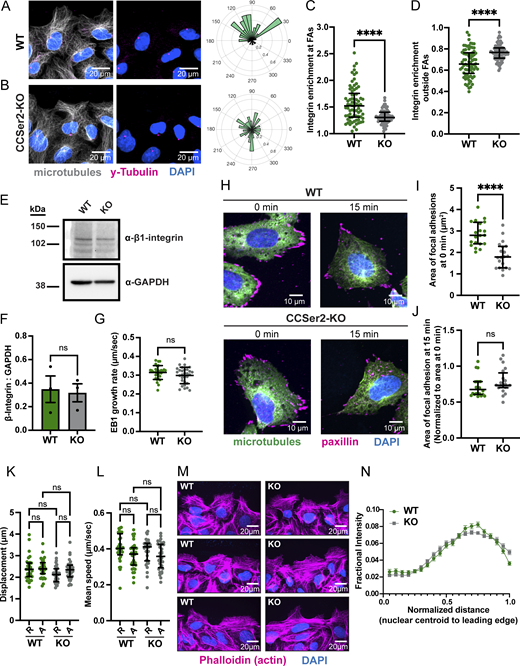
CCSer2 knockout results in reduced microtubule polarization during migration and defects in retrograde integrin trafficking.(A and B) Fluorescence microscopy images of WT (A) and CCSer2-KO (B) cells fixed 4 h after wounding and stained for microtubules (gray), centrosome (magenta), and the nucleus (DAPI). Cells are migrating toward the top of the image. The rose histogram plots to the right of the image display the probability of finding the centrosome 360° around the nuclear centroid. 90° on the rose plots is perpendicular to the angle of the wound. (C) Quantification of the relative integrin enrichment at FAs (paxillin puncta) over the mean total cellular intensity as a ratio (from data in Fig. 4 F). n = 74 cells analyzed, across three biological replicates. Error bars are the median ± interquartile range, and statistics were performed with a Mann–Whitney test. (D) Quantification of the relative integrin enrichment outside of FAs (paxillin puncta) over the mean total cellular intensity as a ratio (from data in Fig. 4 F). n = 74 cells analyzed, across three biological replicates. Error bars are the median ± interquartile range, and statistics were determined with a Mann–Whitney test. (E) Representative western blot from whole-cell lysate of WT and CCSer2-KO cells, blotting for α-β1-integrin and α-GAPDH as a loading control. (F) Quantification of the β1-integrin levels in WT and CCSer2-KO cells normalized to GAPDH levels. n = 3 biological replicates. Error bars shown are the mean ± SD, and the statistical significance was determined with a Mann–Whitney test. (G) Quantification of EB1 plus-end growth in WT and CCSer2-KO cells. n = 30 cells analyzed across three biological replicates per sample. Significance was determined with a Mann–Whitney test, and error bars are the mean ± SD. (H) Fluorescence microscopy images of fixed WT (top) and CCSer2-KO (bottom) cells in a nocodazole washout experiment, stained for microtubules, FAs, and nuclei with α-tubulin (green), α-paxillin (magenta), and DAPI (blue), respectively. Nocodazole-treated cells are fixed after 0 min (left panels) or 15 min (right panels) of washing out with nocodazole-free media. (I) Quantification of the FA size at 0 min using thresholding and particle analysis functions in the paxillin channel in FIJI. n = 20 fields of view for WT and CCSer2 KO cells, across two biological replicates. Error bars are the median ± interquartile range. Statistical analysis was performed with a Mann–Whitney test. (J) Quantification of the FA size at 15 min, normalized to the average size at 0 min in I for both WT and CCSer2-KO cells, respectively. n = 20 fields of view for WT and CCSer2 KO cells, across two biological replicates. Error bars are the median ± interquartile range. Statistical analysis was performed with a Mann–Whitney test. (K) Displacement of the averaged anterograde and retrograde mCherry-integrin tracks per cell of WT and CCSer2-KOs. n = 31 and 33 cells analyzed for WT and CCSer2-KO cells, respectively, across three biological replicates. (L) Mean speed of the averaged anterograde and retrograde integrin tracks per cell of WT and CCSer2-KOs. n = 31 and 33 cells analyzed for WT and CCSer2-KO cells, respectively, across three biological replicates. Error bars are the median ± interquartile range. Statistical analysis was performed with a Kruskal–Wallis test with Dunn’s multiple comparisons test. (M) Three example fluorescence microscopy images of fixed WT and CCSer2-KO cells, 4 h after wounding, stained with phalloidin and DAPI. (N) Fractional distribution of actin intensity from the centroid of the nucleus to the cell edge for WT and CCSer2-KO cells. n = 45 cells analyzed per sample across three biological replicates. Error bars are the mean ± SEM. Statistical analysis was performed with multiple Mann–Whitney tests and a false discovery rate of 1%. Source data are available for this figure: SourceData FS4.

CCSer2 knockout results in reduced microtubule polarization during migration and defects in retrograde integrin trafficking.(A and B) Fluorescence microscopy images of WT (A) and CCSer2-KO (B) cells fixed 4 h after wounding and stained for microtubules (gray), centrosome (magenta), and the nucleus (DAPI). Cells are migrating toward the top of the image. The rose histogram plots to the right of the image display the probability of finding the centrosome 360° around the nuclear centroid. 90° on the rose plots is perpendicular to the angle of the wound. (C) Quantification of the relative integrin enrichment at FAs (paxillin puncta) over the mean total cellular intensity as a ratio (from data in Fig. 4 F). n = 74 cells analyzed, across three biological replicates. Error bars are the median ± interquartile range, and statistics were performed with a Mann–Whitney test. (D) Quantification of the relative integrin enrichment outside of FAs (paxillin puncta) over the mean total cellular intensity as a ratio (from data in Fig. 4 F). n = 74 cells analyzed, across three biological replicates. Error bars are the median ± interquartile range, and statistics were determined with a Mann–Whitney test. (E) Representative western blot from whole-cell lysate of WT and CCSer2-KO cells, blotting for α-β1-integrin and α-GAPDH as a loading control. (F) Quantification of the β1-integrin levels in WT and CCSer2-KO cells normalized to GAPDH levels. n = 3 biological replicates. Error bars shown are the mean ± SD, and the statistical significance was determined with a Mann–Whitney test. (G) Quantification of EB1 plus-end growth in WT and CCSer2-KO cells. n = 30 cells analyzed across three biological replicates per sample. Significance was determined with a Mann–Whitney test, and error bars are the mean ± SD. (H) Fluorescence microscopy images of fixed WT (top) and CCSer2-KO (bottom) cells in a nocodazole washout experiment, stained for microtubules, FAs, and nuclei with α-tubulin (green), α-paxillin (magenta), and DAPI (blue), respectively. Nocodazole-treated cells are fixed after 0 min (left panels) or 15 min (right panels) of washing out with nocodazole-free media. (I) Quantification of the FA size at 0 min using thresholding and particle analysis functions in the paxillin channel in FIJI. n = 20 fields of view for WT and CCSer2 KO cells, across two biological replicates. Error bars are the median ± interquartile range. Statistical analysis was performed with a Mann–Whitney test. (J) Quantification of the FA size at 15 min, normalized to the average size at 0 min in I for both WT and CCSer2-KO cells, respectively. n = 20 fields of view for WT and CCSer2 KO cells, across two biological replicates. Error bars are the median ± interquartile range. Statistical analysis was performed with a Mann–Whitney test. (K) Displacement of the averaged anterograde and retrograde mCherry-integrin tracks per cell of WT and CCSer2-KOs. n = 31 and 33 cells analyzed for WT and CCSer2-KO cells, respectively, across three biological replicates. (L) Mean speed of the averaged anterograde and retrograde integrin tracks per cell of WT and CCSer2-KOs. n = 31 and 33 cells analyzed for WT and CCSer2-KO cells, respectively, across three biological replicates. Error bars are the median ± interquartile range. Statistical analysis was performed with a Kruskal–Wallis test with Dunn’s multiple comparisons test. (M) Three example fluorescence microscopy images of fixed WT and CCSer2-KO cells, 4 h after wounding, stained with phalloidin and DAPI. (N) Fractional distribution of actin intensity from the centroid of the nucleus to the cell edge for WT and CCSer2-KO cells. n = 45 cells analyzed per sample across three biological replicates. Error bars are the mean ± SEM. Statistical analysis was performed with multiple Mann–Whitney tests and a false discovery rate of 1%. Source data are available for this figure: SourceData FS4.
In addition to establishing the nucleus–centrosome axis, dynein supports the retrograde trafficking of endocytosed integrins during migration (Fig. 4 B), which is essential for FA remodeling during migration (Caswell et al., 2009). We were curious whether CCSer2-KO disrupted FA remodeling since the cell shape defect we observed in migrating cells could be caused by increased cell–matrix adhesion. To explore this question, first we stained CCSer2-KO and control cells for paxillin (an intracellular FA-associated protein) and β-1 integrin (one of the transmembrane components of FAs). We observed that while CCSer2-KO cells had smaller FAs overall, they had an increase in membrane-associated β-1 integrins that were not colocalized with paxillin (Fig. 4, E–G; and Fig. S4, C and D). The increase in β-1 integrin staining is not due to overexpression in the CCSer2-KO cells (Fig. S4, E and F). This indicates that FA formation and remodeling are dysregulated in the absence of CCSer2. This result may also explain how the elongated cell shape arises in CCSer2-KO cells. While FA-associated integrins are essential for generating a significant portion of the cell–ECM adhesion, integrins that are not associated with FAs also generate adhesive forces (Wang and Wang, 2016). We reason that the increase in non–FA-localized integrin results in an increase in cell–matrix adhesion in CCSer2-KO cells, which could result in the inability of CCSer2-KO cells to remodel projections during movement.
How does the aberrant β-1 integrin localization arise? One potential explanation could be disrupted FA disassembly. If CCSer2 plays a role in FA disassembly, CCSer2-KO could lead to an increase in surface-associated FA proteins. Additionally, it is well established that the microtubule plus-end delivers disassembly machinery to FAs and CCSer2 displays some plus-end localization (Kaverina et al., 1999; Ezratty et al., 2005; Aureille et al., 2024; Stehbens et al., 2014). First, we asked if CCSer2-KO caused a change in microtubule polymerization rates by monitoring EB1 comets live in WT and KO cells. We saw no difference in microtubule polymerization rates, suggesting that CCSer2 does not regulate microtubule growth (Fig. S4 G). Next, we asked if the rate of FA disassembly was altered upon CCSer2 deletion. To do this, we performed a well-established nocodazole washout experiment to report on the rate of microtubule plus end–dependent FA disassembly (Ezratty et al., 2005). Here, we incubated cells with the microtubule-depolymerizing drug, nocodazole, to induce FA stabilization, then washed it out to induce FA disassembly (Fig. S4 H). While CCSer2-KO cells had smaller paxillin-positive FAs than WT cells in the presence of nocodazole, the rate of FA disassembly for WT and CCSer2-KO cells was the same (Fig. S4, I and J). This suggests that microtubule targeting to FA factors is not impaired in CCSer2-KO cells and is not the likely cause for the β-1 integrin mislocalization.
Next, we investigated whether trafficking of internalized integrins was impaired in the CCSer2-KO cells because integrin trafficking is essential for the integrin recycling and FA formation (Shafaq-Zadah et al., 2016; White et al., 2007; Caswell et al., 2008). Indeed, defects in retrograde trafficking of β-1 integrin are associated with a reduced ability to both disassemble and form mature FAs and result in an increase in the relative enrichment of plasma membrane–localized β-1 integrin in epiblast cells in mouse embryos (Shafaq-Zadah et al., 2016). To ask if CCSer2 deletion affects integrin trafficking, we imaged the intracellular movement of exogenously expressed mCherry-α5-integrin-12 (which dimerizes with β-1 integrin) in control and CCSer2-KO cells (De Franceschi et al., 2015). To discriminate between retrograde and anterograde events, we imaged confluent cells as they migrated to fill a wound and limited our analysis to events that occurred between the leading edge of the cell and the nucleus (Fig. 4 H; and Videos 10, 11, 12, and 13). Events that showed a net movement away from the leading edge were considered retrograde, while events that had net movement away from the nucleus were anterograde (Fig. 4 H). While there was no discernable difference in the net displacement of mCherry-α5-integrin-12 puncta in either cell type, puncta in CCSer2-KO cells displayed far more bidirectional movement than in control cells (Fig. 4, I and J; and Fig. S4 K). Consistent with a retrograde-specific trafficking defect, CCSer2-KO cells had a lower percentage of retrograde events, and the maximum speed (but not the mean speed) of retrograde events was slower than in control cells (Fig. 4, K and L; and Fig. S4 L). There was no discernable difference between the maximum speed of anterograde events in control and CCSer2-KO cells (Fig. 4 L). Altogether, these data suggest that CCSer2 deletion hinders integrin trafficking, with a bigger negative impact on retrograde events. Interestingly, defective retrograde trafficking of β-1 integrin is also associated with a loss of directional persistence during migration, which suggests that the defect in directional persistence seen in CCSer2-KO cells may arise from microtubule polarization and integrin trafficking defects (Shafaq-Zadah et al., 2016). Together, these results support a role of CCSer2 in migration-specific dynein functions and explain the defect in cell migration observed in CCSer2-KO cells.
Related toFig. 4 . Representative movie of a U2OS WT cell, 48 h after transfection of mCherry-α5-integrin-12, and plated in a fibronectin-coated 8-well live imaging dish. Cells were allowed to migrate for 1 h after wounding with a p200 pipette tip, then imaged with 60X magnification at two frames per second for 2 min.
Related toFig. 4 . Representative movie of a U2OS WT cell, 48 h after transfection of mCherry-α5-integrin-12, and plated in a fibronectin-coated 8-well live imaging dish. Cells were allowed to migrate for 1 h after wounding with a p200 pipette tip, then imaged with 60X magnification at two frames per second for 2 min.
Related toFig. 4; and Video 10,. Postprocessing of Video 10 to better identify vesicles for TrackMate analysis. Representative movie of a U2OS WT cell, 48 h after transfection of mCherry-α5-integrin-12, and plated in a fibronectin-coated 8-well live imaging dish. Cells were allowed to migrate for 1 h after wounding with a p200 pipette tip, then imaged with 60X magnification at two frames per second for 2 min.
Related toFig. 4; and Video 10,. Postprocessing of Video 10 to better identify vesicles for TrackMate analysis. Representative movie of a U2OS WT cell, 48 h after transfection of mCherry-α5-integrin-12, and plated in a fibronectin-coated 8-well live imaging dish. Cells were allowed to migrate for 1 h after wounding with a p200 pipette tip, then imaged with 60X magnification at two frames per second for 2 min.
Related toFig. 4 . Representative movie of a CCSer2-KO cell, 48 h after transfection of mCherry-α5-integrin-12, and plated in a fibronectin-coated 8-well live imaging dish. Cells were allowed to migrate for 1 h after wounding with a p200 pipette tip, then imaged with 60X magnification at two frames per second for 2 min.
Related toFig. 4 . Representative movie of a CCSer2-KO cell, 48 h after transfection of mCherry-α5-integrin-12, and plated in a fibronectin-coated 8-well live imaging dish. Cells were allowed to migrate for 1 h after wounding with a p200 pipette tip, then imaged with 60X magnification at two frames per second for 2 min.
Related toFig. 4; and Video 12,. Postprocessing of Video 12 to better identify vesicles for TrackMate analysis. Representative movies of a CCSer2-KO cell, 48 h after transfection of mCherry-α5-integrin-12, and plated in a fibronectin-coated 8-well live imaging dish. Cells were allowed to migrate for 1 h after wounding with a p200 pipette tip, then imaged with 60X magnification at two frames per second for 2 min.
Related toFig. 4; and Video 12,. Postprocessing of Video 12 to better identify vesicles for TrackMate analysis. Representative movies of a CCSer2-KO cell, 48 h after transfection of mCherry-α5-integrin-12, and plated in a fibronectin-coated 8-well live imaging dish. Cells were allowed to migrate for 1 h after wounding with a p200 pipette tip, then imaged with 60X magnification at two frames per second for 2 min.
In addition to regulating dynein, Ndel1 has been reported to interact with actin-associated proteins to regulate actin polymerization (Hong et al., 2016; Woo et al., 2019). It is possible that some of the defects we observe in CCSer2-KO cells could arise from Ndel1-dependent misregulation of actin polymerization. Indeed, the proposed function of Gcap14 in neuronal progenitor cells is to regulate actin–microtubule interactions in a Ndel1-dependent manner (Mun et al., 2023). To test whether CCSer2-KO cells had actin polymerization defects, we measured the depth of the actin cortex at the leading edge of collectively migrating cells in the wound-healing assay described above. We did not observe a change in the appearance of actin at the leading edge of migrating CCSer2-KO cells compared with control, which suggests that CCSer2-KO does not grossly alter Ndel1’s actin polymerization functions (Fig. S4, M and N).
CCSer2 exclusively regulates the retrograde trafficking of cargos that require cortically localized dynein
To test whether the trafficking defect we observed in CCSer2-KO cells was specific to centrosomes and integrin cargo during migration, or whether it applied to all endosomal cargo regardless of the migratory state of the cell, we labeled early endosomes with an antibody against EEA-1 and determined the radial distribution of endosomes with respect to the center of the nucleus in control and CCSer2-KO cells. We conducted this analysis with cells plated at a low density (to ensure cells were not undergoing collective migration), and we excluded hyper-elongated KO cells. In control cells, a large proportion of the EEA-1–positive vesicles were clustered closely around the nucleus (Fig. 5, A and B). Consistent with a retrograde trafficking defect, we observed that EEA-1 was significantly dispersed in CCSer2-KO cells (Fig. 5, A and B). The mean intensity of EEA-1 staining per cell was not significantly different between control and CCSer2-KO cells (Fig. S5 A), which indicates that there is not a difference in the number of EEA-1–positive vesicles (i.e., not an endocytosis defect), but a defect in the trafficking steps that occur downstream of internalization. Importantly, the expression of CCSer2WT, but not vector or CCSer2ΔCC, rescued the EEA-1 mislocalization in CCSer2-KO cells (Fig. 5, C–E and Fig. S5 B), suggesting that the defect is caused by CCSer2 deletion and that the coiled coil containing the Ndel1 binding site is required for rescue.

CCSer2 supports the retrograde trafficking of early endosomes and promotes dynein localization to the cell periphery. (A) Fluorescence microscopy images of fixed WT and CCSer2-KO cells stained with phalloidin to visualize actin (magenta), α-EEA-1 to visualize early endosomes (green), and DAPI to visualize nuclei (blue). (B) Fractional distribution of EEA-1 endosomes from the centroid of the nucleus to the cell edge. n = 37 cells analyzed for both samples across three biological replicates. (C and D) Fluorescence microscopy images of fixed CCSer2-KO cells transfected with CCSer2WT (C) or CCSer2∆CC (D) and stained with phalloidin to visualize actin (magenta), α-EEA-1 to visualize early endosomes (green), α-GFP to visualize CCSer2WT or CCSer2∆CC (yellow), and DAPI to visualize nuclei (blue). (E) Fractional distribution of EEA-1 endosomes from the centroid of the nucleus to the cell edge for CCSer2-KO cells transfected with vector, CCSer2WT, or CCSer2∆CC. n = 44 cells analyzed per sample across three biological replicates. (F) Fluorescence microscopy images of fixed WT and CCSer2-KO cells treated with EGF-555, shown in green. Cells were stained with phalloidin to visualize actin (magenta) and DAPI to visualize nuclei (blue). (G) Fractional distribution of EGF-555 intensity from the centroid of the nucleus to the cell periphery in WT and CCSer2-KOs. n = 89 and 85 cells analyzed for WT and CCSer2-KOs, respectively, across three biological replicates. (H–K) Fractional distribution from nuclear centroid to cell edge for ER intensity (stained with α-PDI) (H), mitochondria (stained with α-TOM20) (I), Golgi apparatus (stained with α-GM130) (J), and lysosomes (stained with α-LAMP1) (K) in WT or CCSer2-KO cells. n = 34 cells for ER, 35 for mitochondria, 37 for Golgi, and 37 for lysosomes, obtained from three biological replicates. Error bars shown are the mean ± SEM (B, E, G, and H–K). Significance was determined with multiple Mann–Whitney tests using a false discovery rate of 1% (B, E, G, and H–K). (L and N) Fluorescence microscopy images of WT and CCSer2 KO cells fixed 30 min after wounding and stained with α-DHC (L) or α-Ndel1 (N). The wound is positioned so that the cells are migrating toward the top of the image. (M and O) Quantification of dynein (M) or Ndel1 (O) localization at the leading edge. The mean intensity of dynein or Ndel1 signal in one-micron band at the leading edge was divided by the mean intensity 6.5 μm into the cell. n = 75 cells analyzed for both WT and CCSer2-KOs across three biological replicates. Error bars represent the median with interquartile range. Significance was determined with a Mann–Whitney test. DHC, dynein heavy chain.
CCSer2 supports the retrograde trafficking of early endosomes and promotes dynein localization to the cell periphery. (A) Fluorescence microscopy images of fixed WT and CCSer2-KO cells stained with phalloidin to visualize actin (magenta), α-EEA-1 to visualize early endosomes (green), and DAPI to visualize nuclei (blue). (B) Fractional distribution of EEA-1 endosomes from the centroid of the nucleus to the cell edge. n = 37 cells analyzed for both samples across three biological replicates. (C and D) Fluorescence microscopy images of fixed CCSer2-KO cells transfected with CCSer2WT (C) or CCSer2∆CC (D) and stained with phalloidin to visualize actin (magenta), α-EEA-1 to visualize early endosomes (green), α-GFP to visualize CCSer2WT or CCSer2∆CC (yellow), and DAPI to visualize nuclei (blue). (E) Fractional distribution of EEA-1 endosomes from the centroid of the nucleus to the cell edge for CCSer2-KO cells transfected with vector, CCSer2WT, or CCSer2∆CC. n = 44 cells analyzed per sample across three biological replicates. (F) Fluorescence microscopy images of fixed WT and CCSer2-KO cells treated with EGF-555, shown in green. Cells were stained with phalloidin to visualize actin (magenta) and DAPI to visualize nuclei (blue). (G) Fractional distribution of EGF-555 intensity from the centroid of the nucleus to the cell periphery in WT and CCSer2-KOs. n = 89 and 85 cells analyzed for WT and CCSer2-KOs, respectively, across three biological replicates. (H–K) Fractional distribution from nuclear centroid to cell edge for ER intensity (stained with α-PDI) (H), mitochondria (stained with α-TOM20) (I), Golgi apparatus (stained with α-GM130) (J), and lysosomes (stained with α-LAMP1) (K) in WT or CCSer2-KO cells. n = 34 cells for ER, 35 for mitochondria, 37 for Golgi, and 37 for lysosomes, obtained from three biological replicates. Error bars shown are the mean ± SEM (B, E, G, and H–K). Significance was determined with multiple Mann–Whitney tests using a false discovery rate of 1% (B, E, G, and H–K). (L and N) Fluorescence microscopy images of WT and CCSer2 KO cells fixed 30 min after wounding and stained with α-DHC (L) or α-Ndel1 (N). The wound is positioned so that the cells are migrating toward the top of the image. (M and O) Quantification of dynein (M) or Ndel1 (O) localization at the leading edge. The mean intensity of dynein or Ndel1 signal in one-micron band at the leading edge was divided by the mean intensity 6.5 μm into the cell. n = 75 cells analyzed for both WT and CCSer2-KOs across three biological replicates. Error bars represent the median with interquartile range. Significance was determined with a Mann–Whitney test. DHC, dynein heavy chain.
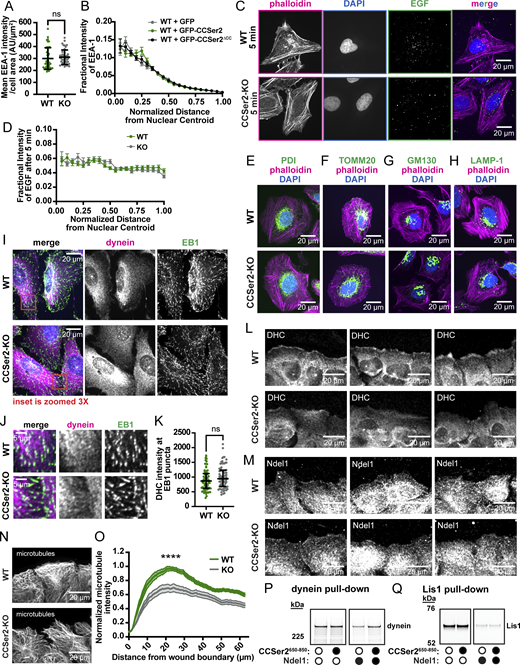
CCSer2 promotes the activity and localization of cortical dynein. (A) Mean intensity of early endosomes per cell area. n = 46 cells analyzed per sample across three biological replicates. Error bars are the median ± interquartile range. Statistical analysis was performed with a Mann–Whitney test. (B) Quantification of the fractional early endosome intensity from the centroid of the nucleus to the cell periphery in WT cells transfected with vector, CCSer2WT, or CCSer2∆CC. n = 44–46 cells analyzed per sample across three biological replicates. Error bars shown are the mean ± SEM. Statistical analysis was performed with multiple Mann–Whitney tests and a false discovery rate of 1%. (C) Fluorescence microscopy images of fixed WT and CCSer2-KO cells treated with EGF-555, shown in green, for 5 min, and the excess was washed out. Cells were stained with phalloidin to visualize actin (magenta) and DAPI to visualize nuclei (blue). (D) Quantification of the fractional EGF-555 intensity from the centroid of the nucleus to the cell periphery in WT and CCSer2-KOs five min after treatment. n = 89 and 85 cells analyzed for WT and CCSer2-KOs, respectively, across three biological replicates. Error bars are the mean ± SEM. Statistical analysis was performed with multiple Mann–Whitney tests and a false discovery rate of 1%. (E–H) Fluorescence microscopy images of PFA-fixed WT and CCSer2-KO cells stained with phalloidin to visualize actin (magenta), DAPI to visualize nuclei (blue), and antibodies against the following organelles and shown in green: (E) ER (α-PDI), (F) mitochondria (α-TOM20), (G) Golgi apparatus (α-GM130), and (H) lysosomes (α-LAMP-1). Quantification is shown in Fig. 5, H–K. (I) Fluorescence microscopy images of fixed WT and CCSer2-KO cells, stained with α-DHC (magenta), α-EB1 (green), and DAPI (blue). (J) 3X zoomed inset of the red box in I. (K) Intensity of dynein at EB1 puncta in WT and CCSer2-KO cells in J. n = 78 cells analyzed per sample. Error bars are the median with an interquartile range. Significance was determined with a Mann–Whitney test. (L and M) Additional representative images of WT and CCSer2 KO cells fixed 30 min after wounding and stained with α-DHC (L) or α-Ndel1 (M) as shown in Fig. 5, L and N. (N) Fluorescence microscopy images of fixed WT and CCSer2-KO cells in a wound-healing assay, 30 min after wounding, and stained for microtubules. (O) Quantification of the normalized microtubule intensity per field of view measured with a box intensity plot profile from the edge of the wound into the confluent sheet of cells (65 µm). n = 30 images (fields of view) per sample. Error bars shown are the mean ± SEM. Statistical significance was determined with multiple Mann–Whitney tests and a false discovery rate of 1%. (P) SDS-PAGE gel image of dynein depletion assay. 5 nM dynein (∼551.7 kDa) depletion by 30 nM Halo-Ndel1 in the absence (white circle) or presence (black circle) of 90 nM Strep-CCSer2650–850. (Q) SDS-PAGE gel image of Lis1 depletion assay. 5 nM Lis1 (∼66.4 kDa) depletion by 10 nM Halo-Ndel1 in the absence (white circle) or presence (black circle) of 80 nM Strep-CCSer2650–850. DHC, dynein heavy chain. Source data are available for this figure: SourceData FS5.

CCSer2 promotes the activity and localization of cortical dynein. (A) Mean intensity of early endosomes per cell area. n = 46 cells analyzed per sample across three biological replicates. Error bars are the median ± interquartile range. Statistical analysis was performed with a Mann–Whitney test. (B) Quantification of the fractional early endosome intensity from the centroid of the nucleus to the cell periphery in WT cells transfected with vector, CCSer2WT, or CCSer2∆CC. n = 44–46 cells analyzed per sample across three biological replicates. Error bars shown are the mean ± SEM. Statistical analysis was performed with multiple Mann–Whitney tests and a false discovery rate of 1%. (C) Fluorescence microscopy images of fixed WT and CCSer2-KO cells treated with EGF-555, shown in green, for 5 min, and the excess was washed out. Cells were stained with phalloidin to visualize actin (magenta) and DAPI to visualize nuclei (blue). (D) Quantification of the fractional EGF-555 intensity from the centroid of the nucleus to the cell periphery in WT and CCSer2-KOs five min after treatment. n = 89 and 85 cells analyzed for WT and CCSer2-KOs, respectively, across three biological replicates. Error bars are the mean ± SEM. Statistical analysis was performed with multiple Mann–Whitney tests and a false discovery rate of 1%. (E–H) Fluorescence microscopy images of PFA-fixed WT and CCSer2-KO cells stained with phalloidin to visualize actin (magenta), DAPI to visualize nuclei (blue), and antibodies against the following organelles and shown in green: (E) ER (α-PDI), (F) mitochondria (α-TOM20), (G) Golgi apparatus (α-GM130), and (H) lysosomes (α-LAMP-1). Quantification is shown in Fig. 5, H–K. (I) Fluorescence microscopy images of fixed WT and CCSer2-KO cells, stained with α-DHC (magenta), α-EB1 (green), and DAPI (blue). (J) 3X zoomed inset of the red box in I. (K) Intensity of dynein at EB1 puncta in WT and CCSer2-KO cells in J. n = 78 cells analyzed per sample. Error bars are the median with an interquartile range. Significance was determined with a Mann–Whitney test. (L and M) Additional representative images of WT and CCSer2 KO cells fixed 30 min after wounding and stained with α-DHC (L) or α-Ndel1 (M) as shown in Fig. 5, L and N. (N) Fluorescence microscopy images of fixed WT and CCSer2-KO cells in a wound-healing assay, 30 min after wounding, and stained for microtubules. (O) Quantification of the normalized microtubule intensity per field of view measured with a box intensity plot profile from the edge of the wound into the confluent sheet of cells (65 µm). n = 30 images (fields of view) per sample. Error bars shown are the mean ± SEM. Statistical significance was determined with multiple Mann–Whitney tests and a false discovery rate of 1%. (P) SDS-PAGE gel image of dynein depletion assay. 5 nM dynein (∼551.7 kDa) depletion by 30 nM Halo-Ndel1 in the absence (white circle) or presence (black circle) of 90 nM Strep-CCSer2650–850. (Q) SDS-PAGE gel image of Lis1 depletion assay. 5 nM Lis1 (∼66.4 kDa) depletion by 10 nM Halo-Ndel1 in the absence (white circle) or presence (black circle) of 80 nM Strep-CCSer2650–850. DHC, dynein heavy chain. Source data are available for this figure: SourceData FS5.
The cells visualized in this assay may still be undergoing some FA remodeling, and thus, a proportion of endosomes still may contain integrins. Therefore, it is possible that the EEA-1 localization defect we observe is caused by specific mislocalization of FA-derived endosomes, and not all endosomes. To test this, we monitored the localization of an additional endosomal cargo, epidermal growth factor (EGF). Here, we bathed cells in fluorescently tagged EGF and monitored localization at 5 and 30 min. There was no difference in the distribution of EGF in either cell type 5 min after internalization (Fig. S5, C and D). However, after 30 min, the control cells showed most internalized EGF clustered near the nucleus (Fig. 5, F and G). In contrast, the CCSer2-KO cells displayed more dispersed EGF puncta, which is consistent with a dynein trafficking defect (Fig. 5, F and G). Together, these results suggest that CCSer2-KO cells have impaired dynein-driven retrograde trafficking of all early endosomes. Further, these findings suggest that the integrin trafficking defect observed in CCSer2-KO is likely an outcome of impaired endosome trafficking and not specific to integrin cargo.
Dynein is a multifunctional motor. In addition to trafficking endosomes, dynein supports the retrograde motility of hundreds of other cargos. To test whether CCSer2-KO affects all cargo that moves in the retrograde direction, we looked at the cellular distribution of four additional model cargos (endoplasmic reticulum [ER], mitochondria, Golgi, and lysosomes) using the same methodology that we used to measure endosome distribution. If CCSer2 regulates all retrograde trafficking events, we anticipated that we would observe mislocalization of all cargo. However, if CCSer2 activity specifically affects endosomes, we reasoned that we would only observe mislocalization of lysosomes, which mature from populations of early endosomes. Consistent with the latter hypothesis, we observed that ER, mitochondria, and Golgi all showed identical cellular distribution profiles in both control and CCSer2-KO cells, while lysosomes were moderately dispersed in CCSer2-KO cells (Fig. 5, H–K and Fig. S5, E–H).
Given CCSer2’s localization to the microtubule plus-end and the cell periphery, we next asked if CCSer2 controls dynein localization to both cellular regions. CCSer2 depletion had no effect on dynein intensity at microtubule plus-ends (Fig. S5, I–K). In contrast, we observed very little dynein signal at the leading edge of migrating CCSer2-KO cells (Fig. 5, L and M; and Fig. S5 L), suggesting that CCSer2 can promote dynein localization to the cell periphery. Interestingly, CCSer2-KO cells did not change the relative localization of Ndel1 at the leading edge, which suggests that CCSer2 does not promote dynein localization at the cell periphery simply by binding Ndel1–dynein complexes (Fig. 5, N and O; and Fig. S5 M). These data also explain how CCSer2 deletion only affects dynein-mediated centrosome positioning and endosome trafficking: both cargos require dynein localized to the cell periphery for proper trafficking. Gcap14 in neuronal progenitors is speculated to promote actin–microtubule connection during cell migration (Mun et al., 2023). Consistent with this model, we see a reduction in bundled microtubules at the leading edge of CCSer2-KO cells compared with control (Fig. S5, N and O). However, because we did not observe a change in Ndel1 localization or actin distribution at the leading edge (Fig. 5, N and O; and Fig. S4, M and N), we reason that the reduction in microtubule bundles is likely caused by defective CCSer2-mediated dynein localization and not related to Ndel1’s interaction with actin-associated proteins or defective microtubule–actin crosslinking.
CCSer2 attenuates Ndel1–dynein binding
We showed that (1) CCSer2 binds directly to Ndel1, but not dynein (Fig. 1, B–E; and Fig. S2, C and E), and (2) CCSer2 promotes dynein, but not Ndel1, localization at the cell periphery (Fig. 5, L–O). At first glance, these two observations are hard to reconcile. However, consider the molecular events that likely drive dynein localization. To get loaded onto cargo, dynein must bind adaptors already on cargos. Because the affinity of dynein–adaptor complexes is low, it is likely that dynactin must also be present to retain dynein. In this way, dynein localization is linked to activation because dynein–dynactin–adaptor complex formation converts dynein into an active motor. Ndel1 promotes dynein activation (and thus localization) by coordinating with Lis1 to drive dynein–dynactin association. Ultimately, Ndel1 must unbind dynein for the dynein–dynactin–adaptor complex to form, since Ndel1 and dynactin compete for dynein binding (Fig. 6 A) (Garrott et al., 2023; McKenney et al., 2011; Okada et al., 2023b; Nyarko et al., 2012). We reasoned that if CCSer2 regulated Ndel1–dynein or Ndel1-Lis1 interaction in a manner that drives dynein–dynactin–adaptor binding, depletion of CCSer2 could result in dynein localization defects without grossly altering Ndel1 distribution (since Ndel1 is not retained in the dynein–dynactin–adaptor complex). Given CCSer2’s localization to the cell perimeter, depletion of CCSer2 would most notably affect dynein loading onto cargos that are enriched at the cell periphery, like endosomes or the cell cortex, where dynein resides to drive centrosome movements. This model is consistent with our observation that CCSer2-KO causes endosome trafficking defects and centrosome positioning defects but does not affect dynein’s ability to traffic other cargos.

CCSer2 activates dynein via Ndel1 inhibition. (A) Schematic depicting Ndel1 release from dynein, resulting in downstream formation of dynein transport complex. (B) Schematic of a binding assay to determine whether CCSer2650–850 affects the dynein–Ndel1 interaction. (C) Schematic of the assay to determine whether CCSer2650–850 affects Lis1-Ndel1 binding. (D) Percentage of dynein bound to Ndel1-conjugated beads in the absence (white circle) or presence (black circle) of CCSer2650–850. n = 6. Error bars are the mean ± SD. Statistical analysis was performed with a Mann–Whitney test. (E) Percentage of Lis1 bound to Ndel1-conjugated beads in the absence (white circle) or presence (black circle) of CCSer2650–850. n = 3. Error bars are the mean ± SD. Statistical analysis was performed with a Mann–Whitney test. (F) Median dissociation time of dynein–Ndel1 complexes in the absence (white circle) and presence (black circle) of 2 μM CCSer2650–850. n = 225 for the condition without CCSer2650–850 and 172 for the condition with CCSer2650–850. These data were collected from seven separate experimental replicates. Error bars are 95% confidence intervals. Significance was determined from a Mann–Whitney test. (G) Quantification of DHC co-immunoprecipitation with FLAG-Ndel1 using α-FLAG resin out of U2OS WT or CCSer2-KO cells. n = 6 biological replicates. Error bars are the mean ± SEM, and the statistical analysis was determined with a ratio-paired t test. (H) Representative western blot of FLAG-Ndel1 co-immunoprecipitation experiments quantified in G, blotting for α-DHC, α-FLAG, and α-GAPDH. Input loaded is 1% of total cell lysate. (I) Model for CCSer2 delivery to the cortex and spatial regulation of dynein. (Step 1) CCSer2 binds to EB1 to associate with growing microtubule plus-ends to reach the cell periphery. (Step 2) Dynein–Lis1–Ndel1–dynactin form a primed structure that is poised for activation. It is also possible that dynein–Lis1–Ndel1 form a precomplex and dynactin associates after Ndel1 release. We have shown this pre-activation, primed structure on the microtubule, but it is also possible that this structure does not form with dynein bound directly to the microtubule. (Step 3) Ndel1-CCSer2 interaction reduces Ndel1’s affinity for dynein. (Step 4) Ndel1 release of dynein allows Lis1-mediated activation of dynein and dynactin association with dynein intermediate chain. (Step 5) The fully activated transport complex of dynein–dynactin–adaptor forms with adaptors that are already associated with cellular structures where active dynein will be recruited. (Cargo #1) Dynein–dynactin–adaptor complexes form on the actin cortex (adaptor unknown) to reposition the centrosome during migration. (Cargo #2) Dynein–dynactin–adaptor complexes form on early endosomes (likely Hook1 and Hook3) to drive retrograde trafficking. Interaction with adaptors drives dynein localization and activation. (J) Diagram illustrating the proposed tiered regulation of dynein activity. DHC, dynein heavy chain. Source data are available for this figure: SourceData F6.
CCSer2 activates dynein via Ndel1 inhibition. (A) Schematic depicting Ndel1 release from dynein, resulting in downstream formation of dynein transport complex. (B) Schematic of a binding assay to determine whether CCSer2650–850 affects the dynein–Ndel1 interaction. (C) Schematic of the assay to determine whether CCSer2650–850 affects Lis1-Ndel1 binding. (D) Percentage of dynein bound to Ndel1-conjugated beads in the absence (white circle) or presence (black circle) of CCSer2650–850. n = 6. Error bars are the mean ± SD. Statistical analysis was performed with a Mann–Whitney test. (E) Percentage of Lis1 bound to Ndel1-conjugated beads in the absence (white circle) or presence (black circle) of CCSer2650–850. n = 3. Error bars are the mean ± SD. Statistical analysis was performed with a Mann–Whitney test. (F) Median dissociation time of dynein–Ndel1 complexes in the absence (white circle) and presence (black circle) of 2 μM CCSer2650–850. n = 225 for the condition without CCSer2650–850 and 172 for the condition with CCSer2650–850. These data were collected from seven separate experimental replicates. Error bars are 95% confidence intervals. Significance was determined from a Mann–Whitney test. (G) Quantification of DHC co-immunoprecipitation with FLAG-Ndel1 using α-FLAG resin out of U2OS WT or CCSer2-KO cells. n = 6 biological replicates. Error bars are the mean ± SEM, and the statistical analysis was determined with a ratio-paired t test. (H) Representative western blot of FLAG-Ndel1 co-immunoprecipitation experiments quantified in G, blotting for α-DHC, α-FLAG, and α-GAPDH. Input loaded is 1% of total cell lysate. (I) Model for CCSer2 delivery to the cortex and spatial regulation of dynein. (Step 1) CCSer2 binds to EB1 to associate with growing microtubule plus-ends to reach the cell periphery. (Step 2) Dynein–Lis1–Ndel1–dynactin form a primed structure that is poised for activation. It is also possible that dynein–Lis1–Ndel1 form a precomplex and dynactin associates after Ndel1 release. We have shown this pre-activation, primed structure on the microtubule, but it is also possible that this structure does not form with dynein bound directly to the microtubule. (Step 3) Ndel1-CCSer2 interaction reduces Ndel1’s affinity for dynein. (Step 4) Ndel1 release of dynein allows Lis1-mediated activation of dynein and dynactin association with dynein intermediate chain. (Step 5) The fully activated transport complex of dynein–dynactin–adaptor forms with adaptors that are already associated with cellular structures where active dynein will be recruited. (Cargo #1) Dynein–dynactin–adaptor complexes form on the actin cortex (adaptor unknown) to reposition the centrosome during migration. (Cargo #2) Dynein–dynactin–adaptor complexes form on early endosomes (likely Hook1 and Hook3) to drive retrograde trafficking. Interaction with adaptors drives dynein localization and activation. (J) Diagram illustrating the proposed tiered regulation of dynein activity. DHC, dynein heavy chain. Source data are available for this figure: SourceData F6.
To ask if CCSer2 could function to regulate Ndel1 in the dynein activation pathway, we tested whether CCSer2650-850 affected Ndel1–dynein or Ndel1-Lis1 binding using a bead-based depletion assay with purified components (Fig. 6, B and C). We observed that dynein–Ndel1 direct binding was reduced in the presence of CCSer2650–850 (Fig. 6 D and Fig. S5 P). In contrast, Ndel1-Lis1 binding was insensitive to the presence of CCSer2650–850 (Fig. 6 E and Fig. S5 Q). Together, this result suggests that CCSer2 negatively regulates Ndel1’s interaction with dynein. This finding is also consistent with previous reports that the C-terminal coiled coil of Ndel1, which binds to CCSer2, also mediates dynein binding (Garrott et al., 2023; Sasaki et al., 2000; Wu et al., 2012; Shen et al., 2008).
How would disfavoring Ndel1–dynein binding promote dynein’s ability to form dynein–dynactin–adaptor complexes? Since dynactin and Ndel1 compete for association with dynein, any factor that facilitates Ndel1–dynein dissociation could function to promote dynein activity if it acted after the initial dynein–Ndel1–Lis1–dynactin complex formed. While it was not possible to ask if CCSer2 specifically acted on Ndel1 within the transient dynein–Ndel1–Lis1–dynactin complex, we could ask if CCSer2 could promote Ndel1’s dissociation from dynein alone. To do this, we affixed microtubules to a glass coverslip and incubated with dynein and Ndel1, resulting in stably bound dynein–Ndel1 complexes. Next, we either flowed in buffer or CCSer2650–850 and monitored dissociation of Ndel1 from dynein using single-molecule TIRF microscopy (Videos 14, 15, 16, and 17). CCSer2650–850 significantly reduced the dwell time of Ndel1–dynein complexes, which supports the hypothesis that CCSer2 could act as a Ndel1 unloading factor (Fig. 6 F). Consistent with our model, we also observed that exogenously expressed FLAG-Ndel1 immunoprecipitated more dynein heavy chains from CCSer2-KO cells than from WT cells (Fig. 6, G and H). These results suggest that in the absence of CCSer2, Ndel1 and dynein remain more tightly associated. Together, these findings support a role of CCSer2 in dynein activation by destabilizing Ndel1–dynein interaction exclusively at the cell periphery.
Related toFig. 6 . Real-time dissociation assay with 0 μM CCSer2. 10 nM Ndel1 labeled with JF647 (magenta channel) washed out with imaging buffer. 2 min total length, 150 ms/frame. Dynein ROIs with Ndel1 bound are white circles. The scale bar is 10 μm.
Related toFig. 6 . Real-time dissociation assay with 0 μM CCSer2. 10 nM Ndel1 labeled with JF647 (magenta channel) washed out with imaging buffer. 2 min total length, 150 ms/frame. Dynein ROIs with Ndel1 bound are white circles. The scale bar is 10 μm.
Related toFig. 6 . Real-time dissociation assay with 2 μM CCSer2. 10 nM Ndel1 labeled with JF647 (magenta channel) washed out with imaging buffer containing 2 µM CCSer2. 2 min total length, 150 ms/frame. Dynein ROIs with Ndel1 bound are white circles. The scale bar is 10 μm.
Related toFig. 6 . Real-time dissociation assay with 2 μM CCSer2. 10 nM Ndel1 labeled with JF647 (magenta channel) washed out with imaging buffer containing 2 µM CCSer2. 2 min total length, 150 ms/frame. Dynein ROIs with Ndel1 bound are white circles. The scale bar is 10 μm.
Snapshots of microtubule and dynein channels associated withVideo 14,. Dynein labeled with Alexa 488 (cyan), and microtubules labeled with Alexa 405 (gray). The two frames are images taken before and after collecting the data in Video 14. Dynein ROIs that lack Ndel1 after washout are green circles, and those with bound Ndel1 are white circles. The scale bar is 10 μm.
Snapshots of microtubule and dynein channels associated withVideo 14,. Dynein labeled with Alexa 488 (cyan), and microtubules labeled with Alexa 405 (gray). The two frames are images taken before and after collecting the data in Video 14. Dynein ROIs that lack Ndel1 after washout are green circles, and those with bound Ndel1 are white circles. The scale bar is 10 μm.
Snapshots of microtubule and dynein channels associated withVideo 15,. Dynein labeled with Alexa 488 (cyan), and microtubules labeled with Alexa 405 (gray). The two frames are images taken before and after collecting the data in Video 15. Dynein ROIs that lack Ndel1 after washout are green circles, and those with bound Ndel1 are white circles. The scale bar is 10 μm.
Snapshots of microtubule and dynein channels associated withVideo 15,. Dynein labeled with Alexa 488 (cyan), and microtubules labeled with Alexa 405 (gray). The two frames are images taken before and after collecting the data in Video 15. Dynein ROIs that lack Ndel1 after washout are green circles, and those with bound Ndel1 are white circles. The scale bar is 10 μm.
Discussion
We set out to discover novel regulatory circuits that gate dynein activity in cellular space. We reasoned that the proteins Lis1 and Ndel1, which are key regulators of dynein localization and activation, may be nodes through which spatial-type information is conveyed to dynein. We used proximity-dependent biotinylation coupled with MS to identify proteins that are positioned to modulate Lis1 and Ndel1 activity. We identified CCSer2, a poorly characterized protein that is in the interactome of both proteins. We found that CCSer2 supports dynein localization at the cell periphery to facilitate dynein-mediated centrosome positioning during cell migration and early endosome trafficking. Disruption of these processes via CCSer2 depletion impairs migration in cell culture models and developing zebrafish. Finally, we showed that CCSer2 binds to Ndel1 and can drive Ndel1–dynein dissociation. We speculate that this ultimately promotes dynein activation and localization by facilitating the obligatory Ndel1 release from a dynein–Ndel1–Lis1–dynactin encounter complex that precedes dynein activation. Because CCSer2 localizes at the cell edge and stabilizes populations of dynein on cargo that reside near the cell edge, its activity represents the first described dynein regulator that activates dynein in a specific cellular space, rather than on a specific cargo.
Our work describing CCSer2 function also explains how Lis1 and Ndel1 activity can be modulated to promote dynein localization and activation. In our model, by functioning locally to activate dynein, CCSer2 effectively “deploys” dynein at the cell cortex, simultaneously promoting its localization and interaction with dynactin and adaptor (Fig. 6 I). Below, we describe our model of how CCSer2 regulates the dynein transport machinery at the cell periphery, as well as highlight outstanding questions.
Step 1: CCSer2 associates with microtubule plus-ends to reach the cell periphery
We showed that CCSer2 localizes to the cell periphery (Fig. 2, A and B; and Fig. S2 F). We speculate that CCSer2 localizes by binding to actin or actin-associated proteins at the cell cortex; however, more work is required to test this. CCSer2 is also a microtubule plus-end tracking protein, and we found that it does not regulate microtubule polymerization rates (Fig. 2, C–E, Fig. S2 G, and Fig. S4 G). We hypothesize that EB1-driven microtubule plus-end localization facilitates the efficient delivery of CCSer2 to the cell edge, as has been hypothesized for other cortical proteins (Fig. 6 I, Step 1) (Taberner and Dogterom, 2019, Preprint; Siegrist and Doe, 2007). However, it is important to emphasize that CCSer2 mutants that cannot bind EB1 and have reduced colocalization to the plus-end still rescue migration defects in CCSer2-KO cells (Fig. 3 H and Fig. S3 V). This suggests either that the overexpression of CCSer2 bypasses the need for plus-end delivery to the cortex or that microtubule association of CCSer2 is not central to its function.
Step 2: Dynein–Lis1 complexes are held in a “primed” conformation by Ndel1
Previous work has shown that Lis1 and Ndel1 enable dynein’s microtubule plus-end localization (Splinter et al., 2012; Yamada et al., 2008; Moon et al., 2014; Lee et al., 2003; Li et al., 2005; Sheeman et al., 2003). Dynactin also localizes to microtubule plus-ends and may promote localization of dynein (Splinter et al., 2012; Moughamian et al., 2013). Interestingly, a recent study has revealed that Lis1 and dynein are trafficked to the plus-end via a different mechanism than dynactin and Ndel1, which may highlight the need to prevent aberrant, mislocalized dynein activation (Fellows et al., 2023). Once at the plus-end, we speculate that a dynein–Ndel1–Lis1–dynactin complex is formed, where dynein and dynactin are scaffolded together by Lis1-Ndel1 (Fig. 6 I, Step 2). It is also possible that a dynein–Ndel1–Lis1 complex forms and dynactin association occurs after Ndel1 unbinding. Because no adaptor is present and because Ndel1 remains associated, this complex likely represents a pre-activation intermediate.
Steps 3–5: CCSer2 disfavors Ndel1 inhibition of dynein, thus facilitating dynein activation and recruitment to the cell periphery
We found that CCSer2 promotes dynein, but not Ndel1, localization to the leading edge (Fig. 5, L–O). How does CCSer2 accomplish this? We showed that CCSer2 binds directly to Ndel1 but does not bind to dynein (Fig. 1, B and E; and Fig. S2, C and E). Our in vitro binding experiments suggest that CCSer2 could function as an “off-loading factor” that promotes dynein–dynactin–adaptor localization by promoting Ndel1’s release of dynein (Fig. 6 I, Step 3). We predict Ndel1-CCSer2 interaction causes Ndel1 to unbind from dynein, which ultimately allows dynein–dynactin–adaptor complexes to form. While in vitro, Ndel1 can spontaneously disassociate from dynein to allow dynactin to bind, we speculate that this could be a regulated step in cells (Yang et al., 2025, Preprint). Because CCSer2 is localized largely at the perimeter, this would specifically enable dynein’s interaction with adaptors that are on cargo at the cell edge (Fig. 6 I, Step 4). This model is appealing because it could explain one way in which aberrant activation of dynein is prevented: if both an adaptor and a Ndel1 off-loading factor are required to form active transport complexes, then dynein activation can be deployed with more spatial and temporal precision.
How does CCSer2 reduce the dynein–Ndel1 binding affinity? We have mapped the Ndel1 region required to bind CCSer2 to the C-terminal half of Ndel1, and high-confidence AlphaFold predictions support these findings (Fig. 1, D and E; and Fig. S1, I–K). Previously, we found that Ndel1’s C-terminal coiled coil contributes to dynein binding and that by removing it, Ndel1–dynein affinity is significantly reduced (Garrott et al., 2023). We hypothesize that CCSer2-Ndel1 binding reduces dynein–Ndel1 interaction by simply sequestering Ndel1’s C-terminal coiled coil away from dynein. Interestingly, the C-terminal coiled coil of Ndel1 is predicted to bind to multiple other proteins that localize at different regions throughout the cell and locally modulate Ndel1 activity (Garrott et al., 2022; Bradshaw et al., 2013). For example, ankyrin-G recruits Ndel1 to the axon initial segment, where Ndel1 plays a role in regulating dynein’s ability to sort somatodendritic cargo, while the interaction between DISC-1 and Ndel1 on mitochondria affects mitochondrial trafficking (Ogawa et al., 2016; Kuijpers et al., 2016). Interestingly, both ankyrin-G and DISC-1 bind Ndel1 in a manner that is reminiscent of how CCSer2 binds, forming helical bundles with Ndel1’s C-terminal coiled coil (Ye et al., 2017, 2020). We propose that these and other proteins likely function as CCSer2 does and bind to the C-terminal coiled coil of Ndel1 to modulate inhibition of dynein activation in specific cellular locations.
Because Ndel1 operates upstream of dynein–dynactin–adaptor binding, CCSer2 regulation of dynein is likely indifferent to the identity of the adaptor. By localizing to the cell perimeter, CCSer2’s activity is spatially restricted and thus only modulates dynein’s access to the subset of adaptors that are already localized on cargos at the cell periphery. Our model predicts that any adaptor that localizes along the cell edge will experience reduced binding to dynein upon CCSer2 depletion. Further discussion of adaptors involved in the processes described in this study is included below.
Outcome 1: Dynein activated at the cell cortex during migration helps to position the centrosome and results in a polarized microtubule network
We showed that CCSer2 promotes dynein localization to the leading edge of migrating cells (Fig. 5, L and M; and Fig. S5 L). Without CCSer2, dynein does not reach the leading edge, cannot position the centrosome, and therefore fails to promote polarization of the microtubule network, resulting in a decrease in directional persistence of migrating cells (Fig. 3, L and M; Fig. 4, C and D; and Fig. 5, L and M). This may contribute to the migration defects observed in the pLL primordium cells and in macrophages when CCSer2 is depleted in zebrafish embryos (Fig. 3, A–F; and Fig. S3, D–F, L, and M). However, some cells in the pLL position the centrosome posterior to the nucleus during migration, which may not require dynein (Luxton and Gundersen, 2011; Pouthas et al., 2008). More work is required to determine the contribution that dynein and CCSer2 have on establishing the centrosome–nucleus axis in pLL cells.
The adaptor required for centrosome positioning during cell migration is not known; however, Par3 is required for dynein activity during this process (Schmoranzer et al., 2009). Indeed, Par3 co-immunoprecipitated dynein and dynactin subunits and promotes their localization to the leading edge (Schmoranzer et al., 2009). Par3 is unlikely to act as a dynein adaptor, as it contains none of the structural hallmarks of any currently identified adaptor. We speculate that Par3 associates with the dynein adaptor responsible for activation during this process because the colocalization of Par3–dynein at the leading edge is dependent on the presence of the light intermediate chain subunit of dynein, which is a key mediator of dynein–adaptor binding (Schmoranzer et al., 2009). More work is required to identify the adaptor required for dynein activation and to establish the interaction network of the dynein transport machinery during cell migration.
Outcome 2: Dynein activation at the cell cortex promotes loading onto and trafficking of early endosomes
We also found that early endosomes display a retrograde-trafficking defect upon CCSer2 deletion (Fig. 5, A and B). Because early endosomes develop from the plasma membrane, the subpopulation of dynein localized near the cell periphery is certainly utilized for the early microtubule-dependent retrograde trafficking of these vesicles. The defects in integrin trafficking observed in the CCSer2-KO cells are likely caused by the impaired retrograde trafficking of endosomes generally and are not specific to integrins. It is also possible that a reduction in dynein-driven retrograde trafficking of early endosomes contributes to polarization defects we observed, as intact retrograde trafficking is required to support cell polarization (Shafaq-Zadah et al., 2016, 2020). Disruption of the movement of endosome cargo likely contributes to the migration defects observed in zebrafish (Fig. 3, A–F; and Fig. S3, D–F, L, and M). Hook1 and Hook3 are the adaptors implicated in early endosome trafficking (Bielska et al., 2014; Zhang et al., 2014; Guo et al., 2016; Olenick et al., 2016; Christensen et al., 2021). Indeed, Hook3 shows striking localization to the cell periphery, which is consistent with its role in dynein-driven endosome trafficking (Kendrick et al., 2019).
CCSer2 activity represents a new lens through which to examine dynein regulation
The function of CCSer2 that we have described here not only reveals how Ndel1 can support dynein localization and activation, but it also provides a new archetype for how ubiquitously expressed motor machinery can be activated with spatial specificity. CCSer2, by modulating Ndel1–dynein binding exclusively at the cell periphery, functions as a localized activator of dynein motility. Our work also suggests that dynein activation is controlled by a multitiered regulatory network. By this view, dynein, dynactin, and adaptors are the core trafficking machinery that resides in the first regulatory tier, while Lis1 and Ndel1 represent second-tier regulators whose function is to control dynein–dynactin–adaptor association and thus activation (Fig. 6 J). The proposed activity of CCSer2 constitutes a third regulatory tier, whose function is to control Ndel1 and Lis1’s ability to act on the core trafficking machinery in specific cellular regions (Fig. 6 J). We speculate that there are other third-tier regulatory proteins that function like CCSer2 for other dynein cargo types. Further, our findings offer insight into a long-standing question in the field of dynein research: how can a single dynein motor traffic all retrograde moving cargo with spatial and temporal precision? We suggest that precise activation of dynein motility is achieved by regulation in multiple dimensions, where the localization of dynein adaptors and proteins that modulate Ndel1–dynein contributes to tunable dynein activation on specific cargo in discrete cellular microenvironments.
Materials and methods
Cloning and plasmid construction
All constructs were generated with isothermal assembly as described previously (Gibson et al., 2009). The constructs used in this study can be found in Table S1.
Cell culture and transfection
All cell lines were cultured with 1X DMEM (Corning) with 10% FBS (Gibco) and 1% penicillin/streptomycin (Gibco) at 37°C with 5% CO2. Stable BioID-fusion cell lines were cultured with 50 µg/ml hygromycin B, and CCSer2 knock-in U2OS cells were cultured with 1.5 µg/ml of puromycin. Stable HEK293 cells expressing the Halo-tagged p62 subunit of dynactin were cultured with 50 µg/ml hygromycin B. The cells were passaged every 3–4 days using 0.25% trypsin–EDTA (Thermo Fisher Scientific) and incubated at 37°C for 3–5 min to detach cells.
All cell lines were tested for Mycoplasma contamination using the MycoAlert (Lonza) detection kit every 3–6 mo. For transfections, 60,000–120,000 cells were plated per well of a 6-well tissue culture–treated plate (Fisherbrand) and allowed to adhere overnight. The cells were then transfected with either Lipofectamine 2000 (Thermo Fisher Scientific), Lipofectamine LTX and PLUS reagents (Thermo Fisher Scientific), or polyethylenimine hydrochloride (PEI; Sigma-Aldrich) in 1X Opti-MEM (Gibco), according to the manufacturer’s instructions. For CRISPR-Cas9 KO generation, immunofluorescence, and live imaging experiments, each well was transfected with 0.5 µg of plasmid DNA. For co-immunoprecipitation experiments, the transfection was optimized for high efficiency and consistency by altering the plasmid concentration. All overexpression experiments were assessed 48 h after transfection.
Proximity-dependent biotinylation–MS acquisition and analysis
All cell line generation and sample preparation were performed as previously described (Redwine et al., 2017). Briefly, stable cell lines were made from Flp-In T-REx293 cells (Thermo Fisher Scientific), which constitutively express the Tet repressor. To generate stable cell lines, cells were transfected with Lipofectamine 2000 (Thermo Fisher Scientific) and a combination of the appropriate Lis1 or Ndel1 BioID-fusion construct and pOG44, which expresses flippase. After recovery, stable cell lines were selected with media supplemented with 50 µg/ml hygromycin B. Colonies were isolated, expanded, and screened for the expression of the fusion proteins by western blotting with an anti-FLAG M2-HRP antibody (Sigma-Aldrich).
For BioID experiments, low passage cells were plated at 20% confluence in 15-cm dishes as four replicates, with each replicate consisting of 4 × 15 cm plates. After 24 h, biotin was added to the media to a final concentration of 50 µM, and the cells were incubated for 16 h. After removing the media, cells were removed from each plate by pipetting with ice-cold PBS and harvested via centrifugation at 1,000 g for 2 min. Cells were washed once more with ice-cold PBS. To lyse, cells were resuspended in 8 ml RIPA buffer (50 mM Tris–HCl, pH 8.0; 150 mM NaCl, 1% [vol/vol] NP-40, 0.5% [wt/vol] sodium deoxycholate, 0.1% [wt/vol] SDS, 1 mM DTT, and protease inhibitors [cOmplete Protease Inhibitor Cocktail; Roche]) by gentle rocking for 30 min at 4°C. The cell lysate was clarified via centrifugation at 30,000 rpm for 30 min in a Type 70 Ti rotor (Beckman Coulter) at 4°C. The clarified lysate was retrieved and incubated with 0.5 ml of streptavidin-conjugated beads (Dynabeads MyOne Streptavidin T1) and incubated overnight at 4°C with gentle rocking. Bead/lysate mixtures were collected on a magnetic stand, and beads were then washed three times with 2 ml RIPA buffer. To elute immobilized proteins, the beads were boiled for 10 min at 100°C in 100 μl elution buffer (50 mM Tris, pH 6.8, 2% SDS [wt/vol], 20 mM DTT, 12.5 mM EDTA, 2 mM biotin). 90 μl of eluant was diluted to a final volume of 400 μl with 100 mM Tris–HCl, pH 8.5. 100 μl 100% trichloroacetic acid was then added, and the solution was incubated overnight at 4°C. The precipitated sample was collected by centrifugation at maximum speed in a microcentrifuge for 30 min at 4°C. The pellet was washed twice with 500 μl ice-cold 100% acetone. After removing the final acetone wash, the pellet was dried in a laminar flow cabinet for 30–60 min.
The samples were digested according to the FASP protocol using a 10 kDa molecular weight cutoff (MWCO) filter. In brief, the samples were mixed in the filter unit with 8 M urea, 100 mM M ammonium bicarbonate (AB), pH 8.0, and centrifuged at 14,000 g for 15 min. The proteins were reduced with 10 mM DTT for 30 min at RT, centrifuged, and alkylated with 55 mM iodoacetamide for 30 min at RT in the dark. Following centrifugation, samples were washed three times with urea solution, and three times with 50 mM AB, pH 8.0. Protein digestion was carried out with sequencing grade modified trypsin (Promega) at 1/50 protease/protein (wt/wt) at 37°C overnight. Peptides were recovered from the filter using 50 mM AB. Samples were dried in SpeedVac and desalted and concentrated on Thermo Fisher Scientific Pierce C18 Tip.
Samples were analyzed on an LTQ Orbitrap Velos mass spectrometer (Thermo Fisher Scientific) coupled with an Eksigent nanoLC-2D system through a nanoelectrospray LC-MS interface. A volume of 8 μl of sample was injected into a 10 μl loop using an autosampler. To desalt the sample, the material was flushed out of the loop, loaded onto a trapping column (ZORBAX 300SB-C18, dimensions 5 × 0.3 mm × 5 μm), and washed with 0.1% formic acid at a flow rate of 5 μl/min for 5 min. The analytical column was then switched online at 0.6 μl/min over an in-house-made 100 μm i.d. × 200 mm fused silica capillary packed with 4 μm 80 Å Synergi Hydro C18 resin (Phenomenex). After 10 min of sample loading, the flow rate was adjusted to 0.35 ml/min, and each sample was run on a 90-min linear gradient of 4–40% acetonitrile with 0.1% formic acid to separate the peptides. LC mobile phase solvents and sample dilutions used 0.1% formic acid in water (buffer A) and 0.1% formic acid in acetonitrile (buffer B) (Chromasolv LC-MS grade; Sigma-Aldrich). Data acquisition was performed using the instrument-supplied Xcalibur (version 2.1) software. The mass spectrometer was operated in the positive ion mode. Each survey scan of m/z 400–2,000 was followed by collision-assisted dissociation (CAD) MS/MS of 20 most intense precursor ions. Singly charged ions were excluded from CAD selection. Doubly charged and higher ions were included. Normalized collision energies were employed using helium as the collision gas.
MS/MS spectra were extracted from raw data files and converted into .mgf files using Proteome Discoverer Software (ver. 2.1.0.62). These .mgf files were then independently searched against human database using an in-house Mascot server (version 2.6, Matrix Science). Mass tolerances were ±10 ppm for MS peaks and ±0.6 Da for MS/MS fragment ions. Trypsin specificity was used allowing for 1 missed cleavage. Methionine oxidation, protein amino-terminal acetylation, amino-terminal biotinylation, lysine biotinylation, and peptide amino-terminal pyroglutamic acid formation were all allowed as variable modifications, while carbamidomethyl cysteine was set as a fixed modification. Scaffold (version 4.8, Proteome Software) was used to validate MS/MS-based peptide and protein identifications. Peptide identifications were accepted if they could be established at >95.0% probability as specified by the Peptide Prophet algorithm. Protein identifications were accepted if they could be established at >99.0% probability and contained at least two identified unique peptides.
CRISPR-Cas9 knockout cell line generation and validation
Guide sequences targeting exon 2 of CCSer2 were designed using CCTop Tool (Stemmer et al., 2015). Guides (Table S3) were inserted into a px459 plasmid from the Zhang Lab using Bbs1 digestion as described previously (Ran et al., 2013). To generate KOs, U2OS WT cells were thawed and allowed to recover from freezing before plating 120,000 cells per well in a 6-well dish. The next day, cells were transfected with the px459 vector with or without CCSer2 guides, and one well was reserved for nontransfection control. Cells were allowed to grow for 1 day. Cells were then treated with 1 µg/ml puromycin to select for transfection. After complete cell death was achieved in the nontransfected well, the media were replaced with media lacking puromycin. After three days of clonal expansion, cells were collected for a surveyor assay and plated at a limiting dilution in 96-well dishes to select for individual cells. gDNA was collected from the cells transfected with px459 using the DNeasy kit (Qiagen), and PCR amplification followed by T7 endonuclease digestion confirmed that the guides cut efficiently. Only colonies from single cells were chosen for further amplification. Each clone was then screened for CCSer2-KO via western blot. To further confirm KO, cDNA was harvested from the isogenic KO cell lines and used for PCR amplification of the region surrounding the guide targeting site (Table S3). The generated PCR product was sequenced, and the sequencing results were analyzed using ICE Analysis (Synthego). To characterize the indels generated on each allele, PCR products generated for ICE analysis were TOPO (Thermo Fisher Scientific)-cloned and sequenced as described previously (Yamaji and Hanada, 2014). To ensure we captured every allele, we analyzed 30 TOPO clones.
Co-immunoprecipitation
60,000 U2OS cells were seeded per well of a 6-well dish and allowed to adhere overnight. Two wells of the 6-well dish were transfected with either vector control, CCSer2WT, or CCSer2ΔCC using Lipofectamine LTX. The next day, the duplicate wells per sample were combined and replated onto a 10-cm TC-treated dish. Cells were allowed to grow for an additional day to reach confluency. Then, the cells were incubated for 10 min on ice with 1 ml of ice-cold Co-IP lysis buffer (30 mM HEPES [pH 7.4], 50 mM KOAc, 0.1% Triton X-100, 1 mM DTT, 0.5 mM Mg-ATP, 2 mM MgOAc, 1 mM EGTA, 10% glycerol, 1× Protease Inhibitor Cocktail [Roche]) and lysed with cell scrapers (Fisherbrand). Lysates were collected and centrifuged at max speed for 15 min at 4°C in a table-top microcentrifuge. 100 μl of the supernatant was reserved for input, and the remaining 900 μl was incubated with 30 μl of washed anti-FLAG resin (A2220; Sigma-Aldrich) for 4 h with rocking at 4°C. After incubation, samples were spun down at 10,000 g for 1 min and the beads were washed four times with 1 ml cold Co-IP lysis buffer. After the final wash, beads were resuspended with 4X NuPAGE sample buffer (Thermo Fisher Scientific), 10% BME, and Co-IP lysis buffer to a volume of 100 μl. The samples were boiled for 5 min at 95°C and then used immediately for western blotting or frozen and stored at −20°C.
Western blot
Samples from lysate or co-immunoprecipitation were loaded on a 4–12% Bis-Tris NuPAGE gel (Thermo Fisher Scientific) and ran at 180 V for 60 min in 1× MOPS buffer (Thermo Fisher Scientific). The protein gels were then transferred onto methanol-hydrated PVDF membranes (Amersham) for 3 h with 300 mAmps at 4°C. Membranes were blocked with 5% nonfat milk in 1× TBST (Tris buffer saline with 0.05% Tween-20) with rocking for 30 min at room temperature. Membranes were then washed quickly with 1× TBST, and primary antibodies diluted at various concentrations (Table S2) in 5% nonfat milk in 1× TBST were added to the membranes and incubated with rocking at 4°C overnight. After incubation, membranes were washed extensively with 1× TBST before incubating with HRP-conjugated secondary antibodies for 1 h at room temperature. Secondary antibodies were diluted at varying concentrations in 5% nonfat milk in 1× TBST (Table S2). Membranes were washed extensively with 1× TBST before visualization with either SuperSignal West Femto reagent (Thermo Fisher Scientific) or Clarity ECL reagent (Bio-Rad) on the ChemiDoc imaging system (Bio-Rad). Western blot bands were quantified with densitometry using FIJI.
Immunofluorescence
#1.5 22 × 22 mm coverslips (Corning) were washed in 100% ethanol and allowed to dry vertically in a 6-well dish. The coverslips were coated with either 1× fibronectin human plasma (Sigma-Aldrich) or poly-D-lysine (20 µg/ml), incubated for 45 min at 37°C, washed with 1× PBS, and then allowed to dry completely or washed with 1× DMEM, respectively. Cells were plated at varying densities, depending on the downstream experimental requirement. Cells were fixed with either 100% ice-cold methanol for 5 min on ice or 4% PFA for 15 min at room temperature. After fixation, cells were washed with 3 ml 1× PBS two times. Fixed cells were then blocked and permeabilized for 1 h at room temperature while rocking with 1 ml of blocking buffer (0.3% Triton X-100 and 5% normal goat serum [Cell Signaling Technology] in 1× PBS) and were washed quickly with 3 ml 1× PBS. Primary antibodies were diluted in an antibody dilution buffer (0.1% Triton X-100 and 0.5% BSA in 1× PBS) at varying concentrations (Table S2). The cells were incubated with the primary antibodies for 1 h at room temperature. The coverslips were then washed extensively with 1× PBS for at least 15 min. Secondary antibodies and F-actin phalloidin probes (Cayman Chemical) were diluted in antibody dilution buffer. The cells were incubated with the secondary antibodies and protected from light for 1 h at room temperature. Stained coverslips were then washed quickly with 3 ml 1× PBS. The cells were then treated with 1 ml DAPI (1 µg/ml; Invitrogen) diluted in 1× PBS for 5 min, protected from light. The coverslips were then washed extensively with 1× PBS for at least 20 min. Washed coverslips were then mounted onto glass slides using one drop of ProLong Gold Antifade Mountant (Thermo Fisher Scientific). Finally, the slides were cured for 24 h in the dark and sealed with clear nail polish.
Confocal microscopy data acquisition
Cell imaging was performed with an inverted microscope (Nikon, Ti2-E Eclipse) with 10 × 0.45 N.A. or 20 × 0.75 N.A. air objectives or 60× 1.40 N.A. oil immersion objective (Nikon, Apo). The microscope was equipped with a LUNF-XL laser launch (Nikon), with 405-, 488-, 561-, and 640-nm laser lines. The excitation path was filtered using an appropriate quad band-pass filter cube (Chroma). The emission path was filtered through appropriate emission filters (Chroma) located in a high-speed filter wheel (Finger Lakes Instrumentation). Emitted signals were detected on Photometrics Prime 95B sCMOS Camera. Image acquisition was controlled by NIS-Elements Advanced Research software (Nikon).
Statistical analysis
All statistical analyses were performed in GraphPad Prism. The exact statistical tests used, n value, and number of biological replicates are noted in the figure legend. Statistical significance: ns, P > 0.1234; *, P ≤ 0.0332; **, P ≤ 0.002; ***, P ≤ 0.0002; ****, P ≤ 0.0001.
Plasma membrane enrichment
To determine whether CCSer2 displayed plasma membrane enrichment, WT U2OS cells transfected with CCSer2WT using PEI were plated at low confluency on fibronectin-coated coverslips. The cells were then fixed with 4% PFA, stained for GFP and microtubules, and imaged with a spinning disk confocal microscope. Full volumes of cells were imaged by first identifying the top of each cell, then the bottom, then acquiring Z-slices at 0.2-µm steps. All analysis was performed in FIJI. A custom macro was written to partially automate the analysis. Using the GFP channel, the perimeter of the cell was outlined. An ROI band containing 2 µm on the interior of the perimeter and 0.25 µm outside the perimeter was generated, and the intensity within this 2.25 µm perimeter band was measured in both the GFP and microtubule channels. To measure the cytoplasmic intensity, an ROI was generated that only included the area within the inner perimeter line. The ratio of the perimeter intensity to the cytoplasmic intensity was reported for both GFP-CCSer2 and microtubules. Only cells that were ∼98% in the field of view and not touching another cell on at least 75% of the perimeter were included in the analysis.
+Tip analysis
To monitor plus-end localization of overexpressed CCSer2WT, CCSer2-SxNNALL, and CCSer2-SxNN1,4, U2OS cells were transfected with 0.5 µg of plasmid using Lipofectamine LTX reagent (Thermo Fisher Scientific) as per the manufacturer’s instruction. 24 h after transfections, cells were replated on into an 8-well live imaging dish (Thermo Fisher Scientific) coated with fibronectin. 24 h after replating, cells were imaged via spinning disk confocal for 60 s, 1 fps at 37°C, and 5% CO2. All analysis was performed in FIJI. Maximum intensity projections of the first 15 frames of each movie were made and used for subsequent analysis. Whenever possible, the cell area was determined by manually thresholding each image. The perimeter was selected with the magic wand tool, and area was measured. Next, all visible comets were counted manually in any cell where at least three comets were visible. Cells with excessive aggregation of CCSer2 constructs or no visible comets were excluded from the analysis. The number of comets counted for each cell was divided by area to get a measure of the density of comets per cell. Given the inherently subjective nature of this analysis, all analysis steps were performed blindly.
Cell shape analysis
To assess the elongated cell morphology we observed, WT and CCSer2 KO cells were transfected with either vector, CCSer2WT, CCSer2ΔCC, or CCSer2-SxNNALL using Lipofectamine LTX and PLUS reagents (Invitrogen) and plated at low density onto PDL-coated coverslips. Cells were fixed in 4% PFA, stained for actin with phalloidin-647, and imaged with a 20× objective spinning disk confocal microscope. Full volumes of cells were imaged by first identifying the top of each cell, then the bottom, then acquiring Z-slices at 0.9-µm steps. All analysis was performed in FIJI. A custom macro was written to partially automate the analysis. To begin, the actin channel was background-subtracted and a Gaussian blur was applied, and then, thresholding was used to identify individual cells. At this point, if two clearly individual cells were connected after thresholding by <25% of their cell periphery, then a black pencil-drawn line was used to separate them. Only cells that were ∼98% in the field of view and not overlapping each other were included in the analysis. The magic wand tool was used to generate an ROI of each individual cell in the field of view. The circularity of each cell was then measured with the “shape descriptors” measurement in FIJI. The average circularity of the cells within one field of view was reported for each n.
Projection behavior during nondirected cell migration
To assess the migratory behavior of individual cells during nondirected migration, ∼11,000 cells of either WT or CCSer2 KO cells were plated per well of an 8-well live imaging dish (Thermo Fisher Scientific) coated with fibronectin. 24 h after plating, the cells were set up in an environmental chamber set at 37°C with 5% CO2 on a spinning disk confocal and allowed to acclimate for 30 min prior to imaging. Cells were imaged in DIC with a 20X objective for 24 h at 1 frame per 3 min. All analysis was performed in Nikon NIS-Elements software. From the 24-h live imaging of WT and CCSer2-KO cells, the length and number of cellular projections made were quantified. For each cellular projection that was thinner than 10 µm and existed for at least 18 min, the maximum length was quantified by drawing a line segment from the base of the projection (at 10 µm thick) to the end of the projection. The percentage of cells that formed projections within the 20X field of view was measured by dividing the number of cells that created at least one projection by the total number of cells in the field of view at the last frame of the movie. To quantify the mean speed of individual cell migration, particle tracking was performed using the TrackMate plugin in FIJI (Ershov et al., 2022). The nuclei were selected with the LoG detector using the parameters of 30 µm particle diameter and 0.05 quality cutoff. Once all nucleus particles were identified, they were tracked with the LAP Tracker. The max frame–frame linking distance was set to 20 µm with a quality penalty of 5. The max gap closing distance was set to 10 µm, and the max frame gap was 2 with a quality penalty of 5. Filters were then applied to select for tracks that had a displacement above 30 µm and a total distance traveled of above 120 µm. Then, the tracks were exported and the mean speed of each cell was extracted and plotted.
Particle tracking—nucleus tracking and directional persistence analysis
To monitor the directional persistence of individual cells during directed collective migration, ∼50,000 cells of either WT or CCSer2 KO cells were plated per well of a 2-well silicone insert (Ibidi) in an 8-well live imaging dish (LabTek II; Thermo Fisher Scientific) coated with fibronectin. 24 h after plating, cells were incubated with 250 nM SiR-DNA dye in 1× DMEM for 4 h to stain the nuclei. The 2-well inserts were removed carefully with tweezers, and the wells were gently washed twice with 1× PBS and then incubated with 1× DMEM with 100 nM SiR-DNA dye. Cells were set up in an environmental chamber set at 37°C with 5% CO2 on a spinning disk confocal and allowed to acclimate for 30 min after removal of the insert. Four fields of view per well were imaged with a 10× objective for 24 h at 1 frame per 3 min. All analysis was performed in FIJI. First, a 400 × 1,064 µm rectangle ROI was drawn to encompass one-half of the wound. All particle tracking was performed with the TrackMate plugin in FIJI (Ershov et al., 2022). The nuclei were identified with the LoG detector. The particle diameter was set to 20 µm, and the quality was set to 0.2 to select all nuclei within the field of view. The LAP Tracker was used to track nucleus movements. The max frame–frame linking distance was set to 20 µm with a quality penalty of 5. The max gap closing distance was set to 30 µm, and the max frame gap was 2 with a quality penalty of 5. The cell tracks were then filtered by total distance traveled (above 70 µm), displacement (above 70 µm), and mean × position (±52 µm, depending on the orientation of the wound). All track data were exported, and then, the directionality ratio (called confinement ratio in TrackMate) of each cell path was extracted and averaged per field of view. The directionality ratio is defined as the net displacement divided by the total distance the cell has migrated.
To quantify the mean squared displacement (MSD) for WT and KO migrating cells, we used the MATLAB class, @msdanalyzer, that extracted the MSD of the tracks initially generated with the Fiji plugin TrackMate, from the first 300 frames (15 h) of the data shown in Fig. 3, L and M (Tarantino et al., 2014). The mean MSD of the tracks in each field of view (∼75–90 tracks) was then computed and plotted over time for 20 fields of view across two biological replicates. Further, we transformed the MSD data into a log–log plot by graphing the log(MSD) over log(Time) for each field of view and applied a linear regression to the data. MSD plots can be estimated by the function MSD(t) ∼ tµ where the exponent µ (also called alpha) is calculated by taking the slope of the log–log-transformed plot (Romano et al., 2022).
To assess the speed of collective cell migration during wound healing, the experimental setup was the same as above. Four fields of view per well were imaged in DIC with a 10× objective for 24 h at 1 frame per 3 min. All analysis was performed in FIJI. The speed of both sides of the wound was calculated and then averaged to get the speed of wound closure per field of view. At time zero, a line was drawn down the center of the wound and at the leading edge of one-half of the wound. The distance between these two lines was calculated. Once the cells crossed the threshold of the center line, the time was recorded. The distance traveled in microns over the time for the sheet of cells to close the wound was reported as the speed of wound closure. This analysis was repeated on the other half of the wound, and the speed was averaged for both collectively migrating sheets of the wound.
Anaphase onset analysis
To monitor the mitotic progression in WT and CCSer2 KO cells, ∼11,000 cells of either WT or CCSer2 KO cells were plated per well of an 8-well live imaging dish (Thermo Fisher Scientific) coated with fibronectin. 24 h after plating, the cells were set up in an environmental chamber set at 37°C with 5% CO2 on a spinning disk confocal and allowed to acclimate for 30 min prior to imaging. Cells were imaged in DIC with a 20× objective for 24 h at 1 frame per 3 min. All analysis was performed in FIJI. From the 24-h live imaging of WT and CCSer2-KO cells, each cell that completed cell division within the time constraints of the movie was analyzed. Using a mitotic phase guide created from WT U2OS cells before starting the analysis, the time from the beginning of prophase to the first separation of the chromosomes during anaphase was recorded.
Wound-healing and polarization assays
Cell polarity assays were performed largely as described previously (Palazzo et al., 2001; Liang et al., 2007a). Briefly, 70,000 cells were seeded onto fibronectin-coated coverslips and were allowed to acclimate overnight at 37°C with 5% CO2. Cells at confluency were then starved for 24 h in 3 ml DMEM starvation media (1× DMEM with 1% penicillin/streptomycin and no FBS) to synchronize cells. Starved cells were then washed with 3 ml 1X PBS (Gibco) and scratched with a p200 tip in a cross pattern. 3 ml of migration media (1× DMEM with 1% FBS, and 1% penicillin/streptomycin) was then added to each well. The wounded cells were allowed to migrate for 0 or 4 h at 37°C with 5% CO2 before fixation with either methanol or 4% PFA. After fixation, cells were washed with 3 ml 1X PBS three times and prepared for immunofluorescence as previously described using antibodies against GM130, γ-tubulin, and α-tubulin (Golgi, centrosome, and microtubules, respectively), and the actin probe, phalloidin. Slides were imaged on a spinning disk confocal microscope with a 60× objective. Full volumes of cells were imaged by first identifying the top of each cell, then the bottom, then acquiring Z-slices at 0.2-µm steps. All analysis was done in FIJI. A custom macro was written to partially automate the analysis. Briefly, the angle of the wound is defined by the user with the line tool. Then, an ellipse is placed to contain the nucleus and Golgi apparatus, or centrosome, of one cell. The nucleus is then selected with autothresholding, and the nuclear centroid is identified. Lines are drawn 360° about the centroid to connect to the ellipse. The intensity in the Golgi, or centrosome, channel is measured across each line, and only lines that contain intensity above the background of the cell are kept. The angles of the lines containing Golgi, or centrosome, signal are normalized to the angle of the wound. Then, these angles are combined for all cells per sample and plotted in MATLAB as a rose histogram, with 90° being perpendicular to the wound (toward the direction of the wound).
Integrin intensity at FA analysis
To quantify the β-integrin intensity at FAs, cells plated at low confluency on fibronectin-coated coverslips were fixed in 4% PFA and stained for integrins, FAs, actin, and the nucleus (anti-β-integrin, anti-paxillin, phalloidin, and DAPI, respectively). Slides were imaged at 60X on a spinning disk confocal microscope. All analysis was performed in FIJI, and a custom macro was created to help automate the analysis. Briefly, the user defines the cell periphery, and then, the nucleus is selected as an ROI and enlarged. An ROI is created between the nucleus and the cell periphery to select the cytosolic region. In the paxillin channel, the FAs are selected with manual thresholding followed by particle analysis to generate the FA ROI. The FA ROI is then subtracted from the cell periphery ROI (which excludes the nuclear region) to generate the outside FA ROI. Finally, the cell periphery ROI, FA ROI, and outside FA ROI are measured in the β-integrin channel. The raw values are reported, as well as the relative enrichment at FAs (FA ROI/cell periphery ROI) and the relative enrichment outside FAs (outside FA ROI/cell periphery ROI) for both WT and CCSer2 KO cells.
Particle tracking—integrin vesicle trafficking analysis
To monitor integrin-containing vesicle movements, U2OS WT and CCSer2 KO cells were transfected with mCherry-α5-integrin-12 in a 6-well dish using Lipofectamine LTX. 24 h after transfection, ∼65,000 cells were replated per well of an 8-well live imaging dish (Thermo Fisher Scientific) coated with fibronectin. 24 h after replating, confluent cells were scratched with a p200 pipette tip, and washed twice with 1x PBS and once with warmed Live Cell Imaging Solution (Invitrogen). Cells were imaged an hour after wounding via spinning disk confocal with a 60× objective for 2 min at 2 fps in an environmental chamber set at 37°C with 5% CO2. All analysis was performed in FIJI. A custom macro (provided by the Salogiannis lab at the Department of Molecular Physiology and Biophysics, Larner College of Medicine, University of Vermont) was written to semi-automate the analysis prior to using the TrackMate plugin. Each movie was oriented with the cells migrating toward the bottom of the image. In this way, vesicles moving downward are trafficked in the anterograde direction and vesicles moving upward are trafficked in the retrograde direction. The background was subtracted with a 50-pixel rolling ball radius, the contrast was increased to a saturation point of 0.35, and the movie was converted to a 32-bit movie. Next, using the line tool, a 5-µm line was drawn through an individual vesicle on the cell periphery so that the vesicle is centered on the line. From the plot profile of the line, we fitted a Gaussian curve and identified the d parameter. A Gaussian blur in scaled units was applied to the movie using the measured d parameter as the radius. Then, the Mexican Hat Filter plugin was applied to the movie with a radius of 2. To limit the analysis to one cell, an ROI was drawn to isolate the space between the nucleus and the leading edge of a single cell. All tracking was performed with the TrackMate plugin in FIJI (Ershov et al., 2022). The integrin vesicles were identified with the LoG detector. The particle diameter was set to 0.6, and the quality was set between 15 and 30 to select all vesicles within the ROI. The LAP Tracker was used to track integrin vesicles. The max frame–frame linking distance was set to 3 µm with a quality penalty of 5. The max gap closing distance was set to 2 µm, and the max frame gap was 1 with a quality penalty of 5. The tracks were then filtered by linearity of forward progression (above 0.1), displacement (above 1 µm), and duration (above 5 s). All track data were exported, as well as the MotilityLab spreadsheet data, which included the XY positions of each spot within the tracks. A custom macro was written in Excel to calculate the sign of the y-value track displacement, by subtracting the final y-position from the starting y-position of each track. Vesicle tracks were sorted by sign with a negative y displacement having traveled in the retrograde direction and a positive y displacement having traveled in the anterograde direction. The following data were extracted and reported from TrackMate: directional change rate, percentage of retrograde events, and the max speed, displacement, and mean speed. , where αi,i+1 is the angle between consecutive points in a given track, and N is the total number of points per track. Tracks (>5 µm) from an example WT or KO cell were plotted using MATLAB.
Particle tracking—EB1-GFP microtubule plus-end growth analysis
To monitor microtubule growth, U2OS WT and CCSer2 KO cells were transfected with EB1-GFP in a 6-well dish using Lipofectamine LTX. 24 h after transfection, ∼15,000 cells were replated per well of an 8-well live imaging dish (Thermo Fisher Scientific) coated with fibronectin. 24 h after replating, cells were imaged via spinning disk confocal with a 60× objective for 1 min at 1 fps in an environmental chamber set at 37°C with 5% CO2. All analysis was performed in FIJI. A custom macro (provided by John Salogiannis) was written to semi-automate the analysis prior to using the TrackMate plugin. The background was subtracted with a 50-pixel rolling ball radius, the contrast was increased to a saturation point of 0.35, and the movie was converted to a 32-bit movie. Next, using the line tool, a 5-µm line was drawn through an individual vesicle on the cell periphery so that the vesicle is centered on the line. From the plot profile of the line, we fitted a Gaussian curve and identified the d parameter. A Gaussian blur in scaled units was applied to the movie using the measured d parameter as the radius. Then, the Mexican Hat Filter plugin was applied to the movie with a radius of 2. An ROI was drawn to limit the analysis to a single cell. All tracking was performed with the TrackMate plugin in FIJI. The EB1 puncta were identified with the LoG detector. The particle diameter was set to 0.5, and the quality was set between 15 and 30 to select all plus-ends within the ROI. The LAP Tracker was used to track EB1 plus-ends. The max frame–frame linking distance was set to 2 µm with a quality penalty of 5. The max gap closing distance was set to 2 µm, and the max frame gap was 2 with a quality penalty of 5. The tracks were then filtered by linearity of forward progression (above 0.5), displacement (above 1 µm), and duration (above 5 s). Then, the mean speed of individual tracks was exported from TrackMate, and the mean plus-end growth speed was reported per cell.
Nocodazole washout FA size analysis
Cells were seeded at 25% confluency (300,000 cells) and were allowed to acclimate overnight at 37°C with 5% CO2. The next day, the media were replaced with warmed starvation media (1X DMEM with 1% penicillin/streptomycin, no FBS) and incubated at 37°C with 5% CO2 overnight. The next day, the media were changed to starvation media with 1 mM nocodazole (AdipoGen Life Sciences) and incubated for 4 h at 37°C with 5% CO2. Cells were then washed three times with 3 ml of warmed starvation media and allowed to incubate at 37°C with 5% CO2 for 15 min before fixing in 1 ml 4% PFA for 15 min at room temperature. For the no washout condition, the cells were fixed in 1 ml 4% PFA for 15 min at room temperature immediately following the 4-h nocodazole incubation. After fixation, cells were washed with 3 ml 1X PBS three times, prepared for immunofluorescence, and probed for FAs, microtubules, and nuclei (anti-paxillin, anti-tubulin, and DAPI, respectively). Images were collected on an X1 spinning disk microscope with a 60× objective. All analysis was performed in FIJI. A custom macro was used to quantify the FA area. Briefly, the paxillin channel is thresholded (manually set, but applied to all data) and the analyze particles feature in FIJI is used to select and measure all FAs in the field of view. The mean area of FAs in WT and CCSer2 KO cells is reported at 0 min after washout and 15 min after washout (normalized by the mean area at 0 min).
Actin-bundling analysis during migration
To assess actin morphology at the leading edge during migration, cells at confluency on fibronectin-coated coverslips were wounded and allowed to migrate for 4 h before fixation in 4% PFA. Cells were permeabilized and blocked as explained above and then probed for actin and nuclei with phalloidin and DAPI, respectively. Imaging was performed on an X1 spinning disk microscope equipped with a 60× objective. All analysis was done in FIJI. The custom macro written for the cargo distribution analysis (below) was used for the actin-bundling distribution analysis.
Cargo distribution and EGF localization analysis
To assess the radial localization of different organelle cargos inside the cell, WT and CCSer2 KO cells were fixed in 4% PFA and stained for the Golgi apparatus, mitochondria, ER, early endosomes, lysosomes, and actin with anti-GM130, TOM20, PDI, EEA1, LAMP1 antibodies, and a phalloidin 647 probe, respectively. Cells were imaged with a 60× objective on a spinning disk confocal microscope. Full volumes of cells were imaged by first identifying the top of each cell, then the bottom, then acquiring z-slices at 0.2-µm steps. All analysis was done in FIJI. A custom macro was written to automate the analysis. First, a single cell was cropped using the rectangle tool. The channels were then split, and the nucleus was identified and selected using automated thresholding and particle analysis tools. Next, the cell periphery was traced in the actin channel and saved as an ROI. From the centroid of the nucleus, lines were drawn to connect to the cell perimeter radially in intervals of 1°. The length of each line was measured, and only lines longer than half of the maximum line were kept for analysis. The intensity across each line in the selected cargo channel was measured and binned into 20 sections. Finally, each bin value was averaged across all the line measurements so that a fractional intensity distribution profile was created for one cell. These distribution profiles were then combined across cells and bioreplicates to generate a final normalized plot.
To assess the radial localization of EGF-555 puncta inside the cell, WT and CCSer2 KO cells were treated with EGF-555 ligand for 5 min and chased for either 0 or 30 min. Cells were washed extensively with 1× PBS and fixed in 4% PFA, and stained for actin with a phalloidin 647 probe. Cells were imaged with a 60× objective on a spinning disk confocal microscope. Full volumes of cells were imaged by first identifying the top of each cell, then the bottom, then acquiring z-slices at 0.2-µm steps. All analysis was done in FIJI. The custom macro written for the cargo distribution analysis was used for the EGF-555 localization. The distribution profiles generated were compiled across cells and bioreplicates to generate a final normalized plot of EGF-555 distribution 5 or 30 min after treatment.
Early endosome mean intensity analysis
To quantify the total mean intensity of early endosomes per cell, WT and CCSer2 KO cells were fixed in 4% PFA, and stained for early endosomes and actin with an anti-EEA1 antibody and a phalloidin 647 probe, respectively. Cells were imaged with a 60× objective on a spinning disk confocal microscope. Full volumes of cells were imaged by first identifying the top of each cell, then the bottom, then acquiring z-slices at 0.2-µm steps. All analysis was done in FIJI. A custom macro was written to automate the analysis. First, using the freehand tool, the cell periphery of one cell is traced in the actin channel and saved as an ROI. The cell perimeter ROI was then applied to the early endosome channel, and the area and mean intensity were measured. The mean intensity of the early endosomes contained within a single cell was reported for each n.
Ndel1 and dynein cortical enrichment during directed migration analysis
To assess Ndel1 and dynein localization during migration, confluent U2OS cells on fibronectin-coated coverslips were scratched in a crosshair pattern with a p200 tip and incubated at 37°C. After 30 min of incubation, cells were fixed in ice-cold 100% methanol for 5 min and stained with anti-tubulin and either anti-Ndel1 or anti-dynein antibodies, respectively. Slides were imaged with a 60× objective spinning disk confocal microscope. Full volumes of cells were imaged by first identifying the top of each cell, then the bottom, then acquiring Z-slices at 0.2-µm steps. All analysis was done in FIJI. A custom macro was written to partially automate the analysis. First, the user provides the correct orientation of the image and then using the polyline tool draws a line at the cell border in the dynein channel. The line contains many points that are evenly spaced to ensure proper measurement of the cytoplasmic dynein levels in the next step. After the line is drawn, the macro will expand the line by 5 pixels (∼1 µm) to measure cortex intensity and generate 15 circle ROIs with a 15 pixel diameter (2.75 µm), and 35 pixels (6.416 µm) behind the previously defined cell border in the interior of the cell to measure cytoplasmic dynein intensity. The user is then prompted to delete any overlapping circles. The circles are then combined into one ROI, and the area and mean intensity at the cortex and in the cytoplasm are measured in both the dynein and tubulin channels.
Dynein enrichment at microtubule plus-end analysis
To quantify the amount of dynein at plus-ends of microtubules, cells seeded at low confluency on fibronectin-coated coverslips were fixed in ice-cold 100% methanol. After fixation, permeabilization, and blocking, immunofluorescence was performed with antibodies against dynein heavy chain and EB1, as well as a DAPI probe. Confocal microscopy with a 60× objective was used to collect full-volume z-stack images of the cells. All analysis was performed in FIJI with a custom macro written to partially automate the analysis. In brief, a uniform box (15.40 × 10.63 µm) was positioned to be contained within the cytoplasm of the cell but excluding the nucleus. The EB1 channel was then autothresholded and selected as an ROI. Now, the intensity in the dynein channel is measured using the EB1 ROI and the mean dynein intensity at EB1 puncta in the field of view is reported.
Microtubule bundling analysis during migration
To assess microtubule bundling morphology during directed migration, confluent cells plated on fibronectin-coated coverslips were wounded and allowed to migrate for 30 min prior to fixation in ice-cold 100% methanol. Coverslips were processed for immunofluorescence, as described above, probing for microtubules and DAPI (anti-tubulin and DAPI, respectively). Cells migrating to fill in the wound were imaged at 60× with confocal microscopy to capture full volumes of the cells in the field of view. The analysis was performed in FIJI with a custom macro to partially automate the analysis. To begin, the image is rotated to position the wound at the top and a uniform rectangle (104.13 × 121 µm) is placed in the center to contain ∼0.25 of the wound and 0.75 of cells. In the microtubule channel, the intensity is measured along vertical lines across the box and averaged into one plot profile, displaying mean intensity from the wound into the sheet of cells. These data were exported to and normalized in Excel and then plotted in Prism. Normalization consisted of dividing all values by the background intensity of the image and the highest mean value of the WT curve (per biological replicate). Lastly, the plots were shifted an equal distance from the start of the wound to align the peaks and allow for compilation between samples.
Zebrafish husbandry and ccser2 knockout generation
All zebrafish (Danio rerio) work was done in accordance with the University of Wisconsin-Madison IACUC guidelines. Zebrafish lines used include AB, TgBAC(neurod:egfp)nl1, Tg(mpeg1:EGFP)gl22, ccser2auwd10, and ccser2buwd11. Adult zebrafish were kept at 28°C and spawned according to established protocols (ZFIN Publication: Westerfield, 2007). Embryos and larval zebrafish were kept at 28°C in embryo media. Developmental staging was done according to established methods (Kimmel et al., 1995). Experiments were done at 4 dpf at which point sex is not determined.
To generate the stable ccser2a and ccser2b knockout zebrafish lines, two guide RNAs targeted to exon 2 of each gene (Table S3) were injected into zebrafish zygotes with 500 ng Cas9 protein (Integrated DNA Technologies). F0 injected animals were raised to adulthood and crossed to AB. A subset of the resulting larvae were genotyped with ccser2a- or ccser2b-specific primers to confirm indel creation (Table S3). The rest of the F1 larvae were raised to adulthood and then screened for frameshift deletions using PCR-based genotyping and sequencing. This identified ccser2auwd10, which has a 156-bp deletion, and ccser2buwd11, which has a 446-bp deletion. Both alleles insert premature stop codons in the respective genes. Resulting heterozygous F1 animals were crossed to generate ccser2auwd10/+; ccser2buwd11/+ double heterozygous F2s for analysis.
G0 crispant and morphant analyses
For G0 crispant analysis, all four guide RNAs described above targeting ccser2a and ccser2b were co-injected with 500 ng Cas9 protein (Integrated DNA Technologies) into TgBAC(neurod:egfp)nl1 transgenics. Animals were raised to 4 dpf prior to immunofluorescence, which was done according to established protocols (). Briefly, animals were incubated in 4% PFA with 0.1% Triton overnight at 4°C. Following fixation, larvae were washed in 1X PBS/0.1% Triton briefly, then washed in RNase/DNase-free water overnight at room temperature. Larvae were then incubated in standard blocking solution (5% goat serum, 0.2% Triton, 1X PBS, 1% DMSO, 0.02% sodium azide, 0.2% bovine serum albumin) for 1–4 h, then incubated in primary antibody (GFP-1020; Aves) in blocking solution overnight at 4°. Following incubation in primary antibody, larvae were washed in 1X PBS/0.1% Triton, then incubated in Alexa Fluor secondary antibodies (1:1,000; Invitrogen) and DAPI overnight at 4°C. Larvae were washed again in 1X PBS/0.1% Triton, then sunk in 60% glycerol. Immunolabeled larvae were then imaged on an Olympus FV3000, 10×/NA0.4, or 60×/NA1.4 oil immersion objective.
For ccser2a;ccser2b morphant analysis, 1 ng of each morpholino targeting the start site of ccser2a and ccser2b (Table S3) was co-injected into TgBAC(neurod:egfp)nl1 transgenic zygotes. Animals were raised to 30 hpf or 4 dpf and processed for immunofluorescence as described above. Immunolabeled larvae were then imaged on an Olympus FV3000, 10×/NA0.4, or 60×/NA1.4 oil immersion objective.
Image analysis was performed in ImageJ. Neuromast number was manually counted in projected stacks from 10X images. The pLLp area and number of mitotic and apoptotic cells were measured from 60X images. For pLLp area, the primordium was manually outlined and the area was measured using built-in plugins in ImageJ. A number of mitotic and apoptotic nuclei were manually counted in the z-stacks. For pLL nerve-to-body length ratios, the length of the lateral line nerve and the length of the body from the ear to the tail were measured using built-in plugins in ImageJ.
In situ hybridization and RT-PCR analysis
cDNA was synthesized from total RNA extracted from two-cell-stage zebrafish embryos (for RT-PCR) or from 4 dpf larvae (for in situ hybridization). Total RNA was extracted using TRIzol reagent according to the manufacturer’s instructions (Invitrogen). cDNA synthesis was done using a Superscript IV reverse transcription kit according to the manufacturer’s instructions (Invitrogen).
In situ hybridization and probe synthesis were done according to established protocols (Thisse and Thisse, 2008; Logel et al., 1992). DIG-labeled PCR-based probe templates for ccser2a and ccser2b (Table S3) were synthesized from 4 dpf cDNA generated as described above.
For RT-PCR analysis of ccser2a and ccser2b mRNA levels, cDNA was synthesized from 2-cell-stage zebrafish embryos. This developmental stage is before the onset of zygotic transcription and therefore represents maternally deposited mRNA (Table S3).
Macrophage motility analysis
To analyze macrophage motility, Tg(mpeg1:EGFP)gl22 zebrafish larvae were used at 3 dpf. To stimulate directed macrophage migration, the caudal fin was transected as described previously (Barros-Becker et al., 2017). For this, WT and ccser2ab morphant larvae were anesthetized in 0.02% tricaine in embryo media and the fin was amputated with a surgical blade at the boundary of the notochord without injury to the notochord. After amputation, larvae were returned to standard embryo media and housing conditions for recovery. 6 h after amputation, larvae were anesthetized with 0.02% tricaine prior to immobilization in 1.8% low melt agarose for live imaging. Larvae were imaged on a FV3000 confocal (Olympus) with a 40×/NA1.25 silicone objective with 488-nm laser excitation. For assessment of macrophage density, z-stacks were taken through the depth of the tail, including the edge of the amputated fin.
Analysis of macrophage density was done using ImageJ. Images were opened, and a standard deviation z-projection was done through the stack. For uncut controls, the entire tail area was selected and area measured. Then, the macrophage signal was made into a binary mask and the area of the macrophages measured. The macrophage density was calculated by dividing the macrophage area by the total tail area. Similarly, to assess macrophage accumulation at the site of amputation (a measure of directed migration), the total macrophage density was measured in the tail stump distal to the notochord. The total area and macrophage area were measured as above to determine macrophage density at the site of amputation 6 h after transection.
Protein expression and purification
The His-ZZ-TEV-Halo-CCSer2658–850 and His-Strep-sfGFP-CCSer2650–850 were expressed from the pET28 vector backbone in BL21 (DE3) Escherichia coli cells after induction with 0.5 mM isopropyl ß-D-1-thiogalactopyranoside (IPTG) for 18 h at 16°C and 200 rpm. The induced cells were harvested by centrifugation (6,000 g, 20 min, 4°C). The pellets were resuspended in lysis buffer (30 mM HEPES [pH 7.4], 50 mM potassium acetate, 2 mM magnesium acetate, 1 mM EGTA, 1 mM DTT, 0.5 mM Pefabloc, 10% [vol/vol] glycerol) supplemented with 1× cOmplete EDTA-free Protease Inhibitor Cocktail tablets (Roche). The resuspended cells were incubated on ice for 30 min with 1 mg/ml egg lysozyme and sonicated (50% amplitude, pulse on 5 s, pulse off 25 s). The lysate was clarified by centrifugation (66,000 g, 30 min, 4°C) in a Type 70 Ti rotor (Beckman). For His-ZZ-TEV-Halo-CCSer2650–850, the supernatant was incubated with 2 ml of IgG Sepharose 6 Fast Flow beads (Cytiva) equilibrated in lysis buffer and incubated for 2 h with rotation at 4°C. The beads were collected by centrifugation (1,000 g, 2 min, 4°C) and resuspended with 2 ml lysis buffer before being transferred to a glass gravity column. Beads were then washed with 50 ml low-salt wash buffer (30 mM HEPES [pH 7.4], 200 mM potassium acetate, 2 mM magnesium acetate, 1 mM EGTA, 1 mM DTT, 0.5 mM Pefabloc, 10% [vol/vol] glycerol), 100 ml high-salt wash buffer (30 mM HEPES [pH 7.4], 1,050 mM potassium acetate, 2 mM magnesium acetate, 1 mM EGTA, 1 mM DTT, 0.5 mM Pefabloc, 10% [vol/vol] glycerol), 200 ml low-salt wash buffer, and 100 ml tobacco etch virus (TEV) buffer (50 mM Tris–HCl [pH 8.0], 150 mM potassium acetate, 2 mM magnesium acetate, 1 mM EGTA, 1 mM DTT, and 10% [vol/vol] glycerol). The ZZ-TEV tag was cleaved by incubating the beads with TEV protease at a final concentration of 0.2 mg/ml overnight. Cleaved Halo-CCSer2650–850 was concentrated to 1 ml with a 30K MWCO concentrator (EMD Millipore) and diluted with 1 ml buffer A (30 mM HEPES [pH 7.4], 50 mM potassium acetate, 2 mM magnesium acetate, 1 mM EGTA, 1 mM DTT, 10% [vol/vol] glycerol). The 2 ml protein sample was loaded into a MonoQ 5/50 GL column (Cytiva) at 1 ml/min. The column was prewashed with 10 CVs of buffer A, 10 CVs of buffer B (30 mM HEPES [pH 7.4], 200 mM potassium acetate, 2 mM magnesium acetate, 1 mM EGTA, 1 mM DTT, 10% [vol/vol] glycerol), and again with 10 CVs of buffer A. To elute, a linear gradient was run over 26 CVs from 0 to 100% buffer B. The peak fractions were collected and concentrated to 500 µl with a 30K MWCO concentrator (EMD Millipore). The 500 µl protein sample was further subjected to size-exclusion chromatography (SEC) on a Superdex 200 10/300 column (Cytiva) with GF150 buffer (25 mM HEPES [pH 7.4], 150 mM KCl, 1 mM MgCl2, 1 mM DTT) as the mobile phase at 0.75 ml/min. Peak fractions were collected, supplemented with glycerol to a final concentration of 10%, concentrated to 0.2–1 mg/ml with a 30K MWCO concentrator (EMD Millipore), frozen in liquid nitrogen, and stored at −80°C. For fluorescent labeling of purified Halo-CCSer2650–850, the Halo-CCSer2650–850 was mixed with a 10-fold excess of Halo-TMR (Promega) for 10 min at room temperature. Unconjugated dye was removed by passing the protein through the Micro Bio-spin P-6 column (Bio-Rad) equilibrated in GF150 buffer supplemented with 10% glycerol. Small-volume aliquots of the labeled protein were flash-frozen in liquid nitrogen and stored at −80°C.
For the His-Strep-sfGFP-CCSer2650–850, the purification was similar to ZZ-TEV-Halo-CCSer2650–850. Briefly, 2 ml of HisPur Ni-NTA resin was used. After incubation overnight, the beads were washed with 50 ml low-salt wash buffer supplemented with 25 mM imidazole, 100 ml high-salt wash buffer supplemented with 25 mM imidazole, and 200 ml low-salt wash buffer supplemented with 25 mM imidazole. The proteins were then eluted with 10 ml elution buffer (30 mM HEPES [pH 7.4], 50 mM potassium acetate, 2 mM magnesium acetate, 300 mM imidazole, 1 mM EGTA, 1 mM DTT, 10% [vol/vol] glycerol) for 15 min at 4°C. The eluted proteins were concentrated to 1 ml with a 30K MWCO concentrator (EMD Millipore) and diluted with 1 ml buffer A. The 2 ml protein sample was loaded into a MonoQ 5/50 GL column (Cytiva) at 1 ml/min. The column was prewashed with 10 CVs of buffer A, 10 CVs of buffer B, and again with 10 CVs of buffer A. To elute, a linear gradient was run over 26 CVs from 0 to 100% buffer B. The peak fractions were collected and concentrated to 500 µl with a 30K MWCO concentrator (EMD Millipore). The 500 µl protein sample was further subjected to SEC on a Superdex 200 10/300 column (Cytiva) with GF150 buffer as the mobile phase at 0.75 ml/min. Peak fractions were collected, supplemented with glycerol to a final concentration of 10%, concentrated to 0.2–1 mg/ml with a 30K MWCO concentrator (EMD Millipore), frozen in liquid nitrogen, and stored at −80°C.
Human dynein, Lis1, Ndel1, and NT-Ndel1 constructs were expressed in Sf9 cells as described previously (Schlager et al., 2014; Garrott et al., 2023; Agrawal et al., 2022). Briefly, pACEBac1 plasmid containing the human dynein genes, pFastBac plasmid containing Lis1, and pKL plasmid containing Ndel1 and tagged Lis1 constructs were transformed into DH10EmBacY chemically competent cells with heat shock at 42°C for 15 s followed by incubation at 37°C and shaking at 220 rpm for 6 h in S.O.C. media (Thermo Fisher Scientific). The cells were plated on LB–agar plates containing kanamycin (50 μg/ml), gentamicin (7 μg/ml), tetracycline (10 μg/ml), Bluo-Gal (100 μg/ml), and IPTG (40 μg/ml). Cells that contained the plasmid of interest were identified with blue/white selection after 48–72 h. For dynein, white colonies were tested for the presence of all six dynein genes with PCR. Colonies were grown overnight in LB medium containing kanamycin (50 μg/ml), gentamicin (7 μg/ml), and tetracycline (10 μg/ml) at 37°C, and with agitation at 220 rpm. Bacmid DNA was extracted from overnight cultures using isopropanol precipitation as described previously (Zhang et al., 2017). About 1 × 10⁶ Sf9 cells in 2 ml of media in a 6-well dish were transfected with up to 2 μg of fresh bacmid DNA using FuGENE HD transfection reagent (Promega) at a ratio of 3:1 (FuGENE reagent:DNA) according to the manufacturer’s directions. Cells were incubated at 27°C for 3 days without agitation in a humid incubator. Next, the supernatant containing the virus (V0) was harvested by centrifugation (1,000 g, 5 min, 4°C). About 1 ml of the V0 virus was used to transfect 50 ml of Sf9 cells at 106 cells/ml to generate the next passage of virus (V1). Cells were incubated at 27°C for 3 days with shaking at 105 rpm. The supernatant containing V1 virus was collected by centrifugation (1,000 g, 5 min, 4°C). All V1 viruses were protected from light and stored at 4°C until further use. To express protein, 4 ml of V1 virus was used to transfect 400 ml of Sf9 cells at a density of 1 × 10⁶ cells/ml. Cells were incubated at 27°C for 3 days with shaking at 105 rpm and collected by centrifugation (3,500 g, 10 min, 4°C). The pellet was washed with 10 ml of ice-cold PBS and collected again via centrifugation before being flash-frozen in liquid nitrogen and stored at −80°C until needed for protein purification.
All steps for protein purification were performed at 4°C unless indicated otherwise. For dynein preparation, Sf9 cell pellets were thawed on ice and resuspended in 40 ml of dynein-lysis buffer (50 mM HEPES [pH 7.4], 100 mM sodium chloride, 1 mM DTT, 0.1 mM Mg–ATP, 0.5 mM Pefabloc, 10% [vol/vol] glycerol) supplemented with one cOmplete EDTA-free Protease Inhibitor Cocktail Tablet (Roche) per 50 ml. Cells were lysed with a Dounce homogenizer (10 strokes with a loose plunger followed by 15 strokes with a tight plunger). The lysate was clarified by centrifugation (183,960 g, 88 min, 4°C) in a Type 70 Ti rotor (Beckman). The supernatant was mixed with 2 ml of IgG Sepharose 6 Fast Flow beads (Cytiva) equilibrated in dynein-lysis buffer and incubated for 4 h with rotation along the long axis of the tube. The beads were transferred to a glass gravity column, and washed with at least 200 ml of dynein-lysis buffer and 300 ml of dynein-TEV buffer (50 mM Tris–HCl [pH 8.0], 250 mM potassium acetate, 2 mM magnesium acetate, 1 mM EGTA, 1 mM DTT, 0.1 mM Mg–ATP, and 10% [vol/vol] glycerol). For fluorescent labeling of the SNAP tag, dynein-bound beads were mixed with 5 μM SNAP-Cell-TMR or SNAP-Alexa Fluor 647 (New England Biolabs) for 10 min at room temperature. Unconjugated dye was removed by washing with 300 ml dynein-TEV buffer at 4°C. The beads were resuspended in 15 ml of TEV buffer supplemented with 0.5 mM Pefabloc and 0.2 mg/ml TEV protease and incubated overnight with rotation along the long axis of the tube. Cleaved proteins in the supernatant were concentrated with a 100K (MWCO) concentrator (EMD Millipore) to 500 μl and purified via SEC on a TSKgel G4000SWXL column (TOSOH Bioscience) with GF150 buffer supplemented with 0.1 mM Mg–ATP as the mobile phase at 0.75 ml/min. Peak fractions were collected, buffer-exchanged into a GF150 buffer supplemented with 0.1 mM Mg–ATP and 10% glycerol, and concentrated to 0.1–0.5 mg/ml using a 100K MWCO concentrator. Small-volume aliquots were flash-frozen in liquid nitrogen and stored at −80°C.
Lysis and clarification steps for Lis1 and Ndel1 constructs were similar to dynein except Lis1-lysis buffer (30 mM HEPES [pH 7.4], 50 mM potassium acetate, 2 mM magnesium acetate, 1 mM EGTA, 300 mM potassium chloride, 1 mM DTT, 0.5 mM Pefabloc, 10% [vol/vol] glycerol) supplemented with one cOmplete EDTA-free Protease Inhibitor Cocktail Tablet per 50 ml was used in place of dynein-lysis buffer. The clarified supernatant was mixed with 2 ml of IgG Sepharose 6 Fast Flow beads (Cytiva) and incubated for 2–3 h with rotation along the long axis of the tube. The beads were transferred to a gravity column, and washed with at least 20 ml of Lis1-lysis buffer, 200 ml of Lis1-TEV buffer (10 mM Tris–HCl [pH 8.0], 2 mM magnesium acetate, 150 mM potassium acetate, 1 mM EGTA, 1 mM DTT, 10% [vol/vol] glycerol) supplemented with 100 mM potassium acetate and 0.5 mM Pefabloc, and 100 ml of Lis1-TEV buffer. For fluorescent labeling of Lis1, the Lis1-bound beads were mixed with SNAP-Alexa Fluor 647 (Promega) for 10 min at room temperature after the lysis buffer wash. TEV protease was added to the beads at a final concentration of 0.2 mg/ml, and the beads were incubated overnight with rotation along the long axis of the tube. Cleaved Lis1 in the supernatant was collected and concentrated to 500 μl with a 30K MWCO concentrator (EMD Millipore). Concentrated Lis1 was then purified via SEC on a Superose 6 Increase 10/300 GL column (Cytiva) with GF150 buffer supplemented with 10% glycerol as the mobile phase at 1 ml/min. Peak fractions were collected, concentrated to 0.2–1 mg/ml with a 30K MWCO concentrator (EMD Millipore), frozen in liquid nitrogen, and stored at −80°C.
For the GST-Ndel1 constructs, 2 ml of HisPur Ni-NTA resin was used. After incubation overnight, the beads were washed with 50 ml low-salt wash buffer supplemented with 25 mM imidazole, 100 ml high-salt wash buffer supplemented with 25 mM imidazole, and 200 ml low-salt wash buffer supplemented with 25 mM imidazole. The proteins were then eluted with 10 ml elution buffer for 15 min at 4°C. The eluted proteins were collected and concentrated to 500 μl with a 30K MWCO concentrator (EMD Millipore). Concentrated Ndel1 was then purified via SEC on a Superdex 200 10/300 column (Cytiva) with GF150 buffer supplemented with 10% glycerol as the mobile phase at 1 ml/min. Peak fractions were collected, concentrated to 0.2–1 mg/ml with a 30K MWCO concentrator (EMD Millipore), frozen in liquid nitrogen, and stored at −80°C.
Single-molecule TIRF microscopy data acquisition, analysis, and statistical tests
Single-molecule imaging was performed with an inverted microscope (Nikon, Ti2-E Eclipse) with a 100× 1.49 N.A. oil immersion objective (Nikon, Apo). The microscope was equipped with a LUNF-XL laser launch (Nikon), with 405-, 488-, 561-, and 640-nm laser lines. The excitation path was filtered using an appropriate quad band-pass filter cube (Chroma). The emission path was filtered through appropriate emission filters (Chroma) located in a high-speed filter wheel (Finger Lakes Instrumentation). Emitted signals were detected on an electron-multiplying CCD camera (iXon Ultra 897; Andor Technology). Image acquisition was controlled by NIS-Elements Advanced Research software (Nikon).
Single-molecule dissociation experiments were performed in flow chambers assembled as described previously (Agrawal et al., 2022). No. 1-1/2 coverslips (Corning) were functionalized with biotin-PEG by sonication at 40°C with 100% EtOH for 10 min, 200 mM KOH for 20 min, and again with 100% EtOH for 10 min. Coverslips were rinsed with water 3 times in between sonication steps. After the last EtOH wash, the coverslips were incubated with methanol containing 5% acetic acid and 1% (3-aminopropyl)triethoxysilane (MilliporeSigma) overnight in a vacuum desiccation chamber in the dark. The next day, the coverslips were washed with water five times and once with 100% EtOH before drying. Coverslips were incubated with 8.4 mg/ml NaHCO3, 270 mg/ml mPEG-succinimidyl valerate, MW 2,000 (Laysan Bio), and 35 mg/ml biotin-PEG-SVA, MW 5,000 (Laysan Bio) in a humid container for 3 h. Slides were washed with water, dried, and stored at −20°C or in a vacuum desiccator.
Taxol-stabilized microtubules with ∼10% biotin-tubulin and ∼10% Alexa 405–labeled fluorescent-tubulin were prepared as described previously (Huang et al., 2012). Flow chambers were assembled with taxol-stabilized microtubules by incubating 1 mg/ml streptavidin in assay buffer (30 mM HEPES [pH 7.4], 2 mM magnesium acetate, 1 mM EGTA, 10% glycerol, 1 mM DTT) for 3 min, washing twice with assay buffer supplemented with taxol, incubating a fresh dilution of taxol-stabilized microtubules in assay buffer for 3 min, and washing twice with assay buffer supplemented with 1 mg/ml casein and 20 µM taxol.
Experiments to assess dynein–Ndel1 dissociation in the presence and absence of CCSer2 were conducted as follows. 0.5–1 nM dynein (labeled with SNAP substrate–conjugated Alexa 488) was flowed into flow chambers containing taxol-stabilized microtubules labeled with Alexa 405 and allowed to bind for 5 min. Next, 10 nM Ndel1 (labeled with HaloTag substrate–conjugated Alexa 647) was introduced and allowed to bind for 5 min. Next, data acquisition was initiated, and 2 μM CCSer2650–850 or a buffer match was flowed in. Dynein–Ndel1 dissociation times were determined by the length of time dynein–Ndel1 remained colocalized after CCSer2650–850 or buffer was introduced using custom MATLAB scripts as described previously (Gillies et al., 2024, Preprint). The final imaging buffer contained the assay buffer supplemented with 20 µM taxol, 1 mg/ml casein, 71.5 mM β-mercaptoethanol, 0.05 mg/ml glucose catalase, 1.2 mg/ml glucose oxidase, 0.4% glucose, and 2.5 mM Mg-ATP. The final imaging buffer contained 37.5 mM KCl.
Binding assays with purified components
The binding affinity of Halo-CCSer2650–850 for Ndel1 was determined by coupling GST-Ndel1 to 30 μl of glutathione beads (Thermo Fisher Scientific) in 2 ml Protein Lo Bind Tubes (Eppendorf) using the following protocol. Beads were washed twice with 1 ml of GF150 without ATP supplemented with 10% glycerol and 0.1% NP-40. Ndel1 was diluted in this buffer to 0, 7.5, 15, 30, 60, 90, 120, and 300 nM in a final volume of 25 μl, incubated with equilibrated beads, and gently shaken on a homemade device at room temperature for 1 h. 20 μl of the supernatant was collected and analyzed via SDS-PAGE to confirm complete depletion of Ndel1. The Ndel1-conjugated beads were then washed once with 1 ml GF150 with 10% glycerol and 0.1% NP-40 and once with 1 ml of binding buffer (30 mM HEPES [pH 7.4], 2 mM magnesium acetate, 1 mM EGTA, 10% glycerol, 1 mM DTT, 1 mg/ml casein, 0.1% NP-40, and 1 mM ADP). The Halo-TMR–labeled CCSer2650–850 was diluted to 5 nM in binding buffer, and 25 μl was distributed to the Ndel1-conjugated beads. The mixture was gently agitated at room temperature for 45 min. After incubation, 20 μl of supernatant was collected and analyzed via SDS-PAGE to determine the depletion of Halo-CCSer2650–850. Depletion analysis was conducted through densitometry using ImageJ. Binding curves were fit in Prism 10 (GraphPad) with a quadratic binding curve as described previously (Pollard, 2010).
The assay to assess Halo-CCSer2650–850 binding to dynein and Lis1 was performed similarly. Briefly, the beads were washed twice with 1 ml of GF150 supplemented with 0.1% NP-40 and 25 μl Halo-CCSer2650-850 at 0, 300, 600, 900, or 1,200 nM was added to the equilibrated beads and shaken for 1 h. 20 μl of supernatant was collected and analyzed via SDS-PAGE. The beads were washed once with 1 ml GF150 with 10% glycerol and 0.1% NP-40 and once with 1 ml of binding buffer, and 5 nM of either SNAP-549 or SNAP-647 dynein or SNAP-647 Lis1 in binding buffer was distributed to CCSer2-conjugated beads. The mixture was gently agitated at room temperature for 45 min. After incubation, 20 μl of supernatant was collected and analyzed via SDS-PAGE. Depletion analysis was conducted through densitometry using ImageJ.
Due to tag incompatibility, His-strep-sfGFP-CCSer2650–850 was used to assess CCSer2’s effect on dynein-Ndel1 or Lis1-Ndel1 interaction using a protocol similar to that described above. Briefly, 25 μl of Magne HaloTag Beads (Promega) was washed twice with 1 ml GF150 supplemented with 0.1% NP-40. 5 nM Halo-Ndel1 in GF150 with 0.1% NP-40 was added to the equilibrated beads and shaken for 1 h for Lis1 experiments. For dynein experiments, the final Ndel1 concentration was 30 nM. 20 μl of the supernatant was collected and analyzed via SDS-PAGE. The beads were washed once with 1 ml GF150 with 10% glycerol and 0.1% NP-40 and once with 1 ml of binding buffer, and 5 nM of either SNAP-549 or SNAP-647 dynein or SNAP-647 Lis1 in binding buffer with or without 90 nM strep-sfGFP-CCSer2650–850 was distributed to Ndel1-conjugated beads. The mixture was gently agitated at room temperature for 45 min. After incubation, 20 μl of supernatant was collected and analyzed via SDS-PAGE. Depletion analysis was conducted through densitometry using ImageJ.
Online supplemental material
Fig. S1 is related to Fig. 1. Fig. S2 is related to Figs. 1 and 2. Fig. S3 is related to Fig. 3. Fig. S4 is related to Fig. 4. Fig. S5 is related to Figs. 5 and 6. Tables S1, S2, and S3 contain all plasmid constructs, antibodies/probes, and oligonucleotides used, respectively. Videos 1 and 2 (related to Fig. 2) are representative movies of U2OS WT cells expressing GFP-CCSer2WT. Videos 3 and 4 (related to Fig. 3) are representative movies of U2OS WT cells. Videos 5, 6, and 7 (related to Fig. 3) are representative movies of U2OS CCSer2-KO cells. Videos 8 and 9 (related to Fig. 3) are representative movies of U2OS WT or CCSer2-KO cells, respectively. Videos 10 and 11 (related to Fig. 4) are representative movies of U2OS WT, 48 h after transfection of mCherry-α5-integrin-12. Videos 12 and 13 (related to Fig. 4) are representative movies of CCSer2-KO cells, 48 h after transfection of mCherry-α5-integrin-12. Videos 14 and 15 (related to Fig. 6) are real-time dissociation assay with 0 μM or 2 μM CCSer2, respectively. Videos 16 and 17 (related to Videos 14 and 15, respectively) are snapshots of the microtubule and dynein channels. Data S1 contains the MS data for the BioID proximity labeling assay on Lis1 and Ndel1, shown in Fig. 1.
Data availability
All macros generated are available for download from the DeSantis-Lab GitHub page.
Acknowledgments
The authors thank Drs. Kristen Verhey, Ryoma Ohi, David Sept, Michael Cianfrocco, Eleanor Clowney, Jayakrishnan Nandakumar, Richard Baker, John Salogiannis, Richard McKenney, and William Redwine, as well as members of the DeSantis, Cianfrocco, Ohi, Verhey, and Sept laboratories for helpful discussions and/or feedback on the manuscript. We are especially grateful to Dr. Samara Reck-Peterson for resources and generous support for reagent generation. We thank Dr. Zaw Min Htet, Ian Hollyer, and Tien Phuoc Tran for help with the BioID experiments. We are very grateful to Dr. Monika Dzieciatkowska and the University of Colorado Mass Spectrometry Facility for BioID data acquisition and analysis. We also thank the reviewers for their helpful feedback.
This work was supported by National Institutes of Health (NIH)-R35GM146739, National Science Foundation-2142670, and NIH-R00GM127757 (to M.E. DeSantis), and NIH-T32 GM145304 (to J.L. Zang).
Author contributions: J.L. Zang: conceptualization, data curation, formal analysis, funding acquisition, investigation, methodology, project administration, resources, software, supervision, validation, and visualization. D. Gibson: conceptualization, formal analysis, investigation, methodology, resources, validation, and visualization. A.-M. Zheng: data curation, formal analysis, investigation, methodology, validation, visualization. W. Shi: data curation, formal analysis, investigation, methodology, validation, and visualization. J.P. Gillies: formal analysis, investigation, resources, validation, and writing—review and editing. C.M. Stein: data curation, investigation, methodology, and validation. C.M. Drerup: investigation, methodology, and writing—review and editing. M.E. DeSantis: conceptualization, data curation, formal analysis, funding acquisition, investigation, methodology, project administration, resources, software, supervision, validation, visualization, and writing—original draft, review, and editing.

