


The Ras homolog (Rho) small GTPases coordinate diverse cellular functions including cell morphology, adhesion and motility, cell cycle progression, survival, and apoptosis via their role in regulating the actin cytoskeleton. The upstream regulators for many of these functions are unknown. ARHGEF17 (also known as TEM4) is a Rho family guanine nucleotide exchange factor (GEF) implicated in cell migration, cell–cell junction formation, and the mitotic checkpoint. In this study, we characterize the regulation of the cell cycle by TEM4. We demonstrate that TEM4-depleted cells exhibit multiple defects in mitotic entry and duration, spindle morphology, and spindle orientation. In addition, TEM4 insufficiency leads to excessive cortical actin polymerization and cell rounding defects. Mechanistically, we demonstrate that TEM4-depleted cells delay in G1 as a consequence of decreased expression of the proproliferative transcriptional co-activator YAP. TEM4-depleted cells that progress through to mitosis do so with decreased levels of cyclin B as a result of attenuated expression of CCNB1. Importantly, cyclin B overexpression in TEM4-depleted cells largely rescues mitotic progression and chromosome segregation defects in anaphase. Our study thus illustrates the consequences of Rho signaling imbalance on cell cycle progression and identifies TEM4 as the first GEF governing Rho GTPase-mediated regulation of G1/S.
Introduction
The eukaryotic cell division cycle is a complex process that necessitates remodeling of numerous architectural features of the cell including the microtubule and actin cytoskeletons. It is well-documented, for example, that interfering with microtubule polymerization using drugs such as nocodazole, colchicine, or vinca alkaloids prevents proper spindle formation and results in the arrest of cells in prometaphase due to spindle assembly checkpoint (SAC) activation (Jordan et al., 1992; McAinsh and Kops, 2023). The actin cytoskeleton on the other hand is a major integrator of the various inputs that control G1/S transition. These inputs include both soluble stimuli, such as growth factors, and mechanotransduction cues from cell adhesions and the local microenvironment and are long known to synergistically control cell cycle progression, with Rho GTPases being shared effectors of these pathways (Assoian and Schwartz, 2001; Boonstra and Moes, 2005; Hall, 2005; Jones et al., 2019; Reshetnikova et al., 2000; Uroz et al., 2018).
Among the numerous activities driven by Rho family GTPases, changes in cell morphology, adhesion, motility, cell cycle progression, survival, apoptosis, and cytokinesis are well described (Hall, 2012; Jaffe and Hall, 2005; Lawson and Ridley, 2018). Through fine-tuned temporal and spatial regulation of the Rho GTPases (Basant and Glotzer, 2018; Bement et al., 2024; Derksen and van de Ven, 2020), guanine nucleotide exchange factors (GEFs) contribute to the regulation of both actin and microtubule cytoskeletons (Rossman et al., 2005; Zuo et al., 2014). For example, recruitment of the RhoGEF Ect2 to the central spindle is essential for cytokinesis in most animal cells, and inhibition of this localization prevents accumulation of RhoA, F-actin, phospho-myosin light chain, and anillin at the cortical membrane adjacent to the central spindle, all of which are necessary for initiation and ingression of the cleavage furrow (Nishimura and Yonemura, 2006; Somers and Saint, 2003; Su et al., 2011; Yüce et al., 2005). In early mitosis, Ect2 regulates the cortical rigidity of the plasma membrane. Upon mitotic entry, Rho A activity drives cortical actin filaments to form a meshwork at the cell surface that is exquisitely tuned to achieve optimal levels of cortex thickness and tension, and both too much or too little Rho A activity can deregulate this process (Chugh et al., 2017; Maddox and Burridge, 2003). The tensile properties of the cortex ultimately result in the characteristic rounded shape of mitotic cells, a critical feature of cell division. This process is overseen at least in part by CDK1 activity as cells begin to enter mitosis, and numerous CDK1 targets have been implicated in this process (Chen et al., 2022; Jones et al., 2018, 2019; Nishimura et al., 2019; Watanabe et al., 1999).
In interphase, Rho A activity is important for passage through G1. Early microinjection studies using dominant-negative constructs or constitutively active mutants of Rho A, Rac1, cdc42, or the Rho toxin C3 transferase demonstrated the contribution of these to mitogen-induced G1 progression (Olson et al., 1995; Yamamoto et al., 1993). The major targets of Rho GTPase signaling within the cell cycle machinery are the CKIs p21cip1/waf1 (p21) and p27kip1. Dominant-negative Rho A was shown to increase p21 levels and, conversely, activated Rho A mutants prevented its upregulation (Adnane et al., 1998; Olson et al., 1998). Rho inhibits p21 expression at the transcriptional and posttranscriptional level, and this inhibition may be essential for the effects of Rho on cell cycle progression (Adnane et al., 1998; Coleman et al., 2006; Han et al., 2005; Liberto et al., 2002; Olson et al., 1998; Song et al., 2000). The upstream GEFs that regulate Rho A in this context remain unknown.
ARHGEF17 (also known as and subsequently referred to as tumor endothelial marker 4, TEM4) is an understudied GEF with three annotated domains: an N-terminal actin-binding domain (ABD), a central catalytic DH-PH domain, and a C-terminal WD40 fold (Fig. 1 A). TEM4 binds specifically and directly to dynamic, newly assembled F-actin filaments via the ABD (Mitin et al., 2012; Prifti et al., 2022). In vitro studies indicated that the catalytic activity of TEM4 is specific for Rho over Rac1 and Cdc42 (Bagci et al., 2020; De Toledo et al., 2000; Mitin et al., 2012; Rümenapp et al., 2002). Measurement of TEM4 activity in cells showed that binding to actin, which is required for its subcellular localization, may directly regulate TEM4 activity, as a mutation that abolished actin binding decreased TEM4’s capacity to activate Rho (Mitin et al., 2012). In addition, TEM4 has also been implicated in the maintenance of cell–cell adhesion and the formation of cell junctions and endothelial barriers in Madin–Darby canine kidney (MDCK) cells (Ngok et al., 2013). In agreement with the original identification of TEM4 as a tumor endothelial marker, García-Jiménez et al. proposed that TEM4 may be implicated in tumor growth and metastatic dissemination of lung cancer cells (García-Jiménez et al., 2022). Overall, the emergent picture suggests that TEM4 functions as a RhoGEF specifically activated by dynamic changes in the actin cytoskeleton to regulate functions related to cell shape, movement, and contractility. In addition to these, the Mitocheck consortium revealed a cell cycle function for TEM4 and in a follow-up study (Neumann et al., 2010), and Isokane et al. proposed that it may be a novel regulator of the SAC during mitosis (Isokane et al., 2016).

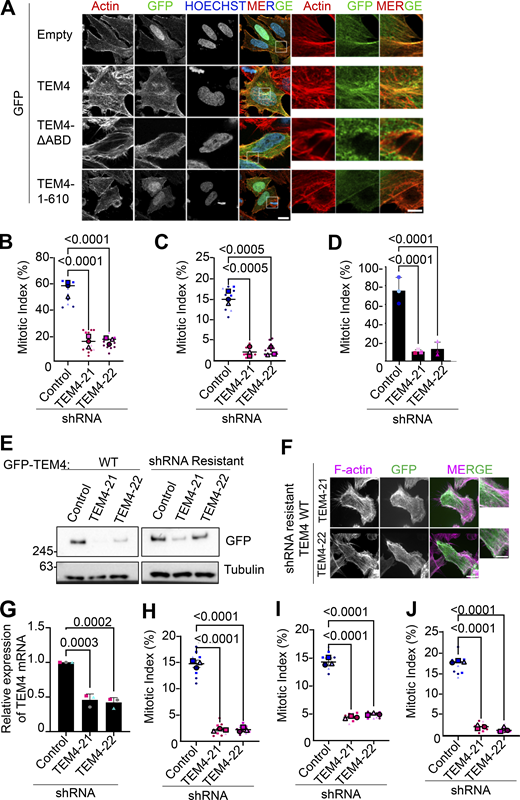
TEM4 is required for mitosis. (A) Schematic illustration of the annotated domains of TEM4 protein. (B) Representative immunofluorescence image of mitotic HeLa-T-REx cells overexpressing the indicated GFP-TEM4 constructs. Cells were stained with anti-GFP (green), Phalloidin-Atto 565 for F-actin (red), and Hoechst (blue). Scale bar = 10 μm for the main image and 2 μm for the magnified image. (C) Fold change in ARHGEF17 mRNA in the indicated cell lines after 72 h shRNA induction. Gene expression was normalized to HPRT. Shown is mean ± SEM, n = 6 independent experiments. P values were determined by a one-way ANOVA test followed by the Holm-Šídák’s multiple comparisons test. (D) TEM4 western blot of lysates from the indicated cell lines after synchronization in mitosis with 100 ng/ml nocodazole at the end of a 72 h shRNA induction; n = 3 independent experiments. Note that the TEM4 antibody detects two different isoforms of TEM4 at ∼245 and 180 kDa. (E) The mitotic index of HeLa-T-REx control, TEM4-21, and TEM4-22 cells 72 h after shRNA induction. Cells were treated with 100 ng/ml nocodazole for 12 h prior to fixation. Data shown is mean ± SEM; n = 3 independent experiments, N ≥ 1,000 cells in total with individual points indicating the mitotic index in a single field of imaging. P values were determined by a one-way ANOVA test followed by the Holm-Šídák’s multiple comparisons test. (F) Control TEM4 shRNA and rescue cell lines were treated as indicated in E. Mean mitotic index ± SEM is shown, n = 3 independent experiments, individual points represent the mitotic index in a single field of imaging. P values are from a two-way ANOVA test followed by Tukey’s multiple comparison test. Source data are available for this figure: SourceData F1.
TEM4 is required for mitosis. (A) Schematic illustration of the annotated domains of TEM4 protein. (B) Representative immunofluorescence image of mitotic HeLa-T-REx cells overexpressing the indicated GFP-TEM4 constructs. Cells were stained with anti-GFP (green), Phalloidin-Atto 565 for F-actin (red), and Hoechst (blue). Scale bar = 10 μm for the main image and 2 μm for the magnified image. (C) Fold change in ARHGEF17 mRNA in the indicated cell lines after 72 h shRNA induction. Gene expression was normalized to HPRT. Shown is mean ± SEM, n = 6 independent experiments. P values were determined by a one-way ANOVA test followed by the Holm-Šídák’s multiple comparisons test. (D) TEM4 western blot of lysates from the indicated cell lines after synchronization in mitosis with 100 ng/ml nocodazole at the end of a 72 h shRNA induction; n = 3 independent experiments. Note that the TEM4 antibody detects two different isoforms of TEM4 at ∼245 and 180 kDa. (E) The mitotic index of HeLa-T-REx control, TEM4-21, and TEM4-22 cells 72 h after shRNA induction. Cells were treated with 100 ng/ml nocodazole for 12 h prior to fixation. Data shown is mean ± SEM; n = 3 independent experiments, N ≥ 1,000 cells in total with individual points indicating the mitotic index in a single field of imaging. P values were determined by a one-way ANOVA test followed by the Holm-Šídák’s multiple comparisons test. (F) Control TEM4 shRNA and rescue cell lines were treated as indicated in E. Mean mitotic index ± SEM is shown, n = 3 independent experiments, individual points represent the mitotic index in a single field of imaging. P values are from a two-way ANOVA test followed by Tukey’s multiple comparison test. Source data are available for this figure: SourceData F1.
In the present work, we investigated the role of TEM4 in controlling mitotic events. We found that TEM4 plays a crucial role in cell cycle progression with its loss resulting in a significant block during G1 and delayed entry into mitosis. In the proportion of cells that do enter mitosis, we identified defects in mitotic rounding, the timing of G2/M transition, and the duration of mitosis, as well as defects in spindle orientation and chromosome alignment and segregation. Mechanistically, we found that loss of TEM4 resulted in decreased transcription of the cell cycle promoting transcription factor YAP accompanied by increased levels of the G1 inhibitor p21 and a delayed cell cycle. Expression of exogenous cyclin B in TEM4-depleted cells restored progression through mitosis, reinstated normal actin levels at the cortex, and rescued chromosome segregation defects observed in the absence of TEM4. These observations collectively support the conclusion that TEM4 regulation of the actin cytoskeleton in interphase drives a transcriptional program that promotes timely cell cycle progression. To the best of our knowledge, TEM4 is the first Rho regulator implicated in this process.
Results
TEM4 is required for entry into mitosis
We first sought to determine TEM4 localization during mitosis. To do this, we expressed GFP-tagged full-length TEM4 (GFP-TEM4WT), TEM4 lacking 11 amino acids from the ABD (residues 125–135, GFP-TEM4ΔABD), and a construct entirely lacking the C-terminus of TEM4 (GFP-TEM41–610) (Mitin et al., 2012). In agreement with Mitin et al., we confirmed that in interphase, full-length TEM4 localizes at the actin cytoskeleton in an ABD-dependent manner (Mitin et al., 2012) (Fig. S1). Similarly, bulk TEM4 mostly localized to the actin cortex in an ABD-dependent manner during mitosis (Fig. 1 B). To study the function of TEM4 in mitosis, we first generated inducible HeLa-TRex cell lines independently expressing two shRNAs targeting TEM4 that largely overlap previously reported target sequences (hereafter referred to as TEM4-21 and TEM4-22) (Isokane et al., 2016; Memon et al., 2021; Ngok et al., 2013; Prifti et al., 2022; Weber et al., 2021). We initially validated the efficiency of TEM4 depletion by qPCR and detected a 50–60% decrease in TEM4 mRNA levels 72 h post shRNA induction (Fig. 1 C). Using an in-house generated antibody, western blotting of mitotic cell extracts showed a clear decrease in the protein levels of TEM4 after induction of both shRNAs (Fig. 1 D, see Materials and methods for antibody details). To evaluate the effect of TEM4 depletion on mitotic progression, we measured the mitotic index in cells depleted of TEM4 and synchronized in mitosis using nocodazole. We found a clear decrease of mitotic cells in the absence of TEM4 (Fig. 1 E) as has been previously reported (Isokane et al., 2016; Memon et al., 2021; Weber et al., 2021). The low mitotic index was observed also in the presence of taxol and in cells synchronized in mitosis by release from a double thymidine block, suggesting that the delay is independent of the status of microtubules and the method of synchronization (Fig. S1, B and C). Moreover, TEM4-depleted cells were unable to significantly accumulate in mitosis even in the presence of the proteasome inhibitor MG132 indicating that the low mitotic index was not a result of accelerated cell cycle progression (Fig. S1 D). Importantly, mitotic progression was largely restored in cell lines rescued with shRNA resistant TEM4WT in both shRNA conditions demonstrating specificity of knockdown (Fig. 1 F; and Fig. S1, E and F). The low mitotic index observed in HeLa was reproducible in HCT-116 cells similarly engineered to express inducible depletion of TEM4 (Fig. S1, G–J).
TEM4 decreases mitotic index in different cell lines independently of the microtubule status. (A) HeLa-T-REx were transfected with indicated TEM4 constructs before being fixed. Cells were stained with anti-GFP (green), Phalloidin-Atto 565 for F-actin (red), and Hoechst (blue). Scale bar = 15 μm for the main image and 2 μm for the zoomed image. (B) Control or HeLa-TREx cells depleted of TEM4 were treated with 15 nm taxol for 12 h and fixed. (C) Control or HeLa-TREx cells depleted for TEM4 were synchronized in mitosis after 10 h of release from double thymidine block. (D) Control or HeLa-TREx cells depleted for TEM4 were released from double thymidine and treated with MG132 at mitotic entry. (E) Expression of shTEM4-21 and shTEM-22 resistant TEM4 versus TEMWT proteins in control, TEM4-21 and TEM-22 cell lines. Lysates were blotted for the indicated antibodies. (F) Expression and localization of shRNA resistant TEM4WT versus TEMWT proteins in TEM4-21 and TEM4-22 cell lines. Cells we stained with anti-GFP and Phalloidin-Atto 565. Scale bar = 5 μm for the main image and 1 μm for the zoomed image. (G) Expression of ARHGEF17 mRNA in HCT-116 cells transduced with shTEM4-21 or shTEM4-22. ShRNA expression was induced for 72 h using 0.5 μg/ml doxycycline. (H) Mitotic index in HCT116 cells expressing shTEM4-21 or shTEM4-22. ShRNAs were induced for 72 h and released for 10 h from double a thymidine block. (I) Mitotic index in HCT116 cells expressing shTEM4-21 or shTEM4-22. ShRNAs were induced for a total of 72 h and cells were treated with 15 nm taxol for 12 h and fixed. (J) Mitotic index in HCT116 cells expressing shTEM4-21 or shTEM4-22. ShRNAs were induced for a total of 72 h and cells were released from double thymidine block and treated with the proteosome inhibitor MG132 to prevent cells from exiting mitosis. For B–D and G–J, the data shown are means ± SEM of three independent experiments (large data points). Small points represent the mitotic index of a single field of imaging and a total of 1,000–1,500 cells were quantified for each experiment. A one-way ANOVA-Kruskal–Wallis for significance was performed and the P values are shown from Dunn’s multiple comparisons. Source data are available for this figure: SourceData FS1.

TEM4 decreases mitotic index in different cell lines independently of the microtubule status. (A) HeLa-T-REx were transfected with indicated TEM4 constructs before being fixed. Cells were stained with anti-GFP (green), Phalloidin-Atto 565 for F-actin (red), and Hoechst (blue). Scale bar = 15 μm for the main image and 2 μm for the zoomed image. (B) Control or HeLa-TREx cells depleted of TEM4 were treated with 15 nm taxol for 12 h and fixed. (C) Control or HeLa-TREx cells depleted for TEM4 were synchronized in mitosis after 10 h of release from double thymidine block. (D) Control or HeLa-TREx cells depleted for TEM4 were released from double thymidine and treated with MG132 at mitotic entry. (E) Expression of shTEM4-21 and shTEM-22 resistant TEM4 versus TEMWT proteins in control, TEM4-21 and TEM-22 cell lines. Lysates were blotted for the indicated antibodies. (F) Expression and localization of shRNA resistant TEM4WT versus TEMWT proteins in TEM4-21 and TEM4-22 cell lines. Cells we stained with anti-GFP and Phalloidin-Atto 565. Scale bar = 5 μm for the main image and 1 μm for the zoomed image. (G) Expression of ARHGEF17 mRNA in HCT-116 cells transduced with shTEM4-21 or shTEM4-22. ShRNA expression was induced for 72 h using 0.5 μg/ml doxycycline. (H) Mitotic index in HCT116 cells expressing shTEM4-21 or shTEM4-22. ShRNAs were induced for 72 h and released for 10 h from double a thymidine block. (I) Mitotic index in HCT116 cells expressing shTEM4-21 or shTEM4-22. ShRNAs were induced for a total of 72 h and cells were treated with 15 nm taxol for 12 h and fixed. (J) Mitotic index in HCT116 cells expressing shTEM4-21 or shTEM4-22. ShRNAs were induced for a total of 72 h and cells were released from double thymidine block and treated with the proteosome inhibitor MG132 to prevent cells from exiting mitosis. For B–D and G–J, the data shown are means ± SEM of three independent experiments (large data points). Small points represent the mitotic index of a single field of imaging and a total of 1,000–1,500 cells were quantified for each experiment. A one-way ANOVA-Kruskal–Wallis for significance was performed and the P values are shown from Dunn’s multiple comparisons. Source data are available for this figure: SourceData FS1.
TEM4 depletion delays mitotic entry and progression and results in multiple mitotic aberrations
To better understand the effect of TEM4 depletion on mitotic events, we turned to live cell imaging which confirmed that loss of TEM4 had a profound effect on the ability of cells to both enter and progress through mitosis. Whereas control cells entered mitosis 8.7 ± 1.4 h after release from thymidine, TEM4-21 cells required 12.5 ± 3.15 h and TEM4-22 cells 13.6 ± 3.2 h before entering mitosis (Fig. 2 A and Fig. S2 A). Entry into mitosis was also remarkably asynchronous for TEM4-depleted cells relative to controls (Fig. 2 A and Fig. S2 B). In addition, mitotic duration was significantly prolonged in TEM4-depleted cells averaging 100 ± 40 and 70 ± 27 min for TEM4-21 and TEM4-22, respectively, compared with 38 ± 11.06 min for control cells, with the delay spread across all mitotic stages (Fig. 2 B). Moreover, in cells that did enter mitosis after TEM4 depletion, live cell imaging revealed a significant increase in mitotic cell death in both cell lines depleted for TEM4 either soon after nuclear envelope breakdown or after multiple attempts at metaphase alignment (Fig. 2 C).

TEM4 depletion leads to mitotic delay, prolonged mitosis, and cell death. (A) Timing of mitotic entry after G1 release in the indicated cell lines. Individual data points are shown from three independent experiments. (B) Timing of mitotic transitions from the cells in A; NEBD: nuclear envelope breakdown, MET: metaphase, ANA: anaphase. For (A and B), a one-way ANOVA test followed by Kruskal–Wallis for significance was performed together with Dunn’s multiple comparisons test. (C) Quantification of the cell fate phenotypes from the live cell imaging experiment in A. Statistical differences were measured by two-way RM-ANOVA and by Dunnett’s multiple comparisons test. Both cell death after NEBD (P < 0.0001) and cell death after multiple metaphase alignments (P = 0.0006) are significantly different between control and TEM4-depleted cells. (D) Cumulative mitotic index in nocodazole-treated HeLa -TREx cells expressing TEM4 shRNA after 72 h of induction as determined from live cell imaging. The graph displays the mean ± SD. The data was accumulated from three independent experiments; N ≥ 20 cells per condition per experiment. (E) Control, TEM4-21, and TEM4-22 cells were induced for 72 h, and 0.4 μΜ RO-3306 was added for the final 16 h, before release into fresh media for 30 min. Cells were fixed and stained with CREST serum (red), Hoechst (blue), and either anti-MPS1 or anti-BUBR1 (green) as shown. Scale bar = 5 μm. (F) Quantification of the average relative intensity of MPS1 and BUBR1 at kinetochores from E. Graph shows mean ± SEM; n = 3 independent experiments, N ≥ 20 cells/condition/experiment. A one-way ANOVA - Kruskal–Wallis test for significance was performed and the P values were shown from Dunn’s multiple comparisons.
TEM4 depletion leads to mitotic delay, prolonged mitosis, and cell death. (A) Timing of mitotic entry after G1 release in the indicated cell lines. Individual data points are shown from three independent experiments. (B) Timing of mitotic transitions from the cells in A; NEBD: nuclear envelope breakdown, MET: metaphase, ANA: anaphase. For (A and B), a one-way ANOVA test followed by Kruskal–Wallis for significance was performed together with Dunn’s multiple comparisons test. (C) Quantification of the cell fate phenotypes from the live cell imaging experiment in A. Statistical differences were measured by two-way RM-ANOVA and by Dunnett’s multiple comparisons test. Both cell death after NEBD (P < 0.0001) and cell death after multiple metaphase alignments (P = 0.0006) are significantly different between control and TEM4-depleted cells. (D) Cumulative mitotic index in nocodazole-treated HeLa -TREx cells expressing TEM4 shRNA after 72 h of induction as determined from live cell imaging. The graph displays the mean ± SD. The data was accumulated from three independent experiments; N ≥ 20 cells per condition per experiment. (E) Control, TEM4-21, and TEM4-22 cells were induced for 72 h, and 0.4 μΜ RO-3306 was added for the final 16 h, before release into fresh media for 30 min. Cells were fixed and stained with CREST serum (red), Hoechst (blue), and either anti-MPS1 or anti-BUBR1 (green) as shown. Scale bar = 5 μm. (F) Quantification of the average relative intensity of MPS1 and BUBR1 at kinetochores from E. Graph shows mean ± SEM; n = 3 independent experiments, N ≥ 20 cells/condition/experiment. A one-way ANOVA - Kruskal–Wallis test for significance was performed and the P values were shown from Dunn’s multiple comparisons.

Delayed mitotic entry and in the absence of TEM4. (A) Representative stills of time-lapse movies of control, TEM4-21, and TEM4-22 cells 72 h after induction. For imaging, cells were synchronized in mitosis after release from the double thymidine block and incubated with SiR-DNA and SPY555-tubulin to visualize the chromatin and the mitotic spindle. Scale bar = 5 μm. (B) The cumulative mitotic index was measured from time-lapse movies of HeLa-T-REx cells depleted of TEM4 shown in A. Data shown is mean ± SD (from ∼300 cells in total, n = 3 independent experiments).

Delayed mitotic entry and in the absence of TEM4. (A) Representative stills of time-lapse movies of control, TEM4-21, and TEM4-22 cells 72 h after induction. For imaging, cells were synchronized in mitosis after release from the double thymidine block and incubated with SiR-DNA and SPY555-tubulin to visualize the chromatin and the mitotic spindle. Scale bar = 5 μm. (B) The cumulative mitotic index was measured from time-lapse movies of HeLa-T-REx cells depleted of TEM4 shown in A. Data shown is mean ± SD (from ∼300 cells in total, n = 3 independent experiments).
TEM4 was identified as an essential mitotic gene by the Mitocheck consortium and has been implicated in SAC activation by ensuring timely localization of MPS1 at kinetochores (Isokane et al., 2016). However, our results so far indicated that TEM4 depletion leads to prolonged mitosis and delay of entry in the proportion of cells that do enter M-phase. To better address these discrepancies, we tested directly the ability of TEM4-depleted cells to arrest in the presence of nocodazole by live-cell imaging. We found that although TEM4-depleted cells entered mitosis sparingly and relatively late in the presence of nocodazole as shown above (Fig. 2 A and Fig. S2 B), TEM4 depletion did not result in premature exit from mitosis with cells remaining arrested in prometaphase for the duration of filming (Fig. 2 D). As an additional validation of spindle checkpoint function, we monitored kinetochore localization of MPS1 and budding uninhibited by benzimidazole 1-related 1 (BUBR1). We found that TEM4 depletion did not significantly reduce MPS1 or BUBR1 at the kinetochore, suggesting that for the small percentage of cells that do enter mitosis in the absence of TEM4, loss of SAC signaling was not a major consequence (Fig. 2, E and F).
TEM4 depletion leads to aberrant spindle formation, orientation, and chromosome segregation defects
The cortical localization of TEM4 and delayed mitotic progression in TEM4-depleted cells led us to postulate that TEM4 may have a role at the mitotic cortex. To test this idea, we quantified spindle phenotypes in our live cell imaging which revealed significant abnormalities including spindle rotation defects, multiple rounds of spindle metaphase alignment, and division defects (Fig. 3 A, see also Videos 1, 2, and 3). These observations were corroborated by measurement of spindle angles in fixed cells which revealed that compared with control, the majority of cells depleted of TEM4 exhibited spindle angles between 40° and 90°, while the majority of control cells had angles between 0° and 30° relative to the coverslip, indicating increased spindle movement away from the plane of division in TEM4 depleted cells (Fig. 3 B).

TEM4 depletion leads to errors in spindle formation and orientation and chromosome segregation defects. (A) Quantification of the most common spindle phenotypes from Fig. 2 A. A total of ∼200 cells were analyzed from 3 independent experiments. P values shown are for the pairwise comparisons between the control and TEM4-depleted cells undergoing normal division from a one-way ANOVA test. (B) Spindle angle calculations from control, TEM4-21, and TEM4-22 cells. N ≥ 20 cells/condition, n = 3 independent experiments. (C) ShRNA expression was induced for 72 h using 0.5 μg/ml doxycycline and cells were treated for 3 h with 3 μM of nocodazole. After nocodazole washout cells were incubated with fresh media for 2 h. Fixed cells were stained with CREST serum (blue), anti-α-tubulin (green), and anti-γ-tubulin (red). Scale bar = 5 μm. The graph shows the quantification of α-tubulin intensity 2 h after release, mean ± SEM, n = 3 independent experiments, N ≥ 20 cells/condition. P values were determined from one-way ANOVA-Kruskal–Wallis followed by Dunn’s multiple comparisons tests. (D) Quantification of the spindle phenotypes observed in C. Statistical differences were measured by a two-way ANOVA, followed by Tukey’s multiple comparisons tests. (E) Quantification of chromosome misalignment in parental, TEM4-21, and TEM4-22 cells after shRNA induction. Cells were treated for 12 h with 5 μM STLC and released into fresh media containing MG132 for 4 h, prior to fixation and staining. The means ± SEM of three independent experiments, with ≥25 cells/condition are shown. P values were determined by a Brown-Forsythe ANOVA test followed by Dunnett’s T3 multiple comparisons test. (F) Quantification of lagging chromosomes in anaphase. Cells were treated for 12 h with 0.4 μΜ RO-3306 and released into fresh media for 1.5 h for control cells and 2.5 h for TEM4 shRNA inducible cell lines to enrich for cells in anaphase. Data shows means ± SEM, n = 3 independent experiments, N ≥ 25 cells/condition. P values were determined by a Kruskal–Wallis ANOVA test followed by Dunn’s T3 multiple comparisons test.
TEM4 depletion leads to errors in spindle formation and orientation and chromosome segregation defects. (A) Quantification of the most common spindle phenotypes from Fig. 2 A. A total of ∼200 cells were analyzed from 3 independent experiments. P values shown are for the pairwise comparisons between the control and TEM4-depleted cells undergoing normal division from a one-way ANOVA test. (B) Spindle angle calculations from control, TEM4-21, and TEM4-22 cells. N ≥ 20 cells/condition, n = 3 independent experiments. (C) ShRNA expression was induced for 72 h using 0.5 μg/ml doxycycline and cells were treated for 3 h with 3 μM of nocodazole. After nocodazole washout cells were incubated with fresh media for 2 h. Fixed cells were stained with CREST serum (blue), anti-α-tubulin (green), and anti-γ-tubulin (red). Scale bar = 5 μm. The graph shows the quantification of α-tubulin intensity 2 h after release, mean ± SEM, n = 3 independent experiments, N ≥ 20 cells/condition. P values were determined from one-way ANOVA-Kruskal–Wallis followed by Dunn’s multiple comparisons tests. (D) Quantification of the spindle phenotypes observed in C. Statistical differences were measured by a two-way ANOVA, followed by Tukey’s multiple comparisons tests. (E) Quantification of chromosome misalignment in parental, TEM4-21, and TEM4-22 cells after shRNA induction. Cells were treated for 12 h with 5 μM STLC and released into fresh media containing MG132 for 4 h, prior to fixation and staining. The means ± SEM of three independent experiments, with ≥25 cells/condition are shown. P values were determined by a Brown-Forsythe ANOVA test followed by Dunnett’s T3 multiple comparisons test. (F) Quantification of lagging chromosomes in anaphase. Cells were treated for 12 h with 0.4 μΜ RO-3306 and released into fresh media for 1.5 h for control cells and 2.5 h for TEM4 shRNA inducible cell lines to enrich for cells in anaphase. Data shows means ± SEM, n = 3 independent experiments, N ≥ 25 cells/condition. P values were determined by a Kruskal–Wallis ANOVA test followed by Dunn’s T3 multiple comparisons test.
Time-lapse epifluorescence microscopy of mitosis from control HeLa T-Rex cells. Chromatin is shown in red and microtubules in cyan. Individual frames were acquired every 3 min and playback speed is 5 FPS. Related to Fig. 2.
Time-lapse epifluorescence microscopy of mitosis from control HeLa T-Rex cells. Chromatin is shown in red and microtubules in cyan. Individual frames were acquired every 3 min and playback speed is 5 FPS. Related to Fig. 2.
Time-lapse epifluorescence microscopy of mitosis from cells depleted of TEM4 with TEM4-21. Chromatin is shown in red and microtubules in cyan. Individual frames were acquired every 3 min, and the playback speed is 5 FPS. Related to Fig. 2.
Time-lapse epifluorescence microscopy of mitosis from cells depleted of TEM4 with TEM4-21. Chromatin is shown in red and microtubules in cyan. Individual frames were acquired every 3 min, and the playback speed is 5 FPS. Related to Fig. 2.
Time-lapse epifluorescence microscopy of mitosis from cells depleted of TEM4 with TEM4-22. Chromatin is shown in red and microtubules in cyan. Individual frames were acquired every 3 min, and the playback speed is 5 FPS. Related to Fig. 2.
Time-lapse epifluorescence microscopy of mitosis from cells depleted of TEM4 with TEM4-22. Chromatin is shown in red and microtubules in cyan. Individual frames were acquired every 3 min, and the playback speed is 5 FPS. Related to Fig. 2.
We next examined spindle formation in the absence of TEM4 by monitoring microtubule regrowth after nocodazole-induced depolymerization. As expected after nocodazole washout, microtubules repolymerized in a radial manner, forming a distinct aster-like structure and bipolar spindles within an hour in control cells. In contrast, depletion of TEM4 resulted in slower microtubule growth and the formation of multipolar spindles (Fig. S3 A), in agreement with our observations by live-cell imaging discussed above (Fig. 3 A). Furthermore, even 2 h after release from nocodazole, TEM4-depleted cells exhibited reduced microtubule density consistent with decreased spindle reformation capacity (Fig. 3 C). Quantification of the spindle defects at the same time point revealed that whereas 75.9 ± 3.6% of control cells displayed normal mitotic spindles, only 14.0 ± 4.0% of TEM4-21 and 9.0 ± 5.9% of TEM4-22 expressing cells were able to form normal spindles. For both cell lines depleted of TEM4, the remaining cells displayed multiple spindle defects including multipolar and twisted spindles (Fig. 3 D and Fig. S3 B). A major consequence of defective spindles is the misalignment of chromosomes at metaphase and their mis-segregation at anaphase. To test for alignment, we treated control and TEM4-depleted cells with the Eg5 inhibitor S-Trityl-l-Cysteine (STLC) to disrupt the formation of bipolar spindles. Cells were then released into media containing the proteasome inhibitor MG132 to allow for bipolar spindle formation and alignment, and kinetochore positions relative to the metaphase plate were monitored as previously reported (Gama Braga et al., 2021). We found that cells depleted of TEM4 exhibited a significant increase in misaligned kinetochores compared with control cells (Fig. 3 E). In cells that were allowed to progress to anaphase in the absence of MG132, TEM4 depletion resulted in a marked increase in lagging chromosomes (Fig. 3 F). Taken together, our data suggest that TEM4 expression is crucial for proper spindle formation and chromosome segregation during mitosis.

TEM4 depletion slows microtubule regrowth and results in the spindle. (A) HeLa-T-REx control or TEM4-depleted cells were treated for 3 h with 3 μM nocodazole. Nocodazole was washed out and cells were incubated with fresh media for the indicated time points. Cells were fixed with PTEMF buffer and stained with CREST serum (blue), anti-α-tubulin (green), and anti-γ-tubulin (red). Scale bar = 5 μm. (B) Cells treated as in A. Representative images of mitotic spindle phenotypes observed after spindle reformation. Scale bar = 5 μm.

TEM4 depletion slows microtubule regrowth and results in the spindle. (A) HeLa-T-REx control or TEM4-depleted cells were treated for 3 h with 3 μM nocodazole. Nocodazole was washed out and cells were incubated with fresh media for the indicated time points. Cells were fixed with PTEMF buffer and stained with CREST serum (blue), anti-α-tubulin (green), and anti-γ-tubulin (red). Scale bar = 5 μm. (B) Cells treated as in A. Representative images of mitotic spindle phenotypes observed after spindle reformation. Scale bar = 5 μm.
TEM4 depletion leads excessive cortical F-actin and loss of mitotic retraction fibers
At mitotic entry, Rho A–driven reorganization of the actin cytoskeleton results in cortical stiffness and cell rounding (Maddox and Burridge, 2003; Matzke et al., 2001). Early studies also demonstrated that F-actin coordinates cell margin retraction during rounding (Chugh et al., 2017; Cramer and Mitchison, 1997; Maddox and Burridge, 2003). In addition, actin-rich retraction fibers that maintain the connection of rounded mitotic cells to the adhesive substrate also contribute to correct spindle orientation parallel to the substratum and ensure attachment of both daughter cells after division (Théry et al., 2007; Toyoshima and Nishida, 2007). Given the multiple spindle defects we observed in TEM4-depleted cells (Fig. 2, A–D) as well as its cortical localization, we asked if TEM4 depletion could contribute to actin cortex functions in metaphase cells. We found that whereas control cells or non-induced cells expressing TEM4 shRNA exhibited clear retraction fibers, the proportion of cells exhibiting retraction fibers were significantly reduced in TEM4-depleted cells (Fig. 4, A and B). Moreover, and in agreement with observations that retraction fibers play an important role in maintaining the shape and roundness of mitotic cells (Cramer and Mitchison, 1997; Taubenberger et al., 2020), we found that TEM4 depletion resulted in a decrease in the circularity of mitotic cells (Fig. S4 A).

TEM4 depletion leads to excessive cortical actin and loss of retraction fibers in mitosis. (A) Control, TEM4-21, and TEM4-22 expressing cells before and after 72 h of induction were synchronized in mitosis after release from double thymidine block, then fixed before staining with Phalloidin-Atto 565 (magenta) and Hoechst (cyan). Scale bar = 5 μm in the main figure and 1 μm in the zoomed image. (B) The percentage of cells with or without retraction fibers was quantified in metaphase after 72 h of TEM4 depletion. Mean percentages ± SEM is shown, n = 3 independent experiments, N ≥ 20 cells/condition. Statistical significance of the differences in protrusion-positive cells between control and TEM4-depleted cells was determined by the Brown-Forsythe and Welch ANOVA tests. (C) Actin intensity at the cortex in control and TEM4-depleted metaphase cells, means ± SEM (n = 3 independent experiments, ≥20 cells/condition) are shown. P values were determined by ANOVA-Kruskal–Wallis followed by Dunn’s multiple comparisons test. (D) Optical retardance measurements of control, TEM4-21, and TEM4-22 cells. N ≥ 90 cells per condition from three independent experiments. Bars indicate mean ± 95% CI. P was determined by a one-way ANOVA test followed by Tukey’s multiple comparison test. (E) Immunofluorescence of Rho A-GTP (green) and F-actin (red) at the cell cortex of control and TEM4-depleted cells. Main image scale bar = 10 μM, inset scale bar = 2 μM. (F) Quantification of the experiment in D. Rho A-GTP at the cortex was measured in maximum projections of cells stained for active Rho A. Data shows mean ± SEM, n = 3 independent experiments, N ≥ 20 cells/condition. A one-way ANOVA-Kruskal–Wallis test for significance was performed followed by Dunn’s multiple comparisons test. (G) Percentage of control cells and TEM4-21 cells rescued with TEM4WT, TEM4ΔABD, TEM4Y1216A-exhibiting retraction fibers. Data shown are means ± SEM, n = 3 independent experiments, N ≥ 100 cells per condition. Statistical significance of the differences in protrusion-positive cells between control and TEM4 depleted cells was determined by a one-way ANOVA and Tukey’s multiple comparison tests. (H) Percentage of control cells, and TEM4-22 cells rescued with TEM4WT, TEM4ΔABD, TEM4Y1216A exhibiting retraction fibers. Data shown are means ± SEM, n = 3 independent experiments, N ≥ 100 cells per condition. Statistical differences were measured by a One-way ANOVA and Tukey’s multiple comparison test for protrusion-positive cells.
TEM4 depletion leads to excessive cortical actin and loss of retraction fibers in mitosis. (A) Control, TEM4-21, and TEM4-22 expressing cells before and after 72 h of induction were synchronized in mitosis after release from double thymidine block, then fixed before staining with Phalloidin-Atto 565 (magenta) and Hoechst (cyan). Scale bar = 5 μm in the main figure and 1 μm in the zoomed image. (B) The percentage of cells with or without retraction fibers was quantified in metaphase after 72 h of TEM4 depletion. Mean percentages ± SEM is shown, n = 3 independent experiments, N ≥ 20 cells/condition. Statistical significance of the differences in protrusion-positive cells between control and TEM4-depleted cells was determined by the Brown-Forsythe and Welch ANOVA tests. (C) Actin intensity at the cortex in control and TEM4-depleted metaphase cells, means ± SEM (n = 3 independent experiments, ≥20 cells/condition) are shown. P values were determined by ANOVA-Kruskal–Wallis followed by Dunn’s multiple comparisons test. (D) Optical retardance measurements of control, TEM4-21, and TEM4-22 cells. N ≥ 90 cells per condition from three independent experiments. Bars indicate mean ± 95% CI. P was determined by a one-way ANOVA test followed by Tukey’s multiple comparison test. (E) Immunofluorescence of Rho A-GTP (green) and F-actin (red) at the cell cortex of control and TEM4-depleted cells. Main image scale bar = 10 μM, inset scale bar = 2 μM. (F) Quantification of the experiment in D. Rho A-GTP at the cortex was measured in maximum projections of cells stained for active Rho A. Data shows mean ± SEM, n = 3 independent experiments, N ≥ 20 cells/condition. A one-way ANOVA-Kruskal–Wallis test for significance was performed followed by Dunn’s multiple comparisons test. (G) Percentage of control cells and TEM4-21 cells rescued with TEM4WT, TEM4ΔABD, TEM4Y1216A-exhibiting retraction fibers. Data shown are means ± SEM, n = 3 independent experiments, N ≥ 100 cells per condition. Statistical significance of the differences in protrusion-positive cells between control and TEM4 depleted cells was determined by a one-way ANOVA and Tukey’s multiple comparison tests. (H) Percentage of control cells, and TEM4-22 cells rescued with TEM4WT, TEM4ΔABD, TEM4Y1216A exhibiting retraction fibers. Data shown are means ± SEM, n = 3 independent experiments, N ≥ 100 cells per condition. Statistical differences were measured by a One-way ANOVA and Tukey’s multiple comparison test for protrusion-positive cells.

Measurement of contractility markers in control and TEM4-depleted cells. (A) Circularity in control and TEM4-depleted metaphase cells, where 1 is considered a perfect circle. Data shown is mean ± SEM with ≥20 cells/condition, n = 3 independent experiments. A one-way ANOVA Kruskal–Wallis test followed by Dunn’s multiple comparison’s test was performed for analysis of significance. (B) Polarization microscopy of control and TEM4-depleted cells in interphase. Representative images and quantification optical retardance, n = 3. Scale bar = 10 μm. The graph illustrates retardance reading from individual cells (13–36 cells analyzed/condition/replicate acquired over 3 independent experiments). A one-way ANOVA test for significance was performed and the P values are shown from Holm-Šídák’s multiple comparisons test. (C) RhoA-GTP staining in control and TEM4-depleted cells. Fixed cells were stained with Phalloidin-Atto 565 (red), RhoA-GTP (green), and Hoechst (blue). Scale bar = 10 μm for the main image and 2 μm for the zoomed image. (D) pERM staining in control and TEM4 depleted cell. Representative IF images of cells stained with pERM (red) and Hoescht (blue) Data shown are mean ± SD, n = 2 independent experiments; N = between 18 and 22 cells/condition per experiment. Scale bar = 5 μm. Relative intensity of pERM signals is shown in the adjacent graph. A one-way ANOVA test for significance was performed and the P values shown from Tukey’s multiple comparisons test.

Measurement of contractility markers in control and TEM4-depleted cells. (A) Circularity in control and TEM4-depleted metaphase cells, where 1 is considered a perfect circle. Data shown is mean ± SEM with ≥20 cells/condition, n = 3 independent experiments. A one-way ANOVA Kruskal–Wallis test followed by Dunn’s multiple comparison’s test was performed for analysis of significance. (B) Polarization microscopy of control and TEM4-depleted cells in interphase. Representative images and quantification optical retardance, n = 3. Scale bar = 10 μm. The graph illustrates retardance reading from individual cells (13–36 cells analyzed/condition/replicate acquired over 3 independent experiments). A one-way ANOVA test for significance was performed and the P values are shown from Holm-Šídák’s multiple comparisons test. (C) RhoA-GTP staining in control and TEM4-depleted cells. Fixed cells were stained with Phalloidin-Atto 565 (red), RhoA-GTP (green), and Hoechst (blue). Scale bar = 10 μm for the main image and 2 μm for the zoomed image. (D) pERM staining in control and TEM4 depleted cell. Representative IF images of cells stained with pERM (red) and Hoescht (blue) Data shown are mean ± SD, n = 2 independent experiments; N = between 18 and 22 cells/condition per experiment. Scale bar = 5 μm. Relative intensity of pERM signals is shown in the adjacent graph. A one-way ANOVA test for significance was performed and the P values shown from Tukey’s multiple comparisons test.
In addition to the phenotypes described above, we observed a thickening of the cortex with increased F-actin levels in TEM4 depleted cells indicative of increased cortical contractility that was reproducible in additional TEM4 shRNA clonal lines (Fig. 4, A and C and data not shown). These results were surprising given the role of TEM4 as a Rho activator. To explore this phenotype in more detail, we first used quantitative polarization microscopy to confirm decreased cell contractility in interphase cells depleted of TEM4 in agreement with the role of TEM4 in Rho activation (Fig. S4 B) (Lutz et al., 2013; Ngok et al., 2013; Rümenapp et al., 2002). In addition, we used a Rho-GTP-specific antibody to observe active RhoA localization in TEM4-depleted cells. As expected, given the localization of TEM4, we did not observe obvious global effects on Rho A activation; however, we noted decreased levels of active Rho A in lamellipodia and other F-actin rich structures in TEM4-depleted cells relative to controls (Fig. S4 C). These results indicate that in TEM4-depleted, spread, and attached interphase cells, contractility is reduced and Rho A activity is attenuated. In contrast to interphase cells, but in agreement with the increased F-actin density above, optical retardance measurements in mitotic cells were elevated in TEM4-depleted cells relative to controls, indicative of increased contractility (Fig. 4 D). We also measured by immunofluorescence RhoA-GTP signals at the cortex (Fig. 4, E and F) and phosphorylation of the ERM proteins (Fig. S4 D), known regulators of cortical contractility, and spindle organization and positioning (Carreno et al., 2008; Hirao et al., 1996; Kunda et al., 2008), and found a small but consistent increase in TEM4-depleted cells compared with controls, as previously reported (Ngok et al., 2013). Finally, to determine whether the cortical phenotypes in mitosis were dependent on TEM4 GEF activity or cortical localization, we generated additional stable cell lines expressing GFP-3xMYC- tagged TEM4∆ABD and the GEF-inactiveTEM4Y1216A in each of the TEM4-21 and TEM4-22 backgrounds (Fig. S5 A) and determined the capacity of these to rescue mitotic phenotypes relative to GFP-3xMYC-TEM4WT. We found that whereas TEM4WT partially rescued retraction fiber formation, actin levels, and circularity, TEM4Y1216A and TEM4∆ABD were unable to do so (Fig. 4, G and H; and Fig. S5, B–E). Taken together, our results demonstrate a requirement for TEM4 GEF activity and actin-binding capacity for mitotic entry and the proper regulation of F-actin at the cell cortex.

Generation of stable cell lines expressing shRNA TEM4 constructs. (A) Immunofluorescence images of stable cell lines expressing shResistant TEM4WT, TEM4ΔABD, and TEM4Y1216A. Scale bar = 5 μm for the main image and 1 μm for the zoomed image. (B and C) Relative actin intensity in TEM4-21 and TEM4-22 rescue cell lines. Between 35 and 90 cells were analyzed per condition from 3 replicate experiments. The bar represents the mean ± SD, and analysis of significance was performed using the Brown-Forsythe ANOVA test. (D and E) Circularity of TEM4-21 and TEM4-22 rescue cell lines. Between 35 and 90 cells were analyzed per condition from 3 replicates experiments. The bar represents the mean ± SD, and analysis of significance was performed using the Brown-Forsythe ANOVA test.

Generation of stable cell lines expressing shRNA TEM4 constructs. (A) Immunofluorescence images of stable cell lines expressing shResistant TEM4WT, TEM4ΔABD, and TEM4Y1216A. Scale bar = 5 μm for the main image and 1 μm for the zoomed image. (B and C) Relative actin intensity in TEM4-21 and TEM4-22 rescue cell lines. Between 35 and 90 cells were analyzed per condition from 3 replicate experiments. The bar represents the mean ± SD, and analysis of significance was performed using the Brown-Forsythe ANOVA test. (D and E) Circularity of TEM4-21 and TEM4-22 rescue cell lines. Between 35 and 90 cells were analyzed per condition from 3 replicates experiments. The bar represents the mean ± SD, and analysis of significance was performed using the Brown-Forsythe ANOVA test.
Rho kinase inhibition rescues mitotic actin contractility and cell cycle progression in TEM4-depleted cells
The cortical actin network in early mitosis is driven by the formin DIAPH1 that promotes cortical assembly of a non-branched actin network and the Rho kinases (ROCK1 and ROCK2) that activate non-muscle myosin II to crosslink the actin filaments generated by DIAPH1 thereby increasing contractility and tension (Lancaster and Baum, 2014; Rizzelli et al., 2020; Taubenberger et al., 2020). Given the increased contractility in TEM4-depleted cells, we reasoned that inhibition of ROCK1/2 should rescue the associated phenotypes. Cells were therefore released from a double thymidine block and monitored for mitotic entry at which point they were treated for 30 min with the ROCK inhibitor Y-27632 to acutely decrease cellular contractility (Ishizaki et al., 2000). This inhibition resulted in an increase in the percentage of TEM4-depleted cells with retraction fibers but had little effect on control cells (Fig. 5, A and B). Additionally, F-actin intensity at the cortex decreased significantly in TEM4-depleted cells treated with Y-27632 while it remained unchanged in control cells (Fig. 5 C). Moreover, we found that ROCK inhibition upon mitotic entry slightly but significantly increased the percentage of cells in mitosis under conditions of TEM4 depletion, indicating rescue of the slow mitotic passage (Fig. 5 D). Overall, our data show that decreasing contractility can, at least in part, rescue mitotic defects associated with the cortex in TEM4-depleted cells.

Rho kinase inhibition restores retraction fibers and reduces accumulation of f-actin at the cortex. (A) Control and TEM4-depleted cells were synchronized in mitosis after release from a double thymidine block and treated for 30 min with DMSO or the ROCK inhibitor, Y27632 (10 μM) prior to fixation. Cells were stained with Phalloidin-Atto 565 (magenta) and Hoechst (cyan). Scale bar = 5 μm. Orthogonal views are shown in the rightmost panel. (B) The percentage of cells from A with or without retraction fibers was quantified in metaphase cells in the presence of DMSO or Y27632. Data is mean ± SEM, n = 3 independent experiments, N ≥ 50 cells/condition. Statistical differences were measured by a One-way ANOVA and pairwise comparisons of protrusion-positive significance were determined by Tukey’s multiple comparison test. (C) Quantification of cortical actin intensity of cells from A. Data shown is mean ± SEM, n = 3 independent experiments, N ≥ 20 cells/condition. A one-way ANOVA test followed by Kruskal–Wallis for significance was performed followed by Dunn’s multiple comparisons test to determine P values. (D) Mitotic index in cells treated as in A. Data is shown from two representative experiments with ≥100 cells/condition. Individual datapoints represent individual fields of imaging within an experiment. A one-way ANOVA-Kruskal–Wallis for significance was performed followed by Dunn’s multiple comparisons test to determine P values.
Rho kinase inhibition restores retraction fibers and reduces accumulation of f-actin at the cortex. (A) Control and TEM4-depleted cells were synchronized in mitosis after release from a double thymidine block and treated for 30 min with DMSO or the ROCK inhibitor, Y27632 (10 μM) prior to fixation. Cells were stained with Phalloidin-Atto 565 (magenta) and Hoechst (cyan). Scale bar = 5 μm. Orthogonal views are shown in the rightmost panel. (B) The percentage of cells from A with or without retraction fibers was quantified in metaphase cells in the presence of DMSO or Y27632. Data is mean ± SEM, n = 3 independent experiments, N ≥ 50 cells/condition. Statistical differences were measured by a One-way ANOVA and pairwise comparisons of protrusion-positive significance were determined by Tukey’s multiple comparison test. (C) Quantification of cortical actin intensity of cells from A. Data shown is mean ± SEM, n = 3 independent experiments, N ≥ 20 cells/condition. A one-way ANOVA test followed by Kruskal–Wallis for significance was performed followed by Dunn’s multiple comparisons test to determine P values. (D) Mitotic index in cells treated as in A. Data is shown from two representative experiments with ≥100 cells/condition. Individual datapoints represent individual fields of imaging within an experiment. A one-way ANOVA-Kruskal–Wallis for significance was performed followed by Dunn’s multiple comparisons test to determine P values.
TEM4 depletion results in G1 delay and decreased expression of the mitotic cyclins
Given the contractility and retraction fiber abnormalities in TEM-depleted cells in early mitosis, we reasoned that the delay in the mitotic entry may be a consequence of an accumulation of cells at the G2/M boundary. To demonstrate this, we treated cells with nocodazole for 12 h and determined the cell cycle profile in control and both TEM4 shRNA cell lines using FACS. To our surprise, we found that while >60% of control cells accumulated in G2/M under these conditions, TEM4-depleted cells remained mostly in G1 with <30% progressing further (Fig. 6 A). In an effort to understand the mechanisms through which TEM4 regulates cell cycle progression, we turned initially to recent phosphoproteomic analysis performed in cancer cells depleted of endogenous TEM4. Using an integrated phosphoproteomic, genomic, and transcriptomic approach, TEM4 was identified as a candidate gene likely to drive changes in kinase signaling in the Hippo pathway (Memon et al., 2021). As part of this work, Memon et al. generated phosphoproteomics data from T47D and MDA-MB-468 breast cancer cell lines depleted of TEM4. Notably, these authors used TEM4 shRNA duplexes largely overlapping TEM4-22. Gene ontology enrichment analysis of phosphosites downregulated (log10-fold less than −0.5) in TEM4-depleted cells from these datasets revealed that in addition to changes in phosphorylation of proteins associated with “actin cytoskeleton organization” as anticipated for a RhoGEF, we observed enrichment of terms related to the progression of the cell cycle including “regulation of cell cycle processes,” “microtubule cytoskeleton organization,” and “mitotic cell cycle process” (Fig. S6, A and B; and Table S1). Importantly the enrichment of these terms was observed in both T4D and MDA-MB-468 cell lines only in the sites that were hypophosphorylated and was not observed for hyperphosphorylated sites (not shown). Next, we identified all downregulated phosphosites in TEM4-depleted cells in proteins with GO terms associations related to cell cycle progression and mitosis. In MDA-MB-468 cells, this led to the identification of 152 unique phosphosites in 111 proteins of which 43 (∼28%) were high-confidence phosphosites (probability of phosphosite assignment >94%) corresponding to a minimal CDK motif (SP/TP). In T47D cells, we found 85 unique phosphosites in 69 proteins of which 32 (∼38%) were high confidence sites matching the minimal CDK target motif (Table S2). These data suggest that loss of cyclin-CDK phosphorylation is prevalent in cells depleted of TEM4.

TEM4 depletion results in G1 delay and decreased expression of the mitotic cyclins. (A) Cell cycle distribution of control and TEM4-depleted cells measured by FACS. The indicated cell lines were treated for 12 h with 100 ng/ml nocodazole before being fixed and stained with Hoechst. Data shown are means ± SEM, n = 3 independent experiments. A one-way ANOVA-Brown–Forsythe test for significance was performed followed by Holm-Šídák’s multiple comparisons to determine P values. (B) Control, TEM4-21, and TEM4-22 cells were left asynchronous, synchronized at G2/M with nocodazole, or in mitosis after a nocodazole arrest and mechanical dislocation of round mitotic cells. Equalized lysates were then blotted for the indicated antibodies. (C) Expression of CCNE1 in interphase was measured by qPCR in the indicated cell lines and expressed as fold change relative to HPRT. Data shows mean ± SEM, n = 4 independent experiments. A one-way ANOVA-Brown–Forsythe test for significance was performed followed by Dunnett’s T3 multiple comparisons. (D) Control, TEM4-21, and TEM4-22 cells were treated as in B, and lysates were probed with the indicated antibodies. (E) Expression of CDKN1A in interphase was measured by qPCR in the indicated cell lines and expressed as fold change relative to HPRT. Data shows mean ± SEM, n = 3 independent experiments. A one-way ANOVA-Kruskal–Wallis for significance was performed followed by Dunn’s multiple comparisons test. (F) Control, TEM4-21, and TEM4-22 cells were treated as in B, and lysates were probed with the indicated antibodies. * indicates non-specific band. (G) Expression of CCNB1 in mitosis was measured by qPCR in the indicated cell lines and expressed as fold change relative to HPRT. Data show mean ± SEM, n = 3. Significance was determined by two-way ANOVA followed by Tukey’s multiple comparisons test to determine P values. (H) Lysates from cells synchronized in G2/M and M phase as in B and blotted for the indicated antibodies. Source data are available for this figure: SourceData F6.
TEM4 depletion results in G1 delay and decreased expression of the mitotic cyclins. (A) Cell cycle distribution of control and TEM4-depleted cells measured by FACS. The indicated cell lines were treated for 12 h with 100 ng/ml nocodazole before being fixed and stained with Hoechst. Data shown are means ± SEM, n = 3 independent experiments. A one-way ANOVA-Brown–Forsythe test for significance was performed followed by Holm-Šídák’s multiple comparisons to determine P values. (B) Control, TEM4-21, and TEM4-22 cells were left asynchronous, synchronized at G2/M with nocodazole, or in mitosis after a nocodazole arrest and mechanical dislocation of round mitotic cells. Equalized lysates were then blotted for the indicated antibodies. (C) Expression of CCNE1 in interphase was measured by qPCR in the indicated cell lines and expressed as fold change relative to HPRT. Data shows mean ± SEM, n = 4 independent experiments. A one-way ANOVA-Brown–Forsythe test for significance was performed followed by Dunnett’s T3 multiple comparisons. (D) Control, TEM4-21, and TEM4-22 cells were treated as in B, and lysates were probed with the indicated antibodies. (E) Expression of CDKN1A in interphase was measured by qPCR in the indicated cell lines and expressed as fold change relative to HPRT. Data shows mean ± SEM, n = 3 independent experiments. A one-way ANOVA-Kruskal–Wallis for significance was performed followed by Dunn’s multiple comparisons test. (F) Control, TEM4-21, and TEM4-22 cells were treated as in B, and lysates were probed with the indicated antibodies. * indicates non-specific band. (G) Expression of CCNB1 in mitosis was measured by qPCR in the indicated cell lines and expressed as fold change relative to HPRT. Data show mean ± SEM, n = 3. Significance was determined by two-way ANOVA followed by Tukey’s multiple comparisons test to determine P values. (H) Lysates from cells synchronized in G2/M and M phase as in B and blotted for the indicated antibodies. Source data are available for this figure: SourceData F6.

Enrichment of GO annotation terms in phosphosites identified after depletion of TEM4. Gene ontology analysis was performed with Metascape on the list of hypophosphorylated proteins in T47D and MDA-MB-468 cells depleted of TEM4 as identified by Memon et al. (2021). The full list of genes is provided in Table S1.

Enrichment of GO annotation terms in phosphosites identified after depletion of TEM4. Gene ontology analysis was performed with Metascape on the list of hypophosphorylated proteins in T47D and MDA-MB-468 cells depleted of TEM4 as identified by Memon et al. (2021). The full list of genes is provided in Table S1.
To determine the mechanism through which TEM4 regulates cell cycle progression, we first sought to explore the effect of TEM4 on the protein and mRNA levels of cyclin proteins and their inhibitors. For this, lysates were prepared from three populations of control and TEM4-depleted cells enriched in G1, and enriched in G2-M and M-phase cells. In both TEM4 shRNA cell lines, we found increased levels of cyclin E protein but not mRNA compared with control cells in all cell populations, even in mitotic cells generated by mechanical shakeoff, suggesting that TEM4 depletion impeded efficient degradation of cyclin E (Fig. 6, B and C), and in agreement with the delay of these cells in G1/S. Moreover, we found that TEM4-depleted cells resulted in elevated protein levels of the cyclin E/CDK2 inhibitor p21 in both interphase and G2-M cells, as well as elevated mRNA levels in interphase cells compared with control (Fig. 6, D and E). These observations strongly suggest that TEM4 depletion slows cell cycle progression via upregulation of the cyclin E-CDK2 inhibitor p21 and explains the decrease in CDK target phosphorylation despite increased levels of cyclin E.
We next determined the effect of TEM4 depletion on the expression and activity of the late cyclins, cyclin A and cyclin B. Compared with control, we consistently observed a reduction in cyclin B and cyclin A protein in both G2-M and M populations in TEM4-depleted cells (Fig. 6 F). By qPCR, we found that CCNB1 transcripts from mitotic cells were significantly lower than in control cells (Fig. 6 G). Finally, we show that global Ser/Thr phosphorylation (as measured by the anti-pSer/pThr-Pro MPM2 antibody) is severely reduced in G2-M and M lysates compared with controls, indicating reduced CDK1 activity. Overall, these observations explain the G1 delay seen in TEM4-depleted cells as well as the breadth of phenotypes seen in TEM4-depleted mitotic cells and indicate that loss of TEM4 results in a loss of proper cyclin expression culminating in attenuated cyclin B–CDK1 activity in mitosis.
Expression of exogenous cyclin B rescues cortical and mitotic phenotypes in TEM4-depleted cells
The observations above suggest that TEM4 may contribute to mitotic progression by ensuring the proper expression of cyclin B. We, therefore, asked whether the expression of exogenous cyclin B could rescue mitotic errors in TEM4-depleted cells. To this end, we transfected GFP-cyclin B into control, TEM4-21, and TEM4-22 cells (Fig. 7 A), and first checked for rescue of actin-rich retraction fibers, a structure dependent on cyclin B-CDK1 activity (Chen et al., 2022; Jones et al., 2018, 2019; Robertson et al., 2015). In control cells, overexpression of cyclin B1 had little effect on the percentage of cells with visible retraction fibers. In contrast, GFP–Cyclin B expression significantly increased the percentage of cells with retraction fibers in TEM4-depleted cells, indicating at least partial rescue of this phenotype (Fig. 7 B). Next, we monitored the effect of GFP-cyclin B expression on the progression of mitosis. To do this, control and TEM4-depleted cells expressing GFP or GFP-Cyclin B were synchronized in mitosis after a release from thymidine before fixation and quantification of the distribution of mitotic stages in the different cell lines. While GFP-Cyclin B expression had little effect on the progress of control cells, as illustrated by the relatively similar percentages of cells in the various mitotic stages in the presence or absence of exogenous cyclin B and as previously reported (Jin et al., 1998; Laoukili et al., 2005), GFP-cyclin B expression shifted the profile of TEM4-21 and TEM4-22 cells relative to expression of GFP-alone, with a higher percentage of cells in anaphase and telophase in lieu of fewer cells in prometaphase (Fig. 7 C). In agreement with these results, we find that the mitotic index in cells expressing GFP-cyclin B and treated with nocodazole was restored almost to control levels in TEM4-depleted cells (Fig. 7 D). In addition, GFP-Cyclin B overexpression effectively rescued anaphase lagging chromosomes in TEM4-depleted cells, whereas overexpression of cyclin B increased lagging chromosomes in control cells as previously reported (Davydenko et al., 2013) (Fig. 7 E). Taken together, our results suggest that the major consequences of the disrupted mitoses identified in TEM4-depleted cells can be rescued by restoring cyclin B.

Overexpression of Cyclin B restores the mitotic index, cell cycle progression and reduces lagging chromosomes in TEM4-depleted cells. (A) Control and TEM4-depleted cells were transfected with GFP- or GFP-cyclin B for 48 h prior to total protein extraction with RIPA buffer. Western blotting was performed with the indicated antibodies. (B) Cells grown on coverslips were transfected as in A and synchronized in mitosis with 100 ng/ml of nocodazole for 12 h prior to fixation with PTEMF. Data show mean ± SEM, n = 3 independent experiments, N ∼ 200 cells. A two-way ANOVA test for significance was performed followed by Šídák’s multiple comparisons test to determine P values. (C) Mitotic progression of TEM4-depleted cells in the presence or absence of cyclin B. TEM4. Cells were transfected as in B and synchronized in mitosis after release from double thymidine block and the percentage of cells in each mitotic stage was calculated for all indicated conditions. Data shows mean ± SEM, n = 3 independent experiment, N ≥ 50 cells per condition. A two-way ANOVA test for significance was performed followed by Tukey’s multiple comparisons test to determine P values. (D) Mitotic index in TEM4-depleted cells in the presence or absence of cyclin B. Cells were treated for 12 h with taxol. Data show means ± SEM, n = 3 independent experiments, N ≥ 25 cells per condition. A two-way ANOVA test for significance was performed followed by Tukey’s multiple comparisons test to determine P values. (E) Quantifications of lagging chromosomes in TEM4 depleted in the presence or absence of cyclin B. Cells were treated for 12 h with 0.4 μΜ RO-3306 and released into fresh media for 1.5 h. Data show mean ± SEM, n = 3, N ≥ 25 cells per condition. A two-way ANOVA test for significance was performed followed by Tukey’s multiple comparisons test to determine P values. Source data are available for this figure: SourceData F7.
Overexpression of Cyclin B restores the mitotic index, cell cycle progression and reduces lagging chromosomes in TEM4-depleted cells. (A) Control and TEM4-depleted cells were transfected with GFP- or GFP-cyclin B for 48 h prior to total protein extraction with RIPA buffer. Western blotting was performed with the indicated antibodies. (B) Cells grown on coverslips were transfected as in A and synchronized in mitosis with 100 ng/ml of nocodazole for 12 h prior to fixation with PTEMF. Data show mean ± SEM, n = 3 independent experiments, N ∼ 200 cells. A two-way ANOVA test for significance was performed followed by Šídák’s multiple comparisons test to determine P values. (C) Mitotic progression of TEM4-depleted cells in the presence or absence of cyclin B. TEM4. Cells were transfected as in B and synchronized in mitosis after release from double thymidine block and the percentage of cells in each mitotic stage was calculated for all indicated conditions. Data shows mean ± SEM, n = 3 independent experiment, N ≥ 50 cells per condition. A two-way ANOVA test for significance was performed followed by Tukey’s multiple comparisons test to determine P values. (D) Mitotic index in TEM4-depleted cells in the presence or absence of cyclin B. Cells were treated for 12 h with taxol. Data show means ± SEM, n = 3 independent experiments, N ≥ 25 cells per condition. A two-way ANOVA test for significance was performed followed by Tukey’s multiple comparisons test to determine P values. (E) Quantifications of lagging chromosomes in TEM4 depleted in the presence or absence of cyclin B. Cells were treated for 12 h with 0.4 μΜ RO-3306 and released into fresh media for 1.5 h. Data show mean ± SEM, n = 3, N ≥ 25 cells per condition. A two-way ANOVA test for significance was performed followed by Tukey’s multiple comparisons test to determine P values. Source data are available for this figure: SourceData F7.
TEM4 depletion results in loss of YAP protein
How TEM4 regulates the expression of cell cycle regulatory genes to drive proliferation is an interesting question. Recent reports suggest that TEM4 is a direct target of yes-associated protein (YAP) (Lin et al., 2017; Memon et al., 2021; Wang et al., 2018b). YAP and its paralog TAZ are transcriptional coactivators of the Hippo pathway and are potent regulators of cell cycle progression, proliferation, differentiation, and tissue homeostasis (Hansen et al., 2015; Pocaterra et al., 2020; Zheng and Pan, 2019). The observation that YAP regulates TEM4 expression, together with the similar effect of TEM4 and YAP inhibition on cell cycle progression, led us to postulate that TEM4 and YAP may collaborate to regulate the cell cycle. In agreement with previous observations, we indeed found that either depletion of YAP by siRNA or inhibition with verteporfin resulted in decreased TEM4 protein and the anticipated decrease in YAP as well as the previously reported increase in p21 (Fig. 8 A; and Fig. S7, A and B) (Jang et al., 2017; Zhang et al., 2021). Moreover, mining of publicly available gene and protein expression datasets indicated a relatively robust correlation between the expression of YAP and TEM4 (Fig. S7, C and D), in agreement with the idea that TEM4 and YAP may reciprocally regulate each other. To explore this idea, we tested the effect of TEM4 depletion on YAP levels by immunofluorescence and found that in proliferating cells, depletion of TEM4 resulted in a decrease in a global YAP protein and a corresponding increase in p21, as anticipated (Fig. 8, B and C). Loss of YAP in TEM4 depleted cells was further corroborated by western blotting, and YAP was stably decreased for up to 120 h after TEM4 shRNA induction with a stronger effect induced by TEM4-22 than TEM4-21 (Fig. 8, C and D; and Fig. S7 C). This reduction in YAP levels may respond to Hippo signaling because a decrease in YAP levels was more evident in cells grown at low density than high density (Fig. 8 E) and loss of TEM4 deregulated the nucleocytoplasmic translocation of YAP in proliferating cells (Fig. 8 F). To determine whether TEM4 regulates YAP protein abundance through protein degradation or translation, we treated control, TEM4-21, and TEM4-22 cell lines with either DMSO vehicle, the proteasomal inhibitor MG132, or the translational inhibitor cycloheximide (CHX) for 5 h (Fig. 8 G). Whereas MG132 treatment had no effect on YAP protein levels, treatment of TEM4-21 and TEM4-22 cells with CHX resulted in a clear decrease in YAP protein suggesting that TEM4 regulates YAP levels, at least in part through translation. Finally, we asked whether attenuation of YAP levels may be the major mechanism through which TEM4 regulates cell cycle progression. For this, we took advantage of the quantitative differences in YAP regulation between TEM4-21 and TEM4-22 and treated the cell lines with DMSO or verteporfin prior to an overnight nocodazole treatment to determine the effect of the combined treatment on the mitotic index. As expected, TEM4 depletion significantly decreased the mitotic index. In both control cells and TEM4-21 (in which some YAP protein remains expressed), verteporfin treatment further decreased the mitotic index, whereas in TEM4-22, where YAP levels are the lowest observed, further verteporfin treatment had no notable effect on the mitotic index (Fig. 8 H and Fig. S7 D). These observations collectively demonstrate that TEM4 regulates cell cycle progression and fidelity primarily by promoting proper translation of the pro-proliferation transactivation factor YAP.

TEM4 depletion results in the reduction of YAP protein levels. (A) HeLa cells were depleted of YAP by increasing the concentration of siRNA (0–100 nM of each duplex), and lysates were probed with the indicated antibodies. Band intensity in the linear range relative to α-tubulin is indicated in Fig. S7 B. (B) Control and TEM4-depleted cells were fixed probed with the indicated antibodies. Scale bar = 5 μm. (C) The relative total intensity of YAP from B. Data show mean ± SEM, n = 3 independent experiments, N ≥ 45 cells per condition. A one-way ANOVA and Brown-Forsythe test for significance was performed followed by Dunnett’s T3 multiple comparisons test. (D) Control and TEM4-depleted lysates were probed for the indicated proteins by western blotting. YAP signal intensity in the linear range relative to GAPDH is indicated. * denotes the YAP paralog TAZ. (E) Normalized YAP intensity in the indicated cell lines grown at low versus high density. Pairwise comparisons are shown between control and TEM-depleted cells. Data shows mean ± SEM, n = 3 independent experiments, N ≥ 33 cells per condition. A one-way ANOVA test for significance was performed followed by Tukey’s multiple comparisons test to determine P values. (F) Normalized nuclear (N) and cytoplasmic (C) YAP intensity in the indicated cell lines. Pairwise comparisons are shown between control and TEM-depleted cells, and between nuclear and cytoplasmic fractions for each cell line. Data shows mean ± SEM, n = 3 independent experiments, N ≥ 35 cells per condition. A one-way ANOVA test for significance was performed followed by Tukey’s multiple comparisons test. (G) Control and TEM4 depleted cells were treated with DMSO, MG132, or cycloheximide (CHX) for 5 h before lysis and western blotting with the indicated antibodies. YAP signal intensity in the linear range relative to GAPDH is indicated. (H) Mitotic index in the indicated cell lines treated with either DMSO (D) or the YAP inhibitor verteporfin (0.5 μM for 24 h) with nocodazole treatment in the final 12 h. Data shows mean ± SEM, n = 3 independent experiments, N ≥ 600 cells per condition. A one-way ANOVA test for significance was performed followed by Tukey’s multiple comparisons test. (I) Model of TEM4 regulation of YAP. See discussion for details. Source data are available for this figure: SourceData F8.
TEM4 depletion results in the reduction of YAP protein levels. (A) HeLa cells were depleted of YAP by increasing the concentration of siRNA (0–100 nM of each duplex), and lysates were probed with the indicated antibodies. Band intensity in the linear range relative to α-tubulin is indicated in Fig. S7 B. (B) Control and TEM4-depleted cells were fixed probed with the indicated antibodies. Scale bar = 5 μm. (C) The relative total intensity of YAP from B. Data show mean ± SEM, n = 3 independent experiments, N ≥ 45 cells per condition. A one-way ANOVA and Brown-Forsythe test for significance was performed followed by Dunnett’s T3 multiple comparisons test. (D) Control and TEM4-depleted lysates were probed for the indicated proteins by western blotting. YAP signal intensity in the linear range relative to GAPDH is indicated. * denotes the YAP paralog TAZ. (E) Normalized YAP intensity in the indicated cell lines grown at low versus high density. Pairwise comparisons are shown between control and TEM-depleted cells. Data shows mean ± SEM, n = 3 independent experiments, N ≥ 33 cells per condition. A one-way ANOVA test for significance was performed followed by Tukey’s multiple comparisons test to determine P values. (F) Normalized nuclear (N) and cytoplasmic (C) YAP intensity in the indicated cell lines. Pairwise comparisons are shown between control and TEM-depleted cells, and between nuclear and cytoplasmic fractions for each cell line. Data shows mean ± SEM, n = 3 independent experiments, N ≥ 35 cells per condition. A one-way ANOVA test for significance was performed followed by Tukey’s multiple comparisons test. (G) Control and TEM4 depleted cells were treated with DMSO, MG132, or cycloheximide (CHX) for 5 h before lysis and western blotting with the indicated antibodies. YAP signal intensity in the linear range relative to GAPDH is indicated. (H) Mitotic index in the indicated cell lines treated with either DMSO (D) or the YAP inhibitor verteporfin (0.5 μM for 24 h) with nocodazole treatment in the final 12 h. Data shows mean ± SEM, n = 3 independent experiments, N ≥ 600 cells per condition. A one-way ANOVA test for significance was performed followed by Tukey’s multiple comparisons test. (I) Model of TEM4 regulation of YAP. See discussion for details. Source data are available for this figure: SourceData F8.
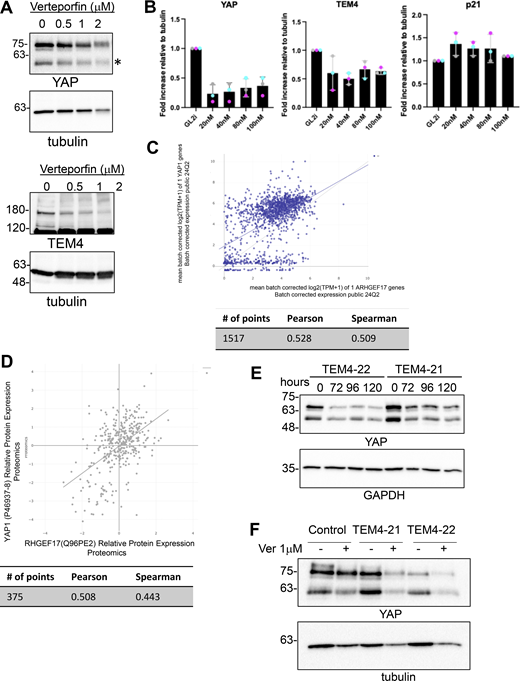
YAP reduction in TEM4-depleted cell lines. (A) HeLa cells were treated with an increasing dose of the YAP inhibitor verteporfin for 24 h. Lysates were generated and probed with the indicated antibodies by western blotting. * TAZ band. (B) Quantification of western blots shown in Fig. 8 A. (C) Correlation of ARHGEF17 and YAP1 gene expression. Data generated via Depmap portal. (D) Correlation of TEM4 and YAP protein levels from publicly accessible proteomics datasets. Data generated via Depmap portal. (E) TEM4-21 and TEM4-22 cells were left uninduced or were induced for the indicated time points and lysates were probed as indicated. (F) Control, TEM4-21, and TEM4-22 cells were treated with 1 µM verteporfin for 24 h as indicated before immunoblotting for YAP and tubulin. Source data are available for this figure: SourceData FS7.

YAP reduction in TEM4-depleted cell lines. (A) HeLa cells were treated with an increasing dose of the YAP inhibitor verteporfin for 24 h. Lysates were generated and probed with the indicated antibodies by western blotting. * TAZ band. (B) Quantification of western blots shown in Fig. 8 A. (C) Correlation of ARHGEF17 and YAP1 gene expression. Data generated via Depmap portal. (D) Correlation of TEM4 and YAP protein levels from publicly accessible proteomics datasets. Data generated via Depmap portal. (E) TEM4-21 and TEM4-22 cells were left uninduced or were induced for the indicated time points and lysates were probed as indicated. (F) Control, TEM4-21, and TEM4-22 cells were treated with 1 µM verteporfin for 24 h as indicated before immunoblotting for YAP and tubulin. Source data are available for this figure: SourceData FS7.
Discussion
TEM4 is an understudied RhoGEF that plays a role in numerous cell functions through its role in remodeling the actin cytoskeleton. Here, we provide evidence that it favors cell cycle progression at the G1/S transition by promoting the translation of the pro-proliferation transcriptional coactivator YAP, indirectly supporting the efficient expression of mitotic cyclins and hence the accurate execution of cell division. TEM4 regulation of YAP translation likely occurs via Rho A, which has been recently shown to regulate YAP translation downstream of androgen receptor activation in prostate cancer cells (Salem et al., 2023). Because TEM4 is itself a target of YAP (Lin et al., 2017; Memon et al., 2021; Wang et al., 2018b), these proteins may be involved in a positive feedback loop that responds to signals regulating the mechanical state of the cell (Fig. 8 I). In agreement with this, TEM4 activity is upregulated by highly dynamic F-actin (Mitin et al., 2012) and is important for the maintenance of cell junctions, epithelia monolayer integrity and endothelial cell barrier functions (Ngok et al., 2013), cellular functions that are also regulated by YAP. TEM4 may thus function both as a mechanosensor (via cytoskeletal regulation of its catalytic activity) and mechanotransducer (via its regulation of Rho A signaling and YAP) linking the contractile state of the cell to the cell cycle regulatory machinery (Fig. 8 I).
Using two shRNAs throughout the entire study, we show that TEM4 depletion results in a marked delay in G1 despite high levels of cyclin E. This G1 delay is a result of elevated expression of the cyclin E-CDK2 inhibitor p21. In agreement with the idea that TEM4 GEF activity is important for cell cycle progression, levels of p21 have been shown to increase upon Rho A inhibition or depletion (Adnane et al., 1998; Coleman et al., 2006; Han et al., 2005; Liberto et al., 2002; Olson et al., 1998), after YAP depletion (Fig. 8 A [Jang et al., 2017; Zhang et al., 2021]), and in cells treated with agents that prevent actin polymerization such as cytochalasin D and Latrunculin B (Coleman et al., 2006; Lee et al., 2009; Lohez et al., 2003). The G1 delay caused by TEM4 depletion resulted in a tempered cell cycle with ultimately decreased expression of the G2 and M phase cyclins and diminished CDK1-mediated phosphorylation events in cells that progress toward mitosis. Consequently, TEM4-depleted cells exhibited significant defects in the execution of mitotic functions that depend on fine-tuned CDK1 activity including mitotic entry and progression, retraction fiber and spindle formation, and positioning and accurate chromosome segregation. Although we did not find any strong defects in the SAC in cells depleted of TEM4 under the conditions tested here, the lack of sufficient cyclin B-CDK1 activity may weaken the SAC response when challenged with longer arrest times or when the SAC is further sensitized. Indeed, although our immunofluorescence experiments localize the bulk of TEM4 with the cortex in mitosis, we cannot exclude the presence of a small pool at the kinetochore as previously reported (Isokane et al., 2016). Given the importance of cyclin B-CDK1 activity in early mitosis, it is likely that a host of additional early mitotic events are deregulated in response to TEM4 depletion.
Our observations are consistent with the idea that mitotic phenotypes observed in TEM4-depleted cells are both an indirect effect of suboptimal cyclin B expression and lower CDK1 activity, as well as a direct effect of TEM4 cortical functions in mitosis. In agreement with the former, cyclin B expression significantly restored mitotic progression and reduced chromosome missegregation in anaphase, the ultimate readout of the robustness of mitotic machinery, to control levels. Cyclin B expression also partly rescued retraction fibers, remnants of focal adhesions that disassemble in a CDK1-dependent manner before entry into mitosis (Jones et al., 2018, 2019). Cyclin B–CDK1 phosphorylation of MISP, a protein involved in centrosome clustering spindle orientation and positioning (Maier et al., 2013), the integrin activator kindlin (Chen et al., 2022), and the formin protein DIAPH1 (Nishimura et al., 2019) have all been shown to regulate retraction fibers and cortical tension at mitotic entry, and a recent proteomics screen has indicated that many more CDK1 targets may be able to influence this process (Robertson et al., 2015). The rescue effect is only partial, potentially due to transgene expression at sub-endogenous levels from a single site of integration in the T-REx system or, as suggested above, to additional roles of TEM4 at the cortex. Indeed, one curious observation we made was the increased contractility and F-actin accumulation in round mitotic cells in the absence of TEM4, in stark contrast to the decrease in contractility observed in attached interphase cells (Fig. 4 D and Fig. S4 B). During cell spreading, another context involving cell rounding, a recent study reported that TEM4 depletion also resulted in prominent F-actin signals and an increase in focal adhesion size, markers of cellular contractility, in addition to strong accumulation of TEM4 at sites of actomyosin arc disassembly (Rao et al., 2024, Preprint). The authors suggested that in attaching cells, loss of TEM4 leads to loss of actomyosin disassembly in the lamella culminating in the accumulation of F-actin, focal adhesions, and elevated contractility (Rao et al., 2024, Preprint). Mechanistically, localized tension in the actin network generated through a TEM4-Rho A-ROCK axis may contribute to disassembly. Although initially counterintuitive given the role of bulk Rho A signaling in F-actin assembly, both in vitro (Murrell and Gardel, 2012) and in vivo (Wilson et al., 2010), studies support this idea and demonstrate that myosin contractility can contribute to disassembly of actin networks. Moreover, a previous report also suggested that TEM4 may be required to suppress myosin contractility (Mitin et al., 2013). Loss of TEM4 may also indirectly, through attenuated expression of YAP and its downstream targets including RhoGAPs, contribute to increased Rho A activation and F-actin accumulation (see below). These collective observations support a model where TEM4 contributes to F-actin disassembly and underscores the need for further fine-tuned, spatiotemporal examination of Rho signaling in different cellular models of contractility.
Curiously, and despite the clear function of TEM4 as a Rho activator (Lutz et al., 2013; Mitin et al., 2013; Müller et al., 2020), we observed a small but consistent increase in Rho A-GTP in mitotic cells, consistent with Mitin et al. (2013). We suspect that this increase is due to the loss of RhoGAP expression as a consequence of reduced YAP. In agreement, the loss of YAP has been shown to downregulate the expression of a number of RhoGAPs including ARHGAP28, ARHGAP29, ARHGAP30, DLC1, and STARD8 (Porazinski et al., 2015; Qiao et al., 2017; Rogg et al., 2023; van der Stoel et al., 2020). Particularly interesting is ARHGAP29, the expression of which downstream of YAP has been demonstrated to suppress the Rho A-LIM kinase-cofilin pathway (Qiao et al., 2017). Cofilin, an actin depolymerizing factor is functionally blocked by this pathway. Loss of YAP, via reduction of ARHGAP29, would therefore increase Rho A activity to inhibit cofilin thereby stabilizing F-actin. An alternative but not mutually exclusive explanation comes from the observation that TEM4 may preferentially target Rho C over Rho A (Mitin et al., 2013; A. Robert, J.-F. Côté and SE, unpublished result). Because Rho C antagonizes the activity of Rho A, loss of TEM4 may indirectly result in Rho A activation (Giang Ho et al., 2011; Mitin et al., 2013). Regardless of the exact reason, this uptick in Rho A activity in mitosis may collaborate with the elevated F-actin network in TEM4-depleted cells to further enhance cortical contractility in mitosis. Clearly, further studies will be needed to dissect the interplay between YAP and TEM4 in the regulation of and by the cytoskeleton. Nevertheless, our data support a general model where in mitosis, TEM4 may have an important function (potentially both direct and indirect) in restricting actomyosin contractility, whereas in interphase, TEM4 collaborates with the YAP transcriptional coactivator in a positive feedback loop to drive timely progression of the cell cycle at the G1/S transition. Together, these activities would cooperate to ensure the proper execution of mitosis and genome fidelity. To the best of our knowledge, TEM4 is the first RhoGEF shown to regulate cell cycle progression in G1.
Materials and methods
Cell lines
HeLa-T-REx Flp-IN (gift from the Desai lab) and HCT-116 (gift from the Nigg lab) cell lines were cultured at 37°C with 5% CO2 in Dulbecco’s Modified Eagle Medium (DMEM; Hyclone) and RPMI medium, respectively, supplemented with 10% fetal bovine serum and 1% penicillin–streptomycin (100 µg/ml-1; Hyclone). For shRNA induction, TEM4-21 and TEM4-22 cells were treated with 0.5 µg/ml of Doxycycline for 48 or 72 h as specified.
Drug treatments and transfections
Drug treatment was performed as follows, unless otherwise indicated: Thymidine (2 mM for 16 h; Acros Organics), MG132 (20 μM for 2.5 or 5 h as indicated; Calbiochem), nocodazole (100 ng/ml for 12 h; Sigma-Aldrich), S-trityl-L-cysteine (STLC, 5 μM for 12 h; Sigma-Aldrich), Paclitaxel (taxol, 15 nM for 14 h; Calbiochem), Y27632 (10 μM for 30 min; Calbiochem), cycloheximide (10 μg/ml, 5 h), and Verteporfin (0.5 μM, 24 h). Plasmid transfections were performed using FuGENE HD according to the manufacturer’s protocol.
SiRNA, shRNA construction and generation of inducible cell lines, and shRNA TEM4-resistant cell lines
HeLa-TREx stable cell lines expressing inducible shRNA targeting TEM4 (TEM4-21 and TEM4-22) have been previously described where degradation is induced after 48 h of treatment (Prifti et al., 2022). The same approach was used for the generation of the HCT116 lines with inducible TEM4 depletion. After lentivirus preparation and infection, single-cell clones were expanded and screened via immunoblot and genomic sequencing. HeLa-TREx stable cell lines expressing TEM4WT, TEM4ΔABD, and TEM4Y1216A were generated using the Flp-In system (Life Technologies) according to the manufacturer’s instructions in the background of inducible shRNA. TEM4 cDNA was cloned in pcDNA5-FRT-TO with an N-terminal 3xMYC-GFP tag and was rendered resistant to both sh21 and sh22 by introducing silent mutations using the following primers: shRNA-TEM4-21 Forward 5′-GTACCTCAATAATCAAGTATTTGTGTCTCTGGCCAATGGAGAG-3′, Reverse 5′-ATACTTGATTATTGAGGTACAAGATGCAGGTCACAGAGGCCG-3′ and for shRNA-TEM4-22 Forward 5′-AATACTCTGGATCACCTCCTGATATCCCTTGCTCTCTTCACTGC-3′ and Reverse 5′-AGGTGATCCAGAGTATTGTTCAGGGGCCTGGCACCCTGGGGCGTG-3′. As both shRNA and rescue constructs are under the control of the doxycycline promoters, the expression of both is achieved simultaneously. YAP1 dsiRNA oligos were purchased from IDT and targeted the following sequences dsiYAP1_1:5′-GACATCTTCTGGTCAGAGATACTTC-3′ and dsiYAP1_2: 5′-GCCACCAAGCTAGATAAAGAAAGCT-3′ and where use simultaneously to knockdown YAP1 at the indicated concentrations for 48–72 h.
Microtubule regrowth assay
Microtubule regrowth was performed as previously published (Tulu et al., 2006). Essentially, cells were plated and 48 h later were treated with 3.3 μM of nocodazole for 3 h. Media containing nocodazole was washed out four times with warm PBS, followed by a wash in warm media. Cells were then incubated in warm media for the indicated time points to allow for microtubule regrowth before addition of cold methanol for 10 min at −20°C for simultaneous fixation and permeabilization.
Cold treatment assay
Cells were washed twice with cold PBS and incubated on ice for 20 min in the presence of a cold DMEM medium. Fixation was performed with cold PTEMF buffer (0.2% Triton X-100, 20 mM PIPES pH 6.8, 1 mM MgCl2, 10 mM EGTA, and 4% formaldehyde) for 10 min.
Protein extraction and western blotting
Cell pellets were lysed in RIPA lysis buffer (150 mM Tris-HCL pH 7.5, 150 mM NaCl, 10 mM NaF, 1% NP-40, and 0.1% Na-deoxycholate) or 8 M urea lysis buffer (8 M urea, 50 mM HEPES pH 7,5, 5% glycerol, and 1.5 mM MgCl2) with a protease and phosphatase inhibitor cocktail that included 20 mM B-glycerophosphate, 0.1 mM sodium vanadate, 10 mM sodium pyrophosphate, 1 mg.ml−1, leupeptin, 1 mg.ml−1, aprotinin and 1 mM AEBSF. Lysed cells were incubated on an orbital shaker at 4°C for a minimum of 30 min and followed by centrifugation at maximum speed for 20 min at 4°C. The supernatant was collected and quantified using the BCA assay (Thermo Fisher Scientific) prior to western blotting. Protein extracts were diluted in SDS-PAGE sample buffer and loaded onto 8–12% SDS-PAGE gels. Membranes (PVDF, Immobilon-P; MilliporeSigma) were blocked in 5% of milk diluted in PBS and containing 0.05% of Tween-20 for 30 min, and then incubated overnight at 4°C with a primary antibody in 5% of milk in PBS. Membranes were washed with PBS containing 0.05% Tween-20 and incubated with the appropriate secondary antibody conjugated to horseradish peroxidase for 1 h at room temperature. After three additional washes, antibody binding was detected with either the Clarity or Clarity Max Western ECL substrate (Bio-Rad) and ChemiDoc MP Imaging System (Bio-Rad). The following antibodies were used for western blotting: The anti-TEM4 used is a custom-made Rabbit polyclonal antibody (Biomatik) generated against the following peptide sequence: RWSGGPGLREEDTDTPG-Cys. Peptide purified serum was subsequently used for Westerns (1:500); anti-Cyclin A (clone 25, AB_398797; BD Transduction Laboratories); anti- Cyclin B1 (V152, RRID: AB_2233956; Cell signaling); anti-Cyclin D1 (92G2, AB_2259616; Cell Signaling technology); anti-Cyclin E (HE12, sc-247, AB_627357; Santa Cruz); anti-GFP (1:500, AB_2630379; Millipore); Anti-pSer/Thr-Pro MPM-2 (AB_309698; EMD Millipore), anti-γ-tubulin (TU-30, ab27074, AB_2211240; Abcam); anti-GAPDH (1A10, NBP1-47339, AB_10010294; Novus Biologicals); anti-p21(Cell #2947, AB_2260325; Signalling technology); anti-YAP1 (sc-101199, AB_1131430; Santa Cruz); and anti-NuMA (GT3611, AB_2538759; Thermo Fisher Scientific). Peroxidase-AffiniPure Goat Anti-Rabbit and Anti mouse IgG (H+L) were purchased from Jackson ImmunoResearch Inc (Cat #111-035-003, 115-035-003).
RNA extraction and purification
Cell pellets were incubated with RLT lysis buffer (Qiagen) containing 10% β-mercaptoethanol (M3148; Sigma-Aldrich) for total RNA extraction, which was further purified with the RNeasy Mini Kit (Qiagen) according to the manufacturer’s protocol. Samples were incubated with RNase-free DNase (Qiagen) to eliminate potential genomic contamination and Nanodrop 1000 microvolume spectrophotometer (Thermo Fisher Scientific) was used to evaluate the quantity and quality of purified total RNA. Samples were stored at −80°C until use.
Reverse transcription and quantitative real-time PCR (qRT-PCR)
iScript Advanced cDNA Synthesis Kit for PCR (BioRad) was used for Reverse Transcription (RT) of 1 µg RNA for each sample, following the manufacturer’s protocol. Real-time quantitative PCR was carried out on cDNA samples using SsoAdvanced Universal SYBR Green Supermix (BioRad). The primer sequences were as follows: HPRT1: forward 5′-TGCTGAGGATTTGGAAAGGGT-3′, reverse 5′-AGCAAGACGTTCAGTCCTGT-3′; ARHGEF17: forward 5′-TACATGCTGAACCTGCACTCC-3′, reverse 5′-GTGCTTCCGCATGTCCACC-3′; CCNB1: Forward 5′-GATACTGCCTCTCCAAGCCC-3′, reverse 5′-TTTCCAGTGACTTCCCGACC-3′; CDKN1A: forward 5′-AGACTCTCAGGGTCGAAAACG-3′, reverse; 5′-ATGCCCAGCACTCTTAGGAA-3′; CCNE1: forward 5′-AGAGGAAGGCAAACGTGACC-3′, reverse 5′-GAGCCTCTGGATGGTGCAAT-3′; 0.5 μM of forward and reversed primer were combined with 2 μl cDNA samples, for the qRT-PCR reaction. Two negative controls were included: an RT-negative control and a no-template control. Samples were incubated at 95°C for 5 min followed by 40 cycles of three amplification steps: 95°C for 15 s, the optimal primer-specific temperature (between 50°C and 60°C) for 15 s, and 72°C for 15 s. Each qRT-PCR reaction was performed as two technical replicates for each biological sample and then normalized to HPRT. The Pfaffl method was used to analyze the results (Pfaffl, 2001). Fold inductions were calculated and the results were expressed as relative quantification values based on cycle threshold (Ct) comparisons between different samples. Experiments were performed on three to six biological replicates as indicated.
Immunofluorescence
Cells were grown on coverslips coated with 25 µg/ml poly-ethylenimine (PEI) in 150 mM NaCl and fixed in PTEMF buffer (0.2% Triton X-100, 20 mM PIPES pH 6.9, 1 mM MgCl2, 10 mM EGTA and 4% formaldehyde) for 10 min at room temperature. For immunofluorescence of endogenous MPS1, cells were incubated for 5 min with 1% formaldehyde in PBS, quenched in 0.1 M glycine for 1 h, and then permeabilized in 0.1% Triton X-100 for 3 min. For pERM visualization, cells were fixed with 10% trichloroacetic acid (#T0699; Sigma-Aldrich) for 10 min at room temperature before extensive washings with TBS as previously described (Carreno et al., 2008). After fixation, coverslips were blocked with 3% bovine serum albumin (BSA) in PBS-Tween 0.2% for at least 30 min prior to incubation with primary and secondary antibodies for 2 and 1 h, respectively, at room temperature. Antibodies were used at 1 µg/ml, unless otherwise indicated. Antibodies against the following proteins were used: α-tubulin (DM1A; Santa Cruz); Calcinosis-Reynaud’s-Esophageal dysfunction-Sclerodactyly-Telangiectasias (CREST) centromere autoantibody HCT-0100; Immunovision); MPS1 (M5818, AB_261965; Sigma-Aldrich); Rho A-GTP (26904, AB_1961799; NewEast biosciences); GFP (11814460001, AB_390913; Roche) and α-tubulin Alexa-647 (11H10, AB_10694857; Cell Signaling); Myc (clone 9E10,SC-40 AC, RRID:AB_2857941), H3pT3 (SB153a, AB_2794739; Southern Biotechnology); Cyclin A (clone 25, #611268, AB_398797; BD Transduction Laboratories) Cyclin B1 (D5C10, #12231, AB_2783553; Cell Signaling); BUBR1 (Elowe et al., 2007); pERM ([Roubinet et al., 2011], gift of S. Carréno). HOESCHT 33342 (Sigma-Aldrich) was used to stain chromatin and phalloidin–Atto 565 (9402; Sigma-Aldrich) for F-actin. Alexa Fluor-affiniPure series secondary antibodies (Thermo Fisher Scientific) or (Jackson ImmunoResearch) were used for immunofluorescence (1:1,000). For live-cell imaging, cells were washed with PBS and treated with SiR-DNA dye (CY-SC007; Cytoskeleton) and SPY555-Tubulin (CPY-SC203; Cytoskeleton) probe at 300 nM for 1 h prior to imaging. Secondary antibodies (donkey anti-rabbit, anti-mouse and anti-human Alexa Fluor AffiniPure-488, 594, and 647) were purchased from Jackson ImmunoResearch (Cat #715-545-150, 709-545-149, 711-545-152, 15-585-150, 711-585-152, 709-585-149, 706-605-148, 715-605-151, 709-605-149).
Flow cytometry analysis
Cells were treated with 0.5 µg/ml of doxycycline for 72 h and synchronized with 3.3 µM nocodazole for 12 h. Cells were then washed with PBS and 2 × 10⁶ cells/ml were incubated at 37°C for 60 min with complete medium containing 5 μg/ml Hoechst 33342. Cells were then pelleted by centrifugation and the medium containing Hoechst 33342 was aspirated. Cells were washed in 1X PBS and flow cytometry analysis was followed with a BD LSRII SORP flow cytometer (Becton Dickinson) equipped with BDFACSDiva software. Hoechst dye was excited with a 355 nm UV laser emitted fluorescence and detected with a 450/50 bandpass filter. Cell cycle analysis was performed using FlowJo software v10 (Becton Dickinson) and the Watson pragmatic algorithm (Watson et al., 1987).
Confocal microscopy
An inverted Olympus IX81 microscope equipped with a WaveFX-Borealin-SC Yokagawa spinning disc (Quorum Technologies) and an Orca Flash4.0 camera (Hamamatsu) was used for the acquisition of all images. 40× (NA 0.95) were used throughout. Images were acquired by Metamorph software (Molecular Devices). Optical sections with identical exposure times for each channel within an experiment were acquired and then projected into a single picture using ImageJ (Fiji version 1.52i). The system was equipped with a motorized stage (ASI) and incubator with atmospheric CO2 warmed at 37°C for live-cell imaging. For time-lapse experiments, images were taken with a 20× objective (Olympus UPLSAPO 20× [NA 0.7]), every 3 min. Higher resolution images with acquired with a 100× (UPLSAPO100XO, NA 1.40) objective.
Quantitative polarization microscopy
Cell contractility was measured with quantitative polarization microscopy (qPOL) as described previously (Wang et al., 2018a). Briefly, images were acquired using a 20× or 40× polarization lens (NA = 0.9) with 10° intervals of the polarizer rotation over a range of 0–180°. The polarized image sequences were processed with a custom MATLAB code to obtain an optical retardance map. The retardance signal proportional to cell contractility was quantified by measuring the average retardance over the cell area after background subtraction in ImageJ2.
Image quantification
Unless otherwise stated, all experiments and statistical analyses were performed in biological triplicates. Image J2 was used for image processing and all images shown in the same figure have been identically scaled. For measurement of signal intensities at the kinetochores, cells were measured individually by cropping the desired cell, creating a selection of the kinetochores area by thresholding, and transferring to and measuring the selection in the desired channels, and the intensities were measured according to established protocol (Saurin and Kops, 2016) in ImageJ2 (Fiji version 1.52 i) (Rueden et al., 2017; Schindelin et al., 2012). For whole spindles, intensity measurements with or without cold treatments were performed according to a published protocol (DeLuca et al., 2016). Integrated signal intensity was measured in all relevant channels, and intensities indicated are values relative to tubulin, Core Research for Evolutional Science and Technology control, or presented as arbitrary units. To determine the spindle angles (α), z-stack images of metaphase cells immunostained with anti-γ-tubulin (spindle poles) and anti-α-tubulin antibodies (mitotic spindle) were acquired. Spindle angles were calculated in Image J as previously published (Cau et al., 2013; Mannen et al., 2016). Once angles were calculated, negative angles or angles above 90° were transformed to the first quadrant. Angular histograms were plotted using a custom R script (Scarpa et al., 2018). Misaligned and lagging chromosomes were quantified in fixed cells as previously described (Gama Braga et al., 2021). Briefly, the spindle pole position was defined, followed by the establishment of an alignment region after equally dividing the area between the poles of the cell into five zones. The alignment zone was defined as the middle zone and was excluded from further analysis. The number of misaligned kinetochores lying outside were considered misaligned at metaphase and were counted. Identification of lagging chromosomes in anaphase cells followed the same principle as above where the coordinates at the centroids of the two anaphase chromosome masses were selected and the region of interest in between was defined. Kinetochores inside this region were considered lagging and were quantified. Cortical intensity was measured in a single confocal z-medial slice in Image J2 using a freely drawn five-pixel line. Mean pixel intensity was measured and individual values were normalized to control cells. Cell rounding was measured in Image J using the “fit ellipse” tool. The circularity index C [= 4π(area/perimeter2)] was used to quantify the roundness of a two-dimensional object corresponding to the cross-section of the cell by a plane.
Statistical analysis
Statistical analysis and graph plotting were performed in GraphPad Prism Software V6.01 and presented as Superplots where applicable (Lord et al., 2020). ANOVA tests were used to determine significance, and the exact test depended on the parameters of the experiment. Statistical tests are described in the figure legends for each experiment. For all parametric tests, data distribution was tested for normality as indicated. Exact P values for relevant pairwise comparisons are shown.
Online supplemental material
Fig. S1 shows results related to Fig. 1 (TEM4 phenotype in different cell lines and under different conditions); Fig. S2 shows results related to Fig. 2 (Still images of live-cell imaging and cumulative mitotic index quantifications); Fig. S3 shows results related to Fig. 3 (Supplementary figures of spindle phenotypes in TEM4 depleted cells); Fig. S4 shows results related to Fig. 4 (Contractility markers and measurements in interphase and mitosis). Fig. S5 shows material related to Fig. 4 (generation of rescue cell lines and additional phenotypes rescues); Fig. S6 shows analysis of data from Tables S1 and S2 relating to phosphoproteomics of TEM4-depleted cells; Fig. S7 shows material related to Fig. 8 (Correlations between YAP, TEM4 and p21 expression). Table S1 shows phosphosignaling changes in T47D and MDA-MB-468 cells depleted of TEM4; Table S2 is a summary of the enrichment of Cyclin-CDK motifs in Table S1 dataset; Video 1 is related to Fig. 2 and shows a control division; Video 2 is related to Fig. 2 and shows a division of a TEM4-21 cell; Video 3 is related to Fig. 2 and shows a division of a TEM4-22 cell.
Data availability
The data underlying Fig. S6 are provided in Tables S1 and S2. The data underlying Fig. S7, C and D are openly available and can be accessed through the DepMap Portal. Original data, cell lines, plasmids, and the TEM4 antibody are available upon request from the corresponding author.
Acknowledgments
The authors thank Sébastien Carréno for the pERM antibodies, Elena Scarpa for the gift of the spindle angle normalization macro, Christian Doucet, Amélie Robert, and Vincent Desrosiers for technical assistance, and Jean-François Côté, Jan Ellenberg, Sergei Plotnikov, and Olivier Pertz for their helpful discussions.
Work in the Elowe lab was supported by Canadian Institutes of Health Research grants to S. Elowe (156405, 153046) and the National Science and Engineering Council of Canada (RGPIN-2016-05841). Work in the Bordeleau lab is supported by the National Science and Engineering Council of Canada Discovery grant to F. Bordeleau (RGPIN-2018-06214). S. Elowe was supported by an FRQS (Fonds de Recherche de Santé Québec) Senior Researcher salary award. D.K. Prifti has been supported by training awards from Desjardins and by a CRCHU de Québec training award. F. Bordeleau is a tier 2 Canada Research Chair in Tumor Mechanobiology and Cellular Mechanoregulation.
Author contributions: D.K. Prifti: Conceptualization, Formal analysis, Investigation, Validation, Visualization, Writing - original draft, A. Lauzier: Investigation, C. Garand: Investigation, Validation, Visualization, R. Devillers: Data curation, Formal analysis, Investigation, Validation, S. Roy: Investigation, A. Dos Santos: Formal analysis, Writing - review & editing, L. Descombes: Investigation, B. Trudel: Methodology, M. Laplante: Resources, Supervision, Writing - review & editing, F. Bordeleau: Conceptualization, Funding acquisition, Investigation, Methodology, Resources, Supervision, Writing - review & editing, S. Elowe: Conceptualization, Data curation, Formal analysis, Funding acquisition, Investigation, Methodology, Project administration, Resources, Supervision, Validation, Visualization, Writing - original draft, Writing - review & editing.

