


The plant corepressor TPL is recruited to diverse chromatin contexts, yet its mechanism of repression remains unclear. Previously, we leveraged the fact that TPL retains its function in a synthetic transcriptional circuit in the yeast model Saccharomyces cerevisiae to localize repressive function to two distinct domains. Here, we employed two unbiased whole-genome approaches to map the physical and genetic interactions of TPL at a repressed locus. We identified SPT4, SPT5, and SPT6 as necessary for repression with SPT4 acting as a bridge connecting TPL to SPT5 and SPT6. We discovered the association of multiple additional constituents of the transcriptional preinitiation complex at TPL-repressed promoters, specifically those involved early in transcription initiation. These findings were validated in yeast and plants, including a novel method to analyze the conditional loss of function of essential genes in plants. Our findings support a model where TPL nucleates preassembly of the transcription activation machinery to facilitate the rapid onset of transcription once repression is relieved.
Introduction
During development, efficient and coordinated switching between OFF and ON gene states is essential for cell fate determination and morphogenesis. This transcriptional reprogramming requires regulation of both activation and repression. Failure of transcriptional repression leads to catastrophic defects in development such as complete loss of body plan organization (Long et al., 2002, 2006), oncogenesis, and even death (Grbavec et al., 1998; Wong et al., 2014). Despite this importance, the exact mechanism by which repressors enact and maintain repression, and especially their complex interactions with the highly conserved transcriptional activation machinery, remains elusive. Corepressors are one group of repressor proteins that are recruited by DNA-binding transcription factors and repress by recruiting negative regulators of transcription and/or inhibiting the active components of transcription such as RNA-Polymerase II (Pol-II). Transcriptional corepressors are found across all eukaryotes and in several structurally related families including the animal SMRT (silencing mediator of retinoic acid and thyroid hormone receptor) and NCoR (nuclear receptor corepressor) complexes (Mottis et al., 2013; Oberoi et al., 2011), the yeast Tup1 (Keleher et al., 1992; Matsumura et al., 2012; Tzamarias and Struhl, 1994), and its homologs Drosophila Groucho (Gro) and mammalian transducing-like enhancer (TLE) (Agarwal et al., 2015).
In land plant lineages, there has been an expansion of the Gro/TLE-type corepressor family, including TOPLESS (TPL), TOPLESS-RELATED (TPR1–4), LEUNIG (LUG) and its homolog (LUH), and High Expression of Osmotically responsive genes 15 (HOS15) (Causier et al., 2012; Lee and Golz, 2012; Liu and Karmarkar, 2008; Long et al., 2006; Zhu et al., 2008). All members of these families share a general structural homology, where the N-terminal domain contains a conserved protein dimerization domain known as the LIS1 homology (LisH) domain (Delto et al., 2015; Kim et al., 2004). At the C-terminus of these proteins are WD40 repeats that form beta-propeller structures that are involved in many diverse protein–protein interactions (Collins et al., 2019; Liu et al., 2019). TPL/TPR activity is essential for development, responses to the environment, and immunity (Causier et al., 2012; Plant et al., 2021). In our previous work, we recapitulated the auxin response circuit including TPL from the model plant Arabidopsis thaliana in Saccharomyces cerevisiae (yeast) (AtARCSc [Pierre-Jerome et al., 2014]). In the AtARCSc, an auxin-responsive transcription factor (ARF) binds to a promoter driving a fluorescent reporter that can be quantified by flow cytometry (Fig. S1 A). In the absence of auxin, ARF activity is repressed by interaction with a full-length Auxin/Indole-3-Acetic Acid protein (hereafter IAA protein) fused to the N-terminal domain of TPL (Pierre-Jerome et al., 2014). Notably, the N-terminal domain of TPL is sufficient for strong repression of transcription in yeast, and in plants, it can be subdivided into two distinct transcriptional repression domains: Helix 1 (H1), which is part of a LisH domain, and Helix 8 (H8) (Leydon et al., 2021). H8 makes direct contact with Mediator 21 (Med21) and Mediator 10 (Med10), likely leading to the assembly of the entire Mediator complex at a promoter while simultaneously inhibiting the transition to active transcription (Leydon et al., 2021). Despite its broad functional conservation (Leydon et al., 2022) and importance to TPL activity, the mechanism of H1/LisH-based repression on transcription is unknown.

Identification of physical and genetic TPL interactors. (A) Schematic of the AtARCSc. The auxin-responsive promoter driving the fluorescent protein Venus carries binding sites for the auxin-responsive transcription factor (ARF, here AtARF19). In the absence of auxin, the IAA protein (here AtIAA3) is bound to the TPL-N protein and to the ARF and maintains the circuit in a repressed state. The IAA protein can be used as a protein fusion with TPL, i.e., TPLN188-IAA3, or as separate parts as optimized in Fig. 1. Upon addition of auxin, the IAA protein is targeted for ubiquitination and subsequent protein degradation, activating transcription of the fluorescent reporter. (B) Proximity labeling benchmarked by relative enrichment compared with control protein interactors. Log2 fold enrichment values were benchmarked against the known experimental controls: AtTPLN188, AtIAA3, F-Box (AtAFB2 auxin receptor), and the ARF19 transcription factor. This ranking was calculated before and after subsetting for nuclear-localized proteins (right column, determined from SGD). The relative ranking of ScSpt5 and ScSpt6 are shown in the nuclear column. (C) Correlation between all deletion array experiments. Values on the right indicate the correlation value between biological replicates and conditions. The light blue graph indicates the distribution of z-scores in each sample. (D) Distribution of relative Venus abundances across all deletion array mutants screened with the TPLH1–H5 repressor. Heat map of all DA screens and corresponding data from APEX and validation experiments. Columns 1–6 are z-scores for all DA mutants with upregulated Venus expression. APEX – log enrichment value from proximity labeling, gray – not detected. N188 ratio - independent cytometry validation of upregulated Venus mutant strains grown in liquid culture. H1–H5 ratio–independent cytometry validation of upregulated Venus mutant strains grown in liquid culture. Mutants in general transcription factors are highlighted in bold, and mutants in mediator complex components are highlighted in blue. Tree was kmeans-clustered to highlight specific clusters of mutants (numbers on left).
Identification of physical and genetic TPL interactors. (A) Schematic of the AtARCSc. The auxin-responsive promoter driving the fluorescent protein Venus carries binding sites for the auxin-responsive transcription factor (ARF, here AtARF19). In the absence of auxin, the IAA protein (here AtIAA3) is bound to the TPL-N protein and to the ARF and maintains the circuit in a repressed state. The IAA protein can be used as a protein fusion with TPL, i.e., TPLN188-IAA3, or as separate parts as optimized in Fig. 1. Upon addition of auxin, the IAA protein is targeted for ubiquitination and subsequent protein degradation, activating transcription of the fluorescent reporter. (B) Proximity labeling benchmarked by relative enrichment compared with control protein interactors. Log2 fold enrichment values were benchmarked against the known experimental controls: AtTPLN188, AtIAA3, F-Box (AtAFB2 auxin receptor), and the ARF19 transcription factor. This ranking was calculated before and after subsetting for nuclear-localized proteins (right column, determined from SGD). The relative ranking of ScSpt5 and ScSpt6 are shown in the nuclear column. (C) Correlation between all deletion array experiments. Values on the right indicate the correlation value between biological replicates and conditions. The light blue graph indicates the distribution of z-scores in each sample. (D) Distribution of relative Venus abundances across all deletion array mutants screened with the TPLH1–H5 repressor. Heat map of all DA screens and corresponding data from APEX and validation experiments. Columns 1–6 are z-scores for all DA mutants with upregulated Venus expression. APEX – log enrichment value from proximity labeling, gray – not detected. N188 ratio - independent cytometry validation of upregulated Venus mutant strains grown in liquid culture. H1–H5 ratio–independent cytometry validation of upregulated Venus mutant strains grown in liquid culture. Mutants in general transcription factors are highlighted in bold, and mutants in mediator complex components are highlighted in blue. Tree was kmeans-clustered to highlight specific clusters of mutants (numbers on left).
Structure–function studies indicate that the modes of TPL action are distinct from other well-characterized modes of repression in plants and fungi, such as those that rely exclusively on epigenetic marks on histones or DNA methylation (Perissi et al., 2010). TPL appears to act as a priming agent for transcriptional activation, facilitating the assembly of mediator and other components of the transcriptional preinitiation complex (PIC) at promoters bound by transcriptional activators (Ito et al., 2016; Leydon et al., 2022). This form of repression is reminiscent of RNA Polymerase II proximal promoter pausing in metazoans (Core and Adelman, 2019). During transcriptional pausing, Poll II initiates transcription but then stalls as a result of a metazoan-specific protein called the negative elongation factor (NELF) interacting with the DRB sensitivity inducing factor (DSIF) complex. The DSIF components SPT4 and SPT5 are conserved across eukaryotes (Hartzog and Fu, 2013), and in concert with SPT6 (Miller et al., 2023), are crucial elongation factors that are associated with Pol-II at all points during transcriptional activation and elongation (Antosz et al., 2017; Decker, 2021; Ehara et al., 2022; Obermeyer et al., 2024). While these factors are best known for their roles in elongation and pausing, they were originally identified in yeast as factors critical for promoter identification and transcriptional initiation (Fassler and Winston, 1988; Simchen et al., 1984). Recent work has underscored the role of DSIF/SPT components specifically in transcription initiation in multiple organisms, such as SPT5 in metazoans (Diamant et al., 2016) and plants (Obermeyer et al., 2023), and SPT6 in yeast (Kaplan et al., 2003) and plants (Chen et al., 2019). In NELF-based pausing, and by extension in TPL-based priming, the transition from OFF to ON state is likely to be accelerated by the preassembly of necessary protein complexes.
In the current study, we leveraged the power of yeast genetics at a genomic scale to uncover the molecular mechanism of TPL repression. We applied an unbiased proximity labeling approach in AtARCSc strains to map the physical interaction landscape of TPL in its repressed state at a single synthetic locus. In parallel, we performed genome-wide R-SGA screens to find genes whose function was required for maintaining repression by H1 alone or the combination of H1 and H8 together. Among the most prominent candidates showing both physical and genetic TPL interactions were SPT4, SPT5, and SPT6. We further mapped the protein interaction interface between TPL and SPT4 in both yeast and plants through protein interaction assays and found that SPT4 acts as a bridge to SPT5 and SPT6, both of which are required for H1-based repression. In addition, we validated TPL interactions with TAF5, a critical component of the PIC, and showed that multiple PIC components are required for the maintenance of a repressed state. Given the broad conservation of TPL interacting proteins across eukaryotes, we tested the function of TPL/TBL1-type repressors in human cells and found that the TBL1 N-terminus was able to repress transcription when fused to dCas9. Finally, we developed a novel integrase-based method for conditional loss of function of essential genes in plants to test the impact of TPL interactors on an endemic TPL-repressed developmental process. Collectively, our findings support a model where TPL enables the stable preassembly of the PIC and associated initiation factors at promoters already associated with transcriptional activators. This mode of repression facilitates the rapid onset of transcription once repression is relieved, as well as rapid re-establishment of the repressed state as the concentration or activity of inhibitory factors, such as Aux/IAAs, increases.
Results
Identifying the TPL protein interaction network in yeast through APEX2 proximity labeling
To understand how TPL represses transcription, we took an unbiased proximity labeling approach using the recently characterized ascorbate peroxidase 2 (APEX2) system for rapid labeling in S. cerevisiae (Li et al., 2020a, 2020b). We generated a version of the AtARCSc with the TPL N-terminal domain (amino acids 1–188; TPLN188) C-terminally fused to the APEX2 peroxidase (Lam et al., 2015) to label proteins that interact with TPL using a small clickable alkyne-phenol probe (Alk-Ph, Fig. 1 C). As our previously described AtARCSc was localized to chromatin by a protein fusion of TPL to IAA proteins (Pierre-Jerome et al., 2014), we first demonstrated that robust transcriptional repression was possible using an unfused TPLN188 and IAA14. In this test, each protein was independently expressed and interacted via the ethylene-responsive element binding factor-associated amphiphilic repression (EAR) motif on IAA14 (Causier et al., 2012; Kagale et al., 2010; Ke et al., 2015), which is the TPL-recruiting motif found in all AUX/IAA proteins. We observed that TPLN188–APEX2 performed equally well as a repressor as TPLN188 alone (Fig. 1, C and D). We performed our proximity labeling on yeast cultures as described in Li et al. (2020a) where the use of a small, cell-permeable, and clickable Alk-Ph probe is the substrate for the APEX2 enzyme. Cells were subsequently lysed and biotin was attached to Alk-Ph labeled proteins through click chemistry. We observed robust and specific labeling of yeast protein extracts by the TPLN188–APEX2 fusion protein (Fig. 1, E and F). We observed weak but detectable background bands (Fig. 1 F, arrows) in the samples where H2O2 was omitted as a negative control, which likely corresponds to endogenous peroxidase activities in yeast as was previously reported in Li et al. (2020a, 2020b).
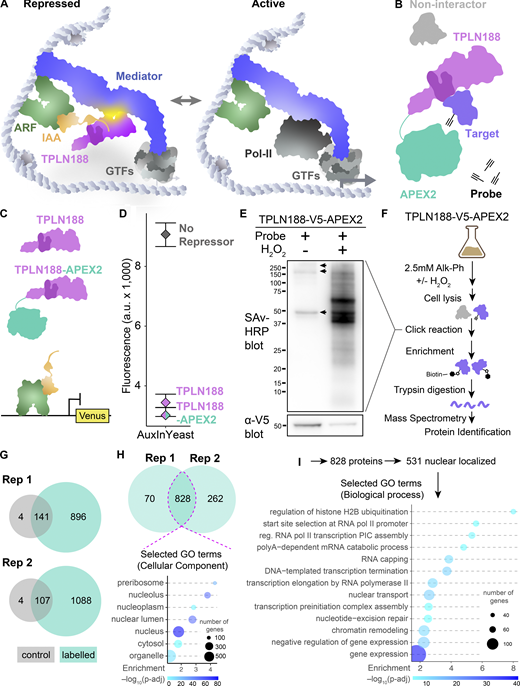
Identifying TPL proteins interactors in yeast through APEX2 proximity labeling. (A) Schematic of the native auxin nuclear response components switching from repressed to active as we currently understand it. ARF – Auxin response factor (TF), IAA – AUX/IAA proteins, TPLN188 – the N-terminal domain of TPL, with the LisH highlighted in a darker shade, GTFs – general transcription factors, Mediator – the mediator complex, and Pol-II – RNA polymerase II. (B) Schematic of the TPLN188–APEX2 fusion protein and its intended use in proximity labeling TPL-interacting proteins. (C) Schematic of the use of TPLN188 (purple) or TPLN188–APEX2 (purple/teal fusion protein) in the AtARCSc in a design unfused to the IAA (orange). The ARF (green) is recruited to a promoter driving Venus (yellow) for detection by flow cytometry. (D) Flow cytometry experiments of the TPL proteins indicated. Every point represents the average fluorescence of 5–10,000 individually measured yeast cells (a.u.: arbitrary units). (E) Streptavidin-HRP blot analysis to compare TPLN188–APEX2-labeling efficiency in yeast with Alk-Ph with and without H2O2. Alkyne-modified proteins were ligated with azide-(PEG)3-biotin via click reaction. Molecular weight standards are shown in kDa. Arrows indicate endogenously biotinylated proteins. Bottom: α-V5 western blot showing the expression of TPLN188–APEX2. (F) Workflow of protein-level proteomic experiments. Negative controls are yeast cells treated in the absence of the H2O2. Experiments were performed with two replicates for each condition. (G) Venn diagrams showing the numbers of proteins identified across replicated proteomic experiments ± H2O2, gray – control, labeled – teal. (H) Venn diagrams showing the numbers of proteins overlapping between the plus probe experiments that are not found within the control condition. Dotted pink line indicates the overlap between experiments which were taken for further analysis. Bottom: Selected Gene Ontology (GO) analysis for Cellular Component of all 828 proteins identified within the pink line. (I) Selected gene ontology analysis for nuclear proteins identified within the pink line. Source data are available for this figure: SourceData F1.
Identifying TPL proteins interactors in yeast through APEX2 proximity labeling. (A) Schematic of the native auxin nuclear response components switching from repressed to active as we currently understand it. ARF – Auxin response factor (TF), IAA – AUX/IAA proteins, TPLN188 – the N-terminal domain of TPL, with the LisH highlighted in a darker shade, GTFs – general transcription factors, Mediator – the mediator complex, and Pol-II – RNA polymerase II. (B) Schematic of the TPLN188–APEX2 fusion protein and its intended use in proximity labeling TPL-interacting proteins. (C) Schematic of the use of TPLN188 (purple) or TPLN188–APEX2 (purple/teal fusion protein) in the AtARCSc in a design unfused to the IAA (orange). The ARF (green) is recruited to a promoter driving Venus (yellow) for detection by flow cytometry. (D) Flow cytometry experiments of the TPL proteins indicated. Every point represents the average fluorescence of 5–10,000 individually measured yeast cells (a.u.: arbitrary units). (E) Streptavidin-HRP blot analysis to compare TPLN188–APEX2-labeling efficiency in yeast with Alk-Ph with and without H2O2. Alkyne-modified proteins were ligated with azide-(PEG)3-biotin via click reaction. Molecular weight standards are shown in kDa. Arrows indicate endogenously biotinylated proteins. Bottom: α-V5 western blot showing the expression of TPLN188–APEX2. (F) Workflow of protein-level proteomic experiments. Negative controls are yeast cells treated in the absence of the H2O2. Experiments were performed with two replicates for each condition. (G) Venn diagrams showing the numbers of proteins identified across replicated proteomic experiments ± H2O2, gray – control, labeled – teal. (H) Venn diagrams showing the numbers of proteins overlapping between the plus probe experiments that are not found within the control condition. Dotted pink line indicates the overlap between experiments which were taken for further analysis. Bottom: Selected Gene Ontology (GO) analysis for Cellular Component of all 828 proteins identified within the pink line. (I) Selected gene ontology analysis for nuclear proteins identified within the pink line. Source data are available for this figure: SourceData F1.
We purified biotinylated proteins by streptavidin affinity purification and prepared samples by Trypsin digestion for mass spectrometry (see Materials and methods). We performed two replicates of this protocol and observed a significant overlap between replicates (Fig. 1 H, dotted magenta line, Table S1). Several proteins served as internal positive controls in our experimental design: (1) the AUX/IAA protein which recruits TPL to chromatin, (2) the TPLN188–APEX2 fusion protein itself, and (3) the ARF transcription factor. All three were found to be highly enriched in our mass spectrometry identification, suggesting a successful and fairly specific activity that we can benchmark by relative enrichment compared with these controls (Fig. S1 B). The auxin receptor (AFB2) was identified with greater enrichment than ARF19 (Fig. S1 B), suggesting that, even in the absence of auxin, these proteins are localized in close proximity to the other components of the auxin response machinery.
As the TPLN188–APEX2 fusion protein is expressed ubiquitously from the yeast GPD promoter, proximity labeling should capture a snapshot of interacting proteins throughout the lifecycle of the protein, including any residence time in the cytoplasm after translation. However, we observed that a majority of identified proteins (64.1%) are localized to the nucleus (531/828, Fig. 1 H). Of these 531 nuclear-localized proteins, there was enrichment in GO terms connected to transcription (Fig. 1 I).
Identifying the TPL genetic interaction network in yeast through reporter synthetic genetic array (R-SGA)
APEX proximity labeling of targets identified a large number of putative direct TPL-interactor proteins with an unknown relationship to repressor function. We set out to perform a high throughput test for the genetic interaction between endogenous yeast genes and the TPL N-terminal repressor domain using a reporter synthetic genetic array (R-SGA) approach (Kainth et al., 2009). We have previously engineered a version of the AtARCSc that carries the entire auxin response circuit on a single CEN-type plasmid, which we named the single plasmid auxin response circuit (SPARC; Leydon et al., 2021). In the SPARC, selected truncations of the TPL N-terminal domain are encoded as fusions to the IAA14 protein (Fig. 2 A, TPLN-IAA14 - purple). Also encoded on the SPARC are the auxin receptor (Fig. 2 A, AFB2 - blue), the LEU2 selectable prototrophy gene (Fig. 2 A, LEU2 – gray), the auxin response factor transcriptional activator (Fig. 2 A, ARF19 - green), and the Venus fluorescent reporter under the control of a promoter with a well-characterized ARF binding site (Fig. 2 A, Venus - yellow). Consolidation of parts into the SPARC allows its use in the R-SGA approach, as it can be used as a single selectable entity that acts as a reporter of repression, where modulation of repression of the Venus reporter in a mutant background will uncover genetic interactions between endogenous genes and TPL-based repression.

Reporter SGA identifies genetic interactors with TPL that are enriched for transcriptional machinery. (A) Scheme for R-SGA screening to identify interactors that modulate TPL-based repression. This approach assayed a TPL repressed promoter driving Venus and RPL39pr-tdTomato abundance across ∼5,200 yeast mutants carrying TPLH1–H5 repressor (+/− auxin) and TPLN188 repressor by fluorescence. (B) Distribution of relative Venus abundances across all deletion array mutants screened with the TPLH1–H5 repressor. (C) Distribution of relative Venus abundances across all Temperature Sensitive Array mutants screened with the TPLH1–H5 repressor. (D) Correlation between all temperature sensitive array experiments. Values at the bottom right indicate the correlation value between biological replicates and conditions. The light blue graph indicates the distribution of z-scores in each sample. (E) Venn diagram demonstrating the overlap between TPLH1–H5, TPLH1–H5 + auxin, and TPLN188-repressed screens for mutants with increased Venus abundance. These represent the intersection of results that were found in both biological replicates. (F) Heat map of all TS screens and corresponding data from APEX and validation experiments. Columns 1–6 are z-scores for all mutants with upregulated Venus expression. APEX – log2 enrichment value from proximity labelling, gray – not detected. N188 ratio - independent cytometry validation of upregulated Venus mutant strains grown in liquid culture, gray – below significance cutoff. H1–H5 ratio - independent cytometry validation of upregulated Venus mutant strains grown in liquid culture, gray – below significance cutoff. Mutants in general transcription factors are highlighted in bold, and mutants in mediator complex components are highlighted in blue. Tree was k-means clustered to highlight specific clusters of mutants (numbers on left). (G) Selected significant biological processes present among mutants with increased Venus abundance organized by Gene Ontology (GO) terms.
Reporter SGA identifies genetic interactors with TPL that are enriched for transcriptional machinery. (A) Scheme for R-SGA screening to identify interactors that modulate TPL-based repression. This approach assayed a TPL repressed promoter driving Venus and RPL39pr-tdTomato abundance across ∼5,200 yeast mutants carrying TPLH1–H5 repressor (+/− auxin) and TPLN188 repressor by fluorescence. (B) Distribution of relative Venus abundances across all deletion array mutants screened with the TPLH1–H5 repressor. (C) Distribution of relative Venus abundances across all Temperature Sensitive Array mutants screened with the TPLH1–H5 repressor. (D) Correlation between all temperature sensitive array experiments. Values at the bottom right indicate the correlation value between biological replicates and conditions. The light blue graph indicates the distribution of z-scores in each sample. (E) Venn diagram demonstrating the overlap between TPLH1–H5, TPLH1–H5 + auxin, and TPLN188-repressed screens for mutants with increased Venus abundance. These represent the intersection of results that were found in both biological replicates. (F) Heat map of all TS screens and corresponding data from APEX and validation experiments. Columns 1–6 are z-scores for all mutants with upregulated Venus expression. APEX – log2 enrichment value from proximity labelling, gray – not detected. N188 ratio - independent cytometry validation of upregulated Venus mutant strains grown in liquid culture, gray – below significance cutoff. H1–H5 ratio - independent cytometry validation of upregulated Venus mutant strains grown in liquid culture, gray – below significance cutoff. Mutants in general transcription factors are highlighted in bold, and mutants in mediator complex components are highlighted in blue. Tree was k-means clustered to highlight specific clusters of mutants (numbers on left). (G) Selected significant biological processes present among mutants with increased Venus abundance organized by Gene Ontology (GO) terms.
To conduct the R-SGA, a strain containing the SPARC and expressing tdTomato constitutively from the ACT1 promoter was mated with both the non-essential gene deletion array (DA) and conditional temperature-sensitive (TS) essential gene mutant collections using the SGA methodology (Tong and Boone, 2006). We performed this approach with two different versions of the SPARC that differed only in the lengths of TPL N-terminal domains. The first SPARC contained helices 1–5 (SPARCH1–H5), where the only repressor domain is the LisH domain (H1–H2), and the second contained the entire N-terminal domain (SPARCN188) comprised of helices 1–9 (H1–H9) and carries both the LisH and a second repressor domain in Helix 8, which contacts the Med21 subunit of the Mediator complex (Leydon et al., 2021). Each experiment was performed with two biological replicates, resulting in four collections, each containing ∼5,200 strains harboring a SPARC, pACT1-tdTomato, and either a unique nonessential gene deletion (xxxΔ) or a TS essential gene allele (xxx-TS). Using a fluorescence scanner, we assayed the Venus and tdTomato intensities across the mutant strains arrayed as whole colonies on agar plates and then we calculated a normalized log2(Venus/tdTomato) ratio, which is indicative of Venus abundance. For collections with SPARC-TPLH1–H5 the screen was also tested on media containing auxin, as this truncation is within the dynamic range for auxin sensitivity (Fig. 2 A).
We hypothesized that mutants causing increased Venus expression in the absence of exogenous perturbation (untreated conditions) would unveil two classes of genes: (1) those upregulating Venus transcription and therefore candidates for partner proteins in transcriptional repression and (2) those that downregulate Venus expression and likely involved in the activation of ARF transcription (Fig. 2 A). By further performing the SPARC R-SGA screen on two isoforms of TPL, we aimed to identify genetic factors specific to the LisH domain of unknown molecular mechanisms. Testing the R-SGA in the presence of auxin should reduce the cellular concentration of the repressor, increase Venus signal output for all mutants, and help to differentiate specific hits from background effects. Our focus in this study was on the first class of genes, those where genetic interaction yielded a “loss of repression” phenotype, as these represent the best TPL pathway candidates.
We applied a Z-score–based threshold to identify mutants with the greatest change in Venus abundance, defining those mutants with Z > 2 (corresponding to a Venus abundance two standard deviations above the mean) as having increased Venus and those with Z < −2 as having decreased Venus. Using these thresholds, in collections with SPARCH1–H5 (TS plus DA), we identified 162 mutants (3% of those screened) with increased Venus abundance in untreated conditions and 56 with decreased Venus abundance (1% of those screened, Fig. 2, B, C, and E; and Table S2). In SPARCH1–H5 on auxin treatment, we identified 147 mutants (2.8% of those screened) with increased Venus abundance and 67 with decreased Venus abundance (1.3% of those screened, Table S2). The screen with SPARCTPLN188 identified 141 mutants (2.65% of those screened) with increased Venus abundance and 45 with decreased Venus abundance (0.85% of those screened, Tables S1 and S2). A larger fraction of mutants with increased Venus abundance were nonessential (∼67%); however, a greater relative proportion of all essential mutants screened had increased Venus abundance (e.g., ∼32% of the 230 mutants with increased Venus are essential, although essential genes comprise only ∼19% of the mutants screened). The trend for higher genetic interaction in essential genes is consistent with the high number of core transcriptional machinery in the TS collection.
The average correlation across replicate screens was R = 0.94 and R = 0.83 for the temperature-sensitive collection and nonessential deletion collection, respectively. To graphically highlight the TS as an example, the average correlation within the SPARCH1–H5 was R = 0.92, and within SPARCTPLN188 was R = 0.93, indicating strong reproducibility across biological replicates (Fig. 2 D, DA replication Fig. S1 C). These correlations are similar to previous R-SGA screens, where an average of R = 0.77 was observed in technical replicates across 27 screens (Kainth et al., 2009). We further honed our target list by eliminating frequently found mutations called “frequent fliers” that have been discovered in previous studies to be non-specific hits in many R-SGA analyses (Göttert et al., 2018). We then focused our attention on mutants where we observed an increase in Venus abundance and compared these hits between repressor types and conditions (Fig. 2 E). We observed 46 unique mutants that are shared between all repressor types (Fig. 2 E, group a), as well as mutants that were enriched only in specific repressors or conditions (Fig. 2 E, groups e, f, and g).
To best highlight categories of mutants, we performed a hierarchical clustering analysis of upregulated mutants that met our criteria (TS - Fig. 2 F, DA – Fig. S1 D). Within the TS array, we observed three distinct clusters: (1) mutants identified in both repressor types (Fig. 2 F, clusters 2 & 4), (2) mutants identified specifically in the TPLN188 repressor (cluster 1) and (3) mutants identified only the H1–H5 repressor background (cluster 3). One clear and exciting observation is that the TPLN188-specific cluster 1 was the only cluster containing mediator mutants (Fig. 2 F, blue) and is consistent with the observation that TPL binds to mediator through its Helix 8 (H8) repressor domain, which is absent in the H1–H5 truncation. We also observed that across these clusters there were many mutants in general transcription factor (GTF) genes (Fig. 2 F, bold), and at a broad level using GO analysis, we could see that the mutants identified from both arrays are enriched for genes involved in transcription, especially initiation and regulation of RNA Pol II gene expression (Fig. 2 G). To validate upregulated mutants for a specific effect on SPARC repression, we selected the top 242 upregulated mutants for secondary analysis by cytometry. In this way, we were able to validate a large proportion of mutants in liquid culture (H1–H5: DA—74%, TS—80%, N188: DA—57%, TS—69%, Fig. S2), and confirm that many top candidates are increased in Venus fluorescence with limited changes in cell size (Fig. S3, A–D). Because we observed that ScSpt5 was highly enriched in TPL-APEX2 labeling and because we detected other Spt-phenotype–related genes through R-SGA (i.e., ScSpt2, ScSpt6, ScSpt21, ScHTA1/Spt11, ScSpn1), we repeated R-SGA strain construction for the TS mutant spt5-194 as it had failed to sporulate well in R-SGA conditions. Similar to the other SPT strains, we observed a strong derepression of both the H1–H5 and N188 SPARCs in the spt5-194 mutant (Fig. S2 and Fig. 3, A–D).

Validation of genetic interactors by flow cytometry. (A and B) Cytometry validation of DA array with (A) TPLH1-H5 or (B) TPL N188. (C and D) Cytometry validation of TS array with (C) TPLH1-H5 or (D) TPL N188. Selected strains were grown in liquid culture to log phase at 30°C and cytometry was performed. Fluorescence of tdTomato and Venus were quantified and Venus was normalized to tdTomato and is presented here as a ratio. Each data point is colored coded on a gradient with higher Venus expression as more yellow. The cutoff was arbitrarily set as the value of control (gray line) plus its standard error (red line). \ Error bars are standard error propagated through the calculation of the ratio . The cutoff was arbitrarily set as the value of control (gray line) plus its standard error (red line).
Validation of genetic interactors by flow cytometry. (A and B) Cytometry validation of DA array with (A) TPLH1-H5 or (B) TPL N188. (C and D) Cytometry validation of TS array with (C) TPLH1-H5 or (D) TPL N188. Selected strains were grown in liquid culture to log phase at 30°C and cytometry was performed. Fluorescence of tdTomato and Venus were quantified and Venus was normalized to tdTomato and is presented here as a ratio. Each data point is colored coded on a gradient with higher Venus expression as more yellow. The cutoff was arbitrarily set as the value of control (gray line) plus its standard error (red line). \ Error bars are standard error propagated through the calculation of the ratio . The cutoff was arbitrarily set as the value of control (gray line) plus its standard error (red line).
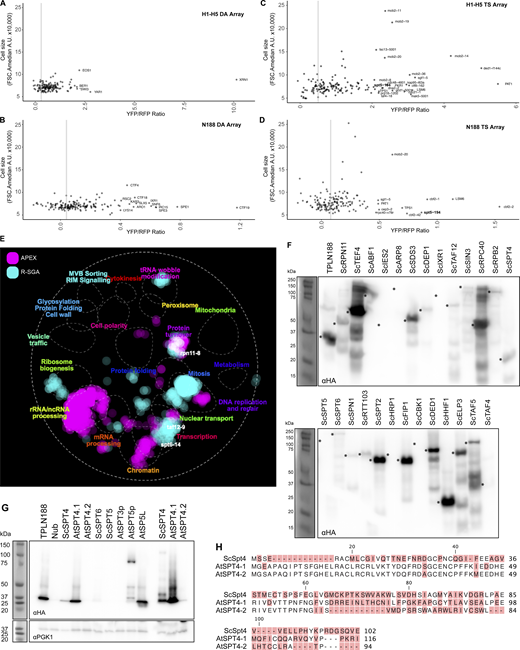
Validation and expression of potential TPL interacting proteins. (A–D) Yeast cell sizes from top hits cytometry validation. All cytometry validation experiments were plotted based on cell size (FSC.A) compared with their YFP/RFP ratios to highlight which candidates are likely to exhibit higher fluorescence values based on morphological differences. (A) TPL H1–H5 deletion array. (B) TPL H1–H5 TS array. (A) TPLH1–H5 deletion array (DA). (B) TPL N188 deletion array (DA). (C) TPLH1–H5 Temperature Sensitive (TS) array. (D) TPL N188 Temperature Sensitive (TS) array. (E) A global genetic interaction profile similarity network produced by The Cell Map (https://TheCellMap.org). The APEX identified the list of nuclear interactors, and the upregulated hits from R-SGA were mapped onto the existing network to visualize the localization of hits to specific subnetworks of genes. A few example genes are highlighted (spt6-14, taf12-9, rpn11-8) to demonstrate their location within interesting hubs. (F–H) TPL N-terminus interacts with ScSpt4 and AtSpt4.1. (F) Protein expression analysis by western blot for all tested cytoSUS targets from Fig. 3 D. Asterisks indicate the expected band size for the protein and are aligned to the left of the band position for each lane. (G) Protein expression analysis by western blot for SPT protein expression. ScSp4, AtSPT4.1, and AtSPT4.2 were run with higher volumes of protein on the far right, demonstrating lower, but still detectable protein expression levels. (H) Alignments of the Saccharomyces (Sc) Arabidopsis (At) SPT4 proteins are shown above. Non-conserved amino acids are highlighted in red. Source data are available for this figure: SourceData FS3.
Validation and expression of potential TPL interacting proteins. (A–D) Yeast cell sizes from top hits cytometry validation. All cytometry validation experiments were plotted based on cell size (FSC.A) compared with their YFP/RFP ratios to highlight which candidates are likely to exhibit higher fluorescence values based on morphological differences. (A) TPL H1–H5 deletion array. (B) TPL H1–H5 TS array. (A) TPLH1–H5 deletion array (DA). (B) TPL N188 deletion array (DA). (C) TPLH1–H5 Temperature Sensitive (TS) array. (D) TPL N188 Temperature Sensitive (TS) array. (E) A global genetic interaction profile similarity network produced by The Cell Map (https://TheCellMap.org). The APEX identified the list of nuclear interactors, and the upregulated hits from R-SGA were mapped onto the existing network to visualize the localization of hits to specific subnetworks of genes. A few example genes are highlighted (spt6-14, taf12-9, rpn11-8) to demonstrate their location within interesting hubs. (F–H) TPL N-terminus interacts with ScSpt4 and AtSpt4.1. (F) Protein expression analysis by western blot for all tested cytoSUS targets from Fig. 3 D. Asterisks indicate the expected band size for the protein and are aligned to the left of the band position for each lane. (G) Protein expression analysis by western blot for SPT protein expression. ScSp4, AtSPT4.1, and AtSPT4.2 were run with higher volumes of protein on the far right, demonstrating lower, but still detectable protein expression levels. (H) Alignments of the Saccharomyces (Sc) Arabidopsis (At) SPT4 proteins are shown above. Non-conserved amino acids are highlighted in red. Source data are available for this figure: SourceData FS3.
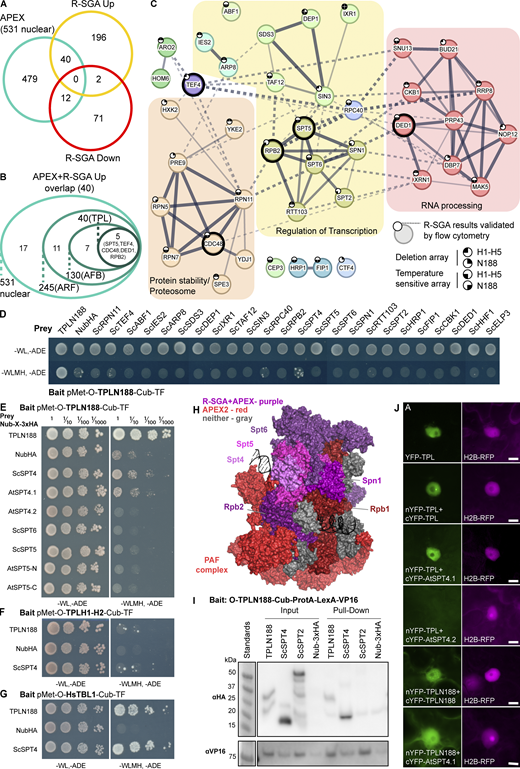
TPL interacts with the SPT4/SPT5/SPT6 complex through the conserved elongation factor SPT4. (A) Venn diagram intersection of genes identified by APEX labeling and R-SGA analysis. 531 nuclear proteins from APEX (teal), 238 upregulated R-SGA mutants (gold), and 85 downregulated (red) mutants. (B) A nested circle diagram depicts the APEX enrichment of the 40 proteins from the overlapping results of APEX and upregulated R-SGA. Nested circles represent the relative enrichment positions of known controls (TF-ARF, F-Box-AFB2, TPLN188). Five proteins were enriched at or above the level of the TPLN188–TPLN188 interaction (SPT5, TEF4, RPB2, CDC48, and DED1). (C) STRING protein network of the top 40 interacting proteins. The network is enriched for three main categories as defined by GO terminology: proteasome/protein stability—orange, regulation of transcription—yellow, and RNA processing—red. The five most highly enriched by APEX-labeling are highlighted with a heavy-weight outline. The network was clustered to an MCL inflation parameter of 3. Subclusters of genes are colored, and network edges between clusters are shown as dotted lines. Line thickness indicates the strength of support. STRING minimum required interaction score – 0.4. Small circles at the top left of the node indicate whether this R-SGA mutant was validated by flow cytometry, and in which TPL-truncation it was validated. (D–G) Cytoplasmic split-ubiquitin system (CytoSUS) assays with candidate interacting proteins. Nub-3xHA is the N-terminal fragment of ubiquitin expressed with no fusion protein and is used as a negative control. −WL, −ADE: dropout lacking Trp, Leu, and Ade (growth control); −WLMH, −ADE: dropout lacking Trp, Leu, His, Met, and Ade (selective media). The plating for each panel was performed on the same day. (D) CytoSUS interaction of TPLN188 with yeast proteins identified in the top 40, all individuals enriched for GO terms relating to transcription were tested in addition to other selected candidates. (E) CytoSUS interaction of TPLN188 with SPT/DSIF specific components from yeast and Arabidopsis. (F) CytoSUS interaction of TPL H1–H2 (LisH domain) with ScSPT4. (G) CytoSUS interaction of HsTBL1 N-terminal domain (N98) with ScSPT4. (H) Structure of RNA POL II subunits, DNA, PAF complex, with SPT/DSIF proteins – from yeast (Komagataella phaffii) 7XN7 (Ehara et al., 2022). Proteins identified by both APEX2 labeling and R-SGA - purples (SPT5, SPT6, RPB2, SPN1), identified only by APEX2 – reds, undetected – gray, SPT4 – pink. Each color is shaded slightly differently to highlight borders. (I) The TPL-ProteinA-TF fusion protein can pull down TPL, ScSPT4 from yeast extracts using IgG-beads. Detection of the VP16 transcriptional activator demonstrates enrichment of the fusion protein (αVP16). Each prey protein is detected via the 3xHA tag (αHA). (J) Bimolecular fluorescence complementation assay performed in Nicotiana benthamiana (tobacco). Each image is an epi-fluorescent micrograph taken at identical magnification from epidermal cells 2 days after injection. The YFP image is colored green (left panel). p35S:H2B-RFP was used as a control and is false-colored magenta (right panel). Source data are available for this figure: SourceData F3.
TPL interacts with the SPT4/SPT5/SPT6 complex through the conserved elongation factor SPT4. (A) Venn diagram intersection of genes identified by APEX labeling and R-SGA analysis. 531 nuclear proteins from APEX (teal), 238 upregulated R-SGA mutants (gold), and 85 downregulated (red) mutants. (B) A nested circle diagram depicts the APEX enrichment of the 40 proteins from the overlapping results of APEX and upregulated R-SGA. Nested circles represent the relative enrichment positions of known controls (TF-ARF, F-Box-AFB2, TPLN188). Five proteins were enriched at or above the level of the TPLN188–TPLN188 interaction (SPT5, TEF4, RPB2, CDC48, and DED1). (C) STRING protein network of the top 40 interacting proteins. The network is enriched for three main categories as defined by GO terminology: proteasome/protein stability—orange, regulation of transcription—yellow, and RNA processing—red. The five most highly enriched by APEX-labeling are highlighted with a heavy-weight outline. The network was clustered to an MCL inflation parameter of 3. Subclusters of genes are colored, and network edges between clusters are shown as dotted lines. Line thickness indicates the strength of support. STRING minimum required interaction score – 0.4. Small circles at the top left of the node indicate whether this R-SGA mutant was validated by flow cytometry, and in which TPL-truncation it was validated. (D–G) Cytoplasmic split-ubiquitin system (CytoSUS) assays with candidate interacting proteins. Nub-3xHA is the N-terminal fragment of ubiquitin expressed with no fusion protein and is used as a negative control. −WL, −ADE: dropout lacking Trp, Leu, and Ade (growth control); −WLMH, −ADE: dropout lacking Trp, Leu, His, Met, and Ade (selective media). The plating for each panel was performed on the same day. (D) CytoSUS interaction of TPLN188 with yeast proteins identified in the top 40, all individuals enriched for GO terms relating to transcription were tested in addition to other selected candidates. (E) CytoSUS interaction of TPLN188 with SPT/DSIF specific components from yeast and Arabidopsis. (F) CytoSUS interaction of TPL H1–H2 (LisH domain) with ScSPT4. (G) CytoSUS interaction of HsTBL1 N-terminal domain (N98) with ScSPT4. (H) Structure of RNA POL II subunits, DNA, PAF complex, with SPT/DSIF proteins – from yeast (Komagataella phaffii) 7XN7 (Ehara et al., 2022). Proteins identified by both APEX2 labeling and R-SGA - purples (SPT5, SPT6, RPB2, SPN1), identified only by APEX2 – reds, undetected – gray, SPT4 – pink. Each color is shaded slightly differently to highlight borders. (I) The TPL-ProteinA-TF fusion protein can pull down TPL, ScSPT4 from yeast extracts using IgG-beads. Detection of the VP16 transcriptional activator demonstrates enrichment of the fusion protein (αVP16). Each prey protein is detected via the 3xHA tag (αHA). (J) Bimolecular fluorescence complementation assay performed in Nicotiana benthamiana (tobacco). Each image is an epi-fluorescent micrograph taken at identical magnification from epidermal cells 2 days after injection. The YFP image is colored green (left panel). p35S:H2B-RFP was used as a control and is false-colored magenta (right panel). Source data are available for this figure: SourceData F3.
TPL interacts with the SPT4/SPT5/SPT6 complex through the conserved elongation factor SPT4
To find the overlap between physical and genetic interactors, we compared our list of 531 APEX2-labeled nuclear-localized proteins against genes identified by R-SGA (Fig. 3 A, teal, Fig. S3 E). Based upon previous studies, we expected a low overlap between these two methods (Costanzo et al., 2013). For example, only 0.5% of positive genetic interaction pairs from a genome-wide network also showed a protein–protein interaction (Costanzo et al., 2013). We observed that 52 genes (9%) were found by both assays: 40 upregulated (Fig. 3 A, yellow) and 12 downregulated (Fig. 3 A, red). We focused on the 40 genes that are both upregulated in R-SGA and detected by proximity labeling. We next ranked these candidates by how strongly enriched these proteins were by APEX labeling. To do so, we compiled our list of 40 overlapping interactors onto the 531 nuclear-labeled proteins by their APEX2 enrichment relative to our known protein interaction partners (ARF, AFB, and TPL). This approach identified five proteins that were enriched at a level equal to or greater than that of TPL itself: ScSpt5, ScTef4, ScRpb2, ScCdc48, and ScDed1 (Fig. 3, B and C, bold outline).
We generated a protein network of the 40 overlapping proteins that illustrates the known protein interactions between each of the proteins from the STRING database. A majority of genes in this network were also independently validated by flow cytometry analysis of the R-SGA identified mutants (Fig. 3 C, small circles). We observed three broad categories based on GO analysis (Fig. 3 C): proteasome/protein stability (orange), regulation of transcription (yellow), and RNA processing or stability (red). We observed a significant interconnected network within the group of genes with functions related to transcription. Specifically, we observed a highly interconnected cluster of genes comprised of ScRpb2, ScSpt5, ScSpt6, ScSpn1, ScSpt2, and ScRtt103 (Fig. 3 C).
To test whether these top hits are direct interactors with the TPL N-terminus, we introduced these S. cerevisiae genes into the yeast cytoplasmic split-ubiquitin system (cytoSUS) (Asseck and Grefen, 2018), which can specifically test for direct interaction of two nuclear proteins excerpted from nuclear complexes and in the cytoplasm. We tested 24 of the 40 top hits comprising all of the proteins related to transcriptional regulation and several other representative selections from other clusters. We observed that none of these proteins had a strong direct physical interaction with cytoSUS; however, SPT4 was observed to interact with TPL (Fig. 3 D and Fig. S3 F). SPT4 and SPT5 are strong binding partners that co-purify across eukaryotic species (Hartzog and Fu, 2013; Guo et al., 2008), and both Saccharomyces (ScSpt4) and Arabidopsis (AtSPT4.1) homologs interacted with TPLN188 (Fig. 3 E and Fig. S3 G). Similar to the yeast homologs, we observed no direct interaction between TPLN188 and AtSPT5 or AtSPT6. AtSPT4.2 failed to interact with TPLN188. Sequence divergence between the paralogs is highest in the C-terminus, likely pointing to the region of interaction with TPL (Fig. S3 H).
TPLN188 interacts with Med21 through the CRA domain, specifically through Helix 8 (H8 [Leydon et al., 2021]), whereas the H1 repressor domain has no currently defined interactors. We observed that ScSpt4 interacted with bait constructs containing only the TPL LisH domain (H1–H2) (Fig. 3 F). The human protein Transducin Beta-like 1 (HsTBL1) contains a LisH domain with a similar structural fold as TPL (Martin-Arevalillo et al., 2017), and we have previously demonstrated that the HsTBL1 N-terminal domain can repress transcription in yeast (Leydon et al., 2022). Like TPLN188, the HsTBL1 N-terminal domain strongly interacted with ScSpt4 (Fig. 3 G). These results indicate that TPL makes contact with Spt4 through the LisH domain.
A visualization of the PIC protein complex including RNA POL II subunits, DNA, PAF complex, and SPT or DSIF proteins (Ehara et al., 2022) highlights the density of proteins identified by APEX alone (reds) or by both APEX2 and R-SGA (purples; ScSpt5, ScSpt6, ScRpb2, ScSpn1) (Fig. 3 H). SPT4 (pink) was not identified by proximity labeling or genetic screen. SPT4’s small size may have limited labeling or detection by MS, and no spt4 mutant is included in the SGA mutant collection, eliminating it as a possible genetic interaction candidate during R-SGA. To further validate the interaction between SPT4 and TPL, we performed co-immunoprecipitation between TPLN188 and ScSPT4 in yeast (Co-IP; Fig. 3 I) and bimolecular fluorescence complementation (BiFC) between full-length TPL and AtSPT4.1 in plants (Fig. 3 J). In both assays, we observed a clear interaction between TPL and SPT4.
The SPT4/SPT5/SPT6 complex is functionally required by TPL for repression
TPLN188 interacted with SPT4 through its LisH domain (Fig. 3 and Fig. 4 A), and we hypothesized that it was through this interaction that it controls the activity of the SPT complex containing SPT4, SPT5, and SPT6. SPT5 and SPT6 loss of function mutants are lethal in yeast (Swanson et al., 1991; Clark-Adams and Winston, 1987), and the point mutations spt5-194 (S324F [Guo et al., 2008]) and spt6-14 (S952F [Simchen et al., 1984]) we identified in the R-SGA screen library are temperature sensitive alleles. To test the requirement for SPT4, SPT5, and SPT6 in maintaining repression of a TPL-repressed promoter, we used the Anchor Away (Haruki et al., 2008) system for inducible protein depletion from the nucleus (Fig. 4 B) and combined it with quantification of transcriptional activity at the synthetic locus in the SPARC (Fig. 2 A). Through nuclear depletion of the SPTs, we could quantify transcriptional activity through increased fluorescence measured by flow cytometry (Leydon et al., 2021) (Fig. 4 B). We first tested the previously published ScSpt5 (Crickard et al., 2016) and ScSpt6 (Dronamraju et al., 2018) anchor-away yeast strains for modulation of TPL repression of the SPARC. We observed release of repression through increased fluorescence for both ScSpt5 and ScSpt6 anchor away strains with both SPARCN188 (Fig. 4 C) and SPARCH1–H5 (Fig. 4 D), but not for ScSpt2 anchor away (Fig. S4 A). Importantly, we observed that the ScSpt5 or ScSpt6 anchor away more potently released repression in TPL H1–H5, and there was no contribution to repression from ScMed21, which we have previously demonstrated is specific to the TPL Helix 8 contact point with mediator (H8, Fig. 4 D).

The SPT4/SPT5/SPT6 is functionally required by TPL for repression. (A) A schematic of the annotated domains of A. thaliana TPLN188, and S. cerevisiae Spt4, Spt5, and Spt6. Dotted lines indicate known protein interactions between these proteins. The position of the known interaction residues of SPT4 and SPT5 are shown with a black line and residue numbering. (B) Schematic of inducible expression and nuclear depletion of SPTs in the context of the Auxin response circuit (ARC). In anchor-away, the yeast ribosomal protein 13A (RPL13A) is fused to the rapamycin-binding protein FKBP. Addition of rapamycin induces dimerization between FKBP and any target protein fused to 2xFRB, resulting in removal of the target protein from the nucleus. Expression of the ARC is monitored by expression of Venus fluorescent protein. (C–G and I–K) Each panel represents representative data from at least two independent time-course flow cytometry experiments of the specific conditions indicated. Every point represents the average fluorescence of 5–10,000 individually measured yeast cells (a.u.: arbitrary units). Rapamycin (Rapa −1 µM) was added at the indicated time (gray bar, +Aux). (C) Time-course flow cytometry analysis of SPARCN188 in Med21, Spt5 and Spt6 Anchor Away strains. (D) Time-course flow cytometry analysis of SPARCH1–H5 in Med21, Spt5 and Spt6 Anchor Away strains. (E–G) Time-course flow cytometry analysis of SPARCH1–H5 in Spt4 Anchor Away strains. E – Raw fluorescence (FL2.Amean), F – Cell size (FSC.Amean), G – Normalized fluorescence (FL2.Amean/FSC.Amean). (H) Structure of the SPT4-SPT5 binding interface PDB 2EXU (Guo et al., 2008). Inset – zoom in on the acid dipole interaction interface with critical residues labeled and hydrogen bonds shown in yellow. (I) Time-course flow cytometry analysis of SPARCH1–H5 in Spt4 Anchor Away strains with selected genome-integrated SPT4 rescue constructs. (J) Time-course flow cytometry analysis of SPARCH1–H5 in Spt5 Anchor Away strains with selected genome-integrated SPT5 rescue constructs. (K) Time-course flow cytometry analysis of SPARCH1–H5 in Spt6 Anchor Away strains with selected genome-integrated SPT6 rescue constructs. (L) Structure of RNA POL II subunits, DNA, PAF complex, with SPT/DSIF proteins – 7XN7 (Ehara et al., 2022). SPT6 – red, SPT6-YqgF domain – pink, SPT5 – blue, SPT5-KOW2-KOW3 – teal, SPT4 – green.
The SPT4/SPT5/SPT6 is functionally required by TPL for repression. (A) A schematic of the annotated domains of A. thaliana TPLN188, and S. cerevisiae Spt4, Spt5, and Spt6. Dotted lines indicate known protein interactions between these proteins. The position of the known interaction residues of SPT4 and SPT5 are shown with a black line and residue numbering. (B) Schematic of inducible expression and nuclear depletion of SPTs in the context of the Auxin response circuit (ARC). In anchor-away, the yeast ribosomal protein 13A (RPL13A) is fused to the rapamycin-binding protein FKBP. Addition of rapamycin induces dimerization between FKBP and any target protein fused to 2xFRB, resulting in removal of the target protein from the nucleus. Expression of the ARC is monitored by expression of Venus fluorescent protein. (C–G and I–K) Each panel represents representative data from at least two independent time-course flow cytometry experiments of the specific conditions indicated. Every point represents the average fluorescence of 5–10,000 individually measured yeast cells (a.u.: arbitrary units). Rapamycin (Rapa −1 µM) was added at the indicated time (gray bar, +Aux). (C) Time-course flow cytometry analysis of SPARCN188 in Med21, Spt5 and Spt6 Anchor Away strains. (D) Time-course flow cytometry analysis of SPARCH1–H5 in Med21, Spt5 and Spt6 Anchor Away strains. (E–G) Time-course flow cytometry analysis of SPARCH1–H5 in Spt4 Anchor Away strains. E – Raw fluorescence (FL2.Amean), F – Cell size (FSC.Amean), G – Normalized fluorescence (FL2.Amean/FSC.Amean). (H) Structure of the SPT4-SPT5 binding interface PDB 2EXU (Guo et al., 2008). Inset – zoom in on the acid dipole interaction interface with critical residues labeled and hydrogen bonds shown in yellow. (I) Time-course flow cytometry analysis of SPARCH1–H5 in Spt4 Anchor Away strains with selected genome-integrated SPT4 rescue constructs. (J) Time-course flow cytometry analysis of SPARCH1–H5 in Spt5 Anchor Away strains with selected genome-integrated SPT5 rescue constructs. (K) Time-course flow cytometry analysis of SPARCH1–H5 in Spt6 Anchor Away strains with selected genome-integrated SPT6 rescue constructs. (L) Structure of RNA POL II subunits, DNA, PAF complex, with SPT/DSIF proteins – 7XN7 (Ehara et al., 2022). SPT6 – red, SPT6-YqgF domain – pink, SPT5 – blue, SPT5-KOW2-KOW3 – teal, SPT4 – green.
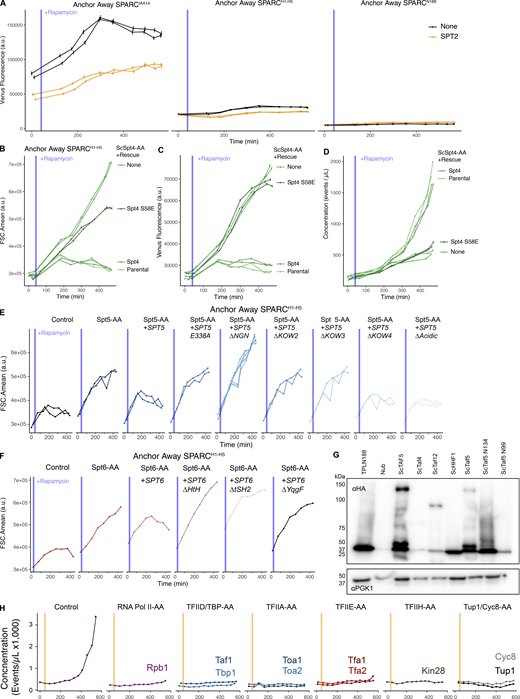
The SPT4/SPT5/SPT6 is functionally required by TPL for repression. (A) Time-course flow cytometry analysis of SPARC transcription in ScSpt2 anchor-away strains. (B–D) Time-course flow cytometry analysis of SPARCH1–H5 in ScSpt4 Anchor Away strains with selected genome-integrated ScSPT4 rescue constructs. (B) Cell size is plotted on the y-axis as the mean forward scatter (FSCA.mean) over time on the x-axis. This demonstrates that ScSpt4 S58E has an intermediate effect on cell size compared to the ScSpt4-AA alone. (C) Raw Venus fluorescence is plotted on the y-axis over time on the x-axis. This demonstrates that the Spt4 S58E breaks repression. (D) Culture concentration is plotted on the y-axis over time on the x-axis. This demonstrates that ScSpt4 S58E fails to rescue the Spt4 cell division phenotype. (E) Time-course flow cytometry analysis of SPARCH1–H5 in SPT5 Anchor Away strains with selected genome-integrated ScSPT5 rescue constructs. Cell size is plotted on the y-axis as the mean forward scatter (FSCA.mean) over time on the x-axis. This demonstrates that ScSpt5 has an intermediate effect on cell size compared to the Spt4-AA alone. (F) Time-course flow cytometry analysis of SPARCH1–H5 in SPT6 Anchor Away strains with selected genome-integrated ScSPT6 rescue constructs. Cell size is plotted on the y-axis as the mean forward scatter (FSCA.mean) over time on the x-axis. (G) Protein expression analysis by western blot for ScTaf protein expression. (H) Time-course flow cytometry analysis of SPARCH1–H5 in selected Anchor Away strains that include selected GTF components. Culture concentration is plotted on the y-axis over time on the x-axis to highlight how most essential gene anchor away experiments are stymied by impacts on cell growth and division. Source data are available for this figure: SourceData FS4.
The SPT4/SPT5/SPT6 is functionally required by TPL for repression. (A) Time-course flow cytometry analysis of SPARC transcription in ScSpt2 anchor-away strains. (B–D) Time-course flow cytometry analysis of SPARCH1–H5 in ScSpt4 Anchor Away strains with selected genome-integrated ScSPT4 rescue constructs. (B) Cell size is plotted on the y-axis as the mean forward scatter (FSCA.mean) over time on the x-axis. This demonstrates that ScSpt4 S58E has an intermediate effect on cell size compared to the ScSpt4-AA alone. (C) Raw Venus fluorescence is plotted on the y-axis over time on the x-axis. This demonstrates that the Spt4 S58E breaks repression. (D) Culture concentration is plotted on the y-axis over time on the x-axis. This demonstrates that ScSpt4 S58E fails to rescue the Spt4 cell division phenotype. (E) Time-course flow cytometry analysis of SPARCH1–H5 in SPT5 Anchor Away strains with selected genome-integrated ScSPT5 rescue constructs. Cell size is plotted on the y-axis as the mean forward scatter (FSCA.mean) over time on the x-axis. This demonstrates that ScSpt5 has an intermediate effect on cell size compared to the Spt4-AA alone. (F) Time-course flow cytometry analysis of SPARCH1–H5 in SPT6 Anchor Away strains with selected genome-integrated ScSPT6 rescue constructs. Cell size is plotted on the y-axis as the mean forward scatter (FSCA.mean) over time on the x-axis. (G) Protein expression analysis by western blot for ScTaf protein expression. (H) Time-course flow cytometry analysis of SPARCH1–H5 in selected Anchor Away strains that include selected GTF components. Culture concentration is plotted on the y-axis over time on the x-axis to highlight how most essential gene anchor away experiments are stymied by impacts on cell growth and division. Source data are available for this figure: SourceData FS4.
SPT5 and SPT6 have a well-defined activity in the context of their physical interactions with RNA Pol II (Bernecky et al., 2017; Ehara et al., 2017; Vos et al., 2018), and SPT4 interacts with SPT5 through its NGN-binding domain (Guo et al., 2008) (Fig. 4 A). We created SPT4 anchor-away strains to test whether SPT4 was required for TPL-based repression. Indeed, fluorescence levels increased upon ScSpt4 anchor away (Fig. 4 E); however, we also observed increases in cell size (Fig. 4 F), which has been well characterized in ScSpt4 loss of function mutations in yeast where spt4-∆ is among the largest 5% of haploid deletion strains (Jorgensen et al., 2002). After normalizing for cell size, we observed that loss of ScSpt4 does lead to a modest release of TPL repression (Fig. 4 G). The SPT4–SPT5 binding interaction is coordinated by an acid-dipole interaction directed by Ser58 in SPT4 and Glu338 in SPT5 (Fig. 4, A and H) (Guo et al., 2008). To test whether ScSpt4 is required for repression without relying on a full loss of function, we performed a genetic rescue experiment by introducing either wild-type ScSpt4 or a Ser58 mutant (S58E) into our ScSpt4 anchor away strain. We observed complete rescue with wild-type ScSpt4 in the presence of Rapamycin. ScSpt4S58E was completely unable to rescue repression despite retaining nearly normal cell size (Fig. S4, B–D), suggesting that the SPT4–SPT5 contact is required for repression (Fig. 4 I).
On the SPT5 side of the SPT4–SPT5 interaction face, the spt5-194 mutation (S324F) identified in R-SGA likely destabilizes hydrogen bonding between Ser324 and Glu338, introduces a bulky residue into the binding pocket, and is therefore likely to destabilize SPT4–SPT5 interaction (Guo et al., 2008) (Fig. 4 H). To interrogate whether reciprocal mutations in ScSpt5 that disrupt ScSpt4 binding affect repression, we created a deletion of the NGN domain and a Glu338 to alanine mutation in ScSpt5 rescue plasmids. We observed that the NGN domain deletion had a dramatic effect on cell size, and also largely eliminated the reporter signal, similar to the ScSpt4 anchor away results (Fig. 4 J and Fig. S4 E). However, the E338A mutation was more specific, phenocopying the ScSpt5 anchor away, providing further support for a model where SPT4 and SPT5 together are required for H1-mediated TPL-based repression (Fig. 4 J).
Our observation that loss of SPT4, SPT5, and SPT6 activity resulted in a loss of repression led us to hypothesize that some complexes containing these components must be required for this repressive function. Both SPT5 and SPT6 are multidomain proteins that make extensive contacts with both RNA Pol II and other complexes (Hartzog and Fu, 2013; Miller et al., 2023). We engineered targeted deletions in both SPT5 and SPT6 in selected domains to determine which may be required for this newly found repressive function (Fig. 4, A, J, and K). We observed that in ScSpt5, KOW2 and KOW3 domains are required for repression, but not the acidic or KOW4 domains (Fig. 4 J and Fig. S4 E), although these deletions may alter protein accumulation. In ScSpt6, the YqgF domain was required for repression, but not the tSH2 domain (Fig. 4 K and Fig. S4 F). The YqgF domain has recently been implicated in the initiation of transcription, as mutant forms lacking this domain are trapped at the TSS in Arabidopsis (Chen et al., 2019), while the tSH2 domain is well documented as being a Pol-II interaction surface (Miller et al., 2023). We then mapped the location of these domains onto the protein complex formed between RNA POL II subunits, DNA, PAF complex, and SPT or DSIF proteins as in Fig. 4 H (Ehara et al., 2022). Strikingly, the KOW2 and KOW3 domains in ScSpt5 and the YqgF in ScSpt6 are each found at the junction between these proteins and RNA Pol II subunits RPB1 and RPB2 (Fig. 4 L).
TPL requires components of the nucleation step of the transcriptional pre-initiation complex (PIC) for repression
If mediator and SPT4-6 transcriptional regulators are required for repression, it is logical to wonder whether other components of the general transcription machinery are similarly involved. In the first stages of promoter identification, the TATA box binding protein (TBP), a subunit of the TFIID complex, binds to the promoter at the TATA box and induces DNA bending (Fig. 5 A). TBP then recruits TFIIA and then TFIIB to the promoter, which in turn recruits RNA Pol II and TFIIF. Finally, TFIIE is recruited and brings TFIIH, with kinase activity, to phosphorylate the RNA Pol-II CTD, at which point the PIC is transcriptionally active. The TFIID complex was highly enriched by APEX proximity labeling, as were subunits of TFIIA and TFIIE (Fig. 5 A, red and purple). We also observed multiple subunits from TFIID in our R-SGA data as genetic interactors with the SPARC (Fig. 5 A, blue and purple). In the context of the TFIID structure (Patel et al., 2018), the extensive physical and genetic interaction with TAF subunits became even more apparent (Fig. 5 B).

TPL requires components of the nucleation step of the transcriptional pre-initiation complex (PIC) for repression. (A) Schematic of the steps of the transcriptional preinitiation complex formation on a promoter, accompanied by a cartoon representation of TFIID and TFIIA components. (B) Crystal structure of human TFIID PDB 6MZL (Patel et al., 2018). Both A and B were colored to represent which genes were identified by proximity labeling (red) and genetic interaction (blue) or both (purple). (C) Cytoplasmic split-ubiquitin system (CytoSUS) assays with candidate interacting proteins. Nub-3xHA is the N-terminal fragment of ubiquitin expressed with no fusion protein and is used as a negative control. −WL, −ADE: dropout lacking Trp, Leu, and Ade (growth control); −WLMH, −ADE: dropout lacking Trp, Leu, His, Met, and Ade (selective media). (D) Time-course flow cytometry analysis of SPARCH1–H5 in selected anchor-away strains that include selected GTF components (Petrenko et al., 2017). (E) Time-course flow cytometry analysis of SPARCH1–H5 in a Taf5 anchor-away strain (Taf5-2xFRB). (F) Heat map of all TFIID components in TS screens. Columns 1–6 are z-scores for all mutants that were recovered from all TS replicate screens. NAA – auxin application. (G) Top – gene map of the ScTaf5 protein. Middle – helical wheel diagram of the ScTaf5 LisH Helix 1 alpha helix. Bottom – protein alignment of ScTaf5 LisH Helix 1 domain and selected mutations. (H) Steady-state flow cytometry of taf5-15 with selected rescue constructs grown at the non-permissive temperature (30°C). Gray bar indicates the fluorescence of the wild-type rescue construct. (I) AID-Taf5 schematics and rescue experiments. Fluorescence were quantified by cytometry at 6 h after application of 5 μM IAA. (J) Cartoon schematic of the dCAS9-repressor experiment to test LisH repression function in HL-60 cell culture. (K) Quantification of CD4 protein levels by flow cytometry. Isotype control is provided to highlight the baseline fluorescence levels.
TPL requires components of the nucleation step of the transcriptional pre-initiation complex (PIC) for repression. (A) Schematic of the steps of the transcriptional preinitiation complex formation on a promoter, accompanied by a cartoon representation of TFIID and TFIIA components. (B) Crystal structure of human TFIID PDB 6MZL (Patel et al., 2018). Both A and B were colored to represent which genes were identified by proximity labeling (red) and genetic interaction (blue) or both (purple). (C) Cytoplasmic split-ubiquitin system (CytoSUS) assays with candidate interacting proteins. Nub-3xHA is the N-terminal fragment of ubiquitin expressed with no fusion protein and is used as a negative control. −WL, −ADE: dropout lacking Trp, Leu, and Ade (growth control); −WLMH, −ADE: dropout lacking Trp, Leu, His, Met, and Ade (selective media). (D) Time-course flow cytometry analysis of SPARCH1–H5 in selected anchor-away strains that include selected GTF components (Petrenko et al., 2017). (E) Time-course flow cytometry analysis of SPARCH1–H5 in a Taf5 anchor-away strain (Taf5-2xFRB). (F) Heat map of all TFIID components in TS screens. Columns 1–6 are z-scores for all mutants that were recovered from all TS replicate screens. NAA – auxin application. (G) Top – gene map of the ScTaf5 protein. Middle – helical wheel diagram of the ScTaf5 LisH Helix 1 alpha helix. Bottom – protein alignment of ScTaf5 LisH Helix 1 domain and selected mutations. (H) Steady-state flow cytometry of taf5-15 with selected rescue constructs grown at the non-permissive temperature (30°C). Gray bar indicates the fluorescence of the wild-type rescue construct. (I) AID-Taf5 schematics and rescue experiments. Fluorescence were quantified by cytometry at 6 h after application of 5 μM IAA. (J) Cartoon schematic of the dCAS9-repressor experiment to test LisH repression function in HL-60 cell culture. (K) Quantification of CD4 protein levels by flow cytometry. Isotype control is provided to highlight the baseline fluorescence levels.
Previously, we identified that ScTaf5, the structural core of TFIID for both lobe A and B (Fig. 5 B) contains a LisH domain that was capable of repressing transcription in our synthetic yeast assay (Leydon et al., 2022). This led to our hypothesis that perhaps the TPL LisH domain could dimerize with the Taf5 LisH domain to recruit TPL to the TFIID complex at both A and B lobes (Fig. 5 B). However, we detected no interaction between TPL and full-length ScTaf5, ScTaf4, or ScTaf12 proteins. We did observe low-level interactions between TPL and the Histone H4 protein (ScHhf1) as has been previously described (Ma et al., 2017). This interaction is thought to be driven by the histone tail, so it is perhaps not surprising we did not see interaction with Taf4 or Taf12 through their histone fold domains (Fig. 5 C). However, in the case of HsTAF5, it has been well characterized that the HsTAF5 WD40 domain requires the TRiC/CCT chaperone to fold and subsequently is rapidly recruited into the HsTAF5-6-9 complex (Antonova et al., 2018; Patel et al., 2020), and therefore may be physically unavailable to bind in the CytoSUS assay. Truncations of ScTaf5 containing only the N-terminal domain IDRs and LisH (N134) showed strong TPL binding activity, which is drastically reduced but not eliminated upon deletion of the LisH domain (N99, Fig. 5 C and Fig. S4 G).
To begin to test whether components of the PIC are required for repression, we used a previously characterized series of anchor-away strains that include selected GTF components (Petrenko et al., 2017). Unsurprisingly, the depletion of proteins required for transcription such as ScRpb1 or ScTbp results in yeast that cannot transcribe any genes including the reporter (Fig. 5 E and Fig. S4 H). However, anchoring away TFIIE did break transcriptional repression (Fig. 5 E, Tfa1). Both ScTbp and ScTaf1 anchor away strains led to a loss of growth (Fig. S4 H), a phenotype consistent with loss of an essential GTF. Therefore, we engineered a ScTaf5 anchor away strain, which demonstrated an increase in reporter expression that is consistent with a role for TAF5 in repression (Fig. 5 E). However, it is clear that the C-terminal fusion of the 2xFRB tag required for anchor away reduced the function of ScTaf5, as reporter transcription prior to Rapamycin addition was quite low compared with the control line (Fig. 5 E).
To independently assess a role for TAF5 in TPL-mediated repression, we turned to the TFIID TS mutants identified by the R-SGA (Fig. 5 F). taf5-15 (G306S, E396K, S542F, Fig. 5 G) had the strongest signal in R-SGA experiments and was selected for further experiments. To test which residues within the ScTaf5 LisH domain might be critical for TPL-mediated repression, we mapped the residues in ScTaf5 with respect to their predicted orientation in the context of the LisH dimerization interface for Helix 1 (Fig. 5 G, helical wheel). We engineered alanine mutations in the solvent facing (mSolvent), LisH interface (mLisH), as well as domain swaps where the LisH Helix 1 was replaced with the Helix 1 from either Arabidopsis TAF5 (AtTAF5) or TPL (AtTPL, Fig. 5 G). We introduced these constructs into taf5-15 mutant strains carrying the SPARCH1–H5. Wild-type ScTAF5 fully rescued repression, as did mSolvent, AtTAF5, and AtTPL (Fig. 5 H). In contrast, mLisH failed to rescue repression, indicating that the conserved residues in the H1 domain that direct LisH dimerization are required for the activity of ScTAF5 in its role in repression. This finding is consistent with cross-kingdom analyses of other LisH domains (Leydon et al., 2022). We engineered an Auxin inducible degron (AID) version of ScTaf5 (AID-Taf5, Fig. 5 I) where the degron was fused to the N-terminus of ScTaf5 and observed that this approach did not reduce the function of the Taf5 protein (Fig. 5 I). We performed the same rescue experiments as in Fig. 5 H, and observed similar results, with the exception that AID-induced loss of ScTaf5 had an even greater effect on fluorescence levels (Fig. 5 I), and that mLisH exhibited a more modest effect on reporter output.
The TPL N-terminal domain has been structurally compared (Martin-Arevalillo et al., 2017) with other LisH domain–containing proteins such as the Transducin-Beta like 1 (HsTBL1 [Guenther et al., 2000]), which is a component of the SMRT/NCoR complex (Oberoi et al., 2011), and acts as an exchange factor, facilitating conversion of SMRT/NCoR repressed loci to transcriptionally active states (Perissi et al., 2004). TPL H1 and H1–H2 (the full LisH) are functional repression domains in yeast (Leydon et al., 2022), and our findings here pointed to a functional interaction repertoire that should be conserved across all eukaryotes. To further test this hypothesis, we introduced dCAS9-TPLN188 into human HL-60 cells and compared its repression capacity with the KRAB-domain containing protein domain from ZIM3, which recruits KAP1/TRIM28 to induce DNA methylation (Ecco et al., 2017) (Fig. 5 J). In this experiment, the CD4 gene was targeted and protein levels were quantified by immunostaining and flow cytometry (Belliveau et al., 2023). We observed a modest reduction in CD4 abundance when TPLN188 was recruited to the CD4 promoter region, compared with a control guide, which does not target the genome (Fig. 5 K). As targeting of dCas9 alone has been shown to inhibit transcription in other contexts, the effect of TPLN188 is difficult to interpret. In contrast, the HsTBL1 N-terminal domain (N98), which we previously found to be able to replace TPL in our synthetic yeast assay (Leydon et al., 2022) and has a strikingly similar structure to TPLN188 (Martin-Arevalillo et al., 2017), was a far stronger repressor, acting as efficiently as ZIM3 (Fig. 5 K).
Transcriptional repression by TPL in planta requires the LisH domain and its interacting partners SPT6 and TAF5
To test the impact of TPL interactors on repression in an endemic developmental context, we used a quantitative repression assay based on UAS/GAL4-VP16 (Leydon et al., 2021; Brand and Perrimon, 1993; Gala et al., 2021) (Fig. 6, A and B). We generated transgenic Arabidopsis lines where the UAS-TPL-IAA14mED constructs were activated in the xylem pole pericycle stem cells where IAA14 normally acts to regulate the initiation of lateral root primordia (Fig. 6 A). To block potentially confounding interactions with endogenous TPL/TPRs or TIR1/AFBs, we engineered a variant of IAA14 with mutation in the two EAR domains (EARAAA) and in the degron (P306S, hereafter termed IAA14mED; Fig. 6 B). We created mutations in the TPL LisH-H1 sequence to investigate its repressive function in lateral root development and tested their protein accumulation (Fig. 6 C and Fig. S5 A). Expression of functional TPLN188-IAA14 fusion proteins in these xylem pole pericycle cells strongly suppressed the production of lateral roots, phenocopying the solitary root (slr) mutant, which carries the auxin-resistant form of IAA14 (Fig. 6 D). Disrupting the wild-type TPL H1 sharply decreased repression and restored lateral root density (Fig. 6 D). We observed that the LisH was required for repression even when the H8 repression motif was intact (Fig. 6 D). This result suggests an order of operations to the TPL mechanism, where TPL interacts first with SPT4/TAF5 and then with MED21 to establish a durable repression state. Interestingly, mutations in either solvent or buried faces of the LisH rendered the TPL protein non-functional in Arabidopsis (Fig. 6 D), indicating that these both play a critical role in repression, marking a point of divergence between yeast and plants. Additionally, we uncovered a difference between ScTaf5 and AtTAF5, where the AtTAF5 has a degenerate LisH motif that is incapable of replacing the TPL H1 sequence (Fig. 6, C and D).

Transcriptional repression by TPL in planta requires the LisH domain and its interacting partners MED21, SPT6L, and TAF5. (A) Auxin-induced degradation of the IAA14 is strictly required for the initiation of lateral root development (cartoon). An enhancer trap line (J0121) expresses GAL4-VP16 and pUAS:GFP in the xylem pole pericycle cells. (B) Design of pUAS:TPL-IAA14mED construct. Mutation of the conserved lysine residues in the EAR domain disrupted potential interactions with endogenous TPL/TPR proteins. The IAA14 degron has been mutated (P306S) to render it auxin insensitive. UAS: upstream activating sequence; ttRBCS: Rubisco terminator sequence. (C) The protein structure of the N-terminal domain of AtTPLN188, with LisH domain highlighted in blue (left) Helical wheel depiction of AtTPL H1 sequence colored by their physicochemical class (Red/blue, charged; yellow, hydrophobic) (right) The consensus sequence of LisH-H1 sequence with different residue mutations in gray are displayed below. (D) Mutations in TPL’s LisH domain were sufficient to break the repression of the development of lateral roots in Arabidopsis seedlings. The density of emerged lateral roots was measured in T1 seedlings at 14 days after germination. Density is calculated as the lateral root number divided by the total length (mm) of the primary root. Each dot represents a unique insertion line. (E) Design and analysis of pUAS:SPT4 construct. S71 is the homologous amino acid to S58 in Saccharomyces Spt4. The density of emerged lateral roots was measured in T2 seedlings at 14 days after germination across at least three independent transformant lines. (F) Design and analysis of pUAS:SPT5 construct. S215 is the homologous amino acid to S324F in Saccharomyces Spt5. The density of emerged lateral roots was measured in T2 seedlings at 14 days after germination across at least three independent transformant lines. (G) Design of the integrase target. The target is composed of two integrase sites (triangles) surrounding a constitutive promoter (pUBQ10) and two fluorescent reporters (GFP and mScarlet). In the absence of the integrase, GFP is expressed. In the presence of the integrase, there is an inversion of the DNA between the target sites, inverting the promoter to drive mScarlet expression. The expression of the integrase is mediated by the GATA23 promoter, which is expressed in the founder cells of lateral roots. (H–K) Epifluorescence micrographs of roots of T1 plants from representative integrase switch lines. All images were taken at 12 days after germination at 20× magnification. Scale bar represents 50 µm. (L) The effect of loss of MED21 on lateral root density (emerged roots only) was calculated at day 14 in T2 plants. Data points from each independent line appear with the same gray value, and at least six independent lines were evaluated for each switch genotype. (M) Lateral root lengths at day 14 for plants in J. Letters indicate significant differences (ANOVA and Tukey HSD multiple comparison test; P < 0.001). (N and O) Lateral root initiations (emerged roots + non-emerged primordia) were quantified in heterozygous and homozygous mutant lines on days 10 and 14. Each datapoint color represents a unique insertion, and at least six independent insertions were analyzed for each experiment. Asterisks indicate the significant difference (ANOVA and Tukey HSD multiple comparison test; P < 0.05).
Transcriptional repression by TPL in planta requires the LisH domain and its interacting partners MED21, SPT6L, and TAF5. (A) Auxin-induced degradation of the IAA14 is strictly required for the initiation of lateral root development (cartoon). An enhancer trap line (J0121) expresses GAL4-VP16 and pUAS:GFP in the xylem pole pericycle cells. (B) Design of pUAS:TPL-IAA14mED construct. Mutation of the conserved lysine residues in the EAR domain disrupted potential interactions with endogenous TPL/TPR proteins. The IAA14 degron has been mutated (P306S) to render it auxin insensitive. UAS: upstream activating sequence; ttRBCS: Rubisco terminator sequence. (C) The protein structure of the N-terminal domain of AtTPLN188, with LisH domain highlighted in blue (left) Helical wheel depiction of AtTPL H1 sequence colored by their physicochemical class (Red/blue, charged; yellow, hydrophobic) (right) The consensus sequence of LisH-H1 sequence with different residue mutations in gray are displayed below. (D) Mutations in TPL’s LisH domain were sufficient to break the repression of the development of lateral roots in Arabidopsis seedlings. The density of emerged lateral roots was measured in T1 seedlings at 14 days after germination. Density is calculated as the lateral root number divided by the total length (mm) of the primary root. Each dot represents a unique insertion line. (E) Design and analysis of pUAS:SPT4 construct. S71 is the homologous amino acid to S58 in Saccharomyces Spt4. The density of emerged lateral roots was measured in T2 seedlings at 14 days after germination across at least three independent transformant lines. (F) Design and analysis of pUAS:SPT5 construct. S215 is the homologous amino acid to S324F in Saccharomyces Spt5. The density of emerged lateral roots was measured in T2 seedlings at 14 days after germination across at least three independent transformant lines. (G) Design of the integrase target. The target is composed of two integrase sites (triangles) surrounding a constitutive promoter (pUBQ10) and two fluorescent reporters (GFP and mScarlet). In the absence of the integrase, GFP is expressed. In the presence of the integrase, there is an inversion of the DNA between the target sites, inverting the promoter to drive mScarlet expression. The expression of the integrase is mediated by the GATA23 promoter, which is expressed in the founder cells of lateral roots. (H–K) Epifluorescence micrographs of roots of T1 plants from representative integrase switch lines. All images were taken at 12 days after germination at 20× magnification. Scale bar represents 50 µm. (L) The effect of loss of MED21 on lateral root density (emerged roots only) was calculated at day 14 in T2 plants. Data points from each independent line appear with the same gray value, and at least six independent lines were evaluated for each switch genotype. (M) Lateral root lengths at day 14 for plants in J. Letters indicate significant differences (ANOVA and Tukey HSD multiple comparison test; P < 0.001). (N and O) Lateral root initiations (emerged roots + non-emerged primordia) were quantified in heterozygous and homozygous mutant lines on days 10 and 14. Each datapoint color represents a unique insertion, and at least six independent insertions were analyzed for each experiment. Asterisks indicate the significant difference (ANOVA and Tukey HSD multiple comparison test; P < 0.05).
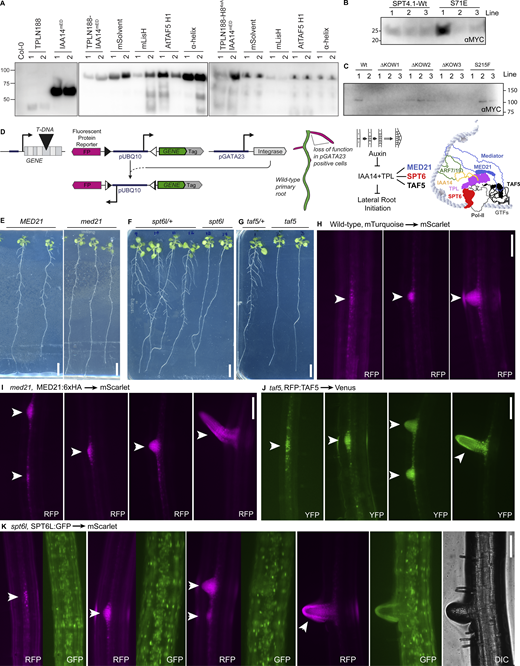
Analysis of TPL and TPL-interacting protein activity in Arabidopsis lateral root development. (A) Protein expression analysis by western blot for UAS-driven TPL-IAA14 constructs. For all samples, four 14-day grown root tissues were pooled from two representative T2 lines from Fig. 6 D. The middle panel is comprised of LisH mutants in the context of an intact H8, and the right panel is comprised of LisH mutants in the context of a mutant H8. Proteins were extracted and run by SDS-PAGE and western blotting for the HA-epitope tag. Equal volume was run on each lane. (B) Protein expression analysis by western blot for UAS-driven AtSPT4.1 constructs. For all samples, four 14-day grown root tissues were pooled from three representative T2 lines from Fig. 6 E. Proteins were extracted and run by SDS-PAGE and western blotting for the MYC-epitope tag. Equal volume was run on each lane. (C) Protein expression analysis by western blot for UAS-driven AtSPT5.2 constructs. For all samples, four 14-day grown root tissues were pooled from three representative T2 lines from Fig. 6 F. Proteins were extracted and run by SDS-PAGE and western blotting for the MYC-epitope tag. Equal volume was run on each lane. This construct was lowly expressed and was at the limits of detection. (D) Schematic of the integrase switch approach to generate a cell-type specific loss of function. In this approach a T-DNA in an essential gene that normally can only be carried as a heterozygote is rescued by a ubiquitously expressed version of the essential gene. This rescue transgene also carries Integrase binding sites (triangles) flanking the ubiquitous (pUBQ10) promoter. Upon expression of the integrase (PhiC31) from a separate transgene driven by a cell type–specific promoter (pGATA23), the PhiC31 will bind to these binding sites, catalyze an irreversible inversion of the promoter sequence, and therefore active a reporter gene that is facing in the opposite direction on the same strand of DNA (here this is a fluorescent protein reporter, FP). This generates loss of function mutations in the lateral root primordial cells, as cartooned in the seedling in the middle of the panel. We chose MED21, SPT6L and TAF5 as targets to destabilize TPL activity in lateral root primordium cells, to test the ability to modulate development of lateral roots initiation as diagrammed by the cartoon at the right. (E–G) Integrase switched essential lines demonstrate developmental root phenotypes. Scanned images of seedlings grown on plates for 14 days. (E) MED21 integrase switch lines exhibit short stubby roots that grow out from the primary root. (F and G) (F) SPT6L and (G) TAF5 integrase switch lines exhibit very short roots that do not exit the primary root and are not visible in plate scans. (E and F) Scale bars represent 10 mm. (H–K) Epifluorescence micrographs of roots of T2 plants from representative integrase switch lines. All images were taken 12 days after germination at 20× magnification. Arrowheads indicate initiating lateral roots based upon induction of pGATA23:PhiC31-triggered switching. (H) Wild-type mTurq to mScarlet control switch, mScarlet shown alone. (I)med21/med21, MED21:6xHA to mScarlet experimental switch, mScarlet shown alone. (J)taf5/taf5, RFP:TAF5 to Venus experimental switch, Venus shown alone. (K)spt6l/spt6l, SPT6L:GFP to mScarlet experimental switch, both channels are shown. For H–K, the same scale bar at top right applies to all images and represents 50 µm. Source data are available for this figure: SourceData FS5
Analysis of TPL and TPL-interacting protein activity in Arabidopsis lateral root development. (A) Protein expression analysis by western blot for UAS-driven TPL-IAA14 constructs. For all samples, four 14-day grown root tissues were pooled from two representative T2 lines from Fig. 6 D. The middle panel is comprised of LisH mutants in the context of an intact H8, and the right panel is comprised of LisH mutants in the context of a mutant H8. Proteins were extracted and run by SDS-PAGE and western blotting for the HA-epitope tag. Equal volume was run on each lane. (B) Protein expression analysis by western blot for UAS-driven AtSPT4.1 constructs. For all samples, four 14-day grown root tissues were pooled from three representative T2 lines from Fig. 6 E. Proteins were extracted and run by SDS-PAGE and western blotting for the MYC-epitope tag. Equal volume was run on each lane. (C) Protein expression analysis by western blot for UAS-driven AtSPT5.2 constructs. For all samples, four 14-day grown root tissues were pooled from three representative T2 lines from Fig. 6 F. Proteins were extracted and run by SDS-PAGE and western blotting for the MYC-epitope tag. Equal volume was run on each lane. This construct was lowly expressed and was at the limits of detection. (D) Schematic of the integrase switch approach to generate a cell-type specific loss of function. In this approach a T-DNA in an essential gene that normally can only be carried as a heterozygote is rescued by a ubiquitously expressed version of the essential gene. This rescue transgene also carries Integrase binding sites (triangles) flanking the ubiquitous (pUBQ10) promoter. Upon expression of the integrase (PhiC31) from a separate transgene driven by a cell type–specific promoter (pGATA23), the PhiC31 will bind to these binding sites, catalyze an irreversible inversion of the promoter sequence, and therefore active a reporter gene that is facing in the opposite direction on the same strand of DNA (here this is a fluorescent protein reporter, FP). This generates loss of function mutations in the lateral root primordial cells, as cartooned in the seedling in the middle of the panel. We chose MED21, SPT6L and TAF5 as targets to destabilize TPL activity in lateral root primordium cells, to test the ability to modulate development of lateral roots initiation as diagrammed by the cartoon at the right. (E–G) Integrase switched essential lines demonstrate developmental root phenotypes. Scanned images of seedlings grown on plates for 14 days. (E) MED21 integrase switch lines exhibit short stubby roots that grow out from the primary root. (F and G) (F) SPT6L and (G) TAF5 integrase switch lines exhibit very short roots that do not exit the primary root and are not visible in plate scans. (E and F) Scale bars represent 10 mm. (H–K) Epifluorescence micrographs of roots of T2 plants from representative integrase switch lines. All images were taken 12 days after germination at 20× magnification. Arrowheads indicate initiating lateral roots based upon induction of pGATA23:PhiC31-triggered switching. (H) Wild-type mTurq to mScarlet control switch, mScarlet shown alone. (I)med21/med21, MED21:6xHA to mScarlet experimental switch, mScarlet shown alone. (J)taf5/taf5, RFP:TAF5 to Venus experimental switch, Venus shown alone. (K)spt6l/spt6l, SPT6L:GFP to mScarlet experimental switch, both channels are shown. For H–K, the same scale bar at top right applies to all images and represents 50 µm. Source data are available for this figure: SourceData FS5
We next wanted to test whether the SPTs and GTFs we identified in yeast play analogous roles with TPL corepressor activity in plants. However, like in yeast, many of these genes are essential in Arabidopsis (AtSPT4 [Dürr et al., 2014], AtSPT5 [Dürr et al., 2014], AtSPT6L [Chen et al., 2019], and AtTAF5 [Mougiou et al., 2012]). First, we expressed in plants AtSPT4 and AtSPT5 isoforms that are predicted to disrupt TPL repression based on our results in yeast using the same xylem pole pericycle driver as described for the TPL functional assays. We observed that mutations in AtSPT4.1 (S71E, Fig. 6 E and Fig. S5 B) or AtSPT5.2 (S215F, Fig. 6 E and Fig. S5 C) that disrupt the SPT4-SPT5 binding interface induce higher lateral root densities when expressed in planta. However, these are expressed on top of the wild-type copy presumably competing for binding with partner proteins, and it would be complementary to examine a loss of function for these factors to test their role in repression. Therefore, we set out to develop a conditional loss of function assay, somewhat analogous to anchor away in yeast and we took advantage of recent work deploying serine integrases to mediate site-specific and irreversible DNA recombination in Arabidopsis roots (Guiziou et al., 2023). This study demonstrated that serine integrases could be used in Arabidopsis roots as a lineage tracker, switching expression between two fluorescent proteins under the control of a cell type–specific promoter. This framework allowed us to engineer the loss of gene function in a specific cell type during development (Fig. 6 G and Fig. S5 D) by rescuing null T-DNA mutants with a constitutively expressed wild-type gene with a promoter flanked by integrase sites. When the expression of the integrase PhiC31 is under the control of pGATA23, it triggers an irreversible inversion of DNA between integrase sites only in xylem pole pericycle cells. This integrase switch leads to a loss of expression of the essential gene and concomitant expression of a fluorescent reporter in those cells and all descendants.
We used this approach to study three target genes AtMED21, AtSPT6L, and AtTAF5 that met the criteria of being single-copy genes and having available loss of function T-DNAs carrying glufosinate resistance. The latter condition made it possible to use characterized target and Integrase constructs. We selected homozygous mutant lines for each gene of interest (Fig. S5, E–G), carrying both a target construct and pGATA23:PhiC31. For each experiment, we identified lines with cell type–specific switching (Fig. 6, H–K and Fig. S5, H–K) and quantified the effect of loss of candidate gene function on lateral root density (Fig. 6, L, N, and O). We hypothesized that, similar to R-SGA, loss of function for TPL-interacting genes will result in a destabilization of TPL repression of IAA14-bound loci in xylem pole pericycle cells, resulting in an increase of lateral root initiation (Fig. S5 D). For each TPL-interacting target gene, we observed an increase in root initiation events when the gene function was lost (Fig. 6, L, N, and O), consistent with the prediction that loss of repression would result in the induction of IAA14-repressed loci. As expected from their essential role in transcription, the lateral roots produced in these lines were not fully wild type. In all cases, the length of the lateral roots was sharply reduced (Fig. S5, E–G). In the case of MED21, stubby roots emerged from the primary root, making it possible to measure their length compared with wild-type plants (Fig. 6 M). In roots where SPT6L and TAF5 function was lost, lateral root development was aborted before emergence, making it necessary to include earlier stages of lateral root initiation in our analysis as measured by pGATA23-induced activation of switching (Fig. 6, N and O; and Fig. S5, H–K).
Discussion
Over the last decade, advances in cryoEM (Hanske et al., 2018) and crystallography (Nogales et al., 2017; Rengachari et al., 2023; Wang et al., 2023) have provided an increasingly clear picture of the transcription PIC; however, corepressors are largely missing from these studies. Despite overlapping structural features and functions (Lee and Golz, 2012; Perissi et al., 2010), there is little agreement on how this class of regulatory proteins inhibits PIC activity (Ito et al., 2016; Leydon et al., 2021; Mayer et al., 2019; Plant et al., 2021). Here, we investigated this question using a single synthetic locus paired with whole-genome screens for protein–protein (APEX2, Fig. 1) and genetic interactors (R-SGA, Fig. 2) with the corepressor TPL. We focused our efforts on the N-terminal domain of TPL for several reasons: (1) it is sufficient for repression in both yeast and plants (Leydon et al., 2021, 2022; Pierre-Jerome et al., 2014), (2) its structure has been solved (Ke et al., 2015; Martin-Arevalillo et al., 2017), (3) it contains two discrete repression domains (Leydon et al., 2021), and (4) it has well-characterized contact points with other proteins in our synthetic circuit that can serve as internal controls (Aux/IAAs, MED21, MED10, and TPL itself [Causier et al., 2012; Ke et al., 2015; Leydon et al., 2021; Martin-Arevalillo et al., 2017]). The results here corroborate our previous work connecting one of TPL’s repression domains to the mediator complex (Leydon et al., 2021), and build on these findings by linking the second repression domain to core PIC subunits. Specifically, we found that the LisH domain, found in the first two helices of TPL, recruits the DSIF complex components SPT4 and SPT5, the interacting protein SPT6, and likely Pol-II itself (Fig. 3). Moreover, the interaction between TPL and the SPT genes was required to maintain repression in both yeast (Fig. 4) and plants (Fig. 6). In addition, GTFs in the TFIID complex were identified through both APEX and R-SGA, with TAF5 directly interacting with TPL to maintain repression (Fig. 5). These results taken together suggest that TPL nucleates the PIC at repressed loci while inhibiting the progression of transcription until an activation signal has been received.
By acting as a bridge between sequence-specific and GTFs, corepressors and coactivators act at many loci to regulate whether a PIC is assembled and whether it is licensed to initiate transcription. Transcription initiation is a multistep process starting with the assembly of the TBP/TFIID and TFIIA complexes (Nogales et al., 2017). In the case of the synthetic TPL-regulated promoter used in these studies, we observed stable binding of the activating transcription factor (ARF19), the Aux/IAA adaptor protein and TPL, accompanied by SPT4, SPT5, and SPT6 (Figs. 3 and 4), elements of TFIIA and TFIID (Figs. 2, 3, and 5), and mediator (Leydon et al., 2021). This complex was not sufficient to initiate transcription, although we did observe an association of Pol-II subunits by proximity labeling. As we were unable to immunoprecipitate Pol-II at the synthetic promoter (Leydon et al., 2021), we hypothesize that the interaction of Pol-II with the repressed locus may be relatively weak or transient. While it was surprising that we did not isolate SPT4 from proximity labeling, we were able to confirm protein interaction between SPT4 and TPL proteins through multiple independent methods (cytoSUS, Co-IP, and BiFC). One limitation of proximity labeling is that it assays interactions within a highly complex endemic context. In such a context, small proteins like SPT4 may be buried or otherwise rendered less accessible by interactions with additional larger proteins (e.g., SPT5 and SPT6).
While SPT4, SPT5, and SPT6 are best known for their roles in transcriptional elongation (Miller et al., 2023; Ehara et al., 2022; Crickard et al., 2017; Kujirai and Kurumizaka, 2020; Uzun et al., 2021) and proximal promoter pausing in metazoans (Dollinger and Gilmour, 2021; Jonkers and Lis, 2015; Wada et al., 1998), they were originally identified as yeast mutants that were able to restore transcription at a locus with a promoter disrupted by the Ty transposon (Fassler and Winston, 1988). The suppressor of Ty genetic screen identified many core components of the transcriptional machinery, including histones, TBP, Mediator15, as well as components of SAGA and FACT complexes (Yamaguchi et al., 2001). The inclusion of SPT4, SPT5, and SPT6 in this group suggests a role in promoter identification and transcription initiation phases in addition to aiding passage of Pol II during elongation. Subsequent studies found that SPT5 stabilizes Pol II protein and regulates chromatin state at enhancers in human cell culture (Hu et al., 2021). The bacterial homolog of SPT5, NusG, is negatively regulated by direct binding of the Rho protein, which triggers dynamic structural conformation changes in RNA Polymerase subunits and termination (Wang and Artsimovitch, 2021). In Salmonella, the depletion of NusG leads to massive upregulation of silenced sites that depend on this Rho-NusG mechanism of repression (Bossi et al., 2019). Recent work in Arabidopsis found that the YqgF domain of SPT6, the same domain we found was required for TPL-mediated repression, is crucial for the initiation of transcription (Chen et al., 2019).
Repression of PIC formation at the level of TFIID is an effective mechanism to inhibit transcription of genes in euchromatin as has been demonstrated by work on several repressors (NC2 [Inostroza et al., 1992; Meisterernst and Roeder, 1991], MOT1 [Mishal and Luna-Arias, 2022], CBF1 [Olave et al., 1998], adenovirus E1A [Song et al., 1995], and Rb [Siegert and Robbins, 1999]). For example, the negative regulator NC2/Dr1-DRAP1 that acts on the TFIID/TBP step of initiation inhibits transcription initiation by Pol II via direct interactions with the TBP–DNA binary complex (Kamada et al., 2001). Within TFIID, the TAF5 protein has several characteristics that make it of particular interest. ScTaf5 shares a structural homology to corepressors, with an N-terminal LisH domain followed by WD40 beta-propeller domains (Fig. 5 G). AtTAF5 has lost the functional LisH domain, while other lineages (i.e., metazoan and fungal) have conserved this domain, and this may partially explain why the repression by TPLN188 is stronger in yeast than in plants (Leydon et al., 2021; Pierre-Jerome et al., 2014). The isolated LisH domain of yeast ScTaf5 represses transcription when targeted to chromatin (Leydon et al., 2022), indicating that an inherent repressive function has to be overridden during activation. Inter-LisH domain binding has also been observed in the assembly of the GID E3 ligase complex, a multisubunit E3 complex that achieves higher-order assembly through LisH interactions (Sherpa et al., 2021).
As TPL/TBL1-type repression is functional as a transcriptional repressor in plant, yeast, and human cells, an attractive model is that a variety of corepressors with similar structural features prime loci for rapid activation by facilitating preassembly of the PIC, including looping of sequence-specific transcription factors bound to enhancer elements to stabilize binding of TFIID, TFIIA, and DSIF. By stabilizing a specific partially assembled state of the PIC (i.e., TFIID, SPTs, and mediator), TPL and other LisH-domain–containing proteins such as the human HsTBL1 protein may create a primed state that allows rapid entry into a transcription competent state. Indeed, the HsTBL1 N-terminal LisH domain was sufficient to repress transcription in a synthetic context in human cell culture, highlighting the conservation of this mechanism of PIC inhibition across eukaryotes. The next challenge will be to map the dynamics and mechanism by which these primed complexes are disassembled allowing transcription to progress and how the primed state is reassembled once an activating signal is removed.
Materials and methods
Cloning
Construction of TPL-APEX fusion proteins was performed by Golden Gate cloning as described in Pierre-Jerome et al. (2014). Variant and deletion constructs were created using PCR-mediated site-directed mutagenesis. Construction of the SPARC was described previously (Leydon et al., 2021). Site-directed mutagenesis primers were designed using NEBasechanger and implemented through Q5 Site-Directed Mutagenesis (Cat #E0554S; NEB). For the cytoplasmic split-ubiquitin protein-protein interaction system, bait and prey constructs were created using the plasmids pMetOYC (RRID:Addgene 105082) and pNX32 (RRID:Addgene 105083), respectively (Addgene, https://www.addgene.org/Christopher_Grefen/). Interaction between bait and prey proteins was evaluated using a modified version of the split ubiquitin technique (Asseck and Grefen, 2018). TPL interactor genes were amplified either from yeast gDNA or as cDNAs from wild-type Col-0 RNA using reverse transcriptase (SuperScript IV Reverse Transcriptase; Invitrogen) and gene-specific primers from IDT, followed by amplification with Q5 polymerase (NEB). These cDNAs were subsequently cloned into plasmids for cytoSUS using a Gibson approach (Gibson et al., 2009). The coding sequence of the genes of interest was confirmed by sequencing (Genewiz). For UAS-driven constructs, the TPLN188-IAA14 coding sequence was amplified with primers containing engineered BsaI sites and introduced into the pGII backbone with the UAS promoter and RBSC terminator (Siligato et al., 2016) using Golden Gate cloning as described previously (Leydon et al., 2021). Subsequent mutations were performed on this backbone using PCR-mediated site-directed mutagenesis (see above). Construction of C-terminal 2xFRB fusions for anchor-away was done as described (Haruki et al., 2008). For construction of the integrase target vectors, the sequence of the rescue gene was amplified by PCR from template DNA with BsaI adaptors, and assembled into an integrase target vector as previously described (Guiziou et al., 2023). For AID-TAF5 cloning, the NdC domain of AtIAA17 was fused to the N-terminus of ScTaf5 by Gibson cloning.
Proximity labeling and protein preparation
Proximity labeling was performed according to previously published protocols for proximity-dependent proteomic profiling in yeast cells by APEX2 and Alk-Ph probe (Li et al., 2020a, 2020b). The general protocol was identical to these protocols with the following adaptations starting from step 27 of the protocol after reduction and alkylation (step 26): beads with bound protein samples were washed twice with 1 ml 100 mM ammonium bicarbonate, resuspended in 200 μl 100 mM ammonium bicarbonate, and digested with sequencing grade trypsin by incubating at 37°C for 16 h. Digestion was stopped by the addition of 10% TFA to a final concentration of 1% TFA. Precipitate was removed by centrifugation and peptides were loaded onto conditioned MCX extraction cartridges (Waters). Peptides were washed with (1) 0.1% TFA and (2) 75% ACN 0.25% FA. Clean peptides were eluted with 75% ACN, 2.5% NH4OH, and dried down by vacuum centrifugation.
Mass spectrometry
Lyophilized peptide samples were resuspended in 3% ACN and 5% formic acid, and subjected to liquid chromatography coupled to tandem mass spectrometry (LC-MS/MS). Samples were loaded into a 100 μm ID × 3 cm precolumn packed with Reprosil C18 1.9 μm, 120 Å particles (Dr. Maisch). Peptides were eluted over a 100 μm ID × 30 cm analytical column packed with the same material housed in a column heater set to 50°C and separated by gradient elution of 3–28% B (A: 0.15% FA, B: ACN 80% and 0.15% FA) over 60 min and 28–45% B over 13 min at 350 nl/min delivered by an Easy1200 nLC system (Thermo Fisher Scientific) with a total 90-min method length. Peptides were online analyzed on an Orbitrap Eclipse Tribrid mass spectrometer (Thermo Fisher Scientific). Mass spectra were collected using a data-dependent acquisition method. For each cycle, a full MS scan (375–1,500 m/z, resolution 120,000, and standard 100% normalized AGC target in automatic maximum injection time mode) was followed by MS/MS scans (isolation width 1.6 Da, 30% normalized collision energy, 30,000 resolution. and standard 100% normalized AGC target in automatic maximum injection time mode) on the topmost intense precursor peaks with a 3-s cycle time between full MS scans.
Mass spectrometry data analysis
Raw files were converted to the mzXML format using MSConvert (Proteowizard) (Chambers et al., 2012), and MS/MS spectra were searched against a target/decoy protein sequence database using Comet (version 2019.01.02) (Eng et al., 2013). S. cerevisiae (orf_trans_all.fasta downloaded from the Saccharomyces Genome Database in 2016) with the four protein components of the AtARCSc (AtARF19, AtAFB2, AtTPLN188–APEX2, AtIAA14) was used as database and search parameter tolerances were chosen based on Comet recommendations for high-resolution MS1 and MS2 acquisitions (i.e., 20 ppm precursor mass tolerance, 0.02 Da fragment tolerance for MS/MS acquired). Trypsin was selected as the digestive enzyme with a maximum of two missed cleavages, fixed carbamidomethylation modification of cysteines (+57.0215 Da), and variable modifications of methionine oxidation (+15.9949 Da) and protein N-terminal acetylation (+42.0106 Da). Search results were filtered with Percolator (Käll et al., 2007) (version 3.01) to 1% false discovery rate at the peptide spectrum match level. Peptide abundance was determined using in-house quantification software to extract MS1 intensity. Protein Prophet (Nesvizhskii et al., 2003) was used to assemble peptides into protein groups and roll up peptide quantifications into protein quantifications.
Yeast methods
Standard yeast drop-out and yeast extract–peptone–dextrose plus adenine (YPAD) media were used, with care taken to use the same batch of synthetic complete (SC) media for related experiments. A standard lithium acetate protocol (Gietz and Woods, 2002) was used for the transformations of DNA. All cultures were grown at 30°C with shaking at 220 rpm. Anchor-away approaches were followed as described (Haruki et al., 2008), and anchor-away strains were obtained from EUROSCARF (euroscarf.de). Endogenous genomic fusions of GENE-FRB were designed by fusing gene homology to the pFA6a-FRB-KanMX6 plasmid for chromosomal integration into the parental Anchor Away strain, selectable through G418 resistance (G418, Geneticin; Thermo Fisher Scientific). Tup1-FRB and Cyc8-FRB were constructed as described (Leydon et al., 2021). Mediator and GTF anchor-away strains were created previously (Petrenko et al., 2017) and kindly donated by Dr. Kevin Struhl. ScSPT5 (Crickard et al., 2016) and ScSPT6 (Dronamraju et al., 2018) anchor-away yeast strains were previously published. SPARC construction was described previously (Leydon et al., 2021). For the cytoplasmic split-ubiquitin protein–protein interaction system, bait, and prey constructs were created using the plasmids pMetOYC and pNX32, respectively (Addgene, https://www.addgene.org/Christopher_Grefen/). Interaction between bait and prey proteins was evaluated using a modified version of the split ubiquitin technique (Asseck and Grefen, 2018). After 2 days of growth on control and selection plates, images were taken using a flatbed scanner (Epson America).
SPARC R-SGA
Two independent crosses of YNL3669 (MATα SPARCH1–H5[pTDH3-AtTPLH1-5-IAA14-ttACS, pRPS2-AtAFB2-ttCIT1, LEU2, pADH1-AtARF19-ttADH1, pP3(2x)-UbiVenus-ttCYC1] HO::ACT1pr-tdTomato::hphMX, can1∆::STE2pr-Sphis5 lyp1∆ his3∆1 leu2∆0 ura3∆0met15∆0) and YNL3670 (MATα SPARCTPLN188[pTDH3-AtTPLN188-IAA14-ttACS, pRPS2-AtAFB2-ttCIT1, LEU2, pADH1-AtARF19-ttADH1, pP3(2x)-UbiVenus-ttCYC1] HO::ACT1pr-tdTomato::hphMX, can1∆::STE2pr-Sphis5 lyp1∆ his3∆1 leu2∆0 ura3∆0 met15∆0) with the yeast nonessential deletion collection and a set of conditional temperature-sensitive alleles of essential genes were performed following standard SGA procedures (Tong and Boone, 2006). Final arrays were pinned in duplicate on either SD/MSG−his−leu+ 200 mg/ml G418 (untreated) or YPD supplemented with 50 mM NAA and grown for 24 h before fluorescence scanning. The Typhoon TrioVariable Mode Imager (GE Healthcare) was used to acquire Venus (488-nmlaser, 520/40BP emission filter) and tdTomato (532-nm laser, 610/30B Pemission filter) fluorescence values. For the essential temperature-sensitive mutants, all growth was conducted at 23°C until the final growth before imaging, where they were grown at 30°C. After fluorescence imaging, colony size data were acquired by individually photographing plates with a Canon PowerShotG 24.0 megapixel digital camera using Remote Capture software. Data analysis followed essentially what is described in Kainth et al. (2009), with small variations. To summarize, background-subtracted yellow fluorescent protein (Venus) and tdTomato intensities were computed for each colony from .GEL images using GenePixPro version 7.0 software. Colony size was imaged on SPimager from S&P Robotics, Inc, and size information was calculated from individual photographs SGAtools. Border colonies, small colonies (colony area < 500 pixels), and colony size information were calculated from individual photographs. Border colonies, small colonies (colony area < 500 pixels), and colonies with aberrantly low tdTomato values (bottom 0.05%) were removed before further analysis. log2(Venus/tdTomato) values were calculated and LOESS was normalized for each plate. Using the log2(Venus/tdTomato) ratio as a metric for Venus abundance has the advantage that dividing by tdTomato corrects for any colony size–dependent intensity effects. Finally, normalized log2(Venus/tdTomato) values were averaged across all replicate experiments, and a Z-score was calculated (see Online supplemental material). All analyses were performed in R.
Flow cytometry
Fluorescence measurements were taken using a Becton Dickinson (BD) special order cytometer with a 514 nm laser exciting fluorescence that is cut off at 525 nm prior to photomultiplier tube collection (BD). For validation of R-SGA strains by flow cytometry fluorescence measurements were taken using a Sony SA3800 spectral cell analyzer with 488-, 405-, and 561-nm lasers exciting fluorescence (Sony Biotechnology). Events were annotated, subset to singlet yeast using the FlowTime R package (Wright et al., 2019). A total of 10,000–20,000 events above a 400,000 FSC-H threshold (to exclude debris) were collected for each sample and data were exported as FCS 3.0 files for processing using the flowCore R software package and custom R scripts (Havens et al., 2012; Pierre-Jerome et al., 2017) (available in Github: https://github.com/achillobator/TPL-H1_Mechanism). Data from at least two independent replicates were combined and plotted in R (ggplots2).
Anchor away
3 days before running anchor-away assay, cultures were struck out onto new plates with the proper dropout selection and grown at 30°C for 2 days. Single colonies were diluted into media at ∼1 event/μl, grown overnight to ∼100 events/μl, and aliquoted into 96-well deep-well culture plates (Havens et al., 2012; Pierre-Jerome et al., 2017). Rapamycin was added to a final concentration of 1 μM and samples were analyzed over a time course and tested approximately once per hour.
CytoSUS
Diploid yeast cultures were grown overnight in CSM media with proper dropout selection. Overnight diploid yeast cultures were analyzed for OD600 with a biophotometer. All cultures were diluted to 1 OD, and following this series dilutions of 1/10, 1/100, and 1/1,000 were made for all cultures. All serial dilutions of diploid yeast cultures were plated reciprocally on all CSM selection plates in organized rows utilizing reverse pipetting to ensure uniform cultures. Plates were left open to evaporate excess liquid from cultures and incubated at 30°C. After 2 days of growth on control and selection plates, images were taken using a flatbed scanner (Epson America).
Western blot
Yeast cultures grown overnight in SC media were diluted to OD600 = 0.6 and incubated until cultures reached OD600 ∼1. Cells were harvested by centrifugation, lysed by vortexing for 5 min in the presence of 200 μl of 0.5 mm diameter acid-washed glass beads and 200 μl SUMEB buffer (1% SDS, 8 M urea, 10 mM MOPS, pH 6.8, 10 mM EDTA, 0.01% bromophenol blue, and 1 mM PMSF) per 1 OD unit of original culture. Lysates were then incubated at 65° for 10 min and cleared by centrifugation prior to electrophoresis and blotting. Blotting was performed with PVDF membranes (cat1620177; Bio-Rad). Antibodies: anti-HA-HRP (REF-12013819001, Clone 3F10; Roche/Millipore Sigma, RRID:AB_390917), anti-FLAG (F3165, Monoclonal ANTI-FLAG M2; Millipore Sigma, RRID:AB_259529), anti-FRB (ALX-215-065-1; Enzo Life Sciences; Haruki et al., 2008, RRID:AB_2051920), anti-VP16 (1-21) (sc-7545; Santa Cruz Biotechnology, RRID:AB_628443), anti-GFP (ab290; AbCam), anti-MYC (71d10, 2278S; Cell Signaling, RRID:AB_490778), and anti-PGK1 (ab113687; AbCam, RRID:AB_10861977).
Co-immunoprecipitation
Co-IP from yeast was performed using the cytoSUS strains. Cultures were grown to OD600 0.5 (∼1E7 cells/ml) using selective media, harvested, and resuspended in 200 μl extraction buffer (50 mM Tris-HCL pH 8, 100 mM NaCl, 5 mM MgCl2, 1 mM EDTA, 1mM DTT, 0.5 mM PMSF, 10% gylcerol, 0.25% NP-40) with protease inhibitors. Cells were lysed by vortexing 3 × 1 min full speed with 100 μl of 0.5 mm acid-washed glass beads, clarified by centrifugation (1 min, 1,000 rpm), and the supernatant was mixed with 1 ml IP buffer (15 mM Na2HPO4, mw 142; 150 mM NaCl, mw 58; 2% Triton X-100, 0.1% SDS, 0.5% DOC, 10 mM EDTA, and 0.02% NaN3) with protease inhibitors and incubated with 100 μl of IgG sepharose (IgG Sepharose 6 Fast Flow, GE17-0969-01; Sigma-Aldrich) at 25°C for 2 h with rotation. The beads were washed 1× with IP buffer and 2× with IP-wash buffer (50 mM NaCl, mw58; 10 mM TRIS, mw 121; 0.02% NaN3) with protease inhibitors. Protein was eluted with 50 μl of SUME (1% SDS, 8 M urea, 10 mM MOPS, pH 6.8, 10 mM EDTA) buffer +0.005% bromophenol blue by incubation at 65°C for 10 min and run on handmade 12% acrylamide SDS-PAGE gels, and western blotted accordingly.
Bimolecular florescence complementation
Agrobacterium-mediated transient transformation of N. benthamiana was performed as described (Yang et al., 2000), where saturated overnight cultures of corresponding agrobacterium strains were spun down by centrifugation, resuspended in 1 ml of MMA (10 mM MgCl2, 10 mM MES [pH 5.6], 100 µM acetosyringone), incubated at room temp with rotation for 3 h, and then concentration-normalized to an appropriate OD600 per construct before injection into leaf tissue. BiFC experiments were performed on 3-wk-old N. benthamiana plants grown at 22°C under long days (16 h light/8 h dark) on soil (Sunshine #4 mix) as per Martin et al. (2009). pSITE vectors (Martin et al., 2009) were used to generate BiFC constructs for MED21, SPT4, TPL, and TPLH8QuadA – proteins. In all cases, the combinations are N-terminal fusions of either the nEYFP or cEYFP to the cDNA of MED21 or TPL. RFP-fused Histone H2B was used as a nuclear marker (Goodin et al., 2002). Injection of Agrobacterium strains into tobacco leaves was performed as in Goodin et al. (2002), but the OD600 of the Agrobacterium culture used was adjusted to 0.5. 2 days after transfection, plant leaves were imaged using an epifluorescence microscope (model: DMI 3000B; Leica Biosystems).
CRISPRi cell line construction
The dCa9-ZIM3, dCa9-TPLN188, dCas9-HsTBL1, and sgRNAs constructs were integrated into HL-60 (RRID:CVCL_0002) cells using a lentivirus spinoculation protocol (Belliveau et al., 2023). Lentiviral vectors containing dCas9 and sgRNA were produced in HEK293 cells (RRID:CVCL_0045). sgRNAs for CD4 (5′-GAGTCTGACCACCTTACCTCT-3′) and a control non-targeting sgRNA (5′-AGGGCACCCGGTTCATACGC-3′) were cloned into pXPR plasmid. Transfected HEK293 cells were lysed to collect lentivirus and concentrated. Briefly, lentivirus was added to 1 ml cells (1 × 10⁶ cells/ml) and polybrene reagent (final concentration of 1 μg/ml) in 24-well tissue culture plates. Cells were spun at 1,000 g for 2 h at 33°C. The virus was removed and cells were placed in an incubator for 2 days prior to antibiotic selection for 6 days (dCas9: blasticidin 10 μg/ml; sgRNA constructs: puromycin 1 μg/ml).
Immunolabeling for flow cytometry
Live-cell immunofluorescence measurements of cell surface expression for CD4 were performed on a Sony SH800 Cell Sorter. All staining and washes were done with cells suspended in phosphate-buffered saline (PBS) containing 2% heat-inactivated fetal bovine serum (hiFBS) and 0.1% sodium azide, chilled on ice. For each sample, one million cells were first resuspended in 100 μL buffer containing 5 μl Fc receptor blocking solution (#422302; Biolegend) and incubated for 15 min. Cells were then spun down and resuspended in 100 μl of buffer containing fluorescently conjugated antibodies for 1 h (5 μl of each antibody per sample): APC-Cy7 Mouse Anti-Human CD4 (1:20 dilution; #557871; BD Biosciences, RRID:AB_396913), APC-Cy7 Mouse IgG1, κ isotype control (1:20 dilution; #557873; BD Biosciences, RRID:AB_396915). Following staining, the samples were washed three times by resuspending in 300 μl of fresh buffer and chilled on ice. Following the collection of flow cytometry data, .fcs files were exported and processed using the Python package FlowCytometryTools (Yurtsev and Friedman, 2015) (v. 0.5.1).
Plant growth
For A. thaliana experiments using the GAL4-UAS system (Laplaze et al., 2005), J0121 was introgressed eight times into Col-0 accession from the C24 accession and rigorously checked to ensure root growth was comparable to Col-0 before use. UAS-TPL-IAA14mED constructs were introduced to J0121 introgression lines by the floral dip method (Clough and Bent, 1998). T1 seedlings were selected on 0.5× LS (Caisson Laboratories) + 25 µg/ml Hygromycin B (Thermo Fisher Scientific) + 0.8% phytoagar (Plantmedia). Plates were stratified for 2 days, exposed to light for 6 h, and then grown in the dark for 3 days. Hygromycin-resistant seedlings were identified by their long hypocotyl, enlarged green leaves, and long roots. Transformants were transferred by hand to fresh 0.5× LS plates +0.8% Bacto agar (Thermo Fisher Scientific) and grown vertically for 14 days at 22°C. Plates were scanned on a flatbed scanner (Epson America) on day 14. slr seeds were obtained from the Arabidopsis Biological Resource Center. For integrase switch experiments, T2 plant lines harboring T-DNAs for either MED21 (med21-1, WiscDsLox461-464K13), SPT6L (spt6l-7, SAIL_59_G06), and TAF5 (taf5-4, SAIL_274_A04) were transformed with the floral dip method to generate integrase target lines and then used to introduce each integrase construct into these established target lines. For T1 selection: 120 mg of T1 seeds (∼2,000 seeds) were sterilized using 70% ethanol and 0.05% Triton X-100 and then washed using 95% ethanol. Seeds were resuspended in 0.1% agarose and spread onto 0.5X LS Bacto selection plates using 25 µg/ml of kanamycin (Millipore-Sigma) for target lines and 25 µg/ml kanamycin and 25 µg/ml hygromycin for lines with both the integrase and the target. The plates were stratified at 4°C for 48 h then light pulsed for 6 h and covered for 48 h. They were then grown for 4–5 days. To select transformants, tall seedlings with long roots, and vibrant green color were picked from the selection plate with sterilized tweezers and transferred to a new 0.5X LS Phyto agar plate for characterization.
Microscopy
Seedlings for each integrase line were grown on selective media and transplanted to Media lacking drug selection for a total of 12 days of growth. Each selected seedling was imaged at 20× magnification using an epifluorescence microscope (model: DMI 3000; Leica Biosystems) on petri plates at room temperature with a Leica HCX FL Plan 20×/0.40na objective. Images were taken for RFP, YFP, GFP, and CFP filter modules as appropriate to the strain. Images were captured with Leica Application Suite Advanced Fluorescence imaging software (version 2.6.0.7266.2; Leica). Images were cropped using Fiji (Schindelin et al., 2012) after acquisition.
Quantification and statistical analysis
All quantification and statistical analyses were performed in R and the corresponding code has been deposited into GitHub: https://github.com/achillobator/TPL-H1_Mechanism. All data distribution was assumed to be normal but this was not formally tested. For all analysis of statistical differences of plant populations, significance was determined using analysis of variance (ANOVA) with a post-hoc Tukey’s honest significance difference test.
Online supplemental material
Fig. S1 shows the identification of Physical and Genetic TPL interactors. Fig. S2 shows validation of Genetic interactors by flow cytometry. Fig. S3 shows the validation and expression of potential TPL interacting proteins. Fig. S4 shows that the SPT4/SPT5/SPT6 is functionally required by TPL for repression. Fig. S5 shows an analysis of TPL and TPL-interacting protein activity in Arabidopsis lateral root development. Table S1 shows APEX2 Mass spectrometry log2 fold enrichment values. Excel file containing additional data too large to fit in a PDF, related to Fig. 1. Table S2 shows R-SGA results for all hits with significant Z-scores. Additional data is available in Dryad relating to the quantification of Z-score. Excel file containing additional data too large to fit in a PDF, related to Fig. 2. Table S3 shows yeast strain genotype information. Excel file containing additional yeast strain data too large to fit in a PDF, related to Figs. 1, 2, 3, 4, and 5. Table S4 lists oligonucleotides used in this study.
Data availability
Data are openly available in a public repository. External Dataset: All R-SGA data and plant phenotypic data is available through a public Dryad repository: https://doi.org/10.5061/dryad.x0k6djhst. All other data are available in the published article and its online supplemental material.
Acknowledgments
We thank current and former members of the Nemhauser group including Cassandra Maranas and Dr. Sarah Guiziou for constructive discussions and comments on this manuscript; Dr. Adam Steinbrenner and Dr. Takato Imaizumi for insightful suggestions; Prof. Grant Brown for helping to lay the groundwork for this project during the 2018 yeast course at Cold Spring Harbor Labs; and Julie A. Theriot and Mathew Footer for supporting the experiments that relied on mammalian cell tissue culture. In addition, we thank Prof. Maitreya Dunham and Dr. Joe Armstrong for advice on yeast genetics and approaches; Prof. Brenda Andrews for donation of key R-SGA yeast strains; Prof. Joeseph C. Reese for donation of the SPT5 anchor away strains; Prof. Brian D. Strahl for donation of the SPT6 anchor away strains; Prof. Kevin Struhl for donation of the GTF anchor away strains; and Prof. Chen and Prof. Cui for donation of Arabidopsis SPT6L genetic constructs. We thank Daria Chrobok of DC SciArt for the creation of the graphics adapted in this work.
This work was supported by the National Institutes of Health (R01-GM107084 and R35-GM148135-01 to J.L. Nemhauser; 5K99GM147355 to N.M. Belliveau; R35-GM119536 to J. Villén), a Faculty Scholar Award from the Howard Hughes Medical Institute (to J.L. Nemhauser), and the Canadian Institutes for Health Research (FDN-159913 to G.W. Brown). G.W. Brown holds a Canada Research Chair (Tier 1). Research support for N.M. Belliveau was also provided by the Howard Hughes Medical Institute. A.R. Leydon was supported as a Simons Foundation Fellow of the Life Sciences Research Foundation.
Author contributions: A.R. Leydon: Conceptualization, Data curation, Formal analysis, Investigation, Methodology, Project administration, Resources, Software, Supervision, Validation, Visualization, Writing - original draft, Writing - review & editing, B. Downing: Data curation, Formal analysis, Investigation, Validation, Visualization, Writing - original draft, Writing - review & editing, J. Solano Sanchez: Data curation, Formal analysis, Investigation, Validation, Visualization, Writing - original draft, Writing - review & editing, R. Loll-Krippleber: Investigation, Writing - review & editing, N.M. Belliveau: Investigation, Writing - review & editing, R.A. Rodriguez-Mias: Formal analysis, Investigation, Writing - review & editing, A.J. Bauer: Investigation, Writing - review & editing, I.J. Watson: Investigation, Writing - review & editing, L. Bae: Investigation, Writing - review & editing, J. Villén: Data curation, Funding acquisition, Resources, Supervision, Writing - review & editing, G.W. Brown: Funding acquisition, Writing - review & editing, J.L. Nemhauser: Conceptualization, Data curation, Funding acquisition, Methodology, Project administration, Resources, Supervision, Visualization, Writing - review & editing.
References


