The small, tubulin-binding protein STMN2 is highly expressed in neurons and is implicated in amyotrophic lateral sclerosis. STMN2 degrades rapidly and accumulates at axotomy sites, suggesting fast turnover is crucial for its neuroprotective function. We show that STMN2 was primarily degraded by the ubiquitin–proteasome system. Its membrane-targeting N-terminal domain promoted fast turnover, whereas its tubulin-binding domain promoted stabilization. Proximity labeling and imaging showed that tubulin binding reduced STMN2 targeting to trans-Golgi network membranes. Pull-down assays showed that tubulin binds preferentially to soluble over membrane-bound STMN2. Our observations suggest that STMN2 interconverts between a soluble, tubulin-bound form and a membrane-bound, tubulin-free form, and is rapidly degraded when released from both membranes and tubulin. We propose that tubulin binding sequesters and stabilizes STMN2, while its neuroprotective function involves an unknown membrane activity.
Introduction
Stathmins are small phosphoproteins that bind to soluble tubulin through a conserved “stathmin-like domain” (SLD). Vertebrate genomes encode STMN1, STMN2 (SCG10), STMN3 (SCLIP), STMN4 (RB3), and STMND1. STMN1 consists solely of an SLD and is soluble, while the other stathmins contain an additional acetylatable N-terminal extension that directs them to endomembranes (Bièche et al., 2003; Deng et al., 2024; Di Paolo et al., 1997a; Lutjens et al., 2000; Poulain and Sobel, 2007).
Tubulin binding by SLDs has been measured biochemically and confirmed by crystallography (Jourdain et al., 1997; Curmi et al., 1997; Gigant et al., 2000; Honnappa et al., 2003; Deng et al., 2024; Steinmetz et al., 2000). In cells, STMN1 negatively regulates microtubule polymerization, which is regulated by phosphorylation (Brattsand et al., 1994; Marklund et al., 1996; Steinmetz et al., 2001; Niethammer et al., 2004). Subsequent studies generalized STMN1’s microtubule-centered functions to the entire family, neglecting the N-terminal extensions. Notably, tubulin binding by STMN2, STMN3, STMN4, and STMND1 was measured using only the SLD (Charbaut et al., 2001; Deng et al., 2024; Gigant et al., 2000). Here, we tested whether STMN2 can bind membranes and tubulin simultaneously.
TDP-43 dysfunction causes STMN2 mis-splicing and reduced protein levels in amyotrophic lateral sclerosis and frontotemporal dementia (Baughn et al., 2023; Klim et al., 2019; Melamed et al., 2019; Prudencio et al., 2020). However, the precise molecular function of STMN2 in neurons remains unknown (Di Paolo et al., 1997a; Shin et al., 2014). By analogy to STMN1, STMN2 could inhibit microtubule polymerization. Alternatively, STMN2 could influence endomembrane biology, but in that case, the purpose of binding tubulin is unclear.
The STMN2 protein is degraded with a half-life of <2 h in cultured neurons (Shin et al., 2012; Thornburg-Suresh et al., 2023), much faster than most neuronal proteins (Dörrbaum et al., 2018; Fornasiero et al., 2018). Here, we report that the N-terminal domain drives rapid turnover, while the SLD stabilizes. Pull-down assays indicated that STMN2 binds either tubulin or membranes, but not both simultaneously. We propose that the neuroprotective function of STMN2 involves membrane regulation, while tubulin binding regulates stability and location.
Results and discussion
STMN2 undergoes rapid turnover in two cellular systems
To investigate the rapid turnover of STMN2, we utilized two complementary systems: (1) cancer-derived U2OS cells engineered to express a V5-tagged STMN2 construct (based on the canonical UniProt sequence Q93045) under a doxycycline-inducible Tet-On promoter (Fig. 1 A), and (2) transcription factor–induced pluripotent stem cell (iPSC)–derived neurons (iNs) resembling cortical excitatory neurons (Busskamp et al., 2014). U2OS cells allowed rapid genetic and biochemical manipulation, while iNs allowed physiologically relevant validation. In U2OS cells, STMN2-V5 appeared as two closely migrating bands on SDS-PAGE, detected by both anti-V5 and anti-STMN2 antibodies. Immunoprecipitation of whole-cell lysates with the anti-V5 antibody followed by mass spectrometry confirmed that both bands correspond to STMN2, with the lower band representing a form lacking the membrane-binding domain (Fig. 1 C). Both bands were included in subsequent quantification. Upon doxycycline withdrawal from STMN2-V5 inducing U2OS cells, STMN2-V5 levels remained stable over several hours (Fig. 1 B). However, when doxycycline was removed and the translation inhibitor cycloheximide (CHX) was added, STMN2-V5 levels rapidly declined (Fig. 1 B). Endogenous STMN2 is absent in iPSCs but robustly induced by iN differentiation (RNA-seq data in Busskamp et al. [2014]). Turnover assays were conducted at the expression peak a few days after differentiation (Fig. 1 D and Fig. S1). CHX chase experiments in both systems revealed similar rapid turnover kinetics for STMN2, with a half-life of ∼2 h (Fig. 1, B and E), consistent with previous findings in rodent primary neurons (Shin et al., 2012; Thornburg-Suresh et al., 2023). After testing inhibitors targeting autophagosomes, H+-ATPases, proteasomes, and ubiquitination in combination with CHX, we confirmed that STMN2 is degraded primarily by the ubiquitin–proteasome system (Fig. 1, E–H). This finding is consistent with previous results obtained using MG132 (Shin et al., 2012).
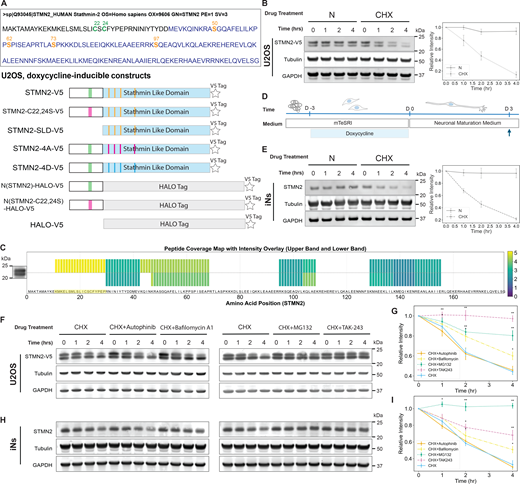
STMN2 undergoes rapid turnover in two cellular systems, primarily via the ubiquitin–proteasome pathway. (A) Design of doxycycline-inducible STMN2 constructs with a V5 tag. Top: canonical STMN2 amino acid sequence (Q93045) with the SLD in blue, palmitoylatable cysteines (C22, C24) in bold green, and phosphorylatable serines (S50, S62, S73, S97) in bold orange. Bottom: schematic of constructs. Palmitoylation sites are shown in green; abolished palmitoylation sites (C→S) are shown in muted magenta. Phosphorylation sites are indicated by vertical orange lines. Nonphosphorylatable mutants (S→A, “4A”) are in magenta; phosphomimetic mutants (S→D, “4D”) are in blue. (B) Western blot of the CHX chase assay in U2OS cells with inducible STMN2-V5 expression. Expression was induced overnight with doxycycline, and then, media were replaced with fresh or CHX-containing media (time 0). ∼35 µg of whole-cell lysate was loaded per lane. Left: STMN2 was detected with anti-V5 antibody by western blot. Right: background-subtracted band intensities were normalized to time 0 and plotted vs. chase time (n = 4, mean ± SD). (C) Peptide coverage map of STMN2 from ∼23 kDa (upper) and ∼21 kDa (lower) gel bands following V5 IP from U2OS lysates. Expression was induced for 16 h. The IP sample was separated by SDS-PAGE, and two bands at ∼21 and 23 kDa were excised and submitted for proteomics analysis. Each residue is a vertical bar; color intensity indicates normalized peptide spectral intensity (XCorr). The top and bottom rows correspond to peptides from the upper (23 kDa) and lower (21 kDa) bands, respectively. Yellow highlights the fragment absent from the 21-kDa band. (D) Timeline for stem cell–derived neuron experiments. The expression of neuronal transcription factor NGN1 was induced for 3 days with doxycycline; the CHX chase assay was performed on day 3 after plating (blue upwards arrow). (E) CHX chase assay of endogenous STMN2 in transcription factor iNs. Time 0 = CHX addition. ∼70 µg lysate was loaded per lane. Left: STMN2 was detected with homemade polyclonal rabbit anti-STMN2 antibody. Right: the intensity of STMN2 bands was measured after background subtraction, normalized to time 0 and plotted vs. chase time (n = 4, mean ± SD). (F and H) Western blot of the CHX chase assay along with 10 μM autophinib, 200 nM bafilomycin A1, 5 μM MG132, or 200 nM TAK-243 in STMN2-V5–expressing U2OS cells (F) or iNs(H). CHX-only controls (left/right) are from the same experiment and loaded twice. (G and I) Quantification of STMN2-V5 in U2OS cells (G) or endogenous STMN2 in iNs (I) from three independent replicates per drug treatment. For each experiment, band intensities were normalized to time 0 h; treatments compared with CHX-only by a t test (*P < 0.05, **P < 0.005). Error bars = SD. Source data are available for this figure: SourceData F1.
STMN2 undergoes rapid turnover in two cellular systems, primarily via the ubiquitin–proteasome pathway. (A) Design of doxycycline-inducible STMN2 constructs with a V5 tag. Top: canonical STMN2 amino acid sequence (Q93045) with the SLD in blue, palmitoylatable cysteines (C22, C24) in bold green, and phosphorylatable serines (S50, S62, S73, S97) in bold orange. Bottom: schematic of constructs. Palmitoylation sites are shown in green; abolished palmitoylation sites (C→S) are shown in muted magenta. Phosphorylation sites are indicated by vertical orange lines. Nonphosphorylatable mutants (S→A, “4A”) are in magenta; phosphomimetic mutants (S→D, “4D”) are in blue. (B) Western blot of the CHX chase assay in U2OS cells with inducible STMN2-V5 expression. Expression was induced overnight with doxycycline, and then, media were replaced with fresh or CHX-containing media (time 0). ∼35 µg of whole-cell lysate was loaded per lane. Left: STMN2 was detected with anti-V5 antibody by western blot. Right: background-subtracted band intensities were normalized to time 0 and plotted vs. chase time (n = 4, mean ± SD). (C) Peptide coverage map of STMN2 from ∼23 kDa (upper) and ∼21 kDa (lower) gel bands following V5 IP from U2OS lysates. Expression was induced for 16 h. The IP sample was separated by SDS-PAGE, and two bands at ∼21 and 23 kDa were excised and submitted for proteomics analysis. Each residue is a vertical bar; color intensity indicates normalized peptide spectral intensity (XCorr). The top and bottom rows correspond to peptides from the upper (23 kDa) and lower (21 kDa) bands, respectively. Yellow highlights the fragment absent from the 21-kDa band. (D) Timeline for stem cell–derived neuron experiments. The expression of neuronal transcription factor NGN1 was induced for 3 days with doxycycline; the CHX chase assay was performed on day 3 after plating (blue upwards arrow). (E) CHX chase assay of endogenous STMN2 in transcription factor iNs. Time 0 = CHX addition. ∼70 µg lysate was loaded per lane. Left: STMN2 was detected with homemade polyclonal rabbit anti-STMN2 antibody. Right: the intensity of STMN2 bands was measured after background subtraction, normalized to time 0 and plotted vs. chase time (n = 4, mean ± SD). (F and H) Western blot of the CHX chase assay along with 10 μM autophinib, 200 nM bafilomycin A1, 5 μM MG132, or 200 nM TAK-243 in STMN2-V5–expressing U2OS cells (F) or iNs(H). CHX-only controls (left/right) are from the same experiment and loaded twice. (G and I) Quantification of STMN2-V5 in U2OS cells (G) or endogenous STMN2 in iNs (I) from three independent replicates per drug treatment. For each experiment, band intensities were normalized to time 0 h; treatments compared with CHX-only by a t test (*P < 0.05, **P < 0.005). Error bars = SD. Source data are available for this figure: SourceData F1.
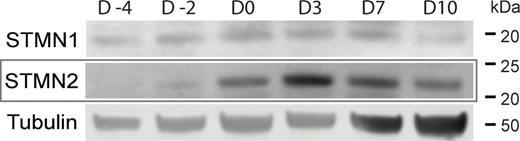
Expression of STMN2 peaked on the third day after plating. Cells were induced as described inFig. 1 D . The day when the induced human iPSCs were plated in neuronal maturation medium, was designated Day 0 (D0). Four days prior to plating (D −4) corresponds to the pre-doxycycline condition, while 2 days prior (D −2) corresponds to the doxycycline induction phase. Cell lysates were collected for up to 10 days after plating. Source data are available for this figure: SourceData FS1.
Expression of STMN2 peaked on the third day after plating. Cells were induced as described inFig. 1 D . The day when the induced human iPSCs were plated in neuronal maturation medium, was designated Day 0 (D0). Four days prior to plating (D −4) corresponds to the pre-doxycycline condition, while 2 days prior (D −2) corresponds to the doxycycline induction phase. Cell lysates were collected for up to 10 days after plating. Source data are available for this figure: SourceData FS1.
The membrane-targeting domain of STMN2 drives rapid turnover, but is largely independent of membrane binding
STMN2 is targeted to membranes via a short, doubly palmitoylated N-terminal domain (Summers et al., 2018). To investigate the role of this domain in rapid turnover, we engineered U2OS cell lines to inducibly express two mutants: STMN2-C22,24S (no palmitoylation) and SLD alone (no membrane targeting) (Fig. 1 A). Both constructs localized exclusively to the soluble fraction after cell lysis and sedimentation of organelles (Fig. 3 A). Both soluble constructs displayed a single band on the western blots (Fig. 2 B). The STMN2-SLD construct exhibited no detectable degradation during the CHX assay (Fig. 2 B) and showed higher steady-state levels compared with both wild-type STMN2 and STMN2-22, 24S (Fig. 2, B i and ii). Despite its soluble state, STMN2-C22,24S mutant degraded at a rate similar to that of the wild-type STMN2 (Fig. 2 B). These findings indicate that the N-terminal domain promotes rapid turnover, but membrane targeting is not required.
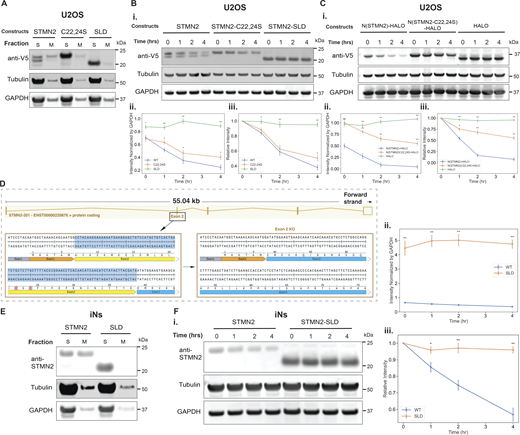
Membrane-binding domain of STMN2 is necessary and sufficient for rapid turnover. (A) Soluble/membrane protein fractionation in U2OS cells expressing WT STMN2-V5, STMN2-C22,24S-V5, or STMN2-SLD-V5. The expression of the proteins was induced overnight with doxycycline. Whole-cell lysates were collected by hypotonic shock in low-salt buffer, followed by mechanical disruption via passage through a syringe. Nuclei were removed by low-speed centrifugation. Soluble proteins (S) and membrane proteins (M) were separated by high-speed centrifugation. (B) CHX chase assay of wild-type STMN2-V5, STMN2-C22, 24S-V5, and STMN2-SLD-V5. (i) Western blot; (ii) raw band intensities of STMN2 constructs normalized to GAPDH, plotted against chase time; (iii) relative band intensities normalized to time 0 h, plotted against chase times. At each time point, mutants were compared with wild-type STMN2-V5 by a t test (*P < 0.05, **P < 0.005; n = 3; mean ± SD). (C) CHX chase of N(STMN2)-HALO-V5, N(STMN2-C22,24S)-HALO-V5, and HALO-V5. (i), Western blots; (ii), GAPDH-normalized raw intensities; (iii), relative intensities normalized to t = 0. Comparisons with N(STMN2)-HALO-V5 by a t test (*P < 0.05, **P < 0.005; n = 3; mean ± SD). (D) CRISPR knock-out scheme for generating a truncated version of STMN2 in iPSCs. Exon 2 of the STMN2 gene was deleted using two sgRNAs that target the flanking regions of exon 2. The resulting open reading frame lacks exon 2 (yellow), which removes most of the N-terminal extension, including palmitoylatable cysteines required for membrane binding. (E) Soluble/membrane protein fractions of iNs expressing wild-type STMN2 or truncated STMN2 (SLD). (F) CHX chase assay on wild-type iNs or iNs expressing STMN2-SLD. (i) Western blot; (ii) GAPDH-normalized raw intensities; (iii) relative intensities, normalized to time 0 h. At each time point, the STMN2-SLD groups were compared with WT-STMN2 by a t test (*P < 0.05, **P < 0.005; n = 3; mean ± SD). Source data are available for this figure: SourceData F2.
Membrane-binding domain of STMN2 is necessary and sufficient for rapid turnover. (A) Soluble/membrane protein fractionation in U2OS cells expressing WT STMN2-V5, STMN2-C22,24S-V5, or STMN2-SLD-V5. The expression of the proteins was induced overnight with doxycycline. Whole-cell lysates were collected by hypotonic shock in low-salt buffer, followed by mechanical disruption via passage through a syringe. Nuclei were removed by low-speed centrifugation. Soluble proteins (S) and membrane proteins (M) were separated by high-speed centrifugation. (B) CHX chase assay of wild-type STMN2-V5, STMN2-C22, 24S-V5, and STMN2-SLD-V5. (i) Western blot; (ii) raw band intensities of STMN2 constructs normalized to GAPDH, plotted against chase time; (iii) relative band intensities normalized to time 0 h, plotted against chase times. At each time point, mutants were compared with wild-type STMN2-V5 by a t test (*P < 0.05, **P < 0.005; n = 3; mean ± SD). (C) CHX chase of N(STMN2)-HALO-V5, N(STMN2-C22,24S)-HALO-V5, and HALO-V5. (i), Western blots; (ii), GAPDH-normalized raw intensities; (iii), relative intensities normalized to t = 0. Comparisons with N(STMN2)-HALO-V5 by a t test (*P < 0.05, **P < 0.005; n = 3; mean ± SD). (D) CRISPR knock-out scheme for generating a truncated version of STMN2 in iPSCs. Exon 2 of the STMN2 gene was deleted using two sgRNAs that target the flanking regions of exon 2. The resulting open reading frame lacks exon 2 (yellow), which removes most of the N-terminal extension, including palmitoylatable cysteines required for membrane binding. (E) Soluble/membrane protein fractions of iNs expressing wild-type STMN2 or truncated STMN2 (SLD). (F) CHX chase assay on wild-type iNs or iNs expressing STMN2-SLD. (i) Western blot; (ii) GAPDH-normalized raw intensities; (iii) relative intensities, normalized to time 0 h. At each time point, the STMN2-SLD groups were compared with WT-STMN2 by a t test (*P < 0.05, **P < 0.005; n = 3; mean ± SD). Source data are available for this figure: SourceData F2.
To determine whether the N-terminal domain alone promotes rapid turnover, we fused it to a HALO tag, a folded domain that does not bind tubulin (N(STMN2)-HALO) (Fig. 1 A). We also expressed a HALO fusion protein to the N-terminal domain of the STMN2-C22,24S mutant (N(STMN2-C22,24S)-HALO) (Fig. 1 A). HALO tag alone was stable during CHX treatment (Fig. 2 C). In contrast, N(STMN2)-HALO degraded rapidly, with a half-life of ∼1 h (Fig. 2, C i and iii). The N(STMN2-C22,24S)-HALO fusion degraded significantly more slowly than the wild-type N(STMN2)-HALO (Fig. 2, C i and iii), starting from a markedly higher steady-state level (Fig. 2, C i and ii), but still underwent degradation, albeit at a reduced rate (half-life ∼4 h). These findings indicate that the N-terminal domain drives STMN2 turnover, with palmitoylation accelerating turnover but not being strictly required. The comparable degradation rates of wild-type STMN2 and STMN2-C22,24S mutant, versus the faster degradation of N(STMN2)-HALO compared with N(STMN2-C22,24S)-HALO, suggest that the SLD slows turnover, perhaps by binding tubulin.
To investigate the role of the N-terminal domain of wild-type STMN2 expressed at endogenous levels in iNs, we used the CRISPR technique to delete exon 2 of the STMN2 gene in iPSCs, generating a truncated STMN2 variant that retains only the SLD while remaining under the control of the endogenous promoter (Fig. 2 D). When separating soluble and membrane proteins of iNs expressing either wild-type or truncated STMN2, the wild-type STMN2 localized to both the soluble and the membrane fractions, whereas the truncated STMN2 was found exclusively in the soluble fraction (Fig. 2 E). The truncated STMN2 exhibited an expression level approximately five times that of the wild type (Fig. 2, F i and ii). A 4-h CHX chase assay revealed no detectable turnover of truncated STMN2, in stark contrast to the rapid turnover observed with wild-type STMN2 (Fig. 2 F). These findings confirm that the N-terminal domain is critical for promoting the rapid turnover of STMN2 in neurons.
Certain observations pointed to additional STMN2 degradation mechanisms. When the panel of inhibitors used in Fig. 1, F–I was applied to N(STMN2)-HALO-V5 (Fig. 1 A and Fig. S2), its turnover, which was significantly faster than that of full-length STMN2, was only slightly slowed down by bafilomycin, MG132, and TAK-243 (Fig. S2). This suggests that the SLD inhibits STMN2 degradation and the N-terminal domain engages additional, noncanonical turnover pathways.

N(STMN2)-HALO’s fast turnover is unaffected by degradation pathway inhibitors. (A) Western blot of the CHX chase assay along with 10 μM autophinib, 200 nM bafilomycin A1, 5 μM MG132, or 200 nM TAK-243 in N(STMN2)-HALO-V5–expressing U2OS cells. The CHX-only condition samples shown on the left and right panels are from the same experiment and were loaded twice as controls for the western blot. (B) Quantification of N(STMN2)-HALO band intensities (n = 3 independent replicates) normalized to 0-h time point. Treatment groups were compared with CHX-only by a t test (*P < 0.05, P < 0.005). Error bars = SD. Source data are available for this figure: SourceData FS2.
N(STMN2)-HALO’s fast turnover is unaffected by degradation pathway inhibitors. (A) Western blot of the CHX chase assay along with 10 μM autophinib, 200 nM bafilomycin A1, 5 μM MG132, or 200 nM TAK-243 in N(STMN2)-HALO-V5–expressing U2OS cells. The CHX-only condition samples shown on the left and right panels are from the same experiment and were loaded twice as controls for the western blot. (B) Quantification of N(STMN2)-HALO band intensities (n = 3 independent replicates) normalized to 0-h time point. Treatment groups were compared with CHX-only by a t test (*P < 0.05, P < 0.005). Error bars = SD. Source data are available for this figure: SourceData FS2.
Tubulin binding slows STMN2 turnover
We next asked whether tubulin binding regulates STMN2 turnover. To modulate the level of soluble tubulin within a physiological range, we applied a drug strategy reported previously (Deng et al., 2024). A microtubule-depolymerizing drug (combretastatin A4, CA4) was used to increase soluble tubulin, and a stabilizing drug (paclitaxel, PTX) was used to decrease it. The SLD is known to bind effectively to tubulin whose colchicine sites are occupied by drugs such as CA4 (Jourdain et al., 1997; Ravelli et al., 2004). We then measured STMN2 turnover rate in U2OS cells and iNs under microtubule drug treatment. CA4 significantly slowed the turnover of STMN2 in both cell types, whereas PTX accelerated it (Fig. 3, A and C). These observations show that tubulin binding stabilizes STMN2.
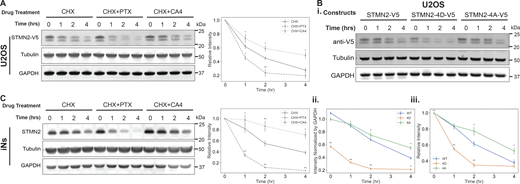
Tubulin binding slows STMN2 turnover. (A) Degradation of induced STMN2 in the U2OS cell line was influenced by microtubule-stabilizing and depolymerizing drugs. After induced expression of STMN2-V5, microtubule-stabilizing (PTX) or depolymerizing (combretastatin A4, CA4) drugs were added alongside CHX to evaluate their effect on STMN2 degradation. Relative band intensities were normalized to the 0-h time point and plotted over chase time. *P < 0.05, **P < 0.005 vs CHX-only by a t test (n = 4; mean ± SD). (B) CHX chase assay of wild-type STMN2-V5, phosphomimetic aspartate mutant (STMN2-4D-V5), and nonphosphorylatable mutant (STMN2-4A-V5). (i) Western blot; (ii) GAPDH-normalized raw intensities of STMN2 mutants; (iii) relative intensities normalized to time 0 h and compared with wild type at each time point by a t test (*P < 0.05, **P < 0.005; n = 3; mean ± SD). (C) CHX chase in iNs with PTX or CA4 added alongside CHX to alter soluble tubulin levels. Relative intensities were normalized to 0 h and compared with CHX-only by a t test (*P < 0.05, **P < 0.005; n = 4; mean ± SD). Source data are available for this figure: SourceData F3.
Tubulin binding slows STMN2 turnover. (A) Degradation of induced STMN2 in the U2OS cell line was influenced by microtubule-stabilizing and depolymerizing drugs. After induced expression of STMN2-V5, microtubule-stabilizing (PTX) or depolymerizing (combretastatin A4, CA4) drugs were added alongside CHX to evaluate their effect on STMN2 degradation. Relative band intensities were normalized to the 0-h time point and plotted over chase time. *P < 0.05, **P < 0.005 vs CHX-only by a t test (n = 4; mean ± SD). (B) CHX chase assay of wild-type STMN2-V5, phosphomimetic aspartate mutant (STMN2-4D-V5), and nonphosphorylatable mutant (STMN2-4A-V5). (i) Western blot; (ii) GAPDH-normalized raw intensities of STMN2 mutants; (iii) relative intensities normalized to time 0 h and compared with wild type at each time point by a t test (*P < 0.05, **P < 0.005; n = 3; mean ± SD). (C) CHX chase in iNs with PTX or CA4 added alongside CHX to alter soluble tubulin levels. Relative intensities were normalized to 0 h and compared with CHX-only by a t test (*P < 0.05, **P < 0.005; n = 4; mean ± SD). Source data are available for this figure: SourceData F3.
We next modulated tubulin binding by mutating the key phosphorylation sites in STMN2. Phosphorylation on the conserved serine residues negatively regulates STMN2’s interaction with tubulin, and tubulin-binding affinity can be experimentally modulated using serine (S) to alanine (A) or aspartate (D) mutations (Antonsson et al., 1998; Chang et al., 2003; Tararuk et al., 2006; Westerlund et al., 2011). We generated two STMN2 constructs, mutating S50, S62, S73, and S97 to either alanine or aspartate residues (referred to as 4A and 4D mutants, respectively, Fig. 1 A). The 4A mutant exhibits increased tubulin-binding affinity, whereas the 4D mutant shows reduced affinity. When expressed in U2OS cells, the 4D mutant was present at a significantly lower concentration in whole-cell lysate, at ∼60% of the level of wild type or 4A (Fig. 3, B i and ii). Additionally, the 4D mutant showed a faster turnover rate (half-life ∼1 h; Fig. 3, B i and iii) compared with both wild type and the 4A mutant. In contrast, the 4A mutant exhibited expression level similar to that of wild-type STMN2 but displayed a slower turnover rate. These data agree with the microtubule drug experiment in showing that tubulin binding slows STMN2 turnover.
Tubulin prefers to bind to soluble over membrane-bound STMN2
A key conceptual question for STMN2 regulation and function is whether tubulin binding and membrane binding can occur simultaneously. To address this question, we developed a pull-down assay to directly compare tubulin binding to soluble versus membrane-bound STMN2. U2OS cells with or without the expression of STMN2 construct were subjected to hypotonic lysis without detergent and separated into cytosol and membrane fractions by centrifugation. To preserve weak protein interactions, some samples were treated with zero-length cross-linker 1-ethyl-3-(3-dimethylaminopropyl)carbodiimide (EDC) prior to immunoprecipitation. This reagent was previously shown to efficiently cross-link STMN1 to tubulin (Curmi et al., 1997; Steinmetz et al., 2000). Immunoprecipitation was performed via targeting V5 tags. Inspection of gels revealed substantially more tubulin coprecipitating with STMN2 from the cytosol fraction compared with the membrane fraction (Fig 4 A; and Fig. 4, B i and D i, left; Fig. 4, B iii and D iii), along with more STMN2 proteins in the complex (above 50 kDa) in the soluble fractions (Fig 4 C; and Fig. 4, B i and D i, right). After normalizing to the tubulin present in the pull-down following cross-linking, the amount of STMN2 bound to tubulin was, on average, threefold higher in the soluble fraction than in the membrane-bound fraction (Fig. S3).
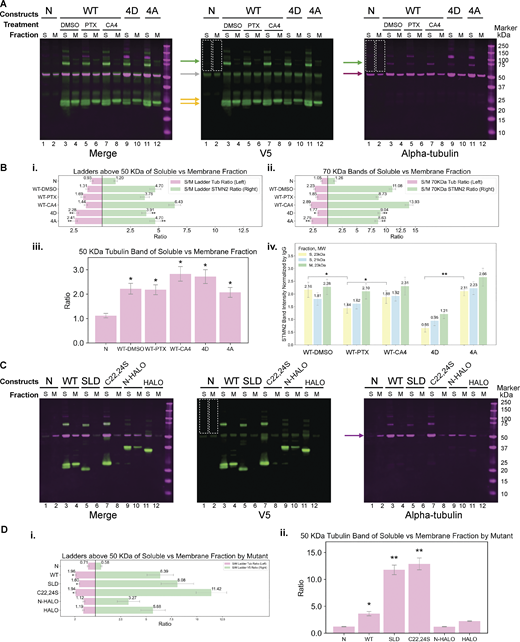
Tubulin preferentially binds to soluble over membrane-bound STMN2. Whole-cell lysates from the indicated STMN2 mutants or treatments were fractionated into soluble (S) and membrane-bound (M) components, as described in Fig. 2. For each immunoprecipitation, ∼120 μg of total input protein was used. Tubulin (final concentration 5 μM) was added to each sample, followed by cross-linking using EDC. One third of each immunoprecipitation product was loaded per lane. Western blots were probed with antibodies against STMN2 or V5 tag (green), and α-tubulin (red). S, soluble fraction; M, membrane fraction. (A) From left to right, U2OS cells without STMN2-V5 expression (lanes 1 and 2). U2OS cells expressing STMN2-V5 after 16 h of induction, treated with 0.1% DMSO for 2 h (lanes 3 and 4). U2OS cells expressing STMN2-V5 after 16 h of induction, treated with 1 μM PTX for 2 h (lanes 5 and 6). U2OS cells expressing STMN2-V5 after 16 h of induction, treated with 300 nM CA4 for 2 h (lanes 7 and 8). U2OS cells expressing STMN2-4D-V5 (lanes 9 and 10) or STMN2-4A-V5 (lanes 11 and 12) after 16 h of induction. (B) Quantification of soluble vs membrane fractions of MT drug–treated WT STMN2 and STMN2 phosphorylation mutants. Data were collected from three independent replicates, with background subtraction prior to ratio calculation for all analysis. MT drug–treated STMN2-V5 (WT), STMN2-4D-V5 (4D), and STMN2-4A-V5 (4A) were compared with the noninduced sample (N) using t tests. Additional comparisons and statistical tests are specified within each plot. *P < 0.05, **P < 0.005. Error bars = SD. (i) Ladder-like region above 50 kDa in both the soluble and membrane fractions (highlighted by white dotted boxes in A) was analyzed; ratios of soluble/membrane signal intensities calculated per channel. Tubulin (magenta, left) and STMN2 (green, right) comparisons shown. (ii) 70 kDa bands (green arrows in A) were analyzed; soluble/membrane ratios were plotted as above. (iii) 50 kDa tubulin bands (magenta arrow in A) were analyzed; soluble/membrane ratios were plotted. (iv) Lower molecular weight STMN2 bands (yellow arrows in A) were analyzed; raw intensities were normalized to the IgG signal of each sample (gray arrow in A). (C) U2OS cells without any induced expression (lanes 1 and 2). U2OS cells expressing STMN2-V5 (lanes 3 and 4), STMN2-SLD-V5 (lanes 5 and 6), STMN2-C22, 24S-V5 (lanes 7 and 8), N (STMN2)-HALO-V5 (lanes 9 and 10), or HALO-V5 (lanes 11 and 12) after 16 h of induction. (D) Quantification of soluble vs membrane fractions for STMN2 mutants. Data are from three independent replicates with background subtraction before ratio calculations. STMN2-V5 (WT), STMN2-SLD-V5, STMN2(C22,24S)-V5, and N(STMN2)-V5 were compared with HALO-V5 by a t test. *P < 0.05, **P < 0.005. Error bars = SD. (i) Ladder-like region above 50 kDa (white dotted boxes in C) was analyzed as in B(i). (ii) 50 kDa tubulin bands (magenta arrow in C) were analyzed; soluble/membrane ratios were plotted. Source data are available for this figure: SourceData F4.
Tubulin preferentially binds to soluble over membrane-bound STMN2. Whole-cell lysates from the indicated STMN2 mutants or treatments were fractionated into soluble (S) and membrane-bound (M) components, as described in Fig. 2. For each immunoprecipitation, ∼120 μg of total input protein was used. Tubulin (final concentration 5 μM) was added to each sample, followed by cross-linking using EDC. One third of each immunoprecipitation product was loaded per lane. Western blots were probed with antibodies against STMN2 or V5 tag (green), and α-tubulin (red). S, soluble fraction; M, membrane fraction. (A) From left to right, U2OS cells without STMN2-V5 expression (lanes 1 and 2). U2OS cells expressing STMN2-V5 after 16 h of induction, treated with 0.1% DMSO for 2 h (lanes 3 and 4). U2OS cells expressing STMN2-V5 after 16 h of induction, treated with 1 μM PTX for 2 h (lanes 5 and 6). U2OS cells expressing STMN2-V5 after 16 h of induction, treated with 300 nM CA4 for 2 h (lanes 7 and 8). U2OS cells expressing STMN2-4D-V5 (lanes 9 and 10) or STMN2-4A-V5 (lanes 11 and 12) after 16 h of induction. (B) Quantification of soluble vs membrane fractions of MT drug–treated WT STMN2 and STMN2 phosphorylation mutants. Data were collected from three independent replicates, with background subtraction prior to ratio calculation for all analysis. MT drug–treated STMN2-V5 (WT), STMN2-4D-V5 (4D), and STMN2-4A-V5 (4A) were compared with the noninduced sample (N) using t tests. Additional comparisons and statistical tests are specified within each plot. *P < 0.05, **P < 0.005. Error bars = SD. (i) Ladder-like region above 50 kDa in both the soluble and membrane fractions (highlighted by white dotted boxes in A) was analyzed; ratios of soluble/membrane signal intensities calculated per channel. Tubulin (magenta, left) and STMN2 (green, right) comparisons shown. (ii) 70 kDa bands (green arrows in A) were analyzed; soluble/membrane ratios were plotted as above. (iii) 50 kDa tubulin bands (magenta arrow in A) were analyzed; soluble/membrane ratios were plotted. (iv) Lower molecular weight STMN2 bands (yellow arrows in A) were analyzed; raw intensities were normalized to the IgG signal of each sample (gray arrow in A). (C) U2OS cells without any induced expression (lanes 1 and 2). U2OS cells expressing STMN2-V5 (lanes 3 and 4), STMN2-SLD-V5 (lanes 5 and 6), STMN2-C22, 24S-V5 (lanes 7 and 8), N (STMN2)-HALO-V5 (lanes 9 and 10), or HALO-V5 (lanes 11 and 12) after 16 h of induction. (D) Quantification of soluble vs membrane fractions for STMN2 mutants. Data are from three independent replicates with background subtraction before ratio calculations. STMN2-V5 (WT), STMN2-SLD-V5, STMN2(C22,24S)-V5, and N(STMN2)-V5 were compared with HALO-V5 by a t test. *P < 0.05, **P < 0.005. Error bars = SD. (i) Ladder-like region above 50 kDa (white dotted boxes in C) was analyzed as in B(i). (ii) 50 kDa tubulin bands (magenta arrow in C) were analyzed; soluble/membrane ratios were plotted. Source data are available for this figure: SourceData F4.
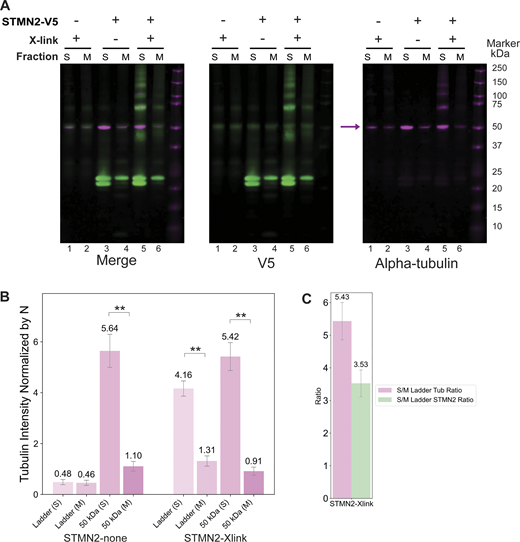
Establishment of the tubulin–STMN2 cross-linking co-immunoprecipitation method. (A) Western blot of V5 immunoprecipitation of U2OS cells with or without STMN2-V5 expression. The membrane is blotted using antibody against STMN2 (green) and antibody against alpha-tubulin (magenta). The cell lysate was prepared as described in Fig. 2. Approximately 350 μg of total input protein was used for each immunoprecipitation sample. Tubulin (final concentration 5 μM) was added to each sample, followed by cross-linking using EDC or not. One third of each immunoprecipitation product was loaded per lane. From left to right, U2OS cells without STMN2-V5 expression, cross-linked before immunoprecipitation (lane 1, soluble fraction, S; lane 2, membrane fraction, M). U2OS cells expressing STMN2-V5, no cross-linking before immunoprecipitation (lane 3, soluble fraction, S; lane 4, membrane fraction, M). U2OS cells expressing STMN2-V5, cross-linked before immunoprecipitation (lane 5, soluble fraction, S; lane 6, membrane fraction, M). (B) Tubulin intensity normalized to U2OS samples lacking STMN2-V5. Ladder areas are marked by white dotted boxes in A; the 50 kDa band is indicated by a red arrow. Background was subtracted before normalization. Data are the mean ± SD from three independent replicates. *P < 0.05, P < 0.005. (C) Ladder-like region above 50 kDa in soluble and membrane fractions of STMN2-V5–expressing U2OS cells (cross-linked before immunoprecipitation) was analyzed. Ratios of raw signal intensities (soluble/membrane) were calculated for each channel. Tubulin (magenta) is shown on the left; STMN2 (green) on the right. Data are the mean ± SD from three independent replicates. Source data are available for this figure: SourceData FS3.
Establishment of the tubulin–STMN2 cross-linking co-immunoprecipitation method. (A) Western blot of V5 immunoprecipitation of U2OS cells with or without STMN2-V5 expression. The membrane is blotted using antibody against STMN2 (green) and antibody against alpha-tubulin (magenta). The cell lysate was prepared as described in Fig. 2. Approximately 350 μg of total input protein was used for each immunoprecipitation sample. Tubulin (final concentration 5 μM) was added to each sample, followed by cross-linking using EDC or not. One third of each immunoprecipitation product was loaded per lane. From left to right, U2OS cells without STMN2-V5 expression, cross-linked before immunoprecipitation (lane 1, soluble fraction, S; lane 2, membrane fraction, M). U2OS cells expressing STMN2-V5, no cross-linking before immunoprecipitation (lane 3, soluble fraction, S; lane 4, membrane fraction, M). U2OS cells expressing STMN2-V5, cross-linked before immunoprecipitation (lane 5, soluble fraction, S; lane 6, membrane fraction, M). (B) Tubulin intensity normalized to U2OS samples lacking STMN2-V5. Ladder areas are marked by white dotted boxes in A; the 50 kDa band is indicated by a red arrow. Background was subtracted before normalization. Data are the mean ± SD from three independent replicates. *P < 0.05, P < 0.005. (C) Ladder-like region above 50 kDa in soluble and membrane fractions of STMN2-V5–expressing U2OS cells (cross-linked before immunoprecipitation) was analyzed. Ratios of raw signal intensities (soluble/membrane) were calculated for each channel. Tubulin (magenta) is shown on the left; STMN2 (green) on the right. Data are the mean ± SD from three independent replicates. Source data are available for this figure: SourceData FS3.
Constructs containing the SLD domain (WT, 4D, 4A, SLD, C22,24S) all exhibited a prominent band at ∼70 kDa in their soluble fractions, detected by both STMN2/V5 and tubulin antibodies. This band corresponds to the expected molecular weight of one SLD-containing STMN2 protein cross-linked to one tubulin molecule (Fig. 4, A, B ii, and C). Notably, this band was absent in the N(STMN2)-HALO-V5 and HALO-V5 constructs (Fig. 4 C). Higher molecular weight bands positive for both STMN2/V5 and tubulin were also observed (Fig. 4, A and C). These results are consistent with the previously reported STMN1–tubulin cross-linking experiments (Curmi et al., 1997; Steinmetz et al., 2000), which also identified bands at 70 kDa and above. Higher molecular weight bands in the EDC-treated samples presumably correspond to varying degrees of cross-linking of the 1:2:2 complex between stathmin and tubulin. In contrast, minimal tubulin cross-linking was observed in the membrane fraction (Fig. 4, A and C). Additionally, more free tubulin was coprecipitated from the soluble fraction than from the membrane fraction for SLD-containing constructs (Fig. 4, B iii and D iii), whereas the N(STMN2)-HALO-V5 and HALO-V5 constructs did not show this difference (Fig. 4 D iii).
Notably, STMN2-V5 in PTX-treated samples exhibited a banding pattern similar to that of STMN2-4D-V5 (Fig. 4 B iv), with both showing markedly weaker 70 and 23 kDa bands in their soluble fractions compared with wild-type STMN2 or STMN2-4A-V5 (Fig. 4, A and B iv). Consistent with previous observations (Fig. 3 B), less STMN2-4D-V5 was immunoprecipitated from the same input amount of protein (∼120 μg).
Tubulin binding and trans-Golgi network association of STMN2 are inversely correlated
We next used proximity labeling proteomics to identify cellular membranes, which recruit STMN2, and to determine whether membrane recruitment is influenced by tubulin binding. We transfected U2OS cells with an inducible STMN2-APEX2 expression cassette and utilized the CRISPR technique to knock-in an APEX2 tag at the C terminus of the STMN2 gene in iPSCs. APEX2 oxidizes biotin probes into short-lived reactive radicals that covalently label nearby amino acids, enabling proteomics identification of proteins in proximity to the APEX2-tagged bait protein (Hung et al., 2014; Rhee et al., 2013). The overall profile of proteins labeled by STMN2-APEX2 in U2OS cells and iNs was similar, although the labeling in iNs was less pronounced, likely due to the lower expression levels. Proximity labeling identified cell adhesion proteins, proteasomes, early endosomes, and lysosomes as prominent interactors (Fig. 5, A and B).

Tubulin binding and TGN association of STMN2 are inversely correlated. (A) Enrichment gene ontology plot of proximity proteomics in U2OS cells expressing STMN2-APEX2. STMN2-APEX2 was induced for 16 h prior to the proximity labeling procedure. The dot size represents the percentage of genes detected within specific cellular components; the dot color indicates the statistical significance of the enrichment. The gene set used is “GO Cellular Component 2018.” (B) Enrichment gene ontology plot of proximity proteomics of STMN2-APEX2–expressing iNs. D3 iNs were used for this experiment. (C) Volcano plots showing statistical significance versus protein enrichment in U2OS cells expressing STMN2-APEX2 and treated with CA4 versus PTX. The P values (unpaired Student’s t tests) for 3786 quantified proteins were plotted against the TMT. The green dots signify the proteins more enriched in CA4-treated samples, while the magenta dots indicate the proteins more enriched in PTX-treated samples; gray dots indicate proteins with no significant changes. (D) Gene ontology annotation of the increased (magenta) and decreased (green) genes upon PTX treatment. (E) U2OS cells expressing STMN2-mCherry (magenta) with TGOLN2-EGFP, Rab5C-EGFP, or Rab11b-EGFP (green). STMN2-mCherry expression was induced for 5 h before live imaging. The areas within the dotted squares are shown in a 10× enlarged view. Colocalization between STMN2 and TGOLN2/Rab5C/Rab11b was quantified using Pearson’s correlation from 50 images each; coefficients for pixels above background are shown in the plots. (F) Immunofluorescence of iNs stained for STMN2 (magenta), TGOLN2 (green), and Rab5 (green). Insets (dotted squares) show 1.5× magnified regions. Colocalization between STMN2 and TGOLN2/Rab5 was quantified as in E. (G) Proposed model of STMN2’s fast turnover. STMN2 interconverts between a tubulin-free, membrane-bound form and a tubulin-bound, soluble form. The binding partners of membrane-bound STMN2 are unknown. Upon losing bound tubulin, soluble STMN2 is rapidly ubiquitinated and degraded. STMN2’s poorly understood neuroprotective function possibly depends on some unknown molecular activity of the membrane-bound form. The structure of STMN2 is based on AF-Q93045-F1-V4 from AlphaFold. The palmitoylation state of tubulin-bound STMN2 is not considered.
Tubulin binding and TGN association of STMN2 are inversely correlated. (A) Enrichment gene ontology plot of proximity proteomics in U2OS cells expressing STMN2-APEX2. STMN2-APEX2 was induced for 16 h prior to the proximity labeling procedure. The dot size represents the percentage of genes detected within specific cellular components; the dot color indicates the statistical significance of the enrichment. The gene set used is “GO Cellular Component 2018.” (B) Enrichment gene ontology plot of proximity proteomics of STMN2-APEX2–expressing iNs. D3 iNs were used for this experiment. (C) Volcano plots showing statistical significance versus protein enrichment in U2OS cells expressing STMN2-APEX2 and treated with CA4 versus PTX. The P values (unpaired Student’s t tests) for 3786 quantified proteins were plotted against the TMT. The green dots signify the proteins more enriched in CA4-treated samples, while the magenta dots indicate the proteins more enriched in PTX-treated samples; gray dots indicate proteins with no significant changes. (D) Gene ontology annotation of the increased (magenta) and decreased (green) genes upon PTX treatment. (E) U2OS cells expressing STMN2-mCherry (magenta) with TGOLN2-EGFP, Rab5C-EGFP, or Rab11b-EGFP (green). STMN2-mCherry expression was induced for 5 h before live imaging. The areas within the dotted squares are shown in a 10× enlarged view. Colocalization between STMN2 and TGOLN2/Rab5C/Rab11b was quantified using Pearson’s correlation from 50 images each; coefficients for pixels above background are shown in the plots. (F) Immunofluorescence of iNs stained for STMN2 (magenta), TGOLN2 (green), and Rab5 (green). Insets (dotted squares) show 1.5× magnified regions. Colocalization between STMN2 and TGOLN2/Rab5 was quantified as in E. (G) Proposed model of STMN2’s fast turnover. STMN2 interconverts between a tubulin-free, membrane-bound form and a tubulin-bound, soluble form. The binding partners of membrane-bound STMN2 are unknown. Upon losing bound tubulin, soluble STMN2 is rapidly ubiquitinated and degraded. STMN2’s poorly understood neuroprotective function possibly depends on some unknown molecular activity of the membrane-bound form. The structure of STMN2 is based on AF-Q93045-F1-V4 from AlphaFold. The palmitoylation state of tubulin-bound STMN2 is not considered.
Molecular perturbation enables the prioritization proteins of interest in proximity proteomics. To assess the effect of tubulin binding, we compared interactors in U2OS cells with or without microtubule drugs (Fig. 5 A). PTX significantly increased the labeling of Golgi apparatus proteins, particularly those in the trans-Golgi network (TGN) (Fig. 5, C and D). In contrast, treatment with CA4 had the opposite effect (Fig. 5, C and D). These data suggest that tubulin binding and TGN association of STMN2 are mutually exclusive in living cells.
STMN2 was previously shown to localize to the Golgi apparatus in neurons (Chauvin et al., 2008; Di Paolo et al., 1997b; Lutjens et al., 2000), a finding supported by our tubulin-regulated proximity data. To validate the signals of other membrane proteins identified by proximity labeling, we generated U2OS cell lines co-expressing STMN2-mScarlet and three EGFP-tagged hits from the proximity proteomics dataset, which are also well-established compartment markers: Rab5C-EGFP (early endosomes), Rab11b-EGFP (recycling endosomes), and TGOLN2-EGFP (TGN). Live-cell imaging revealed that STMN2 exhibited partial colocalization observed with Rab5C (Pearson's correlation coefficient, Rcoloc = 0.54) and Rab11b (Rcoloc = 0.48), in comparison to the strong colocalization with TGOLN2 (Rcoloc = 0.75) (Fig. 5 E).
To perform a similar colocalization analysis in neurons, we stained iNs with antibodies against endogenous STMN2, TGOLN2, and Rab5A. TGOLN2 was primarily confined to cell bodies, while Rab5A scattered throughout iNs. In neuronal cell bodies, STMN2 strongly colocalized with TGOLN2 (Rcoloc = 0.67) (Fig. 5 F). However, overall colocalization was stronger with Rab5A, driven by the presence of Rab5A in axons where it partially colocalized with STMN2 (Rcoloc = 0.77) (Fig. 5 F). These findings suggest a new role of STMN2 that it is likely involved in vesicle trafficking originating from or returning to the Golgi apparatus.
Concluding remarks
In this study, we examined STMN2 turnover in two systems: U2OS cells lacking endogenous STMN2 and iNs with development-correlated high expression of STMN2. Despite their distinct cellular contexts, STMN2 displayed rapid turnover with a half-life of ∼2 h in both systems. We confirmed that STMN2 is rapidly degraded by proteasomes and the N-terminal extension is the main driver, although the proteasome–ubiquitination pathways do not act solely and directly through the N-terminal extension. We also found evidence that additional pathways also contribute to STMN2’s turnover under certain circumstances. Importantly, STMN2 degradation was negatively regulated by tubulin binding. One possible interpretation of this finding is that the tubulin-free form of STMN2 carries certain unknown, neuroprotective function, with tubulin binding acting as a regulatory mechanism. Supporting this hypothesis, we found that membrane binding and tubulin binding are mutually exclusive, or at the very least, the membrane-associated form binds tubulin less efficiently (Figs. 3 and 4). This key result and its implications are summarized in Fig. 5 G. In its soluble form, STMN2 is protected from degradation through its association with tubulin. Once tubulin dissociates, STMN2 can either be recruited to membranes or undergo rapid ubiquitination and degradation. We propose a model in which the neuroprotective activity of STMN2 is mediated by its membrane-bound, tubulin-free form. In Fig. 5 G, we hypothesize that when tubulin-free STMN2 is localized on membranes, its SLD recruits unknown factor(s), and that this interaction underlies its neuroprotective function. While these unknown proteins implicated in this cartoon are likely present in our proximity labeling datasets, we currently lack the necessary information to distinguish them from less important interactors. In the absence of definitive knowledge, we can only speculate on STMN2’s role. One possibility is that STMN2 regulates the dynamics of the vesicles it is associated with, e.g., alters the balance of TGN membrane flux into autophagy pathways versus plasma membrane recycling. Alternatively, STMN2 could serve as a transport adapter for other neuroprotective cargos, such as specific proteins or mRNAs for axonal or synaptic membrane repair. In either model, tubulin binding serves as an upstream negative regulator of STMN2’s membrane targeting. The concentration of soluble tubulin likely varies across neuronal compartments—for instance, being lower in axons than in cell bodies or synapses—this spatial variation could provide a mechanism for location-dependent regulation of STMN2. In this model, tubulin may control the release of STMN2’s unknown cargos at synaptic sites or regions of axonal membrane damage.
Materials and methods
Molecular biology and construct of cell lines
All STMN2 constructs are based on the canonical human STMN2 sequence (UniProt ID Q93045). All primers and DNA blocks were ordered from Integrated DNA Technologies. The doxycycline-inducible plasmids were based upon a piggyBac vector, PB-TRE-EGFP-EF1a-rtTA (#104454; Addgene), and synthesized DNA cassettes were cloned between NcoI and XhoI. Each construct was transfected together with a transposase vector at a ratio of 4:1, using Lipofectamine 3000 (L3000008; Thermo Fisher Scientific). Transfected cells were further selected with 1 μg/ml puromycin (A1113803; Thermo Fisher Scientific).
We generated STMN2 exon 2 knock-out cell lines using the CRISPR (Hsu et al., 2013) system. The sgRNA targeting the exon 2 and its flanking regions were designed according to CRISPick (Doench et al., 2016) and CHOPCHOP (Labun et al., 2019). We inserted a pair of sgRNAs into two expression vectors for sgRNAs and for expression of Cas9 linked to mCherry (#64324; Addgene) or GFP (#48138; Addgene). The exon 2 upstream sgRNAs are 5′-AATTGATCTCCTCTGCACTA-3′ and 5′-CTGCACTAAGGAACATGCA-3′. The exon 2 downstream sgRNAs are 5′-TATTGTGGATGTTGATATGC-3′ and 5′-TTGGACATAATAGCTAGACA-3′. The two vectors were transfected into cells simultaneously using Lipofectamine 3000. Transfected cell lines were initially selected by flow cytometry on the expression of both mCherry and GFP, followed by screening of purified genomic DNA (K182001; Invitrogen) using PCR, and finally, the genomic loci including the targeted fragments were sequenced.
Antibodies
Antibodies against the following antigens were used: STMN2 polyclonal rabbit antibody (PA5-23049; Invitrogen); STMN2 monoclonal mouse antibody (67204-1-Ig; Proteintech); V5 epitope tag rabbit antibody (NB600-381; Novus Biologicals); V5 epitope tag mouse antibody (E10/V4RR) (NBP2-37825; Novus Biologicals); anti-α-tubulin antibody (DM1A) (05-829; Sigma-Aldrich); GAPDH (D16H11) XP rabbit mAb (#5174; Cell Signaling Technology); anti-TGOLN2 antibody produced in rabbit (HPA012723; Sigma-Aldrich); Rab5A (E6N8S) mouse mAb (#46449; Cell Signaling Technology); Rab11 (D4F5) XP rabbit mAb (#5589; Cell Signaling Technology).
To generate anti-STMN2 serum, rabbits were immunized with 1 mg of synthetic N-terminal-acetylated peptides (GenScript) corresponding to the C-terminal sequence of STMN2 (CRHAAEVRRNKELQVELSG). Boosts were administered every 3 wk with 50% of the initial amount of peptide in Freund’s adjuvant. Specific antibodies were purified from the anti-STMN2 serum using a STMN2 affinity column, following the manufacturer’s instructions (Pharmacia Biotech). The purified antibody was validated by staining STMN2-V5 expressed in cells with a polyclonal STMN2 rabbit antibody (PA5-23049; Invitrogen), a monoclonal STMN2 mouse antibody (67204-1-Ig; Proteintech), a V5 epitope tag rabbit antibody (NB600-381; Novus Biologicals), and a V5 epitope tag mouse antibody (E10/V4RR, NBP2-37825; Novus Biologicals). Validation also included costaining endogenous STMN2 expressed in neurons using the STMN2 monoclonal mouse antibody (67204-1-Ig; Proteintech).
Cell culture and inducible expression of STMN2 constructs in U2OS cells
A U2OS cell line was obtained from ATCC and tested negative for Mycoplasma contamination. U2OS cells were cultured in DMEM (10-013-CV; Corning) supplemented with 10% FBS (26140-079; Gibco). The STMN2 transgene cells were maintained with a final concentration of 1 μg/ml puromycin (A1113803; Thermo Fisher Scientific). The expression of STMN2 constructs in U2OS cells was induced by treatment with 2 μg/ml doxycycline (D3072; Sigma-Aldrich) for 4 h for live-imaging or 16 h for biochemical analysis.
Stem cell culture and iN generation
hiPSC cell lines were generated from WTC-11 cell line (GM25256; Coriell Institute), which was reprogrammed from the fibroblast of a healthy 30-year-old male Asian. Routine karyotypic analysis was performed. Neuroprogenitor cells were derived from WTC-11 by transfecting the cells with a piggyBac-neurogenin1 (NGN1) system kindly provided by Prof. George Church’s lab (Busskamp et al., 2014) at Harvard Medical School. Stem cells were cultured on Matrigel-coated surfaces (354277; Corning), using mTeSR1 media (05850; STEMCELL Technologies). The NGN1-transformed hiPSC cell lines were selected and maintained in mTeSR1 supplemented with 1 μg/ml puromycin (A1113803; Thermo Fisher Scientific). For iPSC culture, media were changed every day. For passaging, cells were dissociated using Accutase (07920; STEMCELL Technologies), and replated in mTeSR1 supplemented with 1 μg/ml Y-27632 Rho kinase inhibitor (10005583; Cayman Chemical). To induce NGN1 expression, doxycycline (D3072; Sigma-Aldrich) was added at a concentration of 2 μg/ml. After three days of induction, the iNs were dissociated and replated onto poly-D-lysine (P6407; Sigma-Aldrich)– and laminin (23017015; Thermo Fisher Scientific)-coated surface, using Neurobasal-A media (10888022; Gibco) supplemented with B-27 (17504044; Gibco), MEM nonessential amino acid (11140050; Gibco), and GlutaMAX (35050061; Gibco). For iN culture, media were changed every 2 days.
CHX chase assay and immunoblotting
After the expression of STMN2 constructs was induced for 16 h in U2OS cells, the induction media were replaced with fresh media containing 20 μg/ml CHX, and the cells were incubated for 1, 2, or 4 h. To collect the cell lysates from the CHX chase assay, the cells were washed with cold PBS, harvested, and then lysed using cold EDTA-free NP-40 buffer (50 mM Tris-Cl, pH 8.0, 150 mM NaCl, 1% NP-40 substitute, EDTA-free complete protease inhibitor [11836170001; Roche]), while rocking for 15 min at 4°C. Each well of cell culture in a 6-well plate was lysed with 90 μl of NP-40 buffer, achieving a final protein concentration of ∼5 mg/ml. Approximately 35 μg of protein was loaded onto each lane of an SDS-PAGE gel for optimal detection of all STMN2 constructs. After electrophoresis, the gels were transferred onto 0.2 μM nitrocellulose membrane (Bio-Rad) and probed with the following antibodies: V5 epitope tag rabbit antibody (NB600-381; Novus Biologicals); V5 epitope tag mouse antibody (E10/V4RR) (NBP2-37825; Novus Biologicals); anti-α-tubulin antibody (DM1A) (05-829; Sigma-Aldrich); GAPDH (D16H11) XP rabbit mAb (#5174; Cell Signaling Technology).
For iNs, 3 days after plating, CHX was added to the media, and the iNs were incubated for 1, 2, or 4 h. Cell lysates were collected in the same manner as for U2OS cells. Approximately 70 μg of protein was loaded onto each lane of an SDS-PAGE gel for effective detection of endogenous STMN2. The following antibodies were used to probe the transferred membranes: homemade STMN2 antibody, anti-α-tubulin antibody (DM1A) (05-829; Sigma-Aldrich), and GAPDH (D16H11) XP rabbit mAb (#5174; Cell Signaling Technology).
Cytosolic and membrane protein separation
Cells were washed twice with PBS, scraped into PBS, and spun down. The resulting cell pellets were collected, weighed, and resuspended in 2 μl of 0.5X BrB80 buffer (40 mM K-PIPES, 0.5 mM MgCl2, 0.5 mM EGTA, pH 6.8) per milligram of cell mass. The suspension was placed on ice for 30 min to induce osmotic shock. Following this, the cell lysate was passed through a 25G needle three times and centrifuged at 500 × g for 5 min at 4°C to pellet the nuclei. The supernatant was collected and centrifuged again at 1,400 × g for 20 min at 4°C to separate the soluble and membrane fractions. The pellet was washed once with 0.5X BrB80 buffer and resuspended in 1 μl of 0.5X BrB80 buffer per milligram of cell mass. Protein concentrations in the soluble and membrane fractions were measured using the BCA assay.
Cross-linking and co-IP
For U2OS samples, ∼120 or ∼350 μg of protein was used per reaction, while 2 mg of protein was used for iNs. To cross-link interacting proteins, 2 mM of the cross-linker EDC was added to each reaction and incubated at 4°C for 30 min. The reaction was then quenched by adding 50 mM sodium acetate and 50 mM glycine, and incubating for 30 min at 4°C.
For each immunoprecipitation reaction, 8 μl of Dynabeads Protein G (10004D; Invitrogen) was coated with 6 μg of rabbit anti-V5 IgG (NB600-381; Novus Biologicals), according to the manufacturer’s protocol. Protein samples were adjusted to a final concentration of 100 mM KCl with 0.1% Triton X-100 before being added to the coated Dynabeads for immunoprecipitation. Each reaction was incubated with the anti-V5 IgG-coated Dynabeads for 1 h at 4°C. The Dynabeads were washed five times with PBS + 0.1% Triton X-100, and the bound proteins were eluted into 40 μl of SDS-PAGE loading buffer. For western blot, 10 μl of the eluted sample was loaded onto each lane for detection.
Proximity proteomics
Proximity labeling was performed on cells expressing APEX2-fused STMN2 constructs. After 4 h of doxycycline-induced expression, biotinyl tyramide (B397770; Toronto Research Chemicals) was added to the media at a final concentration of 0.5 μM, and cells were incubated in the labeling media for 1 h. To initiate labeling, H2O2 (H1009; Sigma-Aldrich) was added to a final concentration of 1 mM. Exactly 1 min after H2O2 treatment, the labeling solution was decanted, and cells were washed three times with cold quenching solution containing 10 mM sodium ascorbate (95035-692; VWR), 5 mM Trolox (238813; Sigma-Aldrich), and 10 mM sodium azide (S2002; Sigma-Aldrich). The cell lysate was harvested by scraping and cleared by centrifugation at 16,000 × g for 20 min, and the resulting pellet was flash-frozen and stored at −80°C until streptavidin pull-down. The cell pellet was lysed using a cell lysis solution (8 M urea, 100 mM sodium phosphate, pH 8, 1% SDS [wt/vol], 100 mM NH4HCO3, 10 mM TCEP, sterile-filtered). Protein was extracted by adding 55% TCA (91228; Sigma-Aldrich) at a 1:1 ratio to the lysate and precipitated by centrifugation. The protein pellet was then washed three times with −20°C cold acetone. Protein was subjected to cysteine alkylation using 20 mM iodoacetamide (I6125; Sigma-Aldrich), quenched by 50 mM DTT (43815; Sigma-Aldrich), and pulled down using streptavidin magnetic beads (PI88817; VWR). A detailed procedure for the protein processing procedure can be found in (Kalocsay, 2019).
Subsequent protein processing procedures and MS analysis were carried out as described previously. The digested peptides were labeled with TMTpro 16-plex (A44520; Thermo Fisher Scientific) for 1 h. Data collection followed a MultiNotch MS3-tandem mass tag (TMT) method using an Orbitrap Lumos mass spectrometer coupled to a Proxeon EASY-nLC 1,200 liquid chromatography system (both from Thermo Fisher Scientific). Peptides were searched against a size-sorted forward and reverse database of the Homo sapiens reference proteome (UniProt 03/2021) using SEQUEST (v.28, rev. 12)-based software. Spectra were first converted to mzXML. For the searches, a mass tolerance of 20 p.p.m. for precursors and a fragment ion tolerance of 0.9 Da were used. The search allowed for a maximum of two missed cleavages per peptide.
Carbamidomethylation of cysteine was set as a static modification (+57.0214 Da), and oxidized methionine residues (+15.9949 Da) were searched for dynamically. A target decoy database strategy was applied, and a false discovery rate (FDR) of 1% was set for peptide-spectrum matches after filtering by linear discriminant analysis. The FDR for final collapsed proteins was 1%. MS1 data were calibrated after search, and searches were performed again. Quantitative information on peptides was derived from MS3 scans. Quantitative tables were generated requiring an MS2 isolation specificity of >70% for each peptide and a sum of TMT signal:noise ratio (s:n) of >200 over all channels for any given peptide, and then exported to Excel and further processed therein. Proteomics raw data and search results were deposited in the PRIDE archive. The relative summed TMT s:n for proteins between two experimental conditions was calculated from the sum of TMT s:n for all peptides of a given protein quantified.
Immunofluorescence and imaging
Cells plated on #1.5 coverslips were washed with PBS and cross-linked with freshly made 4% paraformaldehyde and 0.2% glutaraldehyde in PBS for 15 min at room temperature, and washed three times with PBS afterward. Permeabilization was carried out with 0.1% Triton X-100 in PBS, 5 min at RT. Cells were blocked with 5% BSA (constituted from powder BSA, Roche Fraction V, sold by Catalog Number: 10735078001; Sigma-Aldrich) in PBS for 1 h at RT. Primary antibodies were diluted in PBS, and cells were incubated with diluted primary antibodies for ∼16 h at 4°C in a humidified chamber. Cells were then washed three times with PBS and incubated with fluorescently labeled secondary antibodies, diluted 1:500 in PBS for 1 h at RT, and washed three times with PBS. The coverslips were mounted on glass slides using VECTASHIELD Plus Antifade Mounting Medium with DAPI (H-2000; Vector Laboratories) and left in a dark chamber overnight before imaging.
Images were acquired on a Nikon Ti motorized inverted microscope equipped with Yokogawa CSU-W1 spinning disk confocal, and Hamamatsu ORCA-Fusion BT CMOS camera (6.5 µm2 photodiode) at the Core for Imaging Technology and Education (CITE) at Harvard Medical School, using a 63×/1.40 NA oil-immersion objective lens. Image acquisition was performed with NIS-Elements, and images were processed in ImageJ/Fiji for presentation.
Live-cell imaging
U2OS cells were cultured on 35-mm glass-bottom dishes, No. 1.5 (P35G-1.5-20-C; MatTek), and imaged at 37°C with 5% CO2 in phenol red–free DMEM (31053028; Gibco) supplemented with 10% FBS. Images were acquired using a Nikon Ti2 motorized inverted microscope equipped with the Perfect Focus System, a Hamamatsu ORCA-R2 cooled CCD camera (6.45 µm2 photodiode), and Tokai Hit stage top incubator (37°C and 5% CO2) at the CITE at Harvard Medical School, using 40×/0.75 NA Dry objective lens. Images were acquired using NIS-Elements.
Data analysis and statistics
All experiments were performed independently at least three times to ensure reproducibility. Statistical significance was assessed using two-tailed Student’s t test, unless otherwise specified. Data analysis and visualization were conducted in Python (version 3.9) using standard scientific libraries, including NumPy, SciPy, pandas, matplotlib, and seaborn. Data are presented as the mean ± standard deviation (SD), and significance thresholds are indicated as P < 0.05 and P < 0.005. For imaging experiments, colocalization was quantified using Pearson’s correlation coefficient, calculated from a minimum of 50 images per condition, with image processing and quantification performed in ImageJ/Fiji. Image analysis was performed blind to the experimental condition.
Online supplemental material
Data availability
The data underlying all figures in this manuscript are available in the article and its online supplemental materials. Additionally, any datasets generated during this study are openly available in Dryad at https://doi.org/10.5061/dryad.vhhmgqp51 and https://doi.org/10.5061/dryad.j9kd51crx
Acknowledgments
We thank the CITE at Harvard Medical School for providing technical support.
This study was supported by the National Institute of General Medical Sciences (grant R35GM131753) (Tim J. Mitchison) and by the Cancer Prevention and Research Institute of Texas (grant RR220032) (Marian Kalocsay). M. Kalocsay is a CPRIT Scholar in Cancer Research.
Author contributions: Xiang Deng: conceptualization, data curation, formal analysis, investigation, methodology, project administration, software, validation, visualization, and writing—original draft, review, and editing. Gary A. Bradshaw: investigation and resources. Marian Kalocsay: data curation, formal analysis, project administration, resources, supervision, and writing—review and editing. Tim J. Mitchison: conceptualization, formal analysis, funding acquisition, investigation, methodology, project administration, resources, supervision, and writing—review and editing.