


Autophagy is an important metabolic pathway that can non-selectively recycle cellular material or lead to targeted degradation of protein aggregates or damaged organelles. Autophagosome formation starts with autophagy factors accumulating on lipid vesicles containing ATG9. These phagophores attach to donor membranes, expand via ATG2-mediated lipid transfer, capture cargo, and mature into autophagosomes, ultimately fusing with lysosomes for their degradation. Autophagy can be activated by nutrient stress, for example, by a reduction in the cellular levels of amino acids. In contrast, how autophagy is regulated by low cellular ATP levels via the AMP-activated protein kinase (AMPK), an important therapeutic target, is less clear. Using live-cell imaging and an automated image analysis pipeline, we systematically dissect how nutrient starvation regulates autophagosome biogenesis. We demonstrate that glucose starvation downregulates autophagosome maturation by AMPK-mediated inhibition of phagophore tethering to donor membrane. Our results clarify AMPKs regulatory role in autophagy and highlight its potential as a therapeutic target to reduce autophagy.
Introduction
Autophagy is a catabolic pathway activated under conditions of chemical and nutrient stress, allowing the recycling of cellular material to sustain metabolism. Depending on the target for degradation, autophagy can be categorized into non-selective and selective forms, with the latter targeting specific substrates, for instance, damaged organelles, for breakdown (Dikic and Elazar, 2018; He and Klionsky, 2009). The cellular material targeted for degradation is enclosed within a de novo structure known as the autophagosome, which fuses with the lysosome to recycle its content (Melia, 2023; Lamb et al., 2013). Autophagy serves two important functions: it is critical in degrading damaged organelles and protein aggregates, and it provides molecular building blocks under starvation and stress conditions. As a consequence, defects in autophagy are associated with neurodegenerative diseases, and autophagy is activated in cancers to provide building blocks for their rapid proliferation (Dikic and Elazar, 2018; Kinsey et al., 2019; Amaravadi et al., 2019; Nixon, 2007, 2013).
The autophagosome is a vesicle enclosed by two lipid membranes, and its initiation and assembly are tightly controlled by autophagy genes (ATGs) (Dikic and Elazar, 2018). One model for autophagosome biogenesis proposes that ATG9-containing vesicles serve as the seed for recruitment of other autophagy factors (Broadbent et al., 2023; Olivas et al., 2023; Sawa-Makarska et al., 2020). ATG9 is the only known transmembrane protein among the ATGs and has lipid scramblase activity, transferring phospholipids between the two lipid bilayer leaflets (Sawa-Makarska et al., 2020; Maeda et al., 2020). Mobile ATG9 vesicles are specified to form autophagosomes by a phospholipid signaling cascade, enabling the recruitment of autophagy machinery required for autophagosome maturation (Broadbent et al., 2023; Olivas et al., 2023; Sawa-Makarska et al., 2020). Key maturation factors include the scaffold protein WIPI2 and the ATG16L1-ATG12-ATG5 complex, which acts like a ubiquitin ligase conjugating phosphatidylethanolamine to ATG8 family proteins (LC3, GABARAP) (Dikic and Elazar, 2018; Lystad et al., 2019; Yoshii and Mizushima, 2015). The expansion of the ATG9 vesicle seed into a fully formed autophagosome occurs upon its tethering to a lipid-membrane source by ATG2, a lipid transfer protein that transports lipids to the growing autophagosome structure (Maeda et al., 2020; Valverde et al., 2019; Osawa et al., 2019).
Nutrient stress can induce autophagy via several mechanisms depending on the type of starvation (Russell et al., 2014; Cuervo and Macian, 2012). Amino acids, especially leucine, glutamine, and arginine, are essential activators of the mammalian target of rapamycin complex 1 (mTORC1) (Hosokawa et al., 2009; Alers et al., 2012). When these amino acids are absent or levels are low, mTORC1 dissociates from the lysosome, which relieves its inhibition of the Unc-51–like autophagy activating kinase (ULK1/2) complex (Hosokawa et al., 2009). Activation of the ULK1-kinase complex triggers the phospholipid signaling cascade by activating a PI3K-kinase complex, causing local accumulation of PI3P on ATG9 vesicles (Alers et al., 2011, 2012). Lack of growth factors also promotes autophagy by an mTORC1-dependent mechanism (Wang and Levine, 2010). In contrast, how the autophagy machinery responds to energy starvation, particularly when triggered by glucose withdrawal, has been a subject of intense debate (Karabiyik et al., 2021; Ramírez-Peinado et al., 2013; Lang et al., 2014; Park et al., 2023). In mammalian cells, the AMP-activated protein kinase (AMPK) complex senses the AMP/ATP ratio and activates catabolic pathways, including fatty acids catabolism and potentially autophagy, concurrently suppressing biosynthetic pathways (Alers et al., 2012). AMPK directly phosphorylates ULK1, blocking its interaction with mTORC1 and thus activating its kinase activity toward downstream signaling phospholipid complexes (Kim et al., 2011), including the recently reported PIKfyve complex, which was suggested to upregulate autophagy (Karabiyik et al., 2021). In contrast, other studies have shown that glucose starvation suppresses autophagic flux in both mammalian cells (Ramírez-Peinado et al., 2013) and yeast (Lang et al., 2014). In addition, Park et al. (2023) recently proposed that AMPK activation results in ULK1 phosphorylation at Ser556 and Thr660, leading to ULK1 inactivation, increased stability of the AMPK/ULK1 complex, and inhibition of autophagy (Park et al., 2023). It is critical to resolve these conflicting results, given that AMPK has been extensively explored as a drug target to treat several chronic diseases (Dai et al., 2017; Liu et al., 2019). For instance, metformin and canagliflozin are FDA-approved drugs to treat type 2 diabetes, with ongoing preclinical trials exploring their potential as therapeutics for cardiovascular disease and several types of cancer (Lord and Harris, 2023; Steinberg and Carling, 2019). They indirectly target AMPK by inhibiting the mitochondrial respiratory chain and thus decreasing the cellular ATP levels (Steinberg and Carling, 2019). While direct AMPK activators like compound 991 and MK8722 exist, their use is currently primarily limited to in vitro or animal models (Steinberg and Carling, 2019).
To systematically analyze how amino acids, glucose, and growth factors regulate phagophore initiation and maturation into autophagosomes, we used our recently developed collection of cell lines expressing HaloTagged autophagy factors from their endogenous loci (Broadbent et al., 2023). This approach allows us to analyze autophagic flux by determining the initiation and maturation kinetics of autophagosomes in living cells, avoiding artifacts due to protein overexpression (Kuma et al., 2007; Fujita et al., 2008). In this study, we expand on our previous work by developing a high-throughput computational pipeline (K-FOCUS), which combines automated cell segmentation, with multicolor single-particle tracking to dissect the kinetics of autophagosome maturation at the single-cell level. K-FOCUS assesses protein colocalization by analyzing the codiffusion of fluorescent signals over time and outperforms traditional methods of colocalization analysis, including object-based algorithms such as Statistical Object Distance Analysis (SODA) (Lagache et al., 2018), which are often limited to a single timepoint. Using this methodology, we investigate autophagosome biogenesis under various nutrient conditions, including glucose withdrawal, focusing on ATG13, ULK1, WIPI2, and ATG2A recruitment to phagophores/autophagosomes. Our results demonstrate that the rate of phagophore initiation is increased by amino acid or glucose starvation. However, the fraction of phagophores that mature to the point of LC3 accumulation is significantly reduced upon glucose starvation, suggesting that phagophore maturation is inhibited when glucose is absent. Importantly, direct activation of AMPK with a small molecule mimics this effect, and inhibition of AMPK increases the maturation of autophagosomes in the absence of glucose, suggesting that AMPK activation is sufficient to inhibit autophagosome maturation. Finally, we demonstrate that upon glucose starvation or AMPK activation, autophagy proteins accumulate on highly mobile structures, consistent with ATG9 vesicles that fail to be tethered to a donor membrane by ATG2. Collectively, these results support a model in which glucose starvation and AMPK activation inhibit autophagosome biogenesis by preventing the tethering of ATG9 vesicles to donor membranes.
Results
K-FOCUS: Single-cell monitoring of autophagy dynamics
In fluorescence microscopy images of eukaryotic cells, autophagosomes appear as bright cytoplasmic puncta, also referred to as foci (Klionsky et al., 2021). Using time-lapse imaging, it is possible to monitor the rate of foci formation, their lifetime, and mobility (Broadbent et al., 2023). These metrics provide valuable insights into the dynamics of autophagic flux and the molecular mechanisms underlying autophagosome biogenesis. To study autophagy in human cancer cells, we have developed a cell line panel in which the HaloTag is introduced at the endogenous loci of the autophagy factors ATG13, ULK1, WIPI2, and ATG2A (Broadbent et al., 2023). This panel of cell lines provides a sensitive tool to detect autophagosome formation. Notably, like many other biological processes (Mattiazzi Usaj et al., 2021), the number of autophagy factor foci formed displays substantial cell-to-cell variability (Schüssele et al., 2023). To dissect autophagosome formation at the single-cell level, we created K-FOCUS, a computational pipeline to analyze autophagic flux at the single-cell level using live-cell imaging. K-FOCUS allows simultaneous analysis of multiple autophagy markers to examine autophagosome maturation, for example, by analyzing an initiation factor and a downstream cargo-adaptor (P62) or ATG8 family proteins (LC3, GABARAP).
K-FOCUS encompasses three key steps: single-cell segmentation, foci localization and tracking, and colocalization analysis (Fig. 1). For cell segmentation, we used CellPose (Stringer et al., 2021; Pachitariu and Stringer, 2022), a deep-learning tool, which was trained using cells expressing GFP-LC3 and provides a reliable outline of the cells analyzed (Fig. 1, A and B). This cell segmentation is then used for the analysis of all imaging channels. Cellular segmentation remained robust even under conditions of high cell confluency (Fig. 1 A). The resulting single-cell regions of interest (ROIs) were imported into TrackIt, a graphical user interface (GUI)–based tool used for single-particle tracking (Kuhn et al., 2021). Among the available tracking software options, we selected TrackIt for its user-friendly GUI interface that enables high-throughput optimization and analysis of multiple ROIs per image. Furthermore, TrackIt uses wavelet analysis to detect single particles (Izeddin et al., 2012), which outperforms other algorithms when analyzing the Brownian motions of vesicles, as well as particles switching from random to directed motion (Chenouard et al., 2014). Prior to tracking, manual inspection of the cellular segmentation was performed in TrackIt to correct any mis-segmented cells (Fig. 1 B). Subsequently, tracking was carried out for all channels by optimizing the tracking parameters and exported as a batch file to be used as the input file for the colocalization analysis with K-FOCUS. Two parameters are particularly critical when tracking foci in TrackIt: the threshold factor and tracking radius. In TrackIt, foci were filtered using an intensity threshold factor to avoid the detection of false positive signals and optimized separately for each protein analyzed. After threshold filtering, the nearest neighbor algorithm will link the closest spots from two consecutive frames if their Euclidian distance is within a user-defined tracing radius. In our experiment, a tracking radius of 5 pixels (∼1.9 μm) was optimal for both autophagy factors and LC3. In both cases, visual inspection of tracking was carefully performed for each experiment. K-FOCUS enables the processing of hundreds of cells, generating time-lapse data for thousands of autophagy foci (Fig. 1 C). K-FOCUS determines the colocalization of foci in multiple fluorescence channels and calculates the frequency of foci occurrence, foci lifetime, and diffusion dynamics. Once particle tracks have been determined in both imaging channels, K-FOCUS carries out the colocalization analysis between channels. The user has the flexibility to define precise colocalization criteria. Typically, we deem two signals colocalized when their centroids are within three pixels (∼1.2 µm in our microscopy setup) of each other for a minimum of 10 imaging frames (equivalent to 10 s), which is a highly stringent standard. In the context of autophagosome biogenesis, K-FOCUS accurately distinguishes phagophores (total ATG protein foci) and autophagosomes (total ATG protein and LC3-positive foci). The conversion ratio (the number of foci containing both the ATG and LC3 divided by the total number of ATG foci) is a particularly useful metric to understand the molecular mechanisms underlying the transition from phagophores to autophagosomes. In addition, K-FOCUS determines colocalization time, the time delay before colocalization occurs, step sizes of all tracks, and background-corrected fluorescence intensity for all foci localizations. The K-FOCUS output is a MATLAB structure containing single-cell foci data that can be easily used for additional analyses. Overall, K-FOCUS provides detailed information defining the life cycle of autophagosomes at the single-cell level.

K-FOCUS: Live-cell high-throughput single-cell analysis of foci colocalization. (A) Illustration of the analysis pipeline for the Cellpose-TrackIt module, which incorporates CellPose segmentation into TrackIt (scale bar = 10 µm). (B) Workflow for manual ROI quality control and foci tracking using the TrackIt GUI. (C) A schematic outlining the colocalization criteria, including user-defined inputs, and key outputs. Additionally, it presents a visual representation of a colocalized and non-colocalized track, along with a kernel density plot of track length per cell for both colocalized and non-colocalized tracks.
K-FOCUS: Live-cell high-throughput single-cell analysis of foci colocalization. (A) Illustration of the analysis pipeline for the Cellpose-TrackIt module, which incorporates CellPose segmentation into TrackIt (scale bar = 10 µm). (B) Workflow for manual ROI quality control and foci tracking using the TrackIt GUI. (C) A schematic outlining the colocalization criteria, including user-defined inputs, and key outputs. Additionally, it presents a visual representation of a colocalized and non-colocalized track, along with a kernel density plot of track length per cell for both colocalized and non-colocalized tracks.
K-FOCUS outperforms other approaches to determine foci colocalization
Several metrics have been traditionally used to assess the degree of colocalization between two fluorescent signals in fixed cells or single images of living cells. Threshold-based methods, such as Pearson’s correlation coefficient and Manders’ overlap coefficient, offer distinct advantages. These metrics are widely used and standardized, enabling comparisons across different experiments and facilitating a quantitative understanding of colocalization (Bolte and Cordelières, 2006). Recently, SODA was developed as a statistical approach to map coupled objects within the cell, providing insights into molecular assemblies in high-resolution fluorescence imaging (Lagache et al., 2018). To test how K-FOCUS compares with threshold and object-based methods, we calculated these metrics at the single-cell level using two datasets that exemplify common fluorescence colocalization challenges in the autophagy field (Fig. 2). Cells expressing Halo-ATG9A from its endogenous locus, and LAMP1-mNeonGreen, a marker of lysosomes, were selected as the first test dataset. We recently demonstrated that Halo-ATG9A accumulates in the lysosomal compartment over time (Broadbent et al., 2023). The use of HaloTag, which is resistant to lysosomal proteolysis (Yim et al., 2022), allows us to track the accumulation of Halo-ATG9A by pulse labeling with a HaloTag ligand conjugated with JFX650 and monitoring its colocalization with the lysosomal marker LAMP1-mNeonGreen over time (Fig. 2 A and Video 1). Immediately after labeling, we expect to observe minimal colocalization, and significant colocalization should be observed 24 h after labeling. After CellPose cell segmentation, we analyzed a single frame per cell and performed colocalization analysis (Fig. 2 B). As expected, both threshold-based methods and SODA showed a significant increase of Halo-ATG9A and Lamp1-mNeonGreen colocalization 24 h after labeling. Rather than producing a coupling or colocalization coefficient, K-FOCUS provides a numerical value for total foci number per cell for each channel and a fraction of colocalized signals. Next, we generated a second dataset by imaging cells expressing Halo-ATG13 from its endogenous locus and GFP-LC3 by integration into the AAVS1 locus, which provides stable and homogeneous expression levels. Importantly, both fluorescence channels display substantial cytoplasmic background signals. Accumulation of GFP-LC3 serves as a marker for the transition from a phagophore to an autophagosome (Dooley et al., 2014). In the context of autophagosome formation, Halo-ATG13 forms foci that detectably accumulate GFP-LC3 ∼40 s after their appearance (Broadbent et al., 2023). Autophagy occurs under nutrient-rich conditions (basal autophagy) and increases when autophagy is triggered by nutrient starvation (Fig. 2 C and Video 2). Despite our edited cell lines showing a strong response to starvation based on the LC3 biochemical assay (Broadbent et al., 2023), Pearson’s correlation coefficient did not detect an increased overlap between LC3 and ATG13 (Fig. 2 D). Even more surprisingly, both Mander’s overlap coefficient and SODA analysis yielded less colocalization between the Halo-ATG13 and GFP-LC3 channels under starvation conditions compared with control cells (Fig. 2 D). In contrast, K-FOCUS was able to detect a significant increase in the number of ATG13 foci that colocalized with LC3 signals under starvation conditions compared with control cells (Fig. 2 D). Interestingly, the fraction of ATG13 foci that colocalized with LC3 did not change, suggesting that the total number of ATG13 foci has increased in starved cells (Fig. 2 D), consistent with previous results (Broadbent et al., 2023).

K-FOCUS is a robust object-based colocalization tool in live-cell imaging. (A) Example images demonstrating the accumulation of Halo-ATG9A in lysosomes, captured immediately after or 24 h following labeling with JFX650 in U2OS cells (scale bar = 10 µm). (B) A comparison between different colocalization analysis methods for the data shown in A, including threshold-based Pearson and Manders coefficients, as well as wavelet spot detection–based SODA and K-FOCUS. The box indicates the interquartile range, the whiskers the 10–90% confidence interval, the square indicates the average, and the horizontal line is the median; statistical significance was assessed by a two-tailed t-test. (C) Example images of U2OS cells expressing GFP-LC3B and Halo-ATG13 under both control and EBSS conditions (scale bar = 5 µm). (D) A comparison between different colocalization analysis methods for the data shown in C, including threshold-based Pearson and Manders coefficients, as well as wavelet spot detection–based SODA and K-FOCUS analyses. The box indicates the interquartile range, the whiskers the 10–90% confidence interval, the square indicates the average, and the horizontal line is the median; statistical significance was assessed by a two-tailed t-test.
K-FOCUS is a robust object-based colocalization tool in live-cell imaging. (A) Example images demonstrating the accumulation of Halo-ATG9A in lysosomes, captured immediately after or 24 h following labeling with JFX650 in U2OS cells (scale bar = 10 µm). (B) A comparison between different colocalization analysis methods for the data shown in A, including threshold-based Pearson and Manders coefficients, as well as wavelet spot detection–based SODA and K-FOCUS. The box indicates the interquartile range, the whiskers the 10–90% confidence interval, the square indicates the average, and the horizontal line is the median; statistical significance was assessed by a two-tailed t-test. (C) Example images of U2OS cells expressing GFP-LC3B and Halo-ATG13 under both control and EBSS conditions (scale bar = 5 µm). (D) A comparison between different colocalization analysis methods for the data shown in C, including threshold-based Pearson and Manders coefficients, as well as wavelet spot detection–based SODA and K-FOCUS analyses. The box indicates the interquartile range, the whiskers the 10–90% confidence interval, the square indicates the average, and the horizontal line is the median; statistical significance was assessed by a two-tailed t-test.
U2OS cells expressing LAMP1-mNeonGreen (left column, green in merge, right column) and Halo-ATG9A (JFX650, middle column, magenta in merge, right column) imaged at 1 frame per second (fps) using a spinning disc confocal acquired with Photometrics Prime 95B sCMOS camera, either immediately after Halo-ATG9A labeling (top row), or 24 h after Halo-ATG9A labeling (bottom row). The movie is played back at 20× speed.
U2OS cells expressing LAMP1-mNeonGreen (left column, green in merge, right column) and Halo-ATG9A (JFX650, middle column, magenta in merge, right column) imaged at 1 frame per second (fps) using a spinning disc confocal acquired with Photometrics Prime 95B sCMOS camera, either immediately after Halo-ATG9A labeling (top row), or 24 h after Halo-ATG9A labeling (bottom row). The movie is played back at 20× speed.
U2OS cells expressing Halo-ATG13 (JFX650, left column, magenta in merge, right column) and GFP-LC3B (middle column, green in merge, right column) imaged at 1 fps using widefield illumination and a Hamamatsu BT fusion camera (downsampled to pixel size of 370 nm) cultured in complete media (top row) and EBSS (bottom row). The movie is played back at 20× speed.
U2OS cells expressing Halo-ATG13 (JFX650, left column, magenta in merge, right column) and GFP-LC3B (middle column, green in merge, right column) imaged at 1 fps using widefield illumination and a Hamamatsu BT fusion camera (downsampled to pixel size of 370 nm) cultured in complete media (top row) and EBSS (bottom row). The movie is played back at 20× speed.
In summary, these results demonstrate that K-FOCUS provides higher sensitivity and more detailed information than other fluorescence colocalization methods by providing numerical values for colocalization of foci over time offering a novel tool for the quantitative colocalization of fluorescence signals in live-cell microscopy data.
Glucose depletion inhibits phagophore maturation
The role of mTOR in maintaining cellular levels of amino acids is well established. In the presence of essential amino acids, mTOR actively inhibits autophagy (Hosokawa et al., 2009; Alers et al., 2012). In low-nutrient conditions, mTOR is inactivated, allowing autophagy to replenish amino acid stores by recycling cellular proteins (Russell et al., 2014). In contrast, the AMPK complex is a cellular energy sensor, activated by a high AMP-to-ATP ratio (Alers et al., 2012). To investigate how the removal of a specific class of nutrients impacts the formation of autophagy factor foci, we performed live-cell imaging of human U2OS cancer cells expressing HaloTagged ATG13, ULK1, WIPI2, and ATG2A from their endogenous loci. The selection of these proteins allows us to characterize autophagosome biogenesis starting with protein kinase signaling (ATG13 and ULK1) to lipid transfer (ATG2A) and finally the LC3-conjugation machinery (WIPI2). In these HaloTagged cell lines, we stably expressed GFP-LC3 from the AAVS1 safe-harbor locus to mark mature autophagosomes (Broadbent et al., 2023). GFP-LC3B was expressed in >80% of the cells at comparable or slightly lower levels than endogenous LC3B (Fig. S2, A–C). Similar to previous observations made with HaloTag-LC3B, the fusion to GFP increased the western blot signal of LC3B, and accurate comparison to endogenous LC3B required removal of the GFP-tag with Tobacco Etch Virus (TEV) protease (Fig. S2 A), suggesting that the GFP-tag increases the transfer efficiency of LC3B.
We systematically analyzed autophagy foci formation in media lacking amino acids, glucose, amino acids and FBS, or all three components (Fig. 3 A and Fig. S1; and Videos 3, 4, 5, and 6). Cells were imaged every second and movies were downsampled from a pixel size of 108.3 to 370 nm, reducing file size more than 10-fold to significantly accelerate computational analysis of the data. Movies were then analyzed using K-FOCUS to determine three key metrics: foci formation rate (phagophore initiation rate), the fraction of autophagy foci that recruited LC3 (conversion ratio), and foci lifetimes. The foci formation rate was further stratified into autophagy factor foci that colocalized with GFP-LC3 signal over time (LC3+ foci) and those that do not (LC3− foci). We observed changes in both endogenous HaloTagged autophagy factor and GFP-LC3 foci formation dynamics when cells were subjected to different media conditions (Fig. 3 A and Fig. S1; and Videos 3, 4, 5, and 6). Removal of amino acids was not sufficient to increase endogenous phagophore formation rate of the autophagy proteins (Fig. 3 B, left panels), except for Halo-ATG2A, which showed a slight increase from 6 to 11 foci per cell per minute. Removal of FBS in addition to amino acids increased the formation rate of Halo-ATG2 (from 6 to 15 foci per cell per minute) and Halo-ATG13 (from 19 to 38 foci per cell per minute) foci (Fig. 3 B). The median foci formation rate per cell also increased for WIPI2 and ULK1 in the absence of amino acids and FBS, but the difference was not statistically significant (Fig. 3 B). When glucose was removed from the media, the foci formation rate was increased for Halo-ATG13 and Halo-ATG2A (Fig. 3 B). In addition, we observed a significant increase in the formation of WIPI2 foci when amino acids, FBS, and glucose were withheld (Fig. 3 B). These observations suggest that nutrient starvation, in particular the removal of amino acids and FBS, or glucose can increase the autophagic foci formation rate for ATG13 and ATG2, but only has only marginal effects on the number of foci formed by ULK1 and WIPI2. It is important to note that ATG13 forms significantly more foci per cell compared with all other factors analyzed, consistent with previous results (Broadbent et al., 2023). This could be a consequence of ATG13 being one of the first factors recruited to phagophores or that ATG13 also accumulates on structures not involved in autophagy.

K-FOCUS analysis of the kinetics of autophagy factor foci formation under nutrient starvation. (A) Live-cell images of Halo-WIPI2 and GFP-LC3B in control and starvation medium (scale bar = 5 µm). (B) Quantification of colocalization kinetics of single cells in A and Fig. S1 using K-FOCUS, including total, colocalized, and non-colocalized phagophore formation rates. Data was downsampled to a pixel size of 370 nm. (C) Quantified fractions of LC3+ foci/cell from imaging in A and Fig. S1. For B and C, the box indicates the interquartile range, the whiskers the 10–90% confidence interval, the square indicates the average, and the horizontal line is the median. Statistical significance was assessed by one-way ANOVA. The letter assignments denote statistically significant differences among groups at P = 0.05, as determined by a Bonferroni post-hoc test.
K-FOCUS analysis of the kinetics of autophagy factor foci formation under nutrient starvation. (A) Live-cell images of Halo-WIPI2 and GFP-LC3B in control and starvation medium (scale bar = 5 µm). (B) Quantification of colocalization kinetics of single cells in A and Fig. S1 using K-FOCUS, including total, colocalized, and non-colocalized phagophore formation rates. Data was downsampled to a pixel size of 370 nm. (C) Quantified fractions of LC3+ foci/cell from imaging in A and Fig. S1. For B and C, the box indicates the interquartile range, the whiskers the 10–90% confidence interval, the square indicates the average, and the horizontal line is the median. Statistical significance was assessed by one-way ANOVA. The letter assignments denote statistically significant differences among groups at P = 0.05, as determined by a Bonferroni post-hoc test.

K-FOCUS analysis of the kinetics of autophagy factor foci formation under nutrient starvation. Live-cell images of ULK1-Halo, Halo-ATG13, or Halo-ATG2A and GFP-LC3B in control and starvation medium (scale bar = 5 µm).

K-FOCUS analysis of the kinetics of autophagy factor foci formation under nutrient starvation. Live-cell images of ULK1-Halo, Halo-ATG13, or Halo-ATG2A and GFP-LC3B in control and starvation medium (scale bar = 5 µm).
U2OS cells expressing Halo-WIPI2 (JFX650, left column, magenta in merge, right column) and GFP-LC3B (middle column, green in merge, right column) imaged at 1 fps using widefield illumination and a Hamamatsu BT fusion camera (downsampled to pixel size of 370 nm) cultured in different media conditions (rows, top to bottom: complete media; no amino acids; no amino acids and FBS; no glucose; no amino acids, FBS, and glucose). The movie is played back at 20× speed.
U2OS cells expressing Halo-WIPI2 (JFX650, left column, magenta in merge, right column) and GFP-LC3B (middle column, green in merge, right column) imaged at 1 fps using widefield illumination and a Hamamatsu BT fusion camera (downsampled to pixel size of 370 nm) cultured in different media conditions (rows, top to bottom: complete media; no amino acids; no amino acids and FBS; no glucose; no amino acids, FBS, and glucose). The movie is played back at 20× speed.
U2OS cells expressing Halo-ATG13 (JFX650, left column, magenta in merge, right column) and GFP-LC3B (middle column, green in merge, right column) imaged at 1 fps using widefield illumination and a Hamamatsu BT fusion camera (downsampled to pixel size of 370 nm) cultured in different media conditions (rows, top to bottom: complete media; no amino acids; no amino acids and FBS; no glucose; no amino acids, FBS, and glucose). The movie is played back at 20× speed.
U2OS cells expressing Halo-ATG13 (JFX650, left column, magenta in merge, right column) and GFP-LC3B (middle column, green in merge, right column) imaged at 1 fps using widefield illumination and a Hamamatsu BT fusion camera (downsampled to pixel size of 370 nm) cultured in different media conditions (rows, top to bottom: complete media; no amino acids; no amino acids and FBS; no glucose; no amino acids, FBS, and glucose). The movie is played back at 20× speed.
U2OS cells expressing Halo-ULK1 (JFX650, left column, magenta in merge, right column) and GFP-LC3B (middle column, green in merge, right column) imaged at 1 fps using widefield illumination and a Hamamatsu BT fusion camera (downsampled to pixel size of 370 nm) cultured in different media conditions (rows, top to bottom: complete media; no amino acids; no amino acids and FBS; no glucose; no amino acids, FBS, and glucose). The movie is played back at 20× speed.
U2OS cells expressing Halo-ULK1 (JFX650, left column, magenta in merge, right column) and GFP-LC3B (middle column, green in merge, right column) imaged at 1 fps using widefield illumination and a Hamamatsu BT fusion camera (downsampled to pixel size of 370 nm) cultured in different media conditions (rows, top to bottom: complete media; no amino acids; no amino acids and FBS; no glucose; no amino acids, FBS, and glucose). The movie is played back at 20× speed.
U2OS cells expressing Halo-ATG2A (JFX650, left column, magenta in merge, right column) and GFP-LC3B (middle column, green in merge, right column) imaged at 1 fps using widefield illumination and a Hamamatsu BT fusion camera (downsampled to pixel size of 370 nm) cultured in different media conditions (rows, top to bottom: complete media; no amino acids; no amino acids and FBS; no glucose; no amino acids, FBS, and glucose). The movie is played back at 20× speed.
U2OS cells expressing Halo-ATG2A (JFX650, left column, magenta in merge, right column) and GFP-LC3B (middle column, green in merge, right column) imaged at 1 fps using widefield illumination and a Hamamatsu BT fusion camera (downsampled to pixel size of 370 nm) cultured in different media conditions (rows, top to bottom: complete media; no amino acids; no amino acids and FBS; no glucose; no amino acids, FBS, and glucose). The movie is played back at 20× speed.
The number of autophagy factor foci that accumulate LC3 (LC3+ foci) was significantly increased in the absence of amino acids or amino acids and FBS (Fig. 3 B), consistent with the established role of mTOR signaling in autophagy induction (Hosokawa et al., 2009; Jung et al., 2010). All proteins had comparable rates of LC3+ foci formation at maximal induction (approximately three LC3+ phagophores per cell per minute in −AA [amino acids]/−FBS/+Glucose media), confirming that autophagic flux is similar in all edited cell lines. To assure that this colocalization reflected membrane conjugation of GFP-LC3B rather than colocalization of autophagy factors with GFP-LC3B aggregates, we imaged Halo-ATG13 with conjugation incompetent GFP-LC3B G120A expressed by viral transduction. We did not detect Halo-ATG13 colocalization with GFP-LC3B G120A foci (Fig. S4 A and Video 7), demonstrating that the GFP-LC3B foci colocalization with the autophagy factors analyzed observed in our experiments reflects membrane conjugated GFP-LC3B. The absence of glucose significantly decreased the rate at which LC3+ foci formed for all autophagy factors analyzed, suggesting that autophagosome maturation is inhibited in the absence of glucose (Fig. 3 B). It is important to note that only a small fraction (∼10–20%) of the autophagy factor foci colocalizes with LC3 (Fig. 3 B). For this reason, the formation rate of autophagy protein foci that do not colocalize with LC3 closely corresponds to the overall foci formation rate (Fig. 3 B). To confirm these observations, we carried out autophagy flux assays measuring the amount of membrane-conjugated LC3B-II using western blot. Consistent with our imaging experiments, LC3B-II levels were increased by withdrawal of amino acids or amino acids and FBS and were reduced when glucose was excluded from the media (Fig. S2, D–H). In addition, we found that GABARAP membrane conjugation was largely unchanged or potentially slightly reduced when cells were grown in media lacking glucose (Fig. S2 I). To further confirm that the lack of conversion of autophagosome protein foci into LC3B positive structures reflects a reduction in autophagosome formation, we imaged Halo-ATG13 in cells coexpressing GFP-P62 from the AAVS1 locus as a distinct marker for autophagosomes. Consistent with our observations made with GFP-LC3B as an autophagosome marker, we also observed a reduction in the number of Halo-ATG13 foci that colocalized with GFP-P62 in the absence of glucose, while withdrawal of amino acids and FBS increased the number of Halo-ATG13 foci that colocalized with GFP-P62 (Fig. S4, B and C; and Video 8). The conversion ratio, which represents the fraction of HaloTagged autophagy foci that detectably accumulate GFP-LC3 signal over the imaging time course, was not affected by withdrawal of amino acids or amino acids and FBS for ATG13 and ATG2 but was increased for ULK1 and WIPI2 under the same conditions (Fig. 3 C). This suggests that the increase in LC3-positive ATG13 and ATG2 foci is largely driven by an increase in autophagosome formation, while ULK1 and WIPI2 foci more efficiently mature into LC3-positive autophagosomes in the absence of amino acids or amino acids and FBS. This is consistent with ULK1 and WIPI2 controlling key autophagosome maturation steps, which are upregulated under amino acid starvation (Dooley et al., 2014; Ganley et al., 2009). In contrast, glucose withdrawal alone, or in the context of media also lacking amino acids and FBS, significantly reduced the fraction of autophagy protein foci that accumulate LC3 for all proteins tested. This demonstrates that autophagosome maturation is strongly inhibited in the absence of glucose.
U2OS cells expressing Halo-ATG13 (JF657, middle column, magenta in merge, right column) and GFP-LC3B G120A (viral transduction, left column, green in merge left column) imaged at 1 fps using spinning disc confocal imaging and a Hamamatsu ORCA Quest qCMOS camera (2 × 2 binning) cultured in different media conditions (rows, top to bottom: complete media; no amino acids and FBS; no glucose).
U2OS cells expressing Halo-ATG13 (JF657, middle column, magenta in merge, right column) and GFP-LC3B G120A (viral transduction, left column, green in merge left column) imaged at 1 fps using spinning disc confocal imaging and a Hamamatsu ORCA Quest qCMOS camera (2 × 2 binning) cultured in different media conditions (rows, top to bottom: complete media; no amino acids and FBS; no glucose).
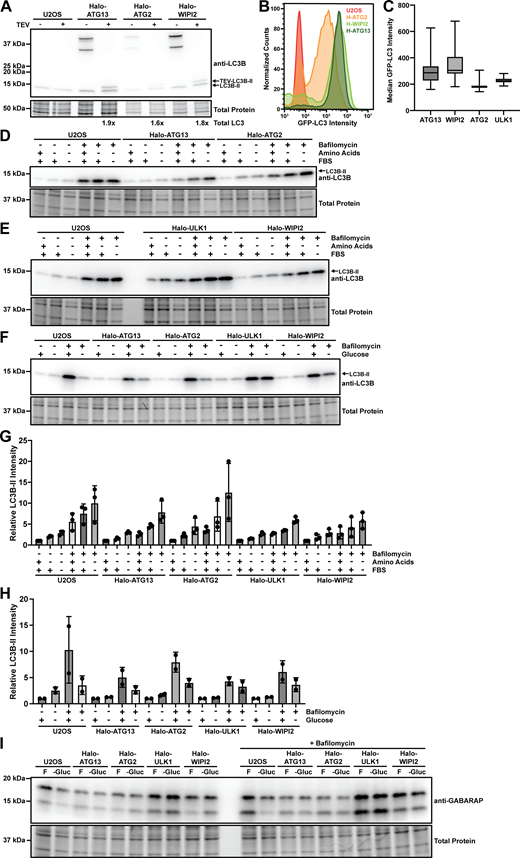
Autophagy flux analysis. (A) Western blot of control U2OS cells and Halo-ATG13, Halo-ATG2, or Halo-WIPI2 expressing U2OS cells stably coexpressing GFP-LC3B probed with an antibody against LC3B. Cell lysates were generated with CHAPS buffer split in half and treated with or without TEV protease. (B) Flow cytometry analysis of GFP-LC3B expression in control U2OS cells and Halo-ATG13, Halo-ATG2, or Halo-WIPI2 expressing U2OS cells stably coexpressing GFP-LC3B. (C) Quantification of median cellular GFP-LC3B signal intensity in Halo-ATG13, Halo-ATG2, Halo-ULK1, or Halo-WIPI2 expressing U2OS cells stably coexpressing GFP-LC3B cultured in complete media. (D) Western blot probed for LC3B of control U2OS cells, and U2OS cells expressing Halo-ATG13 or Halo-ATG2 grown in complete media, media lacking amino acids, or media lacking amino acids and FBS in the absence and presence of bafilomycin. (E) Western blot probed for LC3B of control U2OS cells, and U2OS cells expressing Halo-ULK1 or Halo-WIPI2 grown in complete media, media lacking amino acids, or media lacking amino acids and FBS in the absence and presence of bafilomycin. (F) Western blot probed for LC3B of control U2OS cells, and U2OS cells expressing Halo-ATG13, Halo-ATG2, Halo-ULK1, or Halo-WIPI2 grown in complete media, or media lacking glucose in the absence and presence of bafilomycin. (G) Quantification of the LC3B-II band intensity of the western blots shown in D and E (three biological replicates, mean and standard deviation). (H) Quantification of the LC3B-II band intensity of the western blot shown in panel F (two biological replicates, mean and standard deviation). (I) Western blot probed for GABARAP of control U2OS cells, and U2OS cells expressing Halo-ATG13, Halo-ATG2, Halo-ULK1, or Halo-WIPI2 grown in complete media, or media lacking glucose in the absence and presence of bafilomycin. Source data are available for this figure: SourceData FS2.

Autophagy flux analysis. (A) Western blot of control U2OS cells and Halo-ATG13, Halo-ATG2, or Halo-WIPI2 expressing U2OS cells stably coexpressing GFP-LC3B probed with an antibody against LC3B. Cell lysates were generated with CHAPS buffer split in half and treated with or without TEV protease. (B) Flow cytometry analysis of GFP-LC3B expression in control U2OS cells and Halo-ATG13, Halo-ATG2, or Halo-WIPI2 expressing U2OS cells stably coexpressing GFP-LC3B. (C) Quantification of median cellular GFP-LC3B signal intensity in Halo-ATG13, Halo-ATG2, Halo-ULK1, or Halo-WIPI2 expressing U2OS cells stably coexpressing GFP-LC3B cultured in complete media. (D) Western blot probed for LC3B of control U2OS cells, and U2OS cells expressing Halo-ATG13 or Halo-ATG2 grown in complete media, media lacking amino acids, or media lacking amino acids and FBS in the absence and presence of bafilomycin. (E) Western blot probed for LC3B of control U2OS cells, and U2OS cells expressing Halo-ULK1 or Halo-WIPI2 grown in complete media, media lacking amino acids, or media lacking amino acids and FBS in the absence and presence of bafilomycin. (F) Western blot probed for LC3B of control U2OS cells, and U2OS cells expressing Halo-ATG13, Halo-ATG2, Halo-ULK1, or Halo-WIPI2 grown in complete media, or media lacking glucose in the absence and presence of bafilomycin. (G) Quantification of the LC3B-II band intensity of the western blots shown in D and E (three biological replicates, mean and standard deviation). (H) Quantification of the LC3B-II band intensity of the western blot shown in panel F (two biological replicates, mean and standard deviation). (I) Western blot probed for GABARAP of control U2OS cells, and U2OS cells expressing Halo-ATG13, Halo-ATG2, Halo-ULK1, or Halo-WIPI2 grown in complete media, or media lacking glucose in the absence and presence of bafilomycin. Source data are available for this figure: SourceData FS2.
U2OS cells expressing Halo-ATG13 (JFX650, left column, magenta in merge, right column) and GFP-P62 (middle column, green in merge, right column) imaged at 1 fps using widefield illumination and a Hamamatsu BT fusion camera (downsampled to pixel size of 370 nm) cultured in different media conditions (rows, top to bottom: complete media; no amino acids and FBS; no glucose). The movie is played back at 20× speed.
U2OS cells expressing Halo-ATG13 (JFX650, left column, magenta in merge, right column) and GFP-P62 (middle column, green in merge, right column) imaged at 1 fps using widefield illumination and a Hamamatsu BT fusion camera (downsampled to pixel size of 370 nm) cultured in different media conditions (rows, top to bottom: complete media; no amino acids and FBS; no glucose). The movie is played back at 20× speed.
Next, we examined the lifetime of autophagy protein foci to determine how the different nutrients affect the kinetics of autophagosome biogenesis (Fig. S2 and Fig. S3 A). We first determined the lifetime of LC3+ and LC3− autophagy factor foci. LC3− foci had a lifespan of ∼35 s for all proteins analyzed. In contrast, LC3+ foci autophagy factor foci lasted significantly longer, with lifetimes ranging from 75 to 90 s depending on the specific autophagy protein, consistent with our previous results (Broadbent et al., 2023). We only observed minimal changes in these lifetimes under the different nutrient conditions tested (Fig. S2 and Fig. S3 A).

K-FOCUS analysis of autophagy factor foci lifetimes. (A) Lifetimes of LC3B-positive and LC3B-negative trajectories of Halo-ATG13, ULK1-Halo, Halo-WIPI2, and Halo-ATG2A in different media conditions. (B) Lifetimes of LC3B-positive Halo-ATG13, ULK1-Halo, Halo-WIPI2, and Halo-ATG2A trajectories before and during colocalization with LC3B in different media conditions.

K-FOCUS analysis of autophagy factor foci lifetimes. (A) Lifetimes of LC3B-positive and LC3B-negative trajectories of Halo-ATG13, ULK1-Halo, Halo-WIPI2, and Halo-ATG2A in different media conditions. (B) Lifetimes of LC3B-positive Halo-ATG13, ULK1-Halo, Halo-WIPI2, and Halo-ATG2A trajectories before and during colocalization with LC3B in different media conditions.
In our imaging experiments, we can analyze four distinct steps of autophagosome biogenesis: the accumulation of autophagy proteins (ATG signal only), the appearance of LC3 (ATG and LC3 signal colocalization), the dissociation of autophagy factors (LC3 signal only), and the disappearance of LC3 signal due to fusion of the autophagosome with the lysosome (Broadbent et al., 2023). To define how these critical steps in the autophagosome life cycle are regulated by nutrient availability, we determined their duration under the different media conditions (Fig. S3 B). The time from autophagy protein foci formation to GFP-LC3 signal appearance was ∼25 s for Halo-ATG13, ULK1-Halo, and Halo-WIPI2, while Halo-ATG2A exhibited a longer delay of ∼45 s (Fig. S3 B). Similar to the overall autophagy protein foci lifetime, we observed only marginal changes in the pre-colocalization and LC3-colocalization lifetimes under different nutrient conditions (Fig. S3 B).
To confirm that the downsampling of the movies from 108.3 to 370 nm did not affect conclusions, we also analyzed the data after 2 × 2 binning of the movies leading to an effective pixel size of 217 nm (Fig. S4, D and E). Analysis of the data in the 2 × 2 binned format, which substantially increased the computational time, led to the same conclusion, with the only difference being a reduction in the total number of autophagy foci that overlapped with GFP-LC3, suggesting that the smaller pixel size makes the analysis more stringent, potentially leading to false negatives (Fig. S4 D). Because we require tracks to be in close proximity for 10 consecutive imaging frames, false positive colocalizations are highly unlikely.

Analysis of LC3B G120A aggregates, colocalization of Halo-ATG13 with GFP-P62, and assessment of alternate data processing. (A) K-FOCUS analysis of Halo-ATG13 colocalization with GFP-LC3B G120A expressed by viral transduction in cells grown in complete media, media lacking amino acids and FBS, or media lacking glucose. (B) K-FOCUS analysis of Halo-ATG13 colocalization with stably expressed GFP-P62 in cells grown in complete media, media lacking amino acids and FBS, or media lacking glucose. (C) Quantification of colocalization kinetics of single cells in Fig. 3 A and Fig. S1 using K-FOCUS including total, colocalized, and non-colocalized phagophore formation rates. Data was binned 2 × 2 to a pixel size of 217 nm. (D) Quantified fractions of LC3+ foci/cell from imaging in Fig. 3 A and Fig. S1. For B, C, and D, the box indicates the interquartile range, the whiskers the 10–90% confidence interval, the square indicates the average, and the horizontal line is the median. Statistical significance was assessed by one-way ANOVA. The letter assignments denote statistically significant differences among groups at P = 0.05, as determined by a Bonferroni post-hoc test.

Analysis of LC3B G120A aggregates, colocalization of Halo-ATG13 with GFP-P62, and assessment of alternate data processing. (A) K-FOCUS analysis of Halo-ATG13 colocalization with GFP-LC3B G120A expressed by viral transduction in cells grown in complete media, media lacking amino acids and FBS, or media lacking glucose. (B) K-FOCUS analysis of Halo-ATG13 colocalization with stably expressed GFP-P62 in cells grown in complete media, media lacking amino acids and FBS, or media lacking glucose. (C) Quantification of colocalization kinetics of single cells in Fig. 3 A and Fig. S1 using K-FOCUS including total, colocalized, and non-colocalized phagophore formation rates. Data was binned 2 × 2 to a pixel size of 217 nm. (D) Quantified fractions of LC3+ foci/cell from imaging in Fig. 3 A and Fig. S1. For B, C, and D, the box indicates the interquartile range, the whiskers the 10–90% confidence interval, the square indicates the average, and the horizontal line is the median. Statistical significance was assessed by one-way ANOVA. The letter assignments denote statistically significant differences among groups at P = 0.05, as determined by a Bonferroni post-hoc test.
In total, these observations confirm that the rate of autophagosome formation is increased by amino acid and FBS withdrawal. In addition, our results demonstrate that glucose withdrawal significantly inhibits the maturation of autophagy factor foci into LC3-containing autophagosomes without dramatically changing the rate of phagophore initiation, leading to an overall downregulation of autophagosome biogenesis.
Activation of AMPK downregulates autophagy
In cultured eukaryotic cells, glucose availability is directly linked to ATP levels primarily by its metabolism via glycolysis and the citric acid cycle (Shaw, 2006). ATP levels are sensed by the AMPK, a protein kinase complex that is activated by a high AMP-to-ATP ratio (Lin and Hardie, 2018). The regulation of autophagy by AMPK signaling is unclear with several studies suggesting AMPK activation promotes autophagy (Karabiyik et al., 2021), while others suggest it has an inhibitory effect on autophagosome formation (Ramírez-Peinado et al., 2013; Park et al., 2023). To determine whether the reduction in autophagosome maturation, observed in the absence of glucose, is mediated by AMPK signaling, we first determined whether AMPK is activated when glucose is removed from the growth media. We observed increased phosphorylation of ULK1 at S556, which is targeted by AMPK, in all of our cell lines (Fig. S5 A), consistent with AMPK activation under our experimental conditions. Next, we used two small molecules to modulate AMPK activity. The AMPK agonist MK8722, a pan-AMPK allosteric activator, was used to stimulate AMPK in the presence of glucose (Feng et al., 2017). Conversely, the potent and selective AMPK inhibitor BAY3827 was used to reduce AMPK activity in the absence of glucose (Lemos et al., 2021). Cells were treated with either the AMPK agonist or antagonist for 18 h, followed by nutrient starvation (amino acid and FBS withdrawal, with glucose for the AMPK agonist, without glucose for the AMPK antagonist) and either continued treatment with the drug or its removal. Importantly, we used a concentration of 1 μM MK8722 and BAY3827, which is substantially lower than the 10–50 µM used in other studies (Park et al., 2023; Wang et al., 2021; Myers et al., 2017; Zhu et al., 2023, Preprint). The efficacy of the 1 μM MK8722 and BAY3827 in modulating AMPK activity was confirmed by analyzing ULK1 at S556. At a concentration of 1 µM, BAY3827 robustly inhibited AMPK activity in media lacking glucose (Fig. S5 B). Similarly, 1 µM of MK8722 led to AMPK activation in complete media (Fig. S5 C). In cells cultured in glucose-containing media, the presence of the AMPK agonist led to a significant decrease in the formation rate of LC3-positive autophagy factor foci in all four cell lines (Fig. 4 A and Fig. S5 D; and Videos 9 and 10). Consequently, the fraction of autophagy factor foci that matured into LC3+ containing autophagosomes was reduced by AMPK stimulation in all HaloTagged cell lines, with the exception of ULK1-Halo (Fig. 4 A). When AMPK was inhibited in cells cultured in the absence of glucose, we observed a significant increase in the formation rate of LC3-positive autophagy factor foci across all cell lines, without affecting the formation of aborted autophagosomes (Fig. 4 B and Fig. S5 D; and Videos 11 and 12). As a result, the fraction of LC3-positive foci was increased when AMPK was inhibited (Fig. 4 B).
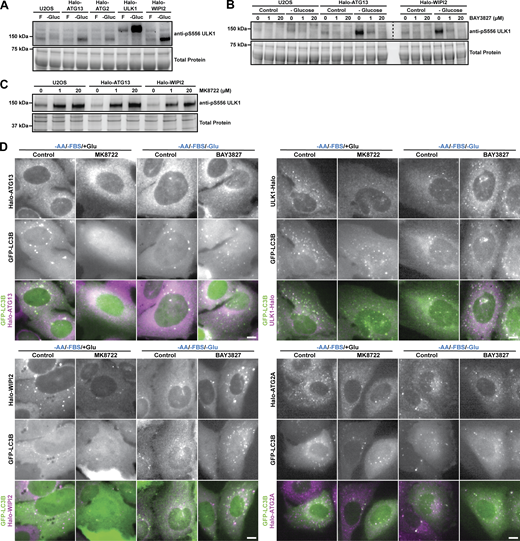
AMPK inhibits autophagosome maturation. (A) Western blots probed for ULK1 phosphorylated at S556 of control U2OS cells, and U2OS cells expressing Halo-ATG13, Halo-ATG2, Halo-ULK1, or Halo-WIPI2 grown in complete media, or media lacking glucose. (B) Western blots probed for ULK1 phosphorylated at S556 of control U2OS cells, and U2OS cells expressing Halo-ATG13, or Halo-WIPI2 grown in complete media, or media lacking glucose in the absence or presence of 1 µM or 20 µM of the AMPK inhibitor BAY3827. Total protein staining was carried out prior to protein transfer onto a nitrocellulose membrane and the membrane was cut into two pieces for western blot procedures. Both membrane pieces were stained in the same dish and exposed simultaneously. (C) Western blots probed for ULK1 phosphorylated at S556 of control U2OS cells, and U2OS cells expressing Halo-ATG13, or Halo-WIPI2 grown in complete media, in the absence and presence of 1 µM or 20 µM of the AMPK activator MK8722. (D) Live-cell images of ULK1-Halo, Halo-ATG13, or Halo-ATG2A and GFP-LC3B in the indicated media conditions in the presence and absence of the AMPK activator MK8722 or the AMPK inhibitor BAY3827 (scale bar = 5 µm). Source data are available for this figure: SourceData FS5.

AMPK inhibits autophagosome maturation. (A) Western blots probed for ULK1 phosphorylated at S556 of control U2OS cells, and U2OS cells expressing Halo-ATG13, Halo-ATG2, Halo-ULK1, or Halo-WIPI2 grown in complete media, or media lacking glucose. (B) Western blots probed for ULK1 phosphorylated at S556 of control U2OS cells, and U2OS cells expressing Halo-ATG13, or Halo-WIPI2 grown in complete media, or media lacking glucose in the absence or presence of 1 µM or 20 µM of the AMPK inhibitor BAY3827. Total protein staining was carried out prior to protein transfer onto a nitrocellulose membrane and the membrane was cut into two pieces for western blot procedures. Both membrane pieces were stained in the same dish and exposed simultaneously. (C) Western blots probed for ULK1 phosphorylated at S556 of control U2OS cells, and U2OS cells expressing Halo-ATG13, or Halo-WIPI2 grown in complete media, in the absence and presence of 1 µM or 20 µM of the AMPK activator MK8722. (D) Live-cell images of ULK1-Halo, Halo-ATG13, or Halo-ATG2A and GFP-LC3B in the indicated media conditions in the presence and absence of the AMPK activator MK8722 or the AMPK inhibitor BAY3827 (scale bar = 5 µm). Source data are available for this figure: SourceData FS5.

AMPK activation inhibits autophagosome maturation. (A) Formation rate and conversion ratio of LC3-positive and LC3-negative foci formed by Halo-ATG13, ULK1-Halo, Halo-WIPI2, and Halo-ATG2A in glucose-containing media in the absence and presence of the AMPK agonist MK8722. (B) Formation rate and conversion ratio of LC3-positive and LC3-negative foci formed by Halo-ATG13, ULK1-Halo, Halo-WIPI2, and Halo-ATG2A in media containing no glucose in the absence and presence of the AMPK inhibitor BAY3827. (C) Lifetimes of foci formed by Halo-ATG13, ULK1-Halo, Halo-WIPI2, and Halo-ATG2A before and during colocalization with GFP-LC3B in glucose-containing media in the presence and absence of the AMPK agonist MK8722 (left panels) or in media lacking glucose in in the absence and presence of the AMPK inhibitor BAY3827 (right panels). For all plots the box indicates the interquartile range, the whiskers the 10–90% confidence interval, the square indicates the average, and the horizontal line is the median; statistical significance was assessed by a two-tailed t-test.
AMPK activation inhibits autophagosome maturation. (A) Formation rate and conversion ratio of LC3-positive and LC3-negative foci formed by Halo-ATG13, ULK1-Halo, Halo-WIPI2, and Halo-ATG2A in glucose-containing media in the absence and presence of the AMPK agonist MK8722. (B) Formation rate and conversion ratio of LC3-positive and LC3-negative foci formed by Halo-ATG13, ULK1-Halo, Halo-WIPI2, and Halo-ATG2A in media containing no glucose in the absence and presence of the AMPK inhibitor BAY3827. (C) Lifetimes of foci formed by Halo-ATG13, ULK1-Halo, Halo-WIPI2, and Halo-ATG2A before and during colocalization with GFP-LC3B in glucose-containing media in the presence and absence of the AMPK agonist MK8722 (left panels) or in media lacking glucose in in the absence and presence of the AMPK inhibitor BAY3827 (right panels). For all plots the box indicates the interquartile range, the whiskers the 10–90% confidence interval, the square indicates the average, and the horizontal line is the median; statistical significance was assessed by a two-tailed t-test.
U2OS cells expressing Halo-ATG13 and GFP-LC3B (top row), Halo-ULK1 and GFP-LC3B (second row from the top), Halo-WIPI2 and GFP-LC3B (third row from the top), and Halo-ATG2A and GFP-LC3B (bottom row) in media lacking amino acids and FBS but in the presence of glucose without the AMPK agonist MK8722. Imaged at 1 fps using widefield illumination and a Hamamatsu BT fusion camera (downsampled to pixel size of 370 nm). HaloTagged protein in the left column (magenta in the merge, right column) and GFP-LC3B in the middle column (green in the merge, right column). The movie is played back at 20× speed.
U2OS cells expressing Halo-ATG13 and GFP-LC3B (top row), Halo-ULK1 and GFP-LC3B (second row from the top), Halo-WIPI2 and GFP-LC3B (third row from the top), and Halo-ATG2A and GFP-LC3B (bottom row) in media lacking amino acids and FBS but in the presence of glucose without the AMPK agonist MK8722. Imaged at 1 fps using widefield illumination and a Hamamatsu BT fusion camera (downsampled to pixel size of 370 nm). HaloTagged protein in the left column (magenta in the merge, right column) and GFP-LC3B in the middle column (green in the merge, right column). The movie is played back at 20× speed.
U2OS cells expressing Halo-ATG13 and GFP-LC3B (top row), Halo-ULK1 and GFP-LC3B (second row from the top), Halo-WIPI2 and GFP-LC3B (third row from the top), and Halo-ATG2A and GFP-LC3B (bottom row) in media lacking amino acids and FBS but in the presence of glucose with the AMPK agonist MK8722. Imaged at 1 fps using widefield illumination and a Hamamatsu BT fusion camera (downsampled to pixel size of 370 nm). HaloTagged protein in the left column (magenta in the merge, right column) and GFP-LC3B in the middle column (green in the merge, right column). The movie is played back at 20× speed.
U2OS cells expressing Halo-ATG13 and GFP-LC3B (top row), Halo-ULK1 and GFP-LC3B (second row from the top), Halo-WIPI2 and GFP-LC3B (third row from the top), and Halo-ATG2A and GFP-LC3B (bottom row) in media lacking amino acids and FBS but in the presence of glucose with the AMPK agonist MK8722. Imaged at 1 fps using widefield illumination and a Hamamatsu BT fusion camera (downsampled to pixel size of 370 nm). HaloTagged protein in the left column (magenta in the merge, right column) and GFP-LC3B in the middle column (green in the merge, right column). The movie is played back at 20× speed.
U2OS cells expressing Halo-ATG13 and GFP-LC3B (top row), Halo-ULK1 and GFP-LC3B (second row from the top), Halo-WIPI2 and GFP-LC3B (third row from the top), and Halo-ATG2A and GFP-LC3B (bottom row) in media lacking amino acids, FBS, and glucose without the AMPK inhibitor BAY3827. Imaged at 1 fps using widefield illumination and a Hamamatsu BT fusion camera (downsampled to pixel size of 370 nm). HaloTagged protein in the left column (magenta in the merge, right column) and GFP-LC3B in the middle column (green in the merge, right column). The movie is played back at 20× speed.
U2OS cells expressing Halo-ATG13 and GFP-LC3B (top row), Halo-ULK1 and GFP-LC3B (second row from the top), Halo-WIPI2 and GFP-LC3B (third row from the top), and Halo-ATG2A and GFP-LC3B (bottom row) in media lacking amino acids, FBS, and glucose without the AMPK inhibitor BAY3827. Imaged at 1 fps using widefield illumination and a Hamamatsu BT fusion camera (downsampled to pixel size of 370 nm). HaloTagged protein in the left column (magenta in the merge, right column) and GFP-LC3B in the middle column (green in the merge, right column). The movie is played back at 20× speed.
U2OS cells expressing Halo-ATG13 and GFP-LC3B (top row), Halo-ULK1 and GFP-LC3B (second row from the top), Halo-WIPI2 and GFP-LC3B (third row from the top), and Halo-ATG2A and GFP-LC3B (bottom row) in media lacking amino acids, FBS, and glucose with the AMPK inhibitor BAY3827. Imaged at 1 fps using widefield illumination and a Hamamatsu BT fusion camera (downsampled to pixel size of 370 nm). HaloTagged protein in the left column (magenta in the merge, right column) and GFP-LC3B in the middle column (green in the merge, right column). The movie is played back at 20× speed.
U2OS cells expressing Halo-ATG13 and GFP-LC3B (top row), Halo-ULK1 and GFP-LC3B (second row from the top), Halo-WIPI2 and GFP-LC3B (third row from the top), and Halo-ATG2A and GFP-LC3B (bottom row) in media lacking amino acids, FBS, and glucose with the AMPK inhibitor BAY3827. Imaged at 1 fps using widefield illumination and a Hamamatsu BT fusion camera (downsampled to pixel size of 370 nm). HaloTagged protein in the left column (magenta in the merge, right column) and GFP-LC3B in the middle column (green in the merge, right column). The movie is played back at 20× speed.
We further investigated whether direct modulation of AMPK activity would alter the biogenesis of autophagy factor foci by analyzing their lifetimes. Similar to the findings under nutrient starvation (Fig. S3), we observed only minimal changes in the lifetime of autophagosome foci when AMPK was activated or inhibited with a small molecule drug (Fig. 4 C), except for a reduction in the duration of LC3-colocalization with Halo-ATG2A and Halo-WIPI2 (from ∼100 to ∼75 s) when AMPK was inhibited with BAY3827 (Fig. 4 C). This finding suggests that inhibition of AMPK signaling may increase the rate of phagophore expansion by ATG2 or LC3 conjugation mediated by WIPI2, shortening the time of autophagosome maturation.
Taken together, these experiments support the hypothesis that the decrease of autophagosome maturation observed under glucose starvation is directly mediated by AMPK signaling and further suggest that inhibition of AMPK activity can increase the efficiency of autophagosome formation. Furthermore, our results suggest that ATG2A activity and therefore tethering of the phagophore to a lipid donor membrane could be a critical target of AMPK signaling.
ULK1 is required for ATG13 recruitment to phagophores after glucose starvation
While the formation of LC3-positive autophagosomes is inhibited by glucose withdrawal or AMPK activation, the formation of ATG13 foci is stimulated to a similar degree by amino acid and FBS starvation as glucose removal (Fig. 3 B). Importantly, the vast majority (>90%) of ATG13 foci formed under glucose starvation are short-lived (∼30 s) (Fig. 3 C and Fig. S3). To define the role of the ULK1 complex in ATG13 foci formation in the absence of glucose, we imaged previously established Halo-ATG13 cell lines in which either ULK1, FIP200, or ATG101 were knocked out (Videos 13, 14, and 15) (Broadbent et al., 2023). The number of LC3-positive ATG13 foci was strongly reduced in ULK1, FIP200, and ATG101 knock-out cells compared with wildtype controls after the removal of amino acids and FBS or glucose (Fig. 5 A), consistent with the reduction in LC3 conjugation we previously observed in these cell lines (Broadbent et al., 2023). In contrast, the formation of short-lived LC3-negative Halo-ATG13 foci was increased in the absence of amino acids and FBS when ULK1, FIP200, or ATG101 were knocked out (Fig. 5 A). In our prior study, we observed a strong reduction in Halo-ATG13 foci in ULK1, FIP200, or ATG101 knock-out cells. However, in these experiments, cells were only imaged every 15 s, which did not allow us to detect these short-lived Halo-ATG13 foci (Broadbent et al., 2023). Under glucose starvation, the number of Halo-ATG13 foci was elevated in control cells, FIP200, and ATG101 knock-out cells (Fig. 5 A). However, glucose removal did not lead to an increase in Halo-ATG13 foci in ULK1 knock-out cells (Fig. 5 A). The lifetimes of LC3B-positive and LC3B-negative Halo-ATG13 foci were largely unaffected by the knockout of ULK1, FIP200, or ATG101 in all media conditions (Fig. 5 B). Together, these observations suggest that ATG13 recruitment to the phagophore must be one of the first events in autophagosome biogenesis and its response to glucose starvation requires ULK1 but not ATG101 or FIP200.
U2OS cells with a ULK1 knockout expressing Halo-ATG13 (JFX650, left column, magenta in merge, right column) and GFP-LC3B (middle column, green in merge left column) imaged at 1 fps using widefield illumination and a Hamamatsu BT fusion camera (downsampled to pixel size of 370 nm) cultured in different media conditions (rows, top to bottom: complete media; no amino acids and FBS; no glucose). The movie is played back at 20× speed.
U2OS cells with a ULK1 knockout expressing Halo-ATG13 (JFX650, left column, magenta in merge, right column) and GFP-LC3B (middle column, green in merge left column) imaged at 1 fps using widefield illumination and a Hamamatsu BT fusion camera (downsampled to pixel size of 370 nm) cultured in different media conditions (rows, top to bottom: complete media; no amino acids and FBS; no glucose). The movie is played back at 20× speed.
U2OS cells with a FIP200 knockout expressing Halo-ATG13 (JFX650, left column, magenta in merge, right column) and GFP-LC3B (middle column, green in merge left column) imaged at 1 fps using widefield illumination and a Hamamatsu BT fusion camera (downsampled to pixel size of 370 nm) cultured in different media conditions (rows, top to bottom: complete media; no amino acids and FBS; no glucose). The movie is played back at 20× speed.
U2OS cells with a FIP200 knockout expressing Halo-ATG13 (JFX650, left column, magenta in merge, right column) and GFP-LC3B (middle column, green in merge left column) imaged at 1 fps using widefield illumination and a Hamamatsu BT fusion camera (downsampled to pixel size of 370 nm) cultured in different media conditions (rows, top to bottom: complete media; no amino acids and FBS; no glucose). The movie is played back at 20× speed.
U2OS cells with a ATG101 knockout expressing Halo-ATG13 (JFX650, left column, magenta in merge, right column) and GFP-LC3B (middle column, green in merge left column) imaged at 1 fps using widefield illumination and a Hamamatsu BT fusion camera (downsampled to pixel size of 370 nm) cultured in different media conditions (rows, top to bottom: complete media; no amino acids and FBS; no glucose). The movie is played back at 20× speed.
U2OS cells with a ATG101 knockout expressing Halo-ATG13 (JFX650, left column, magenta in merge, right column) and GFP-LC3B (middle column, green in merge left column) imaged at 1 fps using widefield illumination and a Hamamatsu BT fusion camera (downsampled to pixel size of 370 nm) cultured in different media conditions (rows, top to bottom: complete media; no amino acids and FBS; no glucose). The movie is played back at 20× speed.

Contribution of the ULK1 complex to starvation-induced autophagy protein foci formation. (A) Formation rate of total, LC3B-positive, and LC3B-negative Halo-ATG13 foci in control, ULK1, FIP200, and ATG101 knock-out cells in various media conditions. (B) Lifetimes of LCB3-positive and LC3B-negative Halo-ATG13 foci in control, ULK1, FIP200, and ATG101 knock-out cells in various media conditions. Statistical significance was assessed by one-way ANOVA. The letter assignments denote statistically significant differences among groups at P = 0.05, as determined by a Bonferroni post-hoc test.
Contribution of the ULK1 complex to starvation-induced autophagy protein foci formation. (A) Formation rate of total, LC3B-positive, and LC3B-negative Halo-ATG13 foci in control, ULK1, FIP200, and ATG101 knock-out cells in various media conditions. (B) Lifetimes of LCB3-positive and LC3B-negative Halo-ATG13 foci in control, ULK1, FIP200, and ATG101 knock-out cells in various media conditions. Statistical significance was assessed by one-way ANOVA. The letter assignments denote statistically significant differences among groups at P = 0.05, as determined by a Bonferroni post-hoc test.
AMPK modulates the membrane tethering of WIPI2-positive phagophores
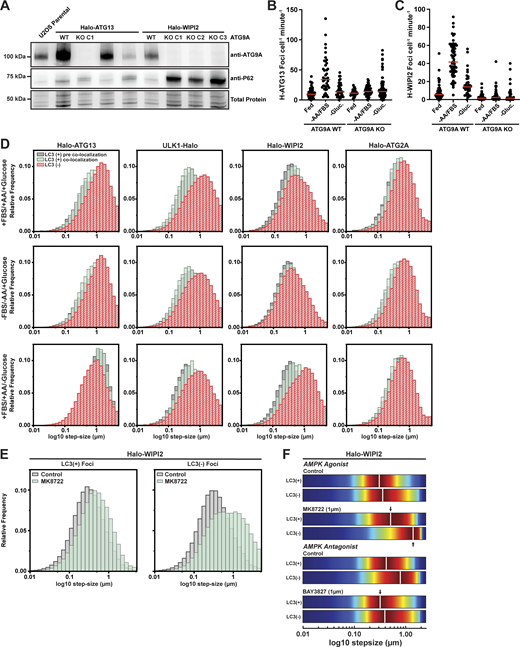
An emerging model for autophagosome formation in human cells is the “vesicle seeding” model (Melia, 2023; Broadbent et al., 2023; Olivas et al., 2023; Sawa-Makarska et al., 2020; Cook and Hurley, 2023). In this model, an ATG9 vesicle is tethered to the phagophore initiation site by ATG2A. We have previously demonstrated that many autophagy factors, except ATG2A, accumulate on mobile structures consistent with ATG9 vesicles (Broadbent et al., 2023). Using single-particle tracking, we have demonstrated that ATG9A vesicles exist in an untethered and tethered state with distinct diffusion properties (i.e., movement distances from frame to frame, Fig. 6 A) (Broadbent et al., 2023). Our observations described in this study suggest that AMPK signaling could modulate this critical tethering step (Fig. 4 C). To test whether foci formed by Halo-ATG13 and Halo-WIPI2 depended on ATG9A vesicles, we knocked out ATG9A (Fig. S6 A) and imaged cells on a highly sensitive spinning disc confocal microscope. In the absence of ATG9A, Halo-ATG13 formed a small number of foci under all conditions, but the increase in Halo-ATG13 foci formed in control cells when amino acids were removed and FBS from the media was eliminated (Fig. S6 B and Video 16). This suggests that Halo-ATG13 forms foci independently of ATG9A under basal conditions but requires ATG9A for its recruitment to phagophores seeded by ATG9A vesicles when autophagy is induced. Halo-WIPI2 foci formation was completely eliminated under all media conditions in the absence of ATG9A (Fig. S6 C and Video 17), which is consistent with the model that WIPI2 foci assemble exclusively on ATG9A vesicles. Similarly, our previous work demonstrated that Halo-ATG2A foci formation requires ATG9A (Broadbent et al., 2023). To investigate the role of AMPK signaling in vesicle tethering, we examined the mobility of autophagy factor foci under control and starvation conditions (−AA/−FBS/+Glucose and +AA/+FBS/−Glucose). Analysis of the step size distribution of autophagy factor trajectories allowed us to assess the mobility of the underlying cellular structure (Fig. 6 A). The step size distribution aborted phagophores (i.e., autophagy foci that never colocalize with LC3) and committed autophagosomes (i.e., autophagy foci that colocalize with LC3) are distinct. The step size distribution of LC3-positive autophagy foci was shifted toward smaller step sizes, which reflects their association with a donor membrane (Fig. 6, B–D; and Fig. S6 A). This shift toward smaller step sizes upon LC3 accumulation was most dramatic for ULK1 foci and was also observed for WIPI2 and ATG2 foci (Fig. 6, B–D; and Fig. S6 A). Surprisingly, the step size distribution of LC3-positive and -negative ATG13 foci was comparable (Fig. 6, B–D; and Fig. S6 D), suggesting that LC3 can accumulate on mobile ATG13-positive structures.

AMPK regulates the tethering of WIPI2-positive phagophores. (A) Model depicting the diffusion properties of tethered phagophores and untethered ATG9 vesicles. (B and C) Step size distributions of Halo-ATG13, ULK1-Halo, Halo-WIPI2, and Halo-ATG2A trajectories for (B) LC3B-positive and (C) LC3B-negative autophagy factor foci. (D) Kernel density plots of the step size distributions of Halo-ATG13, ULK1-Halo, Halo-WIPI2, and Halo-ATG2A trajectories for LC3B-positive and -negative tracks in the indicated media conditions. The vertical white solid line represents the median of step size distribution. (E) Step size distributions of LC3B-positive and -negative Halo-WIPI2 trajectories fit with a two-state diffusion model (black line) encompassing tethered (red) and untethered (blue) populations in the different media conditions. (F) Diffusion coefficients of the tethered and untethered populations of LC3B-positive and -negative Halo-WIPI2 trajectories in the different media conditions, derived from the fits shown in E. (G) Distribution of LC3B-positive and -negative Halo-WIPI2 trajectories between tethered and untethered populations, derived from the fits shown in E. Statistical significance was assessed using a two-tailed t-test (*P < 0.05, **P < 0.01).
AMPK regulates the tethering of WIPI2-positive phagophores. (A) Model depicting the diffusion properties of tethered phagophores and untethered ATG9 vesicles. (B and C) Step size distributions of Halo-ATG13, ULK1-Halo, Halo-WIPI2, and Halo-ATG2A trajectories for (B) LC3B-positive and (C) LC3B-negative autophagy factor foci. (D) Kernel density plots of the step size distributions of Halo-ATG13, ULK1-Halo, Halo-WIPI2, and Halo-ATG2A trajectories for LC3B-positive and -negative tracks in the indicated media conditions. The vertical white solid line represents the median of step size distribution. (E) Step size distributions of LC3B-positive and -negative Halo-WIPI2 trajectories fit with a two-state diffusion model (black line) encompassing tethered (red) and untethered (blue) populations in the different media conditions. (F) Diffusion coefficients of the tethered and untethered populations of LC3B-positive and -negative Halo-WIPI2 trajectories in the different media conditions, derived from the fits shown in E. (G) Distribution of LC3B-positive and -negative Halo-WIPI2 trajectories between tethered and untethered populations, derived from the fits shown in E. Statistical significance was assessed using a two-tailed t-test (*P < 0.05, **P < 0.01).
Diffusion dynamics of autophagy factor foci. (A) Western blots probed for ATG9A of control U2OS cells and clonal U2OS cells expressing Halo-ATG13 or Halo-WIPI2 that were transfected with Cas9 and sgRNAs targeting the ATG9A gene. (B) TrackIt analysis of Halo-ATG13 foci in control cells and ATG9A knock-out cells grown in control media, media lacking amino acids and FBS, or media lacking glucose. The red solid line indicates the median. (C) TrackIt analysis of Halo-WIPI2 foci in control cells and ATG9A knock-out cells grown in control media, media lacking amino acids and FBS, or media lacking glucose. The red solid line indicates the median. (D) Step size distributions of LC3B-negative and LC3B-positive autophagy factor trajectories before and during colocalization with LC3B in indicated media conditions. (E) Step size distributions of LC3B-negative and LC3B-positive Halo-WIPI2 foci in the presence and absence of the AMPK agonist MK8722. (F) Kernel density plot of the step size distribution of LC3B-negative and LC3B-positive Halo-WIPI2 foci in the presence and absence of the AMPK agonist MK8722 (in media with glucose) or the presence and absence of the AMPK inhibitor BAY3827 (in media lacking glucose). Source data are available for this figure: SourceData FS6.

Diffusion dynamics of autophagy factor foci. (A) Western blots probed for ATG9A of control U2OS cells and clonal U2OS cells expressing Halo-ATG13 or Halo-WIPI2 that were transfected with Cas9 and sgRNAs targeting the ATG9A gene. (B) TrackIt analysis of Halo-ATG13 foci in control cells and ATG9A knock-out cells grown in control media, media lacking amino acids and FBS, or media lacking glucose. The red solid line indicates the median. (C) TrackIt analysis of Halo-WIPI2 foci in control cells and ATG9A knock-out cells grown in control media, media lacking amino acids and FBS, or media lacking glucose. The red solid line indicates the median. (D) Step size distributions of LC3B-negative and LC3B-positive autophagy factor trajectories before and during colocalization with LC3B in indicated media conditions. (E) Step size distributions of LC3B-negative and LC3B-positive Halo-WIPI2 foci in the presence and absence of the AMPK agonist MK8722. (F) Kernel density plot of the step size distribution of LC3B-negative and LC3B-positive Halo-WIPI2 foci in the presence and absence of the AMPK agonist MK8722 (in media with glucose) or the presence and absence of the AMPK inhibitor BAY3827 (in media lacking glucose). Source data are available for this figure: SourceData FS6.
Control (top row) and ATG9A knock-out (bottom row) U2OS cells expressing Halo-ATG13 (JFX650) imaged at 1 fps using spinning disc confocal imaging and a Hamamatsu ORCA Quest qCMOS camera (2 × 2 binning) cultured in different media conditions (columns, left to right: complete media; no amino acids and FBS; no glucose). The movie is played back at 20× speed.
Control (top row) and ATG9A knock-out (bottom row) U2OS cells expressing Halo-ATG13 (JFX650) imaged at 1 fps using spinning disc confocal imaging and a Hamamatsu ORCA Quest qCMOS camera (2 × 2 binning) cultured in different media conditions (columns, left to right: complete media; no amino acids and FBS; no glucose). The movie is played back at 20× speed.
Control (top row) and ATG9A knock-out (bottom row) U2OS cells expressing Halo-WIPI2 (JFX650) imaged at 1 fps using spinning disc confocal imaging and a Hamamatsu ORCA Quest qCMOS camera (2 × 2 binning) cultured in different media conditions (columns, left to right: complete media; no amino acids and FBS; no glucose). The movie is played back at 20× speed.
Control (top row) and ATG9A knock-out (bottom row) U2OS cells expressing Halo-WIPI2 (JFX650) imaged at 1 fps using spinning disc confocal imaging and a Hamamatsu ORCA Quest qCMOS camera (2 × 2 binning) cultured in different media conditions (columns, left to right: complete media; no amino acids and FBS; no glucose). The movie is played back at 20× speed.
Using these populations as a baseline, we determined the impact of nutrient starvation on the movement pattern of foci formed by each autophagy protein. To better visualize changes in step-size distributions, histograms were converted to 2D kernel density plots (Fig. 6 D and Fig. S6 D). Under control conditions, LC3-negative foci of ATG13 and ULK1 moved faster than LC3-negative foci formed by ULK1 and WIPI2 (Fig. 6 D and Fig. S6 D), which likely reflects their early recruitment to mobile ATG9 vesicles. The step size distributions of ATG13 and ULK1 foci diverge when LC3 has been recruited. LC3-positive ULK1 foci move with smaller step sizes, while LC3-positive ATG13 foci exhibit both a slow- and fast-moving population (Fig. 6 D and Fig. S6 D), as previously observed (Broadbent et al., 2023). ATG13 was the only protein analyzed that displayed a mobile population that colocalized with LC3, and it is unclear whether these structures reflect an autophagosome biogenesis intermediate or a distinct organelle not involved in non-selective autophagy. WIPI2 and ATG2A foci, on the other hand, contain slower populations in the presence and absence of LC3, which likely signifies that their recruitment closely coincides with ATG9 vesicle tethering, which might precede detectable LC3 conjugation. Amino acid and FBS (−AA/−FBS/+Glucose) or glucose (+AA/+FBS/−Glucose) withdrawal had little impact on the step size distributions of LC3-positive and LC3-negative ATG13, ULK1, and ATG2 foci (Fig. 6 D and Fig. S6 D). While amino acid and FBS withdrawal did not change the mobility of WIPI2 foci, the removal of glucose from the media led to a dramatic increase in the mobility of LC3-negative WIPI2 foci (Fig. 6 D and Fig. S6 D). AMPK activation in the presence of glucose mimicked this effect, and AMPK inhibition in the absence of glucose reduced WIPI2 foci mobility (Fig. S6, E and F). Importantly, the step size distribution of these mobile WIPI2-positive foci was comparable with ATG13 foci under the same conditions (Fig. 6 D and Fig. S6 D), with consistent accumulation of these factors on mobile ATG9 vesicles. These observations suggest that phagophores that are rapidly tethered upon WIPI2 recruitment fail to be immobilized upon glucose starvation or AMPK activation.
To quantify the tethering defect of WIPI2 foci in the absence of glucose, the step size distributions of foci trajectories were fit to Gaussian probability density functions to determine the diffusion coefficients and relative abundance of the tethered and untethered foci populations (Barnaba et al., 2017). This two-state model (tethered and untethered) fit the step size distribution with R2 > 0.98 in all cases, and the calculated diffusion coefficients closely aligned with those recently reported (Fig. 6, A, E, and F) (Broadbent et al., 2023). Upon triggering autophagy by removing amino acids and FBS, we observed a substantial reduction (∼50%) in the diffusion coefficients of tethered and untethered WIPI2 foci (Fig. 6 F). In contrast, glucose removal resulted in a significant increase in the mobility of untethered WIPI2 foci lacking LC3B signal (from D = 0.035 µm2 s−1 to D = 0.070 µm2 s−1). Furthermore, glucose depletion led to a noticeable rise in the fraction of untethered WIPI2 foci, increasing from 40% to ∼60% (Fig. 6 G). The distribution between untethered and tethered states of the other autophagy factors remained largely unchanged by amino acid and FBS or glucose withdrawal (Fig. S7).

Diffusion dynamics of autophagy factor foci. (A) Step size distributions of LC3B-positive and -negative ULK1-Halo, and Halo-ATG2A trajectories fit with a two-state diffusion model (black line) encompassing tethered (red) and untethered (blue) populations in the different media conditions. (B) Diffusion coefficients of the tethered and untethered populations of LC3B-positive and -negative ULK1-Halo, and Halo-ATG2A trajectories in the different media conditions, derived from the fits shown in Fig. S6 A. Statistical significance was assessed using a two-tailed t-test (*P < 0.05).

Diffusion dynamics of autophagy factor foci. (A) Step size distributions of LC3B-positive and -negative ULK1-Halo, and Halo-ATG2A trajectories fit with a two-state diffusion model (black line) encompassing tethered (red) and untethered (blue) populations in the different media conditions. (B) Diffusion coefficients of the tethered and untethered populations of LC3B-positive and -negative ULK1-Halo, and Halo-ATG2A trajectories in the different media conditions, derived from the fits shown in Fig. S6 A. Statistical significance was assessed using a two-tailed t-test (*P < 0.05).
In summary, these results suggest that AMPK exerts a negative regulatory influence on autophagy by directly impeding the membrane tethering process and WIPI2 accumulates on mobile ATG9 vesicles. Importantly, even though WIPI2 is recruited, it appears that LC3B conjugation does not detectably take place under these circumstances.
Discussion
In this study, we demonstrate that glucose starvation causes inhibition of autophagosome maturation, but not its initiation, in a human cancer cell model. Pivotal for this discovery is the implementation of K-FOCUS, a computational pipeline to quantitatively analyze multicolor live-cell imaging data. Our research offers mechanistic insights into the role of AMPK in regulating autophagosome maturation. These findings not only enhance our understanding of cellular responses to nutrient stress but also have implications for drug discovery efforts targeting AMPK, as modulating autophagosome maturation could be a promising avenue for therapeutic interventions in various diseases.
Glucose starvation inhibits autophagosome maturation via AMPK
The role of AMPK in autophagy has been the subject of extensive research over the last few decades. Following the discovery that ULK1 is a direct substrate of AMPK (Kim et al., 2011; Egan et al., 2011a, 2011b), a consensus has emerged, establishing AMPK as a metabolic checkpoint and direct autophagy modulator, alongside mTORC1 (Mihaylova and Shaw, 2011). According to these early studies, under nutrient-rich conditions, mTORC1 phosphorylates ULK1, disrupting its interaction with AMPK and thereby leading to the inactivation of ULK1. Conversely, when levels of ATP are low, AMPK activates ULK1 via direct phosphorylation on sites Ser317 and Ser777 (Kim et al., 2011; Egan et al., 2011a). A few years after the discovery of ULK1 as direct AMPK substrate, reports indicated that glucose starvation has a protective effect on both human (Ramírez-Peinado et al., 2013) and yeast cells (Lang et al., 2014). Particularly, Ramírez-Peinado et al. (2013) showed that removal of glucose from the media did not induce autophagy flux in four different cell lines, measured by determining the number of LC3 foci formed and accumulation of P62 (Ramírez-Peinado et al., 2013). Moreover, depriving the cells of glucose during autophagy induction did not confer protection against necrosis and apoptosis (Ramírez-Peinado et al., 2013). Similarly, Nwadike et al. reported the suppression of autophagy under glucose starvation in mouse embryonic fibroblasts, both at the early and late stages of autophagy (Nwadike et al., 2018). These findings were further corroborated in a comprehensive study by Park et al. (2023) on the AMPK-driven changes in ULK1 phosphorylation leading to inhibition of autophagosome formation.
To reconcile the discrepancies concerning the role of AMPK in autophagy, especially at the early stages of phagophore initiation, we approached the problem from various experimental angles. First, we focused on improving the design of culture media conditions. To ensure that our results were not influenced by artifacts in commercial media, we utilized a consistent base for our media and systematically added nutrients. This approach aimed to clarify certain nuances that can affect experimental outcomes, such as the removal of not only glucose but also L-glutamine in previous work (Karabiyik et al., 2021). In addition, we developed a single-cell imaging analysis pipeline—K-FOCUS—to measure the kinetics of autophagosome formation in living cells. K-FOCUS allowed us to assess the impact of nutrient starvation on early autophagy stages, including phagophore initiation and the recruitment of LC3 conjugation machinery by monitoring the onset of LC3 on autophagy factor foci ATG13, ULK1, WIPI2, and ATG2A. Using K-FOCUS, we were able to distinguish between long-lived autophagosomes that show accumulation of LC3 (LC3-positive autophagosome) and short-lived LC3-negative autophagosome, or aborted autophagosomes, which represent the majority of autophagy protein foci formed in cells (Broadbent et al., 2023).
Our results demonstrate that glucose starvation causes a decrease in autophagy by impeding the maturation of the autophagosome. We observed this effect in all four of our genome-edited cell lines expressing different HaloTagged autophagy factors. Notably, the maturation rate of the small number of autophagosome that form in the absence of glucose is not affected under these conditions. While the formation of mature autophagosomes is reduced under glucose starvation, phagophore initiation, detected as short-lived autophagy factor foci, does not appear to be reduced, and might be increased for ATG13. Furthermore, the activation of AMPK using the agonist MK8722 mirrors the outcomes observed under glucose depletion, suggesting that AMPK is the driving force behind the observed reduction in autophagosome maturation when ATP availability is low. Our results contradict recent findings by Karabiyik et al. (2021) who observed an increase of ATG16L1 puncta under glucose removal or direct activation of AMPK. It is worth noting that the authors used media that in addition to glucose also lacked L-glutamine, a major carbon source for cell growth, which when absent is a known autophagy inducer (Zhu et al., 2015). To further substantiate the hypothesis that AMPK prevents autophagosome maturation, we inhibited AMPK using BAY3827, resulting in enhanced autophagosome formation in response to nutrient stress. Interestingly, the absence of glucose had no impact on the lifespan of aborted phagophores, and this trend remained consistent across all tested media conditions. Likewise, the lifespan of autophagosomes that exhibited LC3 accumulation remained unchanged, suggesting that AMPK’s effects occur prior to the recruitment of the LC3 conjugation machinery to the ATG9 vesicles.
ATG13 recruitment to phagophores is independent of ATG101 and FIP200
In the current model for autophagosome biogenesis, ATG9 vesicles recruit phagophore initiation factors to their surface, including the ULK1 complex comprised of ATG13, ULK1, FIP200, and ATG101 (Alers et al., 2011; McAlpine et al., 2013; Gammoh et al., 2013). This complex initiates PI3K-mediated phospholipid signaling, leading to the accumulation of PI3P and other signaling phospholipids on the membrane of ATG9 vesicles (Dikic and Elazar, 2018; Broadbent et al., 2023; Sawa-Makarska et al., 2020). Our data show that the removal of amino acids and/or glucose resulted in an increase in the number of ATG13 foci, suggesting that phagophore initiation is increased (Fig. 7). It has been shown that colocalization of the ULK1 complex with the phagophore requires the recruitment of both ATG13 and FIP200 (Alers et al., 2011; Mercer et al., 2009). In addition, PI3P signaling also promotes ATG13 recruitment to the phagophore via ATG13’s direct membrane binding (Popelka and Klionsky, 2017; Kannangara et al., 2021). Our findings indicate that ATG13 recruitment to ATG9 vesicles does not rely on ATG101, FIP200, or ULK1 since the number of ATG13 foci observed after autophagy induction is increased even when these three proteins are knocked out. Notably, both amino acid and glucose deprivation resulted in an increased ATG13-mediated phagophore formation in the knock-out cell lines when compared with the parental cell line. However, the glucose starvation–induced increase in the number of ATG13 foci was not observed in the ULK1 knockout. This suggests that ULK1 is required for the recruitment of ATG13 in response to AMPK activation, which might reflect the stabilized yet inactive form of the ULK1 complex recently identified by Park et al. in cells with active AMPK (Park et al., 2023). Importantly, in all ULK1 complex knock-out cell lines, we observed almost no mature LC3+ autophagosomes (<1 phagophore cell−1 min−1). The absence of long-lived autophagosomes is consistent with our previous report (Broadbent et al., 2023), and observations made by others (McAlpine et al., 2013), where loss of function of any of the ULK1 complex components impaired autophagy. It is important to note the absolute number of ATG13 foci formed after autophagy induction (∼30) is almost double that of the other autophagy factors tested (∼10–15), and ATG13 still forms foci in the absence of ATG9A. These observations indicate that ATG13 also accumulates at structures distinct from ATG9A containing vesicles, which might not be part of the autophagy pathway. ULK1 complex independent localization of ATG13 to phagophores is consistent with the recently observed direct interaction between ATG13 and ATG9 (Kannangara et al., 2021; Nguyen et al., 2023; Ren et al., 2023). This work also suggested that ATG13 binds to two distinct regions in ATG9, one independent of ATG101 and a second promoted by ATG101-induced conformational change in the HORMA domain of ATG13 (Nguyen et al., 2023; Ren et al., 2023). Our results demonstrate that ATG13 is recruited to phagophores in the absence of ATG101, potentially reflecting ATG13 binding to the ATG101 independent binding site on ATG9 (Fig. 7). The slow kinetics for this interaction observed in vitro (Nguyen et al., 2023) might be overcome by the high expression levels of ATG13 in cells (Broadbent et al., 2023), assuring that the number of ATG13 molecules in a conformation capable of binding ATG9 is sufficiently high at all times. Altogether our data suggest that ATG13 recruitment to the phagophore is one of the earliest events in autophagosome biogenesis, and both ATG9A and ULK1 can contribute to its localization to phagophores.

Model of the regulation of autophagosome biogenesis by AMPK. Glucose withdrawal leads to AMPK activation, which promotes the recruitment of ATG13 to mobile ATG9 vesicles. Under these conditions, WIPI2 also accumulates on ATG9 vesicles, but their tethering to donor membranes to allow phagophore maturation is inhibited by AMPK activation. The exact molecular targets of AMPK that prevent phagophore tethering are unknown.
Model of the regulation of autophagosome biogenesis by AMPK. Glucose withdrawal leads to AMPK activation, which promotes the recruitment of ATG13 to mobile ATG9 vesicles. Under these conditions, WIPI2 also accumulates on ATG9 vesicles, but their tethering to donor membranes to allow phagophore maturation is inhibited by AMPK activation. The exact molecular targets of AMPK that prevent phagophore tethering are unknown.
AMPK activation prevents tethering of mobile phagophores
Once primed as the seed for autophagosomes, ATG9 vesicles become tethered to the lipid source membrane by ATG2A (Broadbent et al., 2023; Olivas et al., 2023). ATG2A, a rod-shaped protein, facilitates lipid transfer from the membrane source to the vesicle, enabling its rapid expansion (Valverde et al., 2019; Osawa et al., 2019). The recruitment of ATG2A to the vesicle seed is mediated by WIPI3/4 (Osawa et al., 2019; Bakula et al., 2017), which recognizes PI3P enrichments on the vesicle membrane, and potentially by the ATG9–ATG13 complex (Fig. 7) (Nguyen et al., 2023). Once tethered, ATG2A-mediated lipid transfer enables the vesicle to assume the characteristic cup-shaped form of the phagophore, ready to engulf the cargo designated for degradation (Fig. 7) (Dikic and Elazar, 2018). Our previous work, employing single-particle tracking approaches, has demonstrated that the recruitment of the LC3 conjugation machinery takes place just prior to vesicle tethering, as evidenced by the similar mobility patterns of WIPI2 foci and ATG2A foci (Broadbent et al., 2023). WIPI2 plays a crucial role in facilitating the recruitment of the E3-like ligase ATG16-5-12 complex, thus enhancing LC3 conjugation (Fig. 7) (Dooley et al., 2014). Our results indicate that AMPK signaling inhibits autophagosome maturation by reducing vesicle tethering to the phagophore. We have previously shown that phagophores exist in two distinct mobility states. A tethered state (D = 0.002 µm2 s−1) and an untethered vesicle state (D = 0.02 µm2 s−1). Importantly, both populations were present in foci that colocalized with LC3 and those that did not, suggesting that vesicle tethering does not require LC3 conjugation. Among the autophagy-related proteins examined, WIPI2 foci exhibited altered mobility after glucose starvation and AMPK activation. Specifically, LC3-negative WIPI2 foci, which likely represent the step immediately preceding tethering, displayed significantly increased mobility when AMPK was activated. Importantly, WIPI2 foci formation is entirely dependent on ATG9A, demonstrating that the structures analyzed represent WIPI2 accumulating on ATG9 vesicles, which is consistent with previous observations by others (Turco et al., 2020, Preprint).
In total, our results support a model in which AMPK activation after glucose starvation leads to the accumulation of mobile phagophores bound by WIPI2, which fail to tether to donor membranes, leading to a reduction in autophagosome maturation. In contrast, when AMPK signaling is inhibited, we observed an increase in the rate of phagophore maturation, measured as a decrease in the time frame of LC3 colocalization with ATG2 and WIPI2. This suggests that phagophores exist in a primed state when AMPK is active and can be rapidly tethered to membranes to expand and mature into autophagosomes. This model is conceptually similar to that put forward by Park et al. (2023) based on their observations that AMPK inhibits the ULK1 complex, yet it prevents its components from being degraded. It might be advantageous for the cell to be able to rapidly respond to increasing energy levels by rapidly upregulating autophagy to provide building blocks for cell growth and proliferation. Future studies will have to address the precise target of AMPK that leads to the reduction of autophagosome maturation we observed in this study. It has been suggested that WIPI4, which can recruit ATG2 to phagophores, is a direct AMPK interactor that is released from the AMPK/ULK1 complex upon autophagy induction (Bakula et al., 2017). Another possibility is that AMPK regulates ATG9–ATG13-mediated ATG2 recruitment (Fig. 7).
A key unaddressed question is why AMPK activation simultaneously increases autophagy foci formation and inhibits autophagosome maturation. One explanation is that the primary function of non-selective autophagy is to provide molecular building blocks but not metabolites that can be shunted into ATP production. Autophagy consumes ATP during all its stages, and inhibition of autophagy could preserve ATP under conditions that lead to AMPK activation. At the same time, AMPK could increase the potency of early autophagy factors to facilitate targeted autophagy and maintain the ability to regulate mitochondrial function via mitophagy.
In summary, our study sheds light on the inhibitory role of AMPK signaling in autophagosome maturation during nutrient stress. Glucose starvation leads to a reduction in autophagosome maturation, a phenomenon consistently observed across multiple autophagy factor proteins. Importantly, this maturation rate is not influenced by the number of phagophores formed but by the accumulation of LC3-positive autophagosomes. Our results indicate that AMPK activation, whether triggered by glucose depletion or a pharmacological agonist, is a key driver of this inhibition. This observation contrasts with some previous reports but clarifies the intricate role of AMPK in autophagy regulation under nutrient stress. There is an emerging interest in activating AMPK to enhance brain energetics and thus prevent neurological diseases, including Parkinson’s and Huntington’s diseases (Demaré et al., 2021). In cancer, AMPK’s role remains a subject of intense debate, particularly because many cancers downregulate AMPK. This phenomenon appears counterintuitive, given AMPK’s putative role as an activator of catabolic pathways implicated in cancer growth and survival. To effectively target AMPK as a therapeutic approach, it will be critical to precisely define all of its contributions to regulating metabolic processes, including autophagy.
Materials and methods
Cell lines
All cell lines used in this study were derived from human bone osteosarcoma epithelial cells (U2OS, ATCC HTB-96). The monoclonal cell lines edited to express the HaloTag at the endogenous loci of the autophagy factors ATG13, WIPI2, ATG2A, ATG9A, and ULK1 were extensively characterized in our recent paper (Broadbent et al., 2023). The cell lines having knockouts of the genes belonging to the ULK1 complex (ULK1 KO, FIP200 KO, and ATG101 KO) were also previously characterized (Broadbent et al., 2023). ATG9A knock-out cells were generated by transfecting two plasmids encoding for Cas9 and a single guide RNA (sgRNA) (5′-CACTGAATACCAGCGCCTAG-3′, 5′-AGGATATTCGAGAGAAGAAT-3′) targeting the ATG9A locus alongside a plasmid encoding GFP into U2OS cells expressing Halo-ATG13 or Halo-WIPI2. Single-cell clones were generated by FACS sorting using the GFP signal to select transfected cells and ATG9A knockout was verified by western blotting. Cells were grown in RPMI cell culture media supplemented with 10% FBS, 100 U/ml penicillin, and 100 µg/ml streptomycin at 37°C with 5% CO2.
Plasmid construction and genome editing
The GFP-LC3B reporter was generated by cloning the coding sequences of LC3B into AAVS1-TRE3G-EGFP (AAVS1-TRE3G-EGFP was a gift from Su-Chun Zhang; plasmid #52343; Addgene; https://n2t.net/addgene:52343; RRID:Addgene_52343) including a TEV-protease cleavage site separating EGFP and LC3B (Qian et al., 2014). GFP-tagged LC3 were stably expressed to parental HaloTagged cell lines (Halo-ATG2, Halo-ATG13, Halo-WIPI2, and ULK1-Halo) and Halo-ATG13 knockouts (ULK1 KO, ATG101 KO, FIP200 KO) by introducing the coding sequence at the AAVS1 safe-harbor locus (PPP1R12C) by cotransfection of the donor plasmid encoding tetracycline inducible GFP-LC3B and a plasmid encoding Cas9 and a sgRNA targeting the AAVS1 locus (AAVS1 T2 CRIPR in pX330 was a gift from Masato Kanemaki; plasmid #72833; Addgene; https://n2t.net/addgene:72833; RRID:Addgene_72833) (Natsume et al., 2016). Polyclonal GFP-LC3B–expressing cell lines were obtained by selection with 0.5 µg/ml puromycin followed by FACS by selecting cells lying within the 75th–95th percentile of the GFP signal.
Preparation of growing media and treatment conditions
Autophagy flux was characterized in cells growing in five different media conditions. All media contained RPMI without amino acids, glucose, and glutamine (R9010-01; US Biological Life Sciences), that was supplemented as indicated with 10% dialyzed FBS (26400044; Thermo Fisher Scientific), 11 mM glucose (A24940-01; Thermo Fisher Scientific), and amino acids composed of 1 × MEM amino acids (11130051; Thermo Fisher Scientific) and 2 mM L-Glutamine (A2916801; Thermo Fisher Scientific). Media deprived of amino acids lacked both 1 × MEM amino acids and L-Glutamine and glucose-free media contained no glucose. In addition, we used media lacking FBS, MEM amino acids, and L-Glutamine, which is analogous to Earle's Balanced Salt Solution (EBSS), and media lacking all nutrients. For all experiments, media pH was adjusted to 7.2, and media were filtered and supplemented with 100 U/ml penicillin and 100 µg/ml streptomycin.
For the live-cell imaging experiments, 200,000 cells were seeded on glass coverslips (170 ± 5 μm, Schott) in control media. 24 h after seeding, cells were labeled with JFX650 (100 nM, 10 min), followed by dye bleeding (5 min); both steps were performed in control media. Afterward, cells were washed three times with PBS before being switched to the respective growing media conditions. The treatment duration for the different growing media conditions was 1 h, except for the no-glucose media, which had a treatment duration of 4 h prior to imaging. For studying autophagy response after AMPK activity modulation, the compounds MK8722 (AMPK agonist) and BAY3827 (AMPK antagonist) were used. We designed a treatment/release experiment to address how cells responded to nutrient deficiency in the presence (treatment) or absence (control) of drugs after acute exposure to the drug itself. Cells were seeded at lower confluency (100,000 cells) on glass coverslips (170 ± 5 μm, Schott); 24 h after seeding, media was substituted with 1 ml of complete media containing MK8722 (1 µM) or BAY3837 (1 µM). After 18 h of drug treatment, cells were labeled by adding 100 μl of media containing 1 µM of JFX650 (final labeling concentration 100 nM) for 10 min, followed by 5-min dye bleeding with control media supplemented with MK8722 (1 µM) or BAY3837 (1 µM). To analyze the response of cells to the AMPK agonist (MK8722), cells were washed three times with PBS and 1 ml of media deprived of amino acids and FBS (but not glucose) and supplemented with the agonist (1 µM) was added. For the control experiment, the media (−AA/−FBS/+Glucose) was not supplemented with the agonist and replaced with fresh media after 30 min to guarantee complete removal of the AMPK agonist. Cells were imaged after 1 h after the addition of agonist-containing or control media. To analyze the response of cells to the AMPK antagonist (BAY3837), an identical approach was used, the only difference being the starvation media, which did not contain any nutrient (−AA/−FBS/−Glucose). For each live-cell imaging experiment, three biological replicates were performed and analyzed, with a total of 90–150 cells imaged per experiment.
Autophagy flux assays
50,000 cells were seeded in 24-well plates 24 h prior to carrying out the autophagy flux assay in complete media. Cells were washed once with 1 ml of PBS prior to changing the media to various starvation media in the absence or presence of 100 nM bafilomycin. Amino acid and/or FBS withdrawal was carried out for 1 h and glucose starvation for 4 h. Cells were harvested by adding 50–75 μl of 1xSDS PAGE loading buffer directly to the plate after the media had been aspirated. 15–20 μl of the samples were loaded on a 4–20% Tris-Glycine Extended (TGX) stain-free gel and analyzed by western blotting.
Analysis of ULK1 phosphorylation after treatment with AMPK activator or inhibitor
50,000 cells were seeded in 24-well plates 24 h prior to carrying out the treatment with the AMPK activator and inhibitor in complete media. For treatment with the AMPK activator, cells were grown in complete media and treated with 1 µM or 20 µM of MK8722 for 1 h. For treatment with the AMPK inhibitor cells were first grown in complete media in the presence of 1 µM or 20 µM of BAY3837 for 1 h to assure complete AMPK inhibition. Cells were then switched to media lacking glucose or complete media as a control in maintaining 1 µM or 20 µM of BAY3837 for 4 h. Cells were harvested by adding 50–75 μl of 1xSDS PAGE loading buffer directly to the plate after the media had been aspirated. 25 μl of the samples were loaded on a 4–20% TGX stain-free gel and analyzed by western blotting.
Western blotting
The protein samples were separated on 4–15% (ATG9A, ULK1 pS556) or 4–20% (LC3B, GABARAP) TGX stain-free polyacrylamide gels (BioRad), and total protein staining and detection were carried out using the ChemiDoc imaging system (BioRad) using a 45-s activation time, and then the gels were transferred onto nitrocellulose (ATG9A, ULK1 pS556) or polyvinylidene difluoride (LC3B, GABARAP) membranes using a Turbo blotter (BioRad). Membranes were blocked with 3% BSA in PBS containing 0.05% Tween-20. Primary antibodies for LC3B (1:1,000, 3868; Cell Signaling), GABARAP (1:1,000, 26632; Cell Signaling), ATG9A (1:1,000, 13509; Cell Signaling), and ULK1 pS556 (1:1,000, 5869; Cell Signaling) were added to the membranes overnight at 4°C. Membranes were washed three times for 10 min with PBS containing 0.05% Tween-20 and exposed to HRP-coupled anti-rabbit secondary antibody (1:5,000, #31464; Invitrogen) for 1 h, washed again three times, and exposed using Supersignal Femto ECL reagent (Thermo Fisher Scientific) and a ChemiDoc imaging system (BioRad). Western blots were quantified using ImageQuant software (Cytiva). For the treatment of cell lysates with TEV, 500,000 cells were lysed in 100 μl of CHAPS lysis buffer (10 mM TRIS-HCl pH 7.5, 1 mM MgCl2, 1 mM EGTA, 0.5% CHAPS, 10% glycerol, and 5 mM β-mercaptoethanol) and split into two 50-μl samples, one of which was supplemented with 2 μl of TEV protease (NEB). Lysates were incubated on ice for 30 min and the equivalent of 50,000 cells was loaded onto an SDS-PAGE gel for analysis by western blot.
Flow cytometry
For the analysis of GFP-LC3B expression by flow cytometry, 100,000 cells were trypsinized and washed twice with PBS before resuspension of PBS and analysis on a BD Accuri C6.
Live-cell microscopy
Live cell imaging experiments were carried out using an Olympus microscope (IX83) with an X-Cite TURBO multiwavelength LED illumination system (Excelitas Technologies). The microscope is equipped with an environmental chamber (cellVivo) to control humidity, temperature, and CO2 level, a 60× total internal reflection fluorescence oil-immersion objective (Olympus UPlanApo, NA = 1.50), and the appropriate excitation and emission filters. The microscope is equipped with two Hamamatsu Orca Fusion BT sCMOS cameras attached to a Twin-cam beam splitter (Cairn Research). All live-cell imaging was carried out at 37°C and under 5% CO2-containing humidified air. For imaging the HaloTagged autophagy proteins labeled with JFX650 dye, the 630 nm LED source was set at 100% power. The GFP-edited autophagy marker LC3 was imaged with a 475 nm LED source at 30% laser power. Both optical settings led to negligible photobleaching across the entire experiment. Cells were imaged for 8 min total time at 1 s per frame (total number of frames = 480) with 50 ms exposure time for both LED sources. Alternatively, we used an i3 spinning disc confocal microscope equipped with a CSU-W1 confocal spinning disc system (Yokogawa), five laser lines (100 mW 445 nm, 150 mW 488 nm, 175 mW 515 nm, 160 mW 561 nm, and 140 mW 638 nm), a Prime 95B sCMOS camera (Photometrics) or an ORCA Quest qCMOS camera (Hamamatsu), a 63× oil-immersion objective (Zeiss C Plan-Apo, NA = 1.4), and an incubation chamber to control humidity, temperature, and CO2 level. All live-cell imaging was carried out at 37°C and under 5% CO2-containing humidified air. Before data analysis, images obtained with the Orca Fusion BT sCMOS camera were downsampled from 108 to 370 nm per pixel to increase computational efficiency using the ImageJ “size” function with the recommended settings of a constrained aspect ratio and bilinear downsampling with averaging. Control experiments were performed with lower 2 × 2 binning integrating gray values for an effective pixel size of 217 nm.
K-FOCUS imaging analysis pipeline
In the following sections, we will describe the K-FOCUS quantitative imaging pipeline with its three different steps: the CellPose-based segmentation step (Stringer et al., 2021), the autophagy factor foci tracking using TrackIT (Kuhn et al., 2021), and the foci codiffusion analysis algorithm.
Cellular segmentation using CellPose
CellPose was trained to segment U2OS cells stably expressing GFP-LC3 from the AAVS1 locus and Halo-ATG9A expressed from the endogenous ATG9 locus. For the GFP-LC3, a training set was generated by manually annotating >100 single-frame images obtained using the Olympus microscope described above. For Halo-ATG9A, single-frame images were obtained using the spinning disc confocal microscope described above. The manual annotation and generation of the models were performed in the GUI version of CellPose and a preliminary segmentation was obtained using a pre-trained model provided with the segmentation package. CellPose is robust to differences in cell confluency; however, optimal cellular segmentation was achieved when 200–300,000 cells were seeded 24 h before imaging, corresponding to 50–60% plate confluency for U2OS cells.
Before cellular segmentation, we renamed the single-channel files to contain “C1” (GFP-LC3) and “C2” (HaloTagged autophagy factor) as part of their filename. Proper file renaming is essential for the pipeline to work since the image files will be recalled by the subsequent analysis algorithms. For dual-color imaging, only one channel has to be segmented, and the segmentation propagated to the second channel. In our experiments, cells were segmented in the GFP-LC3 channel. For performing cellular segmentation of large datasets, CellPose was implemented as a Python script using PyCharm environment (JetBrain). The script efficiently processes live-cell imaging videos (in TIFF format) by segmenting a single frame due to the negligible x–y drift observed in our 8-min imaging experiments. The outputs of the cellular segmentation are single-cell ROI outlines. The script calls MATLAB as a computational engine using the MATLAB Engine API package to convert the ROI outlines into ROI files to be implemented in the foci tracking algorithm.
Single-cell foci tracking using TrackIT
TrackIt is a GUI integrative tracking and analysis MATLAB-based software developed by the Gebhardt group (Kuhn et al., 2021). Movies were loaded in TrackIt, and ROI was imported and visually inspected to correct for misassigned cells. TrackIt fits single particles to 2D-Gaussian wavelet functions and links spots using a nearest-neighbor algorithm. For our tracking analysis, we used the following optimized settings: threshold 1.9; tracking radius 5; minimum track length 5; and gap frames 5. For tracking the LC3 foci, the threshold was set at 2.1. Tracking files were saved as a batch file containing single-cell tracking data.
K-FOCUS codiffusion analysis
K-FOCUS was developed to analyze foci codiffusion and kinetics in two-color live-cell imaging at a single-cell resolution. The core software consists of two scripts, K-Focus_GUI and TrackColocalization_2CH. K-Focus_GUI uses a GUI application for selecting batch files (Schwarz, 2023) for both channels and creates output folders for each condition tested. In this step, the algorithm allows for customization by specifying the minimum frame length of the foci tracks, which was set to 5 for the experiments discussed in this paper. At this stage, the algorithm computes the mean distance of the foci track from the ROI edge (cell border), as well as the ROI area (cell area). Once this step is complete, K-FOCUS_GUI will store single-cell analysis for each condition in a separate folder.
Next, TrackColocalization_2CH performs the colocalization analysis in “C1” and “C2.” The algorithm runs multiple instances in parallel and saves each experimental condition as a separate output file. To define two foci as colocalized, two parameters were considered: the minimum distance between the foci at any point during their lifetime, and the extent of colocalization, which measures the duration of time that the two foci are colocalized within that distance. For our analysis, the minimum distance was set at three pixels (1.11 μm for our camera after downsampling), and the minimum extent of colocalization to 10 s. The algorithm further calculates several metrics at single-cell resolution, including the count of C2-positive foci (HaloTag autophagy factor foci not colocalized with GFP-LC3), the count of C2-negative foci (HaloTag autophagy factor foci colocalized with GFP-LC3), the conversion ratio (fraction of C2-positive foci out of the total C1 foci), and the lifetime of both fractions. These metrics are then stored in a MATLAB structure for further analysis.
Additional filtering algorithms are applied to exclude preexisting foci within the initial 5 s. This step helps in calculating the “firing” rate, which quantifies the number of newly formed foci per cell per minute. Moreover, we examined the extent of codiffusion by assessing the duration of foci before and after the appearance of the C1 signal (i.e., before and after GFP-LC3B appearance). This analysis provides insights into the length of foci pre- and post-appearance of the C1 signal.
Single-cell threshold- and objective-based foci colocalization analysis
To prepare the movies for the Pearson, Manders, and SODA colocalization algorithms, the channels Halo-ATG and GFP-LC3 were merged, and the first frame was isolated and segmented using an adapted script calling the CellPose API with the output being the ROIs per image in an ImageJ format. Next, using a custom ImageJ script the signal outside the ROI was then deleted and a single image was saved per cell. A colocalization batch analysis was then designed in ICY (De Chaumont et al., 2012), which separated the channels and detected the foci within an individual cell in both channels using ICY’s innate detector algorithms. We used the SODA suite (Lagache et al., 2018) to perform the Pearson, Manders, and SODA colocalization analysis.
Step size analysis
Quantification and statistical analysis
Data are expressed as mean ± confidence interval (90–10) unless stated otherwise. Statistical differences were assessed using a two-tail t-test or one-way ANOVA at P < 0.05 significance level followed by a Bonferroni post-hoc test. All the statistical analyses were performed using OriginPro (v. 2023b, OriginLab).
Online supplemental material
Fig. S1 displays still images of live-cell imaging movies of U2OS cells expressing Halo-ULK1, Halo-ATG13, or Halo-ATG2 and GFP-LC3B. Fig. S2 contains additional analysis of GFP-LC3B expression levels, and western blot experiments to analyze LC3B and GABRAP lipidation under various starvation conditions. Fig. S3 depicts the analysis of the lifetimes of autophagy foci formed by Halo-WIPI2, Halo-ULK1, Halo-ATG13, or Halo-ATG2 stratified by their colocalization with GFP-LC3B. Fig. S4 contains quantification of the colocalization of Halo-ATG13 foci with GFP-LC3B G120A or GFP-P62, and K-FOCUS analysis of all data sets after 2 × 2 binning of the data. Fig. S5 contains western blot analysis of ULK1 S556 phosphorylation after glucose starvation or treatment with an AMPK inhibitor and activator, as well as still images of live-cell imaging movies of U2OS cells expressing Halo-WIPI2, Halo-ULK1, Halo-ATG13, or Halo-ATG2 and GFP-LC3B after treatment with an AMPK inhibitor and activator. Fig. S6 displays the analysis of Halo-ATG13 or Halo-WIPI2 foci formation after ATG9 knockout and the step size distribution of autophagy foci stratified by their colocalization with GFP-LC3B. Fig. S7 contains step size histograms of autophagy foci, and determination of the fraction of mobile and immobile foci populations based on fitting of the step size histogram to a two-state model stratified by their colocalization with GFP-LC3B. Video 1 shows U2OS cells expressing Halo-ATG9 and LAMP1-mNeonGreen. Video 2 shows U2OS cells expressing Halo-ATG13 and GFP-LC3B in complete media and EBSS. Videos 3, 4, 5, and 6 show U2OS cells expressing Halo-WIPI2, Halo-ATG13, Halo-ULK1, or Halo-ATG2A and GFP-LC3B in various media conditions. Video 7 shows U2OS cells expressing Halo-ATG13 and GFP-LC3B G120A in various media conditions. Video 8 shows U2OS cells expressing Halo-ATG13 and GFP-P62 in various media conditions. Videos 9 and 10 show U2OS cells expressing Halo-WIPI2, Halo-ATG13, Halo-ULK1, or Halo-ATG2A and GFP-LC3B in media lacking amino acids and FBS in the absence and presence of the AMPK agonist MK8722. Videos 11 and 12 show U2OS cells expressing Halo-WIPI2, Halo-ATG13, Halo-ULK1, or Halo-ATG2A and GFP-LC3B in media lacking glucose in the absence and presence of the AMPK inhibitor BAY3827. Video 13 shows U2OS cells with a ULK1 knockout expressing Halo-ATG13 and GFP-LC3B in various media conditions. Video 14 shows U2OS cells with a FIP200 knockout expressing Halo-ATG13 and GFP-LC3B in various media conditions. Video 15 shows U2OS cells with an ATG101 knockout expressing Halo-ATG13 and GFP-LC3B in various media conditions. Video 16 shows U2OS cells with an ATG9A knockout expressing Halo-ATG13 in various media conditions. Video 17 shows U2OS cells with an ATG9A knockout expressing Halo-WIPI2 in various media conditions.
Data availability
MATLAB and Python code for K-FOCUS can be found on GitHub (https://github.com/SchmidtLabMSU/K-FOCUS). Due to the large data volume, all raw and analyzed data is available from Jens C. Schmidt upon reasonable request ([email protected]) and may be freely reused for non-commercial purposes.
Acknowledgments
We thank Luke D. Lavis (Janelia Research Campus, Ashburn, VA, USA) for generously providing the Janelia fluor dyes. We acknowledge the Flow Cytometry core (Research Technology Support Facility, Michigan State University) and the Confocal Laser Scanning Microscopy core (Center for Advanced Microscopy, Michigan State University) for supporting our cell sorting and microscopy experiments. The order of the authors C. Barnaba and D.G. Broadbent was decided by a randomization process and both authors contributed equally to the paper; co-first authors reserve the right to list themselves first on their curriculum vitae.
This work was supported by a grant from the National Institutes of Health (DP2 GM142307) to J.C. Schmidt.
Author contributions: C. Barnaba: Conceptualization, Data curation, Formal analysis, Investigation, Methodology, Software, Validation, Visualization, Writing—original draft, Writing—review & editing; D.G. Broadbent: Conceptualization, Data curation, Formal analysis, Investigation, Methodology, Resources, Software, Validation, Visualization, Writing—original draft, Writing—review & editing; E.G. Kaminsky: Formal analysis, Investigation; G.I. Perez: Investigation, Methodology, Validation; and J. Schmidt: Conceptualization, Data curation, Formal analysis, Funding acquisition, Investigation, Methodology, Project administration, Resources, Software, Supervision, Validation, Visualization, Writing—original draft, Writing—review & editing.

