


ER-phagy is an evolutionarily conserved mechanism crucial for maintaining cellular homeostasis. However, significant gaps persist in our understanding of how ER-phagy and the ER network vary across cell subtypes, tissues, and organs. Furthermore, the pathophysiological relevance of ER-phagy remains poorly elucidated. Addressing these questions requires developing quantifiable methods to visualize ER-phagy and ER architecture in vivo. We generated two transgenic mouse lines expressing an ER lumen–targeting tandem RFP-GFP (ER-TRG) tag, either constitutively or conditionally. This approach enables precise spatiotemporal measurements of ER-phagy and ER structure at single-cell resolution in vivo. Systemic analysis across diverse organs, tissues, and primary cultures derived from these ER-phagy reporter mice unveiled significant variations in basal ER-phagy, both in vivo and ex vivo. Furthermore, our investigation uncovered substantial remodeling of ER-phagy and the ER network in different tissues under stressed conditions such as starvation, oncogenic transformation, and tissue injury. In summary, both reporter models represent valuable resources with broad applications in fundamental research and translational studies.

Introduction
The endoplasmic reticulum (ER) is the largest intracellular membrane system that is organized into tubular and sheet structures (Shibata et al., 2006; Zhang and Hu, 2016). Beyond its central role in protein and lipid synthesis, intracellular Ca2+ homeostasis, and the biosynthesis of organelles either directly or indirectly (Joshi et al., 2017), the ER network also forms dynamic contact sites with different organelles and with the plasma membrane in orchestrating an intracellular organelle-interaction network, which is the foundation for a myriad of cellular processes (Lee et al., 2020a; Phillips and Voeltz, 2016; Wu et al., 2018).
The estimated half-lives of lipids and proteins within the ER membrane are ∼3–5 days (Omura et al., 1967). Furthermore, the ER has the remarkable ability to expand itself in response to various ER stresses, thereby mitigating the toxicity resulting from environmental insults (Walter and Ron, 2011). After stress, the elimination of excess ER membrane structures becomes imperative to prevent adverse side-effects. This turnover of the ER network is orchestrated through a selective autophagy pathway specifically targeting the ER, a process coined as ER-phagy (Bernales et al., 2006). Recent studies have provided crucial insights into how the autophagy machinery recognizes redundant or damaged ER structures for lysosomal degradation. Distinct ER-phagy receptors have been identified in different organisms, spanning yeasts, plants, and mammals (An et al., 2019; Chen et al., 2019; Chino et al., 2019; Fumagalli et al., 2016; Grumati et al., 2017; Honig et al., 2012; Hu et al., 2020; Khaminets et al., 2015; Michaeli et al., 2014; Mochida et al., 2015; Nthiga et al., 2020; Smith et al., 2017; Stefely et al., 2020; Stephani et al., 2020; Wang et al., 2023; Zhang et al., 2020; Zhao et al., 2020; Zhou et al., 2018). Additionally, it has been reported that microautophagy, another lysosome-dependent pathway, may also play a role in removing redundant ER structures (Loi et al., 2019).
The malfunction of ER-phagy has direct implications for various human diseases (Ferro-Novick et al., 2021; Foronda et al., 2023; González et al., 2023; He et al., 2021; Hübner and Dikic, 2020; Reggiori and Molinari, 2022). Despite this critical link, the absence of convenient tools for assessing in vivo ER-phagy has hindered in-depth investigations into the role of ER-phagy in pathophysiological states.
Design
Current methods for measuring ER turnover in cultured mammalian cells include the following:
- (1)
Electron microscopy: Traditional electron microscopy allows for the visualization of the sequestration of ER fragments by autophagic vacuoles. However, the protocol is tedious, and quantification poses a challenge. Importantly, this method is not well-suited for the analysis of large-sized samples, such as tissues or organs from mammals.
- (2)
Biochemical quantification of ER-phagy: Relying extensively on immuno-blotting to assess the rate of ER protein turnover, this method is generally reliable and semi-quantitative. However, it lacks the spatial resolution required for evaluating ER degradation flux at the levels of cells, tissues, and organs.
- (3)
Measuring the size of the ER network: ER expansion and distribution can be monitored using fluorescent protein-illuminated ER structures or by immunostaining a ubiquitous ER protein. However, variations in quantification results may arise due to imaging parameters and the quality of antibodies employed.
- (4)
Colocalization analysis of the ER marker with autolysosomes, autophagosomes, or lysosomes: While this method is reliable for evaluating ER-phagy flux in cultured cells, it is often incompatible with samples from tissues or organs. Issues such as epitope accessibility and antibody quality pose challenges in extending its application beyond cultured cells.
- (5)
Ratiometric fluorescence probes: Previous ER-phagy studies have employed both tandem fluorescent protein (FP)- and Keima-based reporters, such as GFP-mCherry-RAMP4 (Liang et al., 2018), RAMP4-Keima (An et al., 2019), ssRFP-GFP-KDEL (Chino et al., 2019), and mCherry-GFP-REEP5 (Chen et al., 2019). These assays hinge on the expression of different reporters either in the ER lumen or in the ER membrane. When Keima serves as the reporter, the ER network exhibits an excitation wavelength centered at 440 nm under neutral pH; however, upon ER-phagy, ER membrane fragments are transported to the acidic lysosomal environment, leading to a shift in Keima’s excitation wavelength to 586 nm. In the case of GFP-RFP/mCherry, the ER is dual-labeled in green and red. During ER-phagy, the RFP or mCherry fluorescence of the ER fragment remains stable in the acidic autolysosomal lumen, while GFP fluorescence is quenched. In either scenario, the appearance of red-only foci provides an easily quantifiable index of ER-phagy.
In addition to measuring ER-phagy, Keima has been successfully employed to study mitophagy both in vitro (Bingol et al., 2014; Katayama et al., 2011) and in vivo (Sun et al., 2015). However, Keima is an FP that possesses reversible acid sensitivity and is therefore relatively incompatible with fixed and tissue samples (Sun et al., 2017). Given the anticipated extensive use of fixed samples in visualizing in vivo ER-phagy in this study, we sought a dual fluorescent protein-based reporter, known for its greater reliability in fixed samples. Such dual fluorescence-based probes have been widely utilized to measure both bulk and selective autophagy flux (Allen et al., 2013; Bhutia et al., 2019; Chen et al., 2019; Chino et al., 2019; Delorme-Axford et al., 2019; Kaizuka et al., 2016; Katayama et al., 2011, 2020; Kimura et al., 2007; Lee et al., 2019, 2022; Liang et al., 2018; Pankiv et al., 2007; Takayama et al., 2017; Yoshii and Mizushima, 2017).
It would be ideal to develop in vivo tools for assessing the architecture and autophagic flux of different ER subdomains. In theory, mCherry-GFP-RAMP4 and mCherry-GFP-REEP5 can gauge the autophagic flux of distinct ER subdomains, considering that endogenous RAMP4 and REEP5 localize to sheet and tubular ER, respectively (Chino and Mizushima, 2020). However, uncertainties persist regarding whether overexpressed RAMP4 or REEP5 can precisely target the reporters to the ER network and whether their overexpression may influence ER structure and functionality in vivo. Additionally, it is widely accepted that a reporter expressed in the ER lumen using the KDEL-tagging strategy can measure bulk ER-phagy due to its ubiquitous distribution in the ER network (Chino et al., 2019).
While overexpression of a tandem FP in the ER lumen as a reliable ER-phagy reporter seems safe in vitro (Chino et al., 2019), its efficacy for faithfully visualizing in vivo ER-phagy and ER architecture without adverse side-effects remains uncertain. Considering these concerns, we opted for a complementary strategy, creating a pair of knock-in transgenic mouse lines expressing an ER-targeting tandem RFP-GFP tag either constitutively or conditionally under the Cre recombinase control. We anticipate that constitutive reporter expression will facilitate convenient and systemic visualization of in vivo ER-phagy and ER architecture. Simultaneously, the Cre recombinase-activated expression of the reporter is expected to offer precise spatiotemporal measurement of in vivo ER-phagy without inducing deleterious side-effects.
Results
Generating ER-phagy reporter mice
Our primary objective was to establish three distinct animal models capable of measuring in vivo sheet, tubular, or bulk ER-phagy, respectively. Recognizing Keima’s limitations for assessing autophagic flux in animals (Mizushima and Murphy, 2020; Sun et al., 2017), we explored dual-fluorescence reporters compatible with fixed samples. However, when RFP-GFP-RAMP4 or RFP-GFP-REEP5 was overexpressed in cell cultures, we observed their ability to label both sheet and tubular ER, similar to ssRFP-GFP-KDEL (Fig. S1, A and B). This suggested that overexpression led to the diffusive distribution of RAMP4 and REEP5 throughout the entire ER membrane system, weakening their specific localization. To avoid labeling artifacts from overexpression, we chose to knock in the RFP-GFP tag into the mouse genome, fusing it with the endogenous ER sheet protein CKAP4/CLIMP63 or the endogenous ER tubular protein REEP5 (Fig. 1 A and Fig. 2 A), as tagging a fluorescent protein to endogenous ER membrane proteins is feasible (Zheng et al., 2021). We successfully generated the knock-in lines, which were verified by genomic DNA PCR and sequencing (Fig. 1 B and Fig. 2 B). However, in the RFP-GFP-Ckap4 reporter mice, we scarcely detected the expression of full-length RFP-GFP-CKAP4 in heterozygote mice, except in the testis for unknown reasons (Fig. 1 C). Additionally, we struggled to detect fluorescence in the tissues (Fig. 1 D). In the RFP-GFP-Reep5 knock-in mice, we detected full-length RFP-GFP-REEP5 and cleaved RFP signals in the heart, pancreas, and brown adipose tissue (BAT) in both heterozygotes and homozygotes (Fig. 2, C and D). Additionally, we observed RFP-positive, GFP-negative (RFP+GFP-) signals in these tissues (Fig. 2 E), indicating successful knock-in of RFP-GFP resulted in endogenous expression of RFP-GFP-REEP5, revealing tubular ER-phagy flux in several tissues. However, the fluorescence intensity of RFP-GFP and RFP-only puncta in RFP-GFP-REEP5 tissues appeared weak, making it challenging to visualize the architecture of tubular ER and the flux of tubular ER-phagy in other tissues or organs. In conclusion, our investigation of knock-in strategies informed us of the challenges associated with faithfully visualizing sheet and tubular ER and their autophagy flux in vivo.

Expression of different ER-phagy reporters in cell line (related to Figs. 1, 2, and 3 ). (A) Schematic depiction of several ER-phagy reporter candidates. Each reporter incorporates the tandem fluorescent protein RFP-GFP. P1 features the RFP-GFP tandem along with the ER-lumen targeting sequence SS-KDEL. P2 consists of RFP-GFP paired with the sheet ER-membrane protein RAMP4. P3 includes RFP-GFP combined with the tubular ER-membrane protein REEP5. (B) Confocal microscopy images of HeLa cells expressing various ER-phagy reporters. HeLa cells transiently expressing each of the three reporters (P1-P3) were examined to characterize ER morphology. Scale bar: 5 μm. (C) Representative confocal microscopy images of ER-phagy in HeLa cells expressing ssYPet-TOLLES-KDEL following ER-stress inducer treatment. Cells transiently expressing ssYPet-TOLLES-KDEL were treated with 100 nM Torin1 for 4 h to induce ER-phagy. For TOLLES imaging, excitation was at 445 nm with fluorescence detection at 460–500 nm. For YPet, excitation was at 514 nm and fluorescence was detected at 530–580 nm. The pink arrowheads indicate the ER-phagy sites. Scale bar: 5 μm.
Expression of different ER-phagy reporters in cell line (related to Figs. 1, 2, and 3 ). (A) Schematic depiction of several ER-phagy reporter candidates. Each reporter incorporates the tandem fluorescent protein RFP-GFP. P1 features the RFP-GFP tandem along with the ER-lumen targeting sequence SS-KDEL. P2 consists of RFP-GFP paired with the sheet ER-membrane protein RAMP4. P3 includes RFP-GFP combined with the tubular ER-membrane protein REEP5. (B) Confocal microscopy images of HeLa cells expressing various ER-phagy reporters. HeLa cells transiently expressing each of the three reporters (P1-P3) were examined to characterize ER morphology. Scale bar: 5 μm. (C) Representative confocal microscopy images of ER-phagy in HeLa cells expressing ssYPet-TOLLES-KDEL following ER-stress inducer treatment. Cells transiently expressing ssYPet-TOLLES-KDEL were treated with 100 nM Torin1 for 4 h to induce ER-phagy. For TOLLES imaging, excitation was at 445 nm with fluorescence detection at 460–500 nm. For YPet, excitation was at 514 nm and fluorescence was detected at 530–580 nm. The pink arrowheads indicate the ER-phagy sites. Scale bar: 5 μm.
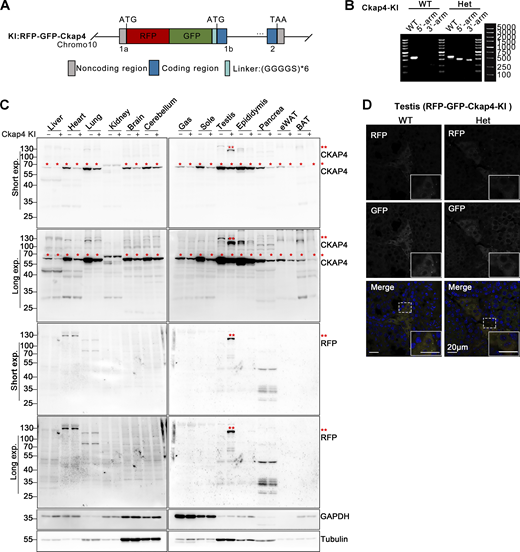
Construction and identification of RFP-GFP-Ckap4 knock-in transgenic mice. (A) Schematic illustrating the construction of the ER-phagy reporter Ckap4-KI using a knock-in mouse model. The tandem fluorescent protein RFP-GFP was inserted at the 5′ end of the first exon of the Ckap4 gene on chromosome 10. (B) Genotyping of transgenic Ckap4-KI mice. Mouse genotypes were identified using PCR with three pairs of primers, as detailed in the materials section. “WT” denotes wild type, “Het” indicates heterozygote. (C) Western blot analysis demonstrating the expression of the Ckap4-KI reporter in knock-in mice. The expression of the Ckap4-KI reporter was assessed in various tissues of both wild-type and knock-in mice. Double red asterisks (**) indicate the fused RFP-GFP-CKAP4 protein, detected by anti-CKAP4 and anti-RFP antibodies. Single red asterisks (*) denote endogenous CKAP4 detected by anti-CKAP4 antibody. GAPDH and Tubulin served as internal controls. Tissues were harvested from 8-wk-old mice. “−” denotes WT, “+” represents heterozygotes. (D) Representative microscopy images illustrating the localization and expression level of the Ckap4-KI reporter in mouse testis tissue. Scale bar: 20 μm. See also Fig. S1. Source data are available for this figure: SourceData F1.
Construction and identification of RFP-GFP-Ckap4 knock-in transgenic mice. (A) Schematic illustrating the construction of the ER-phagy reporter Ckap4-KI using a knock-in mouse model. The tandem fluorescent protein RFP-GFP was inserted at the 5′ end of the first exon of the Ckap4 gene on chromosome 10. (B) Genotyping of transgenic Ckap4-KI mice. Mouse genotypes were identified using PCR with three pairs of primers, as detailed in the materials section. “WT” denotes wild type, “Het” indicates heterozygote. (C) Western blot analysis demonstrating the expression of the Ckap4-KI reporter in knock-in mice. The expression of the Ckap4-KI reporter was assessed in various tissues of both wild-type and knock-in mice. Double red asterisks (**) indicate the fused RFP-GFP-CKAP4 protein, detected by anti-CKAP4 and anti-RFP antibodies. Single red asterisks (*) denote endogenous CKAP4 detected by anti-CKAP4 antibody. GAPDH and Tubulin served as internal controls. Tissues were harvested from 8-wk-old mice. “−” denotes WT, “+” represents heterozygotes. (D) Representative microscopy images illustrating the localization and expression level of the Ckap4-KI reporter in mouse testis tissue. Scale bar: 20 μm. See also Fig. S1. Source data are available for this figure: SourceData F1.
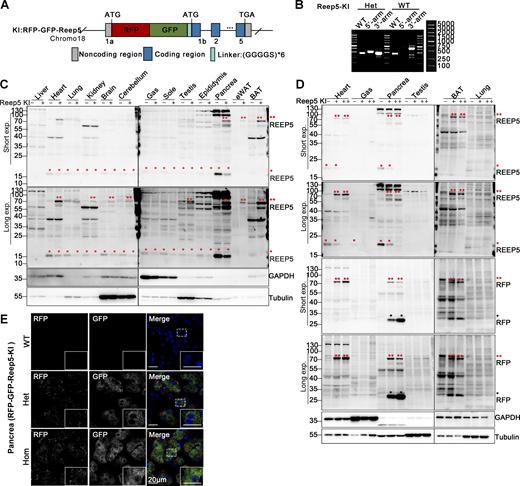
Construction and identification of RFP-GFP-Reep5 knock-in transgenic mice. (A) Schematic for constructing the ER-phagy reporter Reep5-KI using a knock-in mouse model. Tandem fluorescent protein RFP-GFP was inserted at the 5′ end of the first exon of the Reep5 gene on chromosome 18. (B) Genotyping of transgenic Reep5-KI mice. Mouse genotypes were determined using PCR with three pairs of primers, as detailed in the materials section. (C and D) Western blot analysis demonstrating the expression of the Reep5-KI reporter in knock-in mice. The expression of the Reep5-KI reporter was assessed in various tissues of both wild-type and knock-in mice. Double red asterisks (**) indicate the fused RFP-GFP-REEP5 protein, single red asterisks (*) denote endogenous REEP5 identified by anti-REEP5 antibody, and single black asterisks (*) highlight the RFP fragments. GAPDH and Tubulin served as internal controls. Tissues were obtained from 8-wk-old mice. “−” denotes WT, “+” represents heterozygotes, and “++” indicates homozygotes. (E) Representative microscopy images illustrating the localization and expression level of the Reep5-KI reporter in mouse pancreas tissue. Homozygotes are denoted as “Hom.” Scale bar: 20 μm. See also Fig. S1. Source data are available for this figure: SourceData F2.
Construction and identification of RFP-GFP-Reep5 knock-in transgenic mice. (A) Schematic for constructing the ER-phagy reporter Reep5-KI using a knock-in mouse model. Tandem fluorescent protein RFP-GFP was inserted at the 5′ end of the first exon of the Reep5 gene on chromosome 18. (B) Genotyping of transgenic Reep5-KI mice. Mouse genotypes were determined using PCR with three pairs of primers, as detailed in the materials section. (C and D) Western blot analysis demonstrating the expression of the Reep5-KI reporter in knock-in mice. The expression of the Reep5-KI reporter was assessed in various tissues of both wild-type and knock-in mice. Double red asterisks (**) indicate the fused RFP-GFP-REEP5 protein, single red asterisks (*) denote endogenous REEP5 identified by anti-REEP5 antibody, and single black asterisks (*) highlight the RFP fragments. GAPDH and Tubulin served as internal controls. Tissues were obtained from 8-wk-old mice. “−” denotes WT, “+” represents heterozygotes, and “++” indicates homozygotes. (E) Representative microscopy images illustrating the localization and expression level of the Reep5-KI reporter in mouse pancreas tissue. Homozygotes are denoted as “Hom.” Scale bar: 20 μm. See also Fig. S1. Source data are available for this figure: SourceData F2.
Next, we endeavored to create reporter mice for bulk ER-phagy measurement by comparing two different tagging strategies: RFP-GFP (Chino et al., 2019) or TOLLES-YPet (Katayama et al., 2020) (Fig. 3 A). When the dual-FP tags were expressed in the ER lumen, they effectively labeled the ER network without inducing noticeable cytotoxicity (Fig. S1 C). Given the absence of reported TOLLES-YPet transgenic animals, we leaned toward selecting RFP-GFP for further studies. Upon ER-phagy induction using a starvation medium, EBSS, a glycosylation inhibitor, Tunicamycin (TCA), or an mTOR inhibitor, Torin1, ssRFP-GFP-KDEL demonstrated the ability to quantitatively reveal heightened ER-phagy flux in cultured cells (Fig. 3, B–E). Next, we asked whether this probe could detect the autophagic degradation of different ER subdomains. In mammals, sheet and tubular ER-phagy are mediated by distinct ER-phagy receptors (Chino and Mizushima, 2020; Ferro-Novick et al., 2021), all of which are expressed in different tissues at varying levels in mice (Fig. 3 F). Indeed, using this probe, we could readily measure ER-phagy–induced by the overexpression of these ER-phagy receptors in HeLa cells (Fig.3 G).

Comparison of two ER-phagy reporter strategies. (A) Schematic representation of two ER-phagy reporters. Left: the key elements of reporters include the tandem fluorescent proteins RFP-GFP, as well as YPet-TOLLES, paired with ER-lumen targeting sequence, KDEL. Both RFP and TOLLES demonstrate increased resistance to acidity. Right: ssRFP-GFP-KDEL is cleaved by lysosomal enzymes to yield the RFP fragment, while the GFP signal is quenched in lysosomes. (B–D) Confocal microscopy images of HeLa cells expressing the ER lumen-targeting, tandem RFP-GFP (ER-TRG, ssRFP-GFP-KDEL) tag under various conditions. HeLa cells expressing ER-TRG were subjected to treatments with EBSS (14 h), Tunicamycin (1 μg/ml, 16 h), or Torin1 (100 nM, 4 h) to induce ER stress. Scale bar: 5 μm. (E) Quantitative analysis of RFP+ puncta per cell following ER stress inducer treatment as depicted in Fig. 1, B–D. HeLa cells expressing ER-TRG were treated with EBSS (14 h), Tunicamycin (1 μg/ml, 16 h), or Torin1 (100 nM, 4 h) to induce ER stress. Data were collected from 50 to 80 cells for each condition. Values were stated as mean ± SEM. Statistical differences were analyzed using Mann–Whitney test. ***P < 0.001. (F) Gene expression levels of different ER-phagy receptors in various mouse tissues. Data were retrieved from the online GEO database (https://www.ncbi.nlm.nih.gov-/geo/query/acc.cgi?acc=GSE10246). Tissue labels include adipose brown (Adipose b), adipose white (Adipose w), cerebellum (Cereb), cerebral cortex (Cereb C), hippocampus (Hippoca), large intestine (Intest l), small intestine (Intest s), osteoclasts (Osteo), pancreas, placenta, and skeletal muscle (Skeletal m). (G) Representative confocal microscopy images showing ER-phagy induced by ER-phagy receptors. HeLa cells stably expressing ER-TRG were transfected with expression plasmids for ER-phagy receptors for 24 h, followed by fixation for confocal microscopy analysis. Scale bar: 5 μm. See also Fig. S1.
Comparison of two ER-phagy reporter strategies. (A) Schematic representation of two ER-phagy reporters. Left: the key elements of reporters include the tandem fluorescent proteins RFP-GFP, as well as YPet-TOLLES, paired with ER-lumen targeting sequence, KDEL. Both RFP and TOLLES demonstrate increased resistance to acidity. Right: ssRFP-GFP-KDEL is cleaved by lysosomal enzymes to yield the RFP fragment, while the GFP signal is quenched in lysosomes. (B–D) Confocal microscopy images of HeLa cells expressing the ER lumen-targeting, tandem RFP-GFP (ER-TRG, ssRFP-GFP-KDEL) tag under various conditions. HeLa cells expressing ER-TRG were subjected to treatments with EBSS (14 h), Tunicamycin (1 μg/ml, 16 h), or Torin1 (100 nM, 4 h) to induce ER stress. Scale bar: 5 μm. (E) Quantitative analysis of RFP+ puncta per cell following ER stress inducer treatment as depicted in Fig. 1, B–D. HeLa cells expressing ER-TRG were treated with EBSS (14 h), Tunicamycin (1 μg/ml, 16 h), or Torin1 (100 nM, 4 h) to induce ER stress. Data were collected from 50 to 80 cells for each condition. Values were stated as mean ± SEM. Statistical differences were analyzed using Mann–Whitney test. ***P < 0.001. (F) Gene expression levels of different ER-phagy receptors in various mouse tissues. Data were retrieved from the online GEO database (https://www.ncbi.nlm.nih.gov-/geo/query/acc.cgi?acc=GSE10246). Tissue labels include adipose brown (Adipose b), adipose white (Adipose w), cerebellum (Cereb), cerebral cortex (Cereb C), hippocampus (Hippoca), large intestine (Intest l), small intestine (Intest s), osteoclasts (Osteo), pancreas, placenta, and skeletal muscle (Skeletal m). (G) Representative confocal microscopy images showing ER-phagy induced by ER-phagy receptors. HeLa cells stably expressing ER-TRG were transfected with expression plasmids for ER-phagy receptors for 24 h, followed by fixation for confocal microscopy analysis. Scale bar: 5 μm. See also Fig. S1.
Evaluating ER-phagy in vitro using ER-TRG mice-derived cell lines
Subsequently, a knock-in (KI) transgenic mouse line was created by integrating a single copy of ssRFP-GFP-KDEL (Chino et al., 2019) into the Hipp11 (H11) locus on chromosome 11, with a C57BL/6 background (Fig. 4 A). For convenience, we named this mouse line ER-TRG mice, as they stably express the ER lumen-targeting, tandem RFP-GFP (ER-TRG) probe under the control of the cytomegalovirus (CMV) enhancer fused to the chicken β-actin promoter (Hitoshi et al., 1991; Saito and Nakatsuji, 2001). Previous studies have shown that the KI of a transgene in the H11 locus can achieve ubiquitous expression of transgene without causing any detrimental side-effects (Sun et al., 2015; Tasic et al., 2011). The offspring’s ratios adhered to Mendel’s law for both homozygotes and heterozygotes of ER-TRG mice. While a slight weight reduction in the homozygotes suggested in vivo toxicity, heterozygous ER-TRG reporter mice appeared healthy (Fig. S2, A and B) and exhibited robust fluorescence intensity, enabling convenient detection of ER-phagy both in vivo and in vitro (Fig. 4 B). Consequently, we exclusively utilized heterozygous reporter mice for ER-phagy characterization in this study.
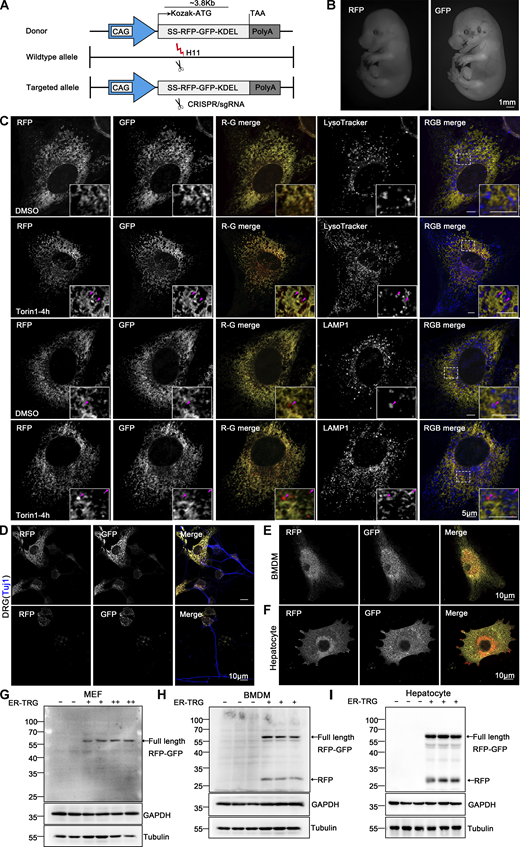
Generation of ER-TRG knock-in mice and assessment of ER-phagy in primary cells derived from the ER-phagy reporter mouse. (A) Schematic representation of the gene targeting strategy illustrating the insertion of ssRFP-GFP-KDEL into the H11 locus to create the ER-TRG mouse model via CRISPR-Cas9 gene editing. The CAG promoter (CMV immediate enhancer/β-actin) and the Kozak sequence (a key eukaryotic mRNA translation initiation site) are highlighted. (B) Whole-mount pictures of E14.5 ER-TRG (+/−) embryos showing the transgenic RFP and GFP fluorescence. Scale bar: 1 mm. (C) Confocal microscopy images showing RFP-GFP fluorescence colocalization with lysosomes in mouse embryonic fibroblast (MEF) cells under mTOR inhibition. MEF cells, isolated from E13.5 ER-TRG (+/−) embryos, were treated with 100 nM Torin1 for 4 h. LysoTracker, a cell-permeable lysosomal marker, was used to identify and trace acidic organelles in live cells. Lysosomes were also marked by LAMP1. Enhanced images demonstrate RFP-only signals colocalizing with lysosomes. The pink arrowheads indicate the ER-phagy sites. Scale bar: 5 μm. (D–F) Confocal microscopy images of RFP and GFP fluorescence in cultured primary cells. Sensory neurons, isolated from dorsal root ganglia (DRG) of E14.5 ER-TRG (+/−) embryos (D), were marked by Tuj1, a neuronal marker. Bone marrow-derived macrophages (BMDMs) (E) and hepatocytes (F) were isolated from adult ER-TRG (+/−) mice. The cells were examined for expression and subcellular localization of the fluorescent proteins. Scale bar: 10 μm. (G–I) Immunoblot analysis showing the expression of ssRFP-GFP-KDEL in primary cells isolated from transgenic mice. Cell extracts from wild-type and ER-TRG transgenic mice were subjected to immunoblotting with specific antibodies. In MEF cells, BMDMs, and hepatocytes, the full-length RFP-GFP was detected in both heterozygotes and homozygotes. Full-length RFP-GFP and RFP fragments were identified using an anti-RFP antibody. The presence of RFP fragments indicates ER-phagy activity, representing the ER-phagy product. GAPDH and Tubulin were used as internal controls. “−” denotes WT, “+” represents heterozygotes, and “++” indicates homozygotes. See also Fig. S2. Source data are available for this figure: SourceData F4.
Generation of ER-TRG knock-in mice and assessment of ER-phagy in primary cells derived from the ER-phagy reporter mouse. (A) Schematic representation of the gene targeting strategy illustrating the insertion of ssRFP-GFP-KDEL into the H11 locus to create the ER-TRG mouse model via CRISPR-Cas9 gene editing. The CAG promoter (CMV immediate enhancer/β-actin) and the Kozak sequence (a key eukaryotic mRNA translation initiation site) are highlighted. (B) Whole-mount pictures of E14.5 ER-TRG (+/−) embryos showing the transgenic RFP and GFP fluorescence. Scale bar: 1 mm. (C) Confocal microscopy images showing RFP-GFP fluorescence colocalization with lysosomes in mouse embryonic fibroblast (MEF) cells under mTOR inhibition. MEF cells, isolated from E13.5 ER-TRG (+/−) embryos, were treated with 100 nM Torin1 for 4 h. LysoTracker, a cell-permeable lysosomal marker, was used to identify and trace acidic organelles in live cells. Lysosomes were also marked by LAMP1. Enhanced images demonstrate RFP-only signals colocalizing with lysosomes. The pink arrowheads indicate the ER-phagy sites. Scale bar: 5 μm. (D–F) Confocal microscopy images of RFP and GFP fluorescence in cultured primary cells. Sensory neurons, isolated from dorsal root ganglia (DRG) of E14.5 ER-TRG (+/−) embryos (D), were marked by Tuj1, a neuronal marker. Bone marrow-derived macrophages (BMDMs) (E) and hepatocytes (F) were isolated from adult ER-TRG (+/−) mice. The cells were examined for expression and subcellular localization of the fluorescent proteins. Scale bar: 10 μm. (G–I) Immunoblot analysis showing the expression of ssRFP-GFP-KDEL in primary cells isolated from transgenic mice. Cell extracts from wild-type and ER-TRG transgenic mice were subjected to immunoblotting with specific antibodies. In MEF cells, BMDMs, and hepatocytes, the full-length RFP-GFP was detected in both heterozygotes and homozygotes. Full-length RFP-GFP and RFP fragments were identified using an anti-RFP antibody. The presence of RFP fragments indicates ER-phagy activity, representing the ER-phagy product. GAPDH and Tubulin were used as internal controls. “−” denotes WT, “+” represents heterozygotes, and “++” indicates homozygotes. See also Fig. S2. Source data are available for this figure: SourceData F4.
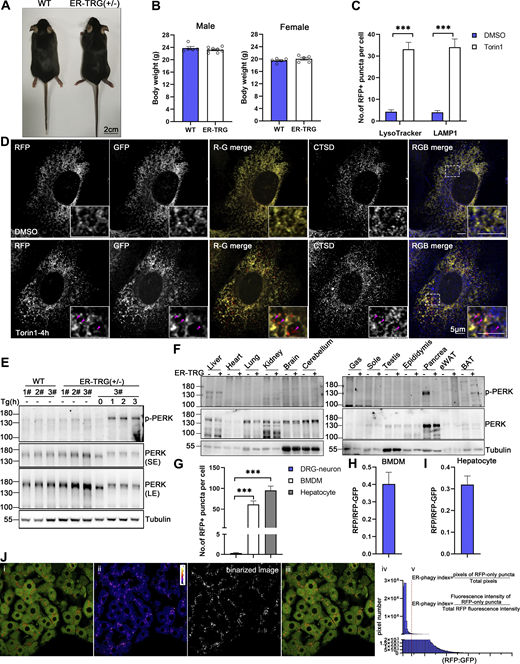
Identification of ER-phagy reporter mouse (related to Fig. 4 ). (A) Representative images of mouse morphology of wild-type and heterozygous ER-TRG adult mice. Scale bar: 2 cm. (B) Graphs illustrating the body weights of male and female wild-type and heterozygous ER-TRG mice. Statistical analyses of body weights were performed on 8-wk-old male and female mice. Values were stated as mean ± SEM (n = 5–8 per group). Statistical differences were analyzed using Student’s t test. *P <0.05. (C) Quantification of RFP+ puncta colocalization with lysosomes in primary MEF cells under mTOR inhibition. The number of RFP+ puncta that colocalized with LysoTracker or LAMP1 signals was calculated using ImageJ for each treatment. Data were collected from 20 to 30 cells for each condition. Values were stated as mean ± SEM. Statistical differences were analyzed using two-way ANOVA. ***P < 0.001. (D) Confocal microscopy images showing the colocalization of RFP-GFP fluorescence with lysosomes in primary MEF cells under mTOR inhibition. MEF cells, derived from E13.5 ER-TRG (+/−) embryos, were treated with 100 nM Torin1 for 4 h. CTSD, a lysosomal enzyme, was employed as a lysosomal marker. Enlarged views reveal RFP-only signals colocalizing with lysosomes. The pink arrowheads indicate the ER-phagy sites. Scale bar: 5 μm. (E) Immunoblot analysis of PERK and p-PERK in primary MEF cell extracts. Cells were isolated from E13.5 embryos of ER-TRG (+/−) pregnant mice. Samples labeled #1, #2, and #3 represent cells from different mice. Cells #3 from the ER-TRG (+/−) group were used as a positive control, treated with Tg (1 μM) for 0, 1, 2, 3 h, respectively. “SE” denotes short exposure, while “LE” indicates long exposure. (F) Immunoblot analysis of PERK and phosphorylated PERK (p-PERK) in various tissues of wild-type and heterozygous ER-TRG mice. Tissue homogenates were probed using specific anti-PERK and p-PERK antibodies. Tubulin served as an internal control. (G) Quantitative analysis of ER-phagy levels in primary cells from ER-TRG (+/−) mice. The number of RFP+ puncta per cell in sensory neurons, BMDMs and hepatocytes was calculated using ImageJ and quantified for each treatment. Values were stated as mean ± SEM. Statistical differences were analyzed using one-way ANOVA. ***P < 0.001. (H and I) Quantitative analysis of immunoblotting showing ER-phagy activities in BMDMs and hepatocytes isolated from ER-TRG (+/−) mice. The band intensity of RFP fragments relative to full-length RFP-GFP indicates the presence of ER-phagy products, signifying ER-phagy activity. Values were stated as mean ± SD (n = 3). (J) Fluorescence quantification methods. The level of ER-phagy was defined from two aspects: (a) ER-phagy is defined as the number of pixels of RFP-only puncta divided by the total pixels (RFP + GFP), which is used to delineate the total area of tissue or cells because some section images did not completely fill the field of view. (b) ER-phagy is also defined as the fluorescence intensity ratio of lysosomal signals (RFP-only puncta) to total RFP signals. The method is described in detail in Materials and methods. Source data are available for this figure: SourceData FS2.
Identification of ER-phagy reporter mouse (related to Fig. 4 ). (A) Representative images of mouse morphology of wild-type and heterozygous ER-TRG adult mice. Scale bar: 2 cm. (B) Graphs illustrating the body weights of male and female wild-type and heterozygous ER-TRG mice. Statistical analyses of body weights were performed on 8-wk-old male and female mice. Values were stated as mean ± SEM (n = 5–8 per group). Statistical differences were analyzed using Student’s t test. *P <0.05. (C) Quantification of RFP+ puncta colocalization with lysosomes in primary MEF cells under mTOR inhibition. The number of RFP+ puncta that colocalized with LysoTracker or LAMP1 signals was calculated using ImageJ for each treatment. Data were collected from 20 to 30 cells for each condition. Values were stated as mean ± SEM. Statistical differences were analyzed using two-way ANOVA. ***P < 0.001. (D) Confocal microscopy images showing the colocalization of RFP-GFP fluorescence with lysosomes in primary MEF cells under mTOR inhibition. MEF cells, derived from E13.5 ER-TRG (+/−) embryos, were treated with 100 nM Torin1 for 4 h. CTSD, a lysosomal enzyme, was employed as a lysosomal marker. Enlarged views reveal RFP-only signals colocalizing with lysosomes. The pink arrowheads indicate the ER-phagy sites. Scale bar: 5 μm. (E) Immunoblot analysis of PERK and p-PERK in primary MEF cell extracts. Cells were isolated from E13.5 embryos of ER-TRG (+/−) pregnant mice. Samples labeled #1, #2, and #3 represent cells from different mice. Cells #3 from the ER-TRG (+/−) group were used as a positive control, treated with Tg (1 μM) for 0, 1, 2, 3 h, respectively. “SE” denotes short exposure, while “LE” indicates long exposure. (F) Immunoblot analysis of PERK and phosphorylated PERK (p-PERK) in various tissues of wild-type and heterozygous ER-TRG mice. Tissue homogenates were probed using specific anti-PERK and p-PERK antibodies. Tubulin served as an internal control. (G) Quantitative analysis of ER-phagy levels in primary cells from ER-TRG (+/−) mice. The number of RFP+ puncta per cell in sensory neurons, BMDMs and hepatocytes was calculated using ImageJ and quantified for each treatment. Values were stated as mean ± SEM. Statistical differences were analyzed using one-way ANOVA. ***P < 0.001. (H and I) Quantitative analysis of immunoblotting showing ER-phagy activities in BMDMs and hepatocytes isolated from ER-TRG (+/−) mice. The band intensity of RFP fragments relative to full-length RFP-GFP indicates the presence of ER-phagy products, signifying ER-phagy activity. Values were stated as mean ± SD (n = 3). (J) Fluorescence quantification methods. The level of ER-phagy was defined from two aspects: (a) ER-phagy is defined as the number of pixels of RFP-only puncta divided by the total pixels (RFP + GFP), which is used to delineate the total area of tissue or cells because some section images did not completely fill the field of view. (b) ER-phagy is also defined as the fluorescence intensity ratio of lysosomal signals (RFP-only puncta) to total RFP signals. The method is described in detail in Materials and methods. Source data are available for this figure: SourceData FS2.
To validate the reliability of the probe, we assessed mouse embryonic fibroblasts (MEFs) derived from the reporter mice. Confocal microscopy analysis demonstrated that the reporter faithfully labeled the ER network, and ER-phagy responded to Torin1 treatment (Fig. 4 C and Fig. S2 C). Importantly, the RFP+GFP- puncta colocalized with lysosomes labeled by LysoTracker, LAMP1, and cathepsin D (CSTD) (Fig. 4 C and Fig. S2 D), indicating the engulfment of RFP-GFP-labeled ER structures by lysosomes. Considering that constitutive expression of exogenous FPs in the ER lumen might induce ER stress or unfolded protein response (UPR), we compared the levels of PERK activation, an indicator of ER stress, in MEF cells derived from either heterozygous ER-TRG mice or their wild-type littermates. As shown in Fig. S2 E, PERK largely stayed unphosphorylated, implying that no significant ER stress was stimulated by the expression of the exogenous TRG in the MEF cells. Furthermore, we showed that PERK signaling was not altered by the expression of the probe in vivo, except for the pancreas (Fig. S2 F). Therefore, the expression of the probe was well-tolerated without causing obvious deleterious side-effects. To further demonstrate the value of the reporter mice for in vitro studies, we established primary cultures for sensory neurons from dorsal root ganglia (DRG), bone marrow-derived macrophages (BMDMs), and hepatocytes. Basal ER-phagy activity was relatively low in DRG sensory neurons compared with that in BMDMs and hepatocytes (Fig. 4, D–F and Fig. S2 G). ER-phagy occurred at the perinuclear regions in BMDMs, while showing robust activities at both the periphery and perinuclear areas in hepatocytes. Furthermore, we confirmed the expression of the probe and cleaved free RFP by performing anti-RFP western blot analysis for the isolated primary cell cultures (Fig. 4, G–I; and Fig. S2, H and I). The ER-phagy flux measured by cleaved RFP signals was consistent with the imaging data. Our results demonstrate that ER-TRG mice provide a rich source of diverse cell types for in vitro research.
ER-phagy varies between and within tissues (spatial)
In general, basal ER-phagy can be readily measured within the ER-TRG mouse tissues that have been analyzed in this study. For instance, GFP and RFP signals illuminated the hepatic sections (Fig. 5 A), and mild ER-phagy activity indicated by the RFP+GFP− puncta was detected within the hepatic tissue with a slight intensification in the areas surrounding the central vein (CV) (Fig. 5, A and B; and Fig. S3 A). Importantly, the RFP+GFP- puncta colocalized with lysosome markers LAMP1 and CTSD (Fig. 5, A and C; and Fig. S3, A and B), indicating that these structures represent ER-containing autolysosomes, which was consistent with in vitro data. Hepatic ER-phagy was dependent on the canonical autophagy process as the knockdown of the essential autophagy gene Atg7, achieved through AAV9-mediated shRNA delivery to hepatic tissues, significantly reduced the appearance of RFP+GFP− signal, which was further confirmed by anti-RFP western blot analysis (Fig. 5, D–F; and Fig. S3, C and D).
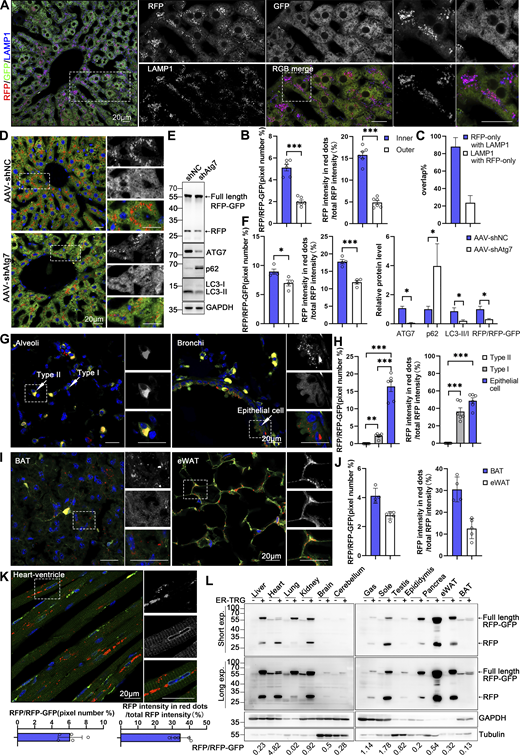
Spatial assessment of ER-phagy activity and ER architecture in different tissues. (A) Co-labeling with LAMP1 indicates that almost all red-positive (RFP+) compartments are also lysosomal marker positive and yield purple (red: RFP+, blue: LAMP1+) signals in the hepatocytes of 8-wk ER-TRG (+/−) mice. Lysosomes not engaged in autophagy (LAMP1 negative) remain blue. Inset: enlarged image of area indicated by dashed frame. Scale bar: 20 μm. (B) Quantitative analysis of different regions of liver from ER-TRG (+/−) reporter mice at adulthood. The calculations were performed for regions inside or outside the yellow dashed box in mouse liver (S3A), referred to as the inner and outer regions. The inner regions represent the vicinity of the CV zone, while the outer regions represent the areas away from the CV zone. The pixel number of RFP-only signals and total RFP signals were calculated by ImageJ and the ratio of RFP: total area (RFP+GFP) was quantified (left). The intensity of RFP-only signals and total RFP signals were calculated by ImageJ on a pixel-by-pixel basis and the fluorescence ratio of RFP: total RFP was quantified (right). Values were stated as mean ± SEM (n = 6). Statistical differences were evaluated using Student’s t test. ***P < 0.001. (C) Quantification of RFP-only ER-lysosomes (RFP+LAMP1+) in liver sections obtained from ER-TRG mice. Values were stated as mean ± SD (n = 4). (D–F) Representative images and quantitative analysis of ER-TRG signals in the liver of control and Atg7-knockdown mice. 8-wk-old ER-TRG (+/−) mice were injected with AAV-shNC and AAV-shAtg7 and underwent a 4-wk infection period. Quantitative analysis of RFP+ signals and immunoblotting of RFP cleavage indicated reduced ER-phagy in hepatocytes after Atg7 knockdown (F). The band intensity of RFP fragments relative to full-length RFP-GFP indicates the presence of ER-phagy products, signifying ER-phagy activity. The efficiency of ATG7 knockdown is evidenced by the expression levels of ATG7, p62, and LC3 in liver samples. GAPDH and Tubulin served as internal controls. Values were stated as mean ± SEM (n = 4 per group). Statistical differences were analyzed using Student’s t test. *P < 0.05, ***P < 0.001. Scale bar: 20 μm. (G–J) Representative confocal images depicting ER-phagy levels in the lung and adipose tissues of ER-TRG (+/−) mice. Quantitative analysis including alveoli and bronchioles (G), brown adipose tissue (BAT), and epididymal white adipose tissue (eWAT) (I) indicated different ER abundance and positioning of ER-phagy signals within tissues (n = 4–6). Magnified images highlight RFP-only signals in cells of various tissues. Adult male ER-TRG (+/−) mice were used in all experiments. Values were stated as mean ± SEM (n = 6) (H). Values were stated as mean ± SD (n = 4–5) (J). Statistical differences were analyzed using one-way ANOVA. **P < 0.01, ***P < 0.001. Scale bar: 20 μm. (K) Representative confocal images depicting ER-phagy levels in the heart sections and quantitative analysis of ER-phagy level of heart in ER-TRG (+/−) mice. Values were stated as mean ± SD (n = 5). Scale bar: 20 μm. (L) Immunoblot analysis of ssRFP-GFP-KDEL expression in various tissues of transgenic mice. Tissue homogenates from one wild-type and one ER-TRG (+/−) transgenic mouse were probed with specific antibodies. Both full-length RFP-GFP and RFP fragments were detected using an anti-RFP antibody. The band intensity of RFP fragments relative to full-length RFP-GFP indicates the presence of ER-phagy products, signifying ER-phagy activity. GAPDH and Tubulin were used as internal controls. See also Fig. S3. Source data are available for this figure: SourceData F5.
Spatial assessment of ER-phagy activity and ER architecture in different tissues. (A) Co-labeling with LAMP1 indicates that almost all red-positive (RFP+) compartments are also lysosomal marker positive and yield purple (red: RFP+, blue: LAMP1+) signals in the hepatocytes of 8-wk ER-TRG (+/−) mice. Lysosomes not engaged in autophagy (LAMP1 negative) remain blue. Inset: enlarged image of area indicated by dashed frame. Scale bar: 20 μm. (B) Quantitative analysis of different regions of liver from ER-TRG (+/−) reporter mice at adulthood. The calculations were performed for regions inside or outside the yellow dashed box in mouse liver (S3A), referred to as the inner and outer regions. The inner regions represent the vicinity of the CV zone, while the outer regions represent the areas away from the CV zone. The pixel number of RFP-only signals and total RFP signals were calculated by ImageJ and the ratio of RFP: total area (RFP+GFP) was quantified (left). The intensity of RFP-only signals and total RFP signals were calculated by ImageJ on a pixel-by-pixel basis and the fluorescence ratio of RFP: total RFP was quantified (right). Values were stated as mean ± SEM (n = 6). Statistical differences were evaluated using Student’s t test. ***P < 0.001. (C) Quantification of RFP-only ER-lysosomes (RFP+LAMP1+) in liver sections obtained from ER-TRG mice. Values were stated as mean ± SD (n = 4). (D–F) Representative images and quantitative analysis of ER-TRG signals in the liver of control and Atg7-knockdown mice. 8-wk-old ER-TRG (+/−) mice were injected with AAV-shNC and AAV-shAtg7 and underwent a 4-wk infection period. Quantitative analysis of RFP+ signals and immunoblotting of RFP cleavage indicated reduced ER-phagy in hepatocytes after Atg7 knockdown (F). The band intensity of RFP fragments relative to full-length RFP-GFP indicates the presence of ER-phagy products, signifying ER-phagy activity. The efficiency of ATG7 knockdown is evidenced by the expression levels of ATG7, p62, and LC3 in liver samples. GAPDH and Tubulin served as internal controls. Values were stated as mean ± SEM (n = 4 per group). Statistical differences were analyzed using Student’s t test. *P < 0.05, ***P < 0.001. Scale bar: 20 μm. (G–J) Representative confocal images depicting ER-phagy levels in the lung and adipose tissues of ER-TRG (+/−) mice. Quantitative analysis including alveoli and bronchioles (G), brown adipose tissue (BAT), and epididymal white adipose tissue (eWAT) (I) indicated different ER abundance and positioning of ER-phagy signals within tissues (n = 4–6). Magnified images highlight RFP-only signals in cells of various tissues. Adult male ER-TRG (+/−) mice were used in all experiments. Values were stated as mean ± SEM (n = 6) (H). Values were stated as mean ± SD (n = 4–5) (J). Statistical differences were analyzed using one-way ANOVA. **P < 0.01, ***P < 0.001. Scale bar: 20 μm. (K) Representative confocal images depicting ER-phagy levels in the heart sections and quantitative analysis of ER-phagy level of heart in ER-TRG (+/−) mice. Values were stated as mean ± SD (n = 5). Scale bar: 20 μm. (L) Immunoblot analysis of ssRFP-GFP-KDEL expression in various tissues of transgenic mice. Tissue homogenates from one wild-type and one ER-TRG (+/−) transgenic mouse were probed with specific antibodies. Both full-length RFP-GFP and RFP fragments were detected using an anti-RFP antibody. The band intensity of RFP fragments relative to full-length RFP-GFP indicates the presence of ER-phagy products, signifying ER-phagy activity. GAPDH and Tubulin were used as internal controls. See also Fig. S3. Source data are available for this figure: SourceData F5.
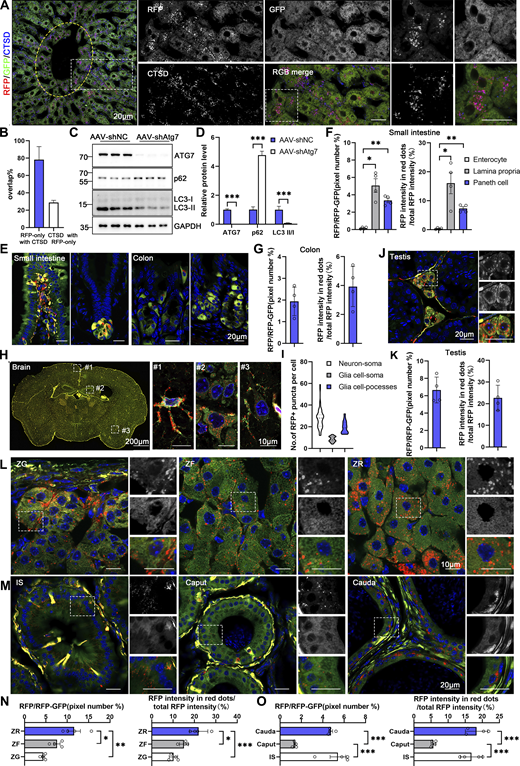
Spatial assessment of ER-phagy activity and ER architecture in different tissues (related to Fig. 5 ). (A) Colabeling with CTSD indicates that almost all red-positive compartments are also lysosomal marker positive and yield purple (red: RFP+, blue: CTSD+) signals in the hepatocytes of 8-wk-old ER-TRG (+/−) mice. Lysosomes not engaged in autophagy (CTSD negative) remain blue. An inset shows an enlarged view of the area indicated by the yellow dashed frame. The area inside the yellow dashed box represents the vicinity of the CV zone, while the area outside the yellow dashed box represents the areas away from the CV zone. Scale bar: 20 μm. (B) Quantification of RFP-only ERlysosomes (RFP+CTSD+) in liver sections obtained from ER-TRG mice. Values were stated as mean ± SD (n = 4). (C and D) Immunoblotting analysis of ATG7, p62, and LC3 in primary hepatocytes indicates the efficiency of ATG7 knockdown by AAV infection. Cell extracts from AAV-shNC and AAV-shAtg7 transgenic mice were examined via immunoblotting with specific antibodies. GAPDH and Tubulin served as internal controls. Values were stated as mean ± SEM (n = 5 per group). Statistical significance was determined using Student’s t test, with ***P < 0.001. (E–G) Confocal imaging and quantitative analysis of the intestines and colons from adult ER-TRG (+/−) reporter mice reveal varied ER abundance and ER-phagy activity in the villi of the small intestine and crypt (left) (E and F), compared to the comparable ER-phagy activity in colon cells (right) (E and G). Values were stated as mean ± SEM (n = 4) (F). Values were stated as mean ± SD (n = 4) (G). Statistical differences were analyzed using one-way ANOVA. *P < 0.05, **P < 0.01. Scale bar: 20 μm. (H and I) ER abundance and positioning of ER-phagy signals within the mouse brain. Magnified images highlight RFP-only signals in cells of various tissues, with specific focus on an astrocyte (#1), neurons around the hippocampus (#2), and neurons around the cortex (#3) in the brain. Quantitative analysis of ER-phagy puncta of cells in the brain of adult male ER-TRG (+/−) mice (I). n = 60–80 cells per group from three mice. Scale bars: 200 μm (thumbnail), 10 μm (inset). (J and K) Confocal imaging and quantitative analysis of ER-phagy level of the testis in adult male ER-TRG (+/−) reporter mice. Values were stated as mean ± SD (n = 4). Scale bar: 20 μm. (L–O) Confocal imaging of the adrenal glands and epididymis from adult ER-TRG (+/−) mice. Magnified images depicting the smooth ER (SER) architecture and localization of ER-phagy signals within the adrenal glands (L and N). The zona grannulosa (ZG), zona fasciculata (ZF), and zona reticulosa (ZR) regions were examined. A magnified view highlights RFP-only signals in cells of adrenal glands (n = 4). Scale bar: 10 μm. Magnified images and quantitative analysis show RFP-only signals in cells of epididymis, with the initial segment (IS), caput, and cauda regions displaying varying levels of ER-phagy across different cell types (n = 4) (M and O). Values were stated as mean ± SEM. Statistical differences were analyzed using one-way ANOVA. *P < 0.05, **P < 0.01, ***P < 0.001. Scale bar: 20 μm. Source data are available for this figure: SourceData FS3.
Spatial assessment of ER-phagy activity and ER architecture in different tissues (related to Fig. 5 ). (A) Colabeling with CTSD indicates that almost all red-positive compartments are also lysosomal marker positive and yield purple (red: RFP+, blue: CTSD+) signals in the hepatocytes of 8-wk-old ER-TRG (+/−) mice. Lysosomes not engaged in autophagy (CTSD negative) remain blue. An inset shows an enlarged view of the area indicated by the yellow dashed frame. The area inside the yellow dashed box represents the vicinity of the CV zone, while the area outside the yellow dashed box represents the areas away from the CV zone. Scale bar: 20 μm. (B) Quantification of RFP-only ERlysosomes (RFP+CTSD+) in liver sections obtained from ER-TRG mice. Values were stated as mean ± SD (n = 4). (C and D) Immunoblotting analysis of ATG7, p62, and LC3 in primary hepatocytes indicates the efficiency of ATG7 knockdown by AAV infection. Cell extracts from AAV-shNC and AAV-shAtg7 transgenic mice were examined via immunoblotting with specific antibodies. GAPDH and Tubulin served as internal controls. Values were stated as mean ± SEM (n = 5 per group). Statistical significance was determined using Student’s t test, with ***P < 0.001. (E–G) Confocal imaging and quantitative analysis of the intestines and colons from adult ER-TRG (+/−) reporter mice reveal varied ER abundance and ER-phagy activity in the villi of the small intestine and crypt (left) (E and F), compared to the comparable ER-phagy activity in colon cells (right) (E and G). Values were stated as mean ± SEM (n = 4) (F). Values were stated as mean ± SD (n = 4) (G). Statistical differences were analyzed using one-way ANOVA. *P < 0.05, **P < 0.01. Scale bar: 20 μm. (H and I) ER abundance and positioning of ER-phagy signals within the mouse brain. Magnified images highlight RFP-only signals in cells of various tissues, with specific focus on an astrocyte (#1), neurons around the hippocampus (#2), and neurons around the cortex (#3) in the brain. Quantitative analysis of ER-phagy puncta of cells in the brain of adult male ER-TRG (+/−) mice (I). n = 60–80 cells per group from three mice. Scale bars: 200 μm (thumbnail), 10 μm (inset). (J and K) Confocal imaging and quantitative analysis of ER-phagy level of the testis in adult male ER-TRG (+/−) reporter mice. Values were stated as mean ± SD (n = 4). Scale bar: 20 μm. (L–O) Confocal imaging of the adrenal glands and epididymis from adult ER-TRG (+/−) mice. Magnified images depicting the smooth ER (SER) architecture and localization of ER-phagy signals within the adrenal glands (L and N). The zona grannulosa (ZG), zona fasciculata (ZF), and zona reticulosa (ZR) regions were examined. A magnified view highlights RFP-only signals in cells of adrenal glands (n = 4). Scale bar: 10 μm. Magnified images and quantitative analysis show RFP-only signals in cells of epididymis, with the initial segment (IS), caput, and cauda regions displaying varying levels of ER-phagy across different cell types (n = 4) (M and O). Values were stated as mean ± SEM. Statistical differences were analyzed using one-way ANOVA. *P < 0.05, **P < 0.01, ***P < 0.001. Scale bar: 20 μm. Source data are available for this figure: SourceData FS3.
Within the alveoli of the lung, ER-phagy activity was heterogeneous, with vigorous RFP+GFP− signals observed in a small portion of the cells. In contrast, the bronchi of the lung, particularly the epithelial cells constituting the inner layer, displayed strong ER-phagy flux (Fig. 5, G and H). Adipose tissues showed robust ER-phagy flux in both interscapular BAT and epididymal white adipose tissues (eWAT), each possessing distinct physiological features and metabolic behavior (Fig. 5, I and J). The small intestine exhibited relatively low ER-phagy activity in the epithelium, while Paneth cells displayed high ER-phagy activity (Fig. S3, E and F). In the colon, rich in goblet cells with a large quantity of rough endoplasmic reticulum due to their role in mucus secretion, the RFP+GFP+ double-labeled ER structure was abundant, though goblet cell ER-phagy was relatively mild (Fig. S3, E and G). Varying ER-phagy activity was also observed in cells of the brain, including glia cells and neurons (Fig. S3, H and I). Leydig cells of mouse testis and adrenal glands, crucial for steroid hormone biosynthesis dependent on the smooth ER, displayed typical reticular ER structures, accompanied by abundant ER-phagy signals (Fig. S3, J–L and N). Varying ER-phagy activity was detected within and across different subregions of the adrenal gland and the epididymis (Fig. S3, L–O). Sperm maturation processes from the caput to cauda of the epididymis exhibited different ER-phagy signals in the tubular cells, with higher activity observed in the cauda (Fig. S3, M and O). In the heart, basal ER-phagy activity appeared mild in the ventricle (Fig. 5 K). To further support the conclusion that ER-phagy flux varies among different tissues and organs, RFP cleavage was measured through anti-RFP western blot analysis. Robust-free RFP signals were detected in the pancreas, heart, kidney, eWAT, liver, and soleus muscle (Fig. 5 L). These results align with the imaging data.
ER-phagy varies during development (temporal)
The turnover rate of the ER and its architectural changes during animal development remain unknown. To address this question, we investigated the developmental dynamics of ER-phagy in various organs. Analysis of pancreatic ER-phagy at postnatal day 9 (P9) and P19 revealed static ER-phagy flux in the islets at a comparable level to adults. In contrast, in acinar tissues, ER-phagy activity sharply decreased from P9 to P19 but rebounded to a high level in the adult stage (Fig. 6, A and B). Some adult ER-TRG mice exhibited a swelling phenotype in acinar cells, suggesting a potential side effect caused by probe expression in this subtissue. However, no other morphological abnormalities were observed in ER-TRG mice in this study. Next, we found that renal ER-phagy increased from a mild level at P9 to vigorous activity at P19 (Fig. 6 C). Immunoblotting data were comparable with the imaging data (Fig. 6, D–G). In small intestines at P9, the epithelial cell layer of villus tips exhibited high ER-phagy activity, which nearly disappeared in the adult stage (Fig. 6, H–J). In contrast, although capillaries and lymphatic vessels located in the middle of villi had a high content of the ER network, these tissues showed low ER-phagy activities at P9, which dramatically increased during the adult stage (Fig. 6, I and J). The embryonic heart showed mild and evenly distributed ER-phagy flux, incrementally elevating during development (Fig. 7, A–D). In contrast, overall ER-phagy activity in hepatocytes gradually increased and then became static from P19 to the adult stage (Fig. 7, E and F). RFP cleavage was measured through anti-RFP western blot analysis. Relative free RFP to total RFP-GFP levels were detected in the heart and liver, and the results were consistent with the imaging data (Fig. 7, G–J).
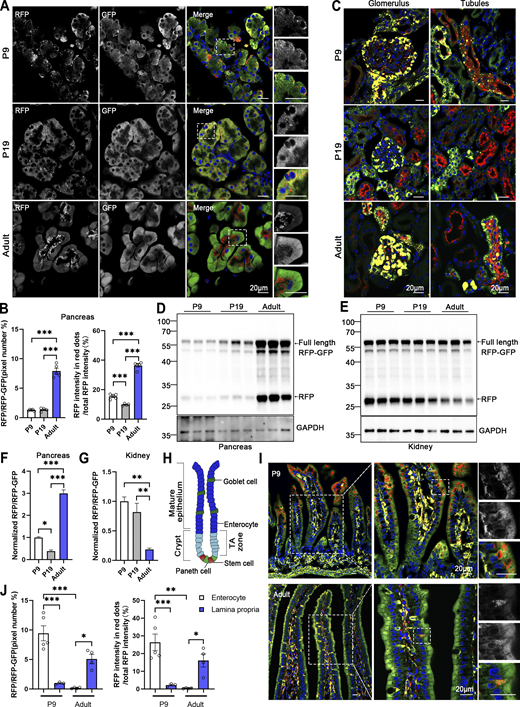
Comparative analysis of ER-phagy and ER network in developing and adult tissues. (A) Representative images of pancreas sections at postnatal day 9 (P9), P19, and in adulthood from ER-TRG (+/−) reporter mice. Scale bar: 20 μm. (B) Quantitative analysis of ER-phagy in pancreas from ER-TRG (+/−) reporter mice at P9, P19, and Adult. Confocal images in 6A were quantified. Values were stated as mean ± SEM (n = 4–5 per group). Statistical differences were evaluated using one-way ANOVA. ***P < 0.001. (C) Representative images of kidney sections at P9, P19, and in adulthood from ER-TRG (+/−) reporter mice (n = 4 per group). Scale bar: 20 μm. (D–G) Immunoblot and quantitative analysis showing ER-phagy activities in pancreas and kidney isolated from ER-TRG (+/−) reporter at P9, P19, Adult. The band intensities of RFP and RFP-GFP were quantified and the ratio of RFP:RFP-GFP (normalized to WT) is shown (F and G). Values were stated as mean ± SEM (n = 4–5 per group). Statistical differences were evaluated using one-way ANOVA. *P < 0.05, **P < 0.01, ***P < 0.001. (H) Schematic representation of the intestinal villus and crypt structure, including cell identities. The mature epithelium comprises goblet cells and enterocytes, while the crypt contains stem cells and Paneth cells in the transit amplifying (TA) zone. (I and J) Representative images of small intestine sections and quantitative analysis of ER-phagy activities in sub-regions at P9 and in adulthood from ER-TRG (+/−) reporter mice. A magnified view highlights RFP-only signals in the cells of the intestinal villus. Values were stated as mean ± SEM (n = 3–5 per group). Statistical differences were evaluated using two-way ANOVA. *P < 0.05, **P < 0.01, ***P < 0.001. Scale bar: 20 μm. Source data are available for this figure: SourceData F6.
Comparative analysis of ER-phagy and ER network in developing and adult tissues. (A) Representative images of pancreas sections at postnatal day 9 (P9), P19, and in adulthood from ER-TRG (+/−) reporter mice. Scale bar: 20 μm. (B) Quantitative analysis of ER-phagy in pancreas from ER-TRG (+/−) reporter mice at P9, P19, and Adult. Confocal images in 6A were quantified. Values were stated as mean ± SEM (n = 4–5 per group). Statistical differences were evaluated using one-way ANOVA. ***P < 0.001. (C) Representative images of kidney sections at P9, P19, and in adulthood from ER-TRG (+/−) reporter mice (n = 4 per group). Scale bar: 20 μm. (D–G) Immunoblot and quantitative analysis showing ER-phagy activities in pancreas and kidney isolated from ER-TRG (+/−) reporter at P9, P19, Adult. The band intensities of RFP and RFP-GFP were quantified and the ratio of RFP:RFP-GFP (normalized to WT) is shown (F and G). Values were stated as mean ± SEM (n = 4–5 per group). Statistical differences were evaluated using one-way ANOVA. *P < 0.05, **P < 0.01, ***P < 0.001. (H) Schematic representation of the intestinal villus and crypt structure, including cell identities. The mature epithelium comprises goblet cells and enterocytes, while the crypt contains stem cells and Paneth cells in the transit amplifying (TA) zone. (I and J) Representative images of small intestine sections and quantitative analysis of ER-phagy activities in sub-regions at P9 and in adulthood from ER-TRG (+/−) reporter mice. A magnified view highlights RFP-only signals in the cells of the intestinal villus. Values were stated as mean ± SEM (n = 3–5 per group). Statistical differences were evaluated using two-way ANOVA. *P < 0.05, **P < 0.01, ***P < 0.001. Scale bar: 20 μm. Source data are available for this figure: SourceData F6.
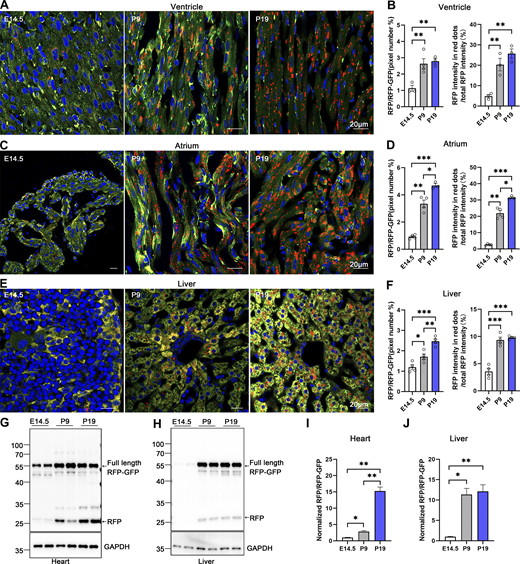
Comparative analysis of ER-phagy and ER network in developing heart and liver. (A–D) Representative images of heart sections and quantitative analysis from ER-TRG (+/−) reporter mice at E14.5, P9, P19. Panel A illustrates ER-phagy signals in the ventricle, while Panel C depicts these signals in the atrium, across the same developmental stages. The pixel number of RFP-only signals and total RFP signals were calculated by ImageJ and the ratio of RFP: total area (RFP+GFP) was quantified (left). The intensity of RFP-only signals and total RFP signals were calculated by ImageJ on a pixel-by-pixel basis and the fluorescence ratio of RFP: total RFP were quantified (right). Values were stated as mean ± SEM (n = 3–4 per group). Statistical differences were evaluated using one-way ANOVA. *P <0.05, **P <0.01, ***P <0.001. Scale bar: 20 μm. (E and F) Confocal imaging of ER-phagy activities and quantitative analysis in liver sections from ER-TRG (+/−) reporter mice at E14.5, P9, P19. Values were stated as mean ± SEM (n = 4 per group). Statistical differences were evaluated using one-way ANOVA. *P < 0.05, **P < 0.01, ***P < 0.001. Scale bar: 20 μm. (G–J) Immunoblot and quantitative analysis showing ER-phagy activities in heart and liver isolated from ER-TRG (+/−) reporter at E14.5, P9, and P19. The band intensities of RFP and RFP-GFP were quantified and the ratio of RFP:RFP-GFP (normalized to WT) is shown (I and J). Values were stated as mean ± SEM (n = 4–5 per group). Statistical differences were evaluated using one-way ANOVA. *P < 0.05, **P < 0.01. Source data are available for this figure: SourceData F7.
Comparative analysis of ER-phagy and ER network in developing heart and liver. (A–D) Representative images of heart sections and quantitative analysis from ER-TRG (+/−) reporter mice at E14.5, P9, P19. Panel A illustrates ER-phagy signals in the ventricle, while Panel C depicts these signals in the atrium, across the same developmental stages. The pixel number of RFP-only signals and total RFP signals were calculated by ImageJ and the ratio of RFP: total area (RFP+GFP) was quantified (left). The intensity of RFP-only signals and total RFP signals were calculated by ImageJ on a pixel-by-pixel basis and the fluorescence ratio of RFP: total RFP were quantified (right). Values were stated as mean ± SEM (n = 3–4 per group). Statistical differences were evaluated using one-way ANOVA. *P <0.05, **P <0.01, ***P <0.001. Scale bar: 20 μm. (E and F) Confocal imaging of ER-phagy activities and quantitative analysis in liver sections from ER-TRG (+/−) reporter mice at E14.5, P9, P19. Values were stated as mean ± SEM (n = 4 per group). Statistical differences were evaluated using one-way ANOVA. *P < 0.05, **P < 0.01, ***P < 0.001. Scale bar: 20 μm. (G–J) Immunoblot and quantitative analysis showing ER-phagy activities in heart and liver isolated from ER-TRG (+/−) reporter at E14.5, P9, and P19. The band intensities of RFP and RFP-GFP were quantified and the ratio of RFP:RFP-GFP (normalized to WT) is shown (I and J). Values were stated as mean ± SEM (n = 4–5 per group). Statistical differences were evaluated using one-way ANOVA. *P < 0.05, **P < 0.01. Source data are available for this figure: SourceData F7.
ER-phagy responses to physiopathological perturbations in vivo
Subsequently, we investigated whether ER-TRG mice can monitor the alteration of ER-phagy in vivo in response to different physiological and pathological stressors. ER-TRG mice were either fed ad libitum or subjected to 16 h of starvation. A significant increase in ER-phagy flux was detected in the liver, particularly around the CV area, in response to starvation (Fig. 8, A and B; and Fig. S4 A). However, starvation treatment failed to significantly boost ER-phagy activity in skeletal muscles (Fig. S4, B–D). These observations were further confirmed by the assessment of RFP cleavage within tissues by western blot analysis (Fig. S4, B and C). These results indicated that ER-phagy pathways in different tissues possess distinct sensitivity to environmental stressors. Next, we constructed a hepatic cancer mouse model using ER-TRG mice by tail-vein injection of a mixture of three recombinant plasmids expressing c-Myc and N-Ras, respectively (Chen and Calvisi, 2014). Hepatic tumors were observed in the fourth week after DNA administration (Fig. S4 E). Malignant features of the tumor tissues were confirmed by hematoxylin and eosin (HE) staining. ER-phagy activity was largely abolished in the tumor tissues compared with the para-carcinoma tissues or the liver tissues in control mice (Fig. 8, C and D; and Fig. S4, F–H). The results were further validated by measuring RFP cleavage within tissues by western blot analysis (Fig. S4, I and J). Furthermore, we established a mouse muscle repair model by injecting 10 μM cardiotoxin (CTX). We observed that ER-phagy levels in the tibialis (TA) with skeletal muscle injury were largely diminished compared with the control tissues (another leg in the same mouse) at post-injury day 1 (P1) (Fig. 8, E and F; and Fig. S4 K). At P3, the abundance of the ER network in damaged skeletal muscle significantly increased with a mild rise in ER-phagy activities. At P7, new myofibrils regenerated in situ, and the surrounding sarcoplasmic reticulum (SR) reformed; though ER-phagy flux partially recovered in these newborn myofibrils, it remained significantly lower than in mature myofibrils. Skeletal muscle samples were also analyzed by measuring RFP cleavage within tissues by western blot analysis (Fig. S4 L).

In vivo ER-phagy is sensitive to physio-pathological perturbations. (A and B) ER-phagy levels and quantitative analysis in the liver of ER-TRG (+/−) mice under ad libitum feeding and starvation conditions, respectively. Mice underwent a 16-h fast with free access to water, while control mice had ad libitum access to food and water. The pixel number of RFP-only, RFP+LAMP1+, and total area were calculated by ImageJ, and the ratio of RFP-only (or RFP+LAMP1+): the total area (RFP+GFP) was quantified. Values were stated as mean ± SEM (n = 5 per condition). Statistical differences were evaluated using Student’s t test. **P < 0.01, ***P < 0.001. Scale bar: 20 μm. (C and D) Quantitative analysis of ER-phagy levels in the liver of ER-TRG (+/−) mice with hepatic cancer. Confocal imaging shows reduced ER-phagy level at tumor sites compared to control liver or adjacent tissue. HC refers to hepatic cancer. Values were stated as mean ± SEM (n = 4 per condition). Statistical differences were assessed using Student’s t test. ***P < 0.001. Scale bar: 20 μm. (E and F) Representative confocal images and quantitative analysis of ER-phagy levels in the tibialis anterior (TA) muscle following skeletal muscle injury induced by 10 μM cardiotoxin compared with control tissues (the other leg in the same mouse). TA samples were collected and analyzed via confocal imaging on post-injury days 1, 3, and 7. Values were stated as mean ± SEM (n = 4 per condition). Statistical differences were determined using one-way ANOVA and Kruskal–Wallis test. *P < 0.05, **P < 0.01, *P < 0.001. Scale bar: 20 μm. See also Fig. S4.
In vivo ER-phagy is sensitive to physio-pathological perturbations. (A and B) ER-phagy levels and quantitative analysis in the liver of ER-TRG (+/−) mice under ad libitum feeding and starvation conditions, respectively. Mice underwent a 16-h fast with free access to water, while control mice had ad libitum access to food and water. The pixel number of RFP-only, RFP+LAMP1+, and total area were calculated by ImageJ, and the ratio of RFP-only (or RFP+LAMP1+): the total area (RFP+GFP) was quantified. Values were stated as mean ± SEM (n = 5 per condition). Statistical differences were evaluated using Student’s t test. **P < 0.01, ***P < 0.001. Scale bar: 20 μm. (C and D) Quantitative analysis of ER-phagy levels in the liver of ER-TRG (+/−) mice with hepatic cancer. Confocal imaging shows reduced ER-phagy level at tumor sites compared to control liver or adjacent tissue. HC refers to hepatic cancer. Values were stated as mean ± SEM (n = 4 per condition). Statistical differences were assessed using Student’s t test. ***P < 0.001. Scale bar: 20 μm. (E and F) Representative confocal images and quantitative analysis of ER-phagy levels in the tibialis anterior (TA) muscle following skeletal muscle injury induced by 10 μM cardiotoxin compared with control tissues (the other leg in the same mouse). TA samples were collected and analyzed via confocal imaging on post-injury days 1, 3, and 7. Values were stated as mean ± SEM (n = 4 per condition). Statistical differences were determined using one-way ANOVA and Kruskal–Wallis test. *P < 0.05, **P < 0.01, *P < 0.001. Scale bar: 20 μm. See also Fig. S4.
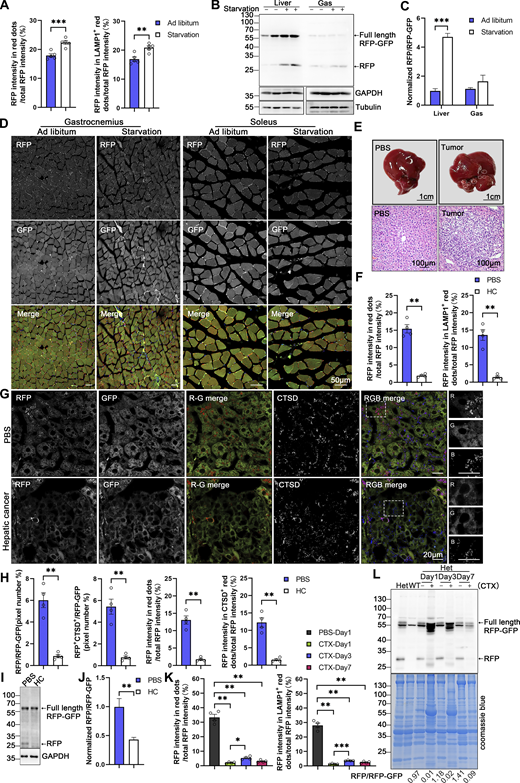
Assessment of ER-phagy in physio-pathological perturbations (related to Fig. 8 ). (A) Quantitative analysis indicated increased RFP+ and RFP+LAMP1+ signals at liver during starvation. The fluorescence intensity of RFP-only, RFP+LAMP1+ and total area were calculated respectively by ImageJ and the fluorescence ratio of RFP-only (or RFP+LAMP1+): the total RFP was quantified. Values were stated as mean ± SEM (n = 5 per condition). Statistical differences were analyzed using Student’s t test. **P < 0.01, ***P < 0.001. (B and C) Analysis of ER-phagy levels in the liver and skeletal muscle of transgenic mice during starvation by immunoblotting. Tissue homogenates from both regularly fed and starved mice were examined through immunoblotting. Full-length RFP-GFP and RFP fragments were detected with an anti-RFP antibody and the band intensity of RFP fragments relative to full-length RFP-GFP indicates the presence of ER-phagy products, signifying ER-phagy activity. GAPDH and Tubulin served as internal controls. Adult male wild-type and ER-TRG (+/−) mice were used in experiments. Values were stated as mean ± SEM (n = 4 per condition). Statistical differences were analyzed using two-way ANOVA. ***P < 0.001. (D) Confocal imaging of RFP and GFP signals in the skeletal muscles (gastrocnemius, soleus) of ER-TRG (+/−) mice under normal feeding and starvation. Scale bar: 50 μm. (E) Hematoxylin and Eosin (HE) staining of liver sections from PBS-treated and hepatic cancer model mice in ER-TRG (+/−) mice. Control mice received PBS injections, while model mice were injected with plasmids expressing C-Myc, N-Ras, and SB11 for 4 wk. Scale bars: 1 cm (top), 100 μm (bottom). (F) Quantitative analysis indicated reduced RFP+ and RFP+LAMP1+ signals at tumor sites compared with control liver or adjacent tissue. The fluorescence ratio of RFP-only (or RFP+LAMP1+): the total RFP was quantified. Values were stated as mean ± SEM (n = 4 per condition). Statistical differences were analyzed using Student’s t test. **P < 0.01. (G and H) ER-phagy levels and quantitative analysis in the liver of ER-TRG (+/−) mice with hepatic cancer. Confocal imaging reveals diminished ER-phagy at tumor sites relative to control liver or adjacent tissues, as indicated by CTSD co-staining. The pixel number, fluorescence intensity of RFP-only, RFP+CTSD+ and total area were calculated by ImageJ. The ratio of RFP-only (or RFP+CTSD+): the total area (RFP+GFP) and the fluorescence ratio of RFP-only (or RFP+CTSD+): the total RFP were quantified. Values were stated as mean ± SEM (n = 4 per condition). Statistical differences were assessed using Student’s t test. **P < 0.01. Scale bar: 20 μm. (I and J) Analysis of ER-phagy levels in the liver of ER-TRG (+/−) mice with hepatic cancer by immunoblotting. Values were stated as mean ± SEM (n = 4 per condition). Statistical differences were analyzed using Student’s t test. **P < 0.01. (K) Quantitative analysis indicated altered RFP+ and RFP+CTSD+ signals in muscle cells at injury area compared to PBS-treated tissue. The fluorescence ratio of RFP-only (or RFP+LAMP1+): the total RFP was quantified. Values were stated as mean ± SEM (n = 4 per condition). Statistical differences were analyzed using one-way ANOVA and Kruskal–Wallis test. *P < 0.05, **P < 0.01, ***P < 0.001. (L) Analysis of ER-phagy levels in the skeletal muscle of ER-TRG (+/−) mice with CTX injury by immunoblotting. The band intensity of RFP fragments relative to full-length RFP-GFP indicates the presence of ER-phagy products, signifying ER-phagy activity. Coomassie blue staining confirmed protein loading. Adult male wild-type and ER-TRG (+/−) mice were used in experiments. Source data are available for this figure: SourceData FS4.
Assessment of ER-phagy in physio-pathological perturbations (related to Fig. 8 ). (A) Quantitative analysis indicated increased RFP+ and RFP+LAMP1+ signals at liver during starvation. The fluorescence intensity of RFP-only, RFP+LAMP1+ and total area were calculated respectively by ImageJ and the fluorescence ratio of RFP-only (or RFP+LAMP1+): the total RFP was quantified. Values were stated as mean ± SEM (n = 5 per condition). Statistical differences were analyzed using Student’s t test. **P < 0.01, ***P < 0.001. (B and C) Analysis of ER-phagy levels in the liver and skeletal muscle of transgenic mice during starvation by immunoblotting. Tissue homogenates from both regularly fed and starved mice were examined through immunoblotting. Full-length RFP-GFP and RFP fragments were detected with an anti-RFP antibody and the band intensity of RFP fragments relative to full-length RFP-GFP indicates the presence of ER-phagy products, signifying ER-phagy activity. GAPDH and Tubulin served as internal controls. Adult male wild-type and ER-TRG (+/−) mice were used in experiments. Values were stated as mean ± SEM (n = 4 per condition). Statistical differences were analyzed using two-way ANOVA. ***P < 0.001. (D) Confocal imaging of RFP and GFP signals in the skeletal muscles (gastrocnemius, soleus) of ER-TRG (+/−) mice under normal feeding and starvation. Scale bar: 50 μm. (E) Hematoxylin and Eosin (HE) staining of liver sections from PBS-treated and hepatic cancer model mice in ER-TRG (+/−) mice. Control mice received PBS injections, while model mice were injected with plasmids expressing C-Myc, N-Ras, and SB11 for 4 wk. Scale bars: 1 cm (top), 100 μm (bottom). (F) Quantitative analysis indicated reduced RFP+ and RFP+LAMP1+ signals at tumor sites compared with control liver or adjacent tissue. The fluorescence ratio of RFP-only (or RFP+LAMP1+): the total RFP was quantified. Values were stated as mean ± SEM (n = 4 per condition). Statistical differences were analyzed using Student’s t test. **P < 0.01. (G and H) ER-phagy levels and quantitative analysis in the liver of ER-TRG (+/−) mice with hepatic cancer. Confocal imaging reveals diminished ER-phagy at tumor sites relative to control liver or adjacent tissues, as indicated by CTSD co-staining. The pixel number, fluorescence intensity of RFP-only, RFP+CTSD+ and total area were calculated by ImageJ. The ratio of RFP-only (or RFP+CTSD+): the total area (RFP+GFP) and the fluorescence ratio of RFP-only (or RFP+CTSD+): the total RFP were quantified. Values were stated as mean ± SEM (n = 4 per condition). Statistical differences were assessed using Student’s t test. **P < 0.01. Scale bar: 20 μm. (I and J) Analysis of ER-phagy levels in the liver of ER-TRG (+/−) mice with hepatic cancer by immunoblotting. Values were stated as mean ± SEM (n = 4 per condition). Statistical differences were analyzed using Student’s t test. **P < 0.01. (K) Quantitative analysis indicated altered RFP+ and RFP+CTSD+ signals in muscle cells at injury area compared to PBS-treated tissue. The fluorescence ratio of RFP-only (or RFP+LAMP1+): the total RFP was quantified. Values were stated as mean ± SEM (n = 4 per condition). Statistical differences were analyzed using one-way ANOVA and Kruskal–Wallis test. *P < 0.05, **P < 0.01, ***P < 0.001. (L) Analysis of ER-phagy levels in the skeletal muscle of ER-TRG (+/−) mice with CTX injury by immunoblotting. The band intensity of RFP fragments relative to full-length RFP-GFP indicates the presence of ER-phagy products, signifying ER-phagy activity. Coomassie blue staining confirmed protein loading. Adult male wild-type and ER-TRG (+/−) mice were used in experiments. Source data are available for this figure: SourceData FS4.
CA-ER-TRG mice enable the inducible assessment of ER-phagy in vivo
Our modern biomedical research has been significantly advanced by recombinase-based mouse genetic tools (Birling et al., 2009), allowing for the conditional activation or silencing of target gene expression in a spatially (using cell-type-specific promoters) and temporally (employing inducible promoters) controlled manner. To harness these advantages and study in vivo ER-phagy with improved spatiotemporal resolution, we generated Cre-recombinase-activated ER-TRG mice (CA-ER-TRG), expected to complement the application of ER-TRG mice. To address the potential issue of constitutive RFP accumulation in lysosomes, we explored the applicability of the inducible ER-TRG (Rosa CreERT2+/−; LSL-RFP-GFP-KDEL+/−) mice. To optimize induction conditions, the mice were treated with tamoxifen for 2 or 3 days and subsequently analyzed 5 or 7 days after induction with Rosa CreERT2−/−; LSL-RFP-GFP-KDEL+/− mice used as a control. We conducted a tissue-specific analysis of ER-phagy by immunoblotting, which detected the full-length RFP-GFP-KDEL and cleaved RFP in various tissues of tamoxifen-induced mice but not in the control (Fig. 9, A and B). Consistently, using confocal microscopy, we observed ER-phagy flux in the pancreas (Fig. 9, C and D), liver (Fig. 9, E and F), small intestine (Fig. 9, G and H), and Purkinje cells (Fig. 9, I and J; and Fig. S5 A). Additionally, we noted a robust response in ER-phagy flux alteration upon starvation treatment (Fig. S5, B–E). These results demonstrate that tamoxifen induction in ER-TRG mice enables effective measurement of ER-phagy flux across multiple tissues, as evidenced by the levels of cleaved RFP. These data further highlight tissue-specific variations in ER-phagy activity and confirm the utility of this inducible model for studying ER-phagy dynamics in vivo.
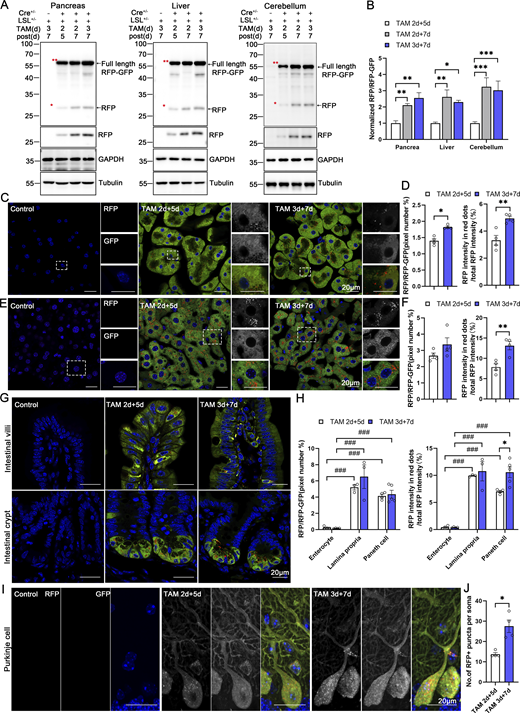
Assessment of ER-phagy activity in different tissues in inducible ER-TRG mice. (A) Immunoblot analysis showing the expression of ssRFP-GFP-KDEL in tissues isolated from inducible ER-TRG (Rosa CreERT2+/−; LSL-RFP-GFP-KDEL+/−) mice. Mice were treated with tamoxifen for 2 or 3 days, and samples were analyzed after 5 or 7 days and the Rosa CreERT2−/−; LSL-RFP-GFP-KDEL+/−was used as control. Full-length RFP-GFP, double red asterisk (**) and RFP fragments, single red asterisks (*), indicative of ER-phagy activity, were detected using an anti-RFP antibody. GAPDH and Tubulin were used as internal controls. (B) Quantification of immunoblots in panel A. The band intensities of RFP and RFP-GFP were quantified and the ratio of RFP:RFP-GFP (normalized to WT) is shown. Mice were treated with tamoxifen for 2 or 3 days, and samples were analyzed after 5 or 7 days. The Rosa CreERT2−/−; LSL-RFP-GFP-KDEL+/−was used as control. Values were stated as mean ± SEM (n = 3–4 per group). Statistical differences were evaluated using one-way ANOVA. *P < 0.05, **P < 0.01, ***P < 0.001. (C and D) ER-phagy levels and quantitative analysis in the pancreas of inducible ER-TRG (Rosa CreERT2+/−; LSL-RFP-GFP-KDEL+/−) mice. Mice were treated with tamoxifen for 2 or 3 days, and samples were analyzed after 5 or 7 days. The pixel number of RFP-only signals and total RFP signals were calculated by ImageJ and the ratio of RFP: total area (RFP+GFP) was quantified (left). The intensity of RFP-only signals and total RFP signals were calculated by ImageJ on a pixel-by-pixel basis and the fluorescence ratio of RFP: total RFP were quantified (right). Values were stated as mean ± SEM (n = 4 per group). Statistical differences were evaluated using Student’s t test. *P < 0.05, **P < 0.01. Scale bar: 20 μm. (E and F) ER-phagy levels and quantitative analysis in the liver of inducible ER-TRG (Rosa CreERT2+/−; LSL-RFP-GFP-KDEL+/−) mice. Mice were treated with tamoxifen for 2 or 3 days, and samples were analyzed after 5 or 7 days. Values were stated as mean ± SEM (n = 4 group). Statistical differences were evaluated using Student’s t test. **P < 0.01. Scale bar: 20 μm. (G and H) ER-phagy levels and quantitative analysis in the small intestine of inducible ER-TRG (Rosa CreERT2+/−; LSL-RFP-GFP-KDEL+/−) mice. The mice were induced by tamoxifen for 2 or 3 days and the samples were analyzed after 5 or 7 days. Values were stated as mean ± SEM (n = 3–5 per group). Statistical differences were evaluated using two-way ANOVA. ###P < 0.001 (comparison between different cells under the same treatment), *P < 0.05 (comparison between the same cell under different treatments). Scale bar: 20 μm. (I and J) ER-phagy levels and quantitative analysis in the Purkinje cells of inducible ER-TRG (Rosa CreERT2+/−; LSL-RFP-GFP-KDEL+/−) mice. Mice were treated with tamoxifen for 2 or 3 days, and samples were analyzed after 5 or 7 days. The images were enlargement of Fig. S5 A. The number of RFP-only puncta per soma of Purkinje cells were calculated by ImageJ and quantified in each treatment. Values were stated as mean ± SEM (n = 4 per group). Statistical differences were evaluated using Student’s t test. *P < 0.05. Scale bar: 20 μm. See also Fig. S5. Source data are available for this figure: SourceData F9.
Assessment of ER-phagy activity in different tissues in inducible ER-TRG mice. (A) Immunoblot analysis showing the expression of ssRFP-GFP-KDEL in tissues isolated from inducible ER-TRG (Rosa CreERT2+/−; LSL-RFP-GFP-KDEL+/−) mice. Mice were treated with tamoxifen for 2 or 3 days, and samples were analyzed after 5 or 7 days and the Rosa CreERT2−/−; LSL-RFP-GFP-KDEL+/−was used as control. Full-length RFP-GFP, double red asterisk (**) and RFP fragments, single red asterisks (*), indicative of ER-phagy activity, were detected using an anti-RFP antibody. GAPDH and Tubulin were used as internal controls. (B) Quantification of immunoblots in panel A. The band intensities of RFP and RFP-GFP were quantified and the ratio of RFP:RFP-GFP (normalized to WT) is shown. Mice were treated with tamoxifen for 2 or 3 days, and samples were analyzed after 5 or 7 days. The Rosa CreERT2−/−; LSL-RFP-GFP-KDEL+/−was used as control. Values were stated as mean ± SEM (n = 3–4 per group). Statistical differences were evaluated using one-way ANOVA. *P < 0.05, **P < 0.01, ***P < 0.001. (C and D) ER-phagy levels and quantitative analysis in the pancreas of inducible ER-TRG (Rosa CreERT2+/−; LSL-RFP-GFP-KDEL+/−) mice. Mice were treated with tamoxifen for 2 or 3 days, and samples were analyzed after 5 or 7 days. The pixel number of RFP-only signals and total RFP signals were calculated by ImageJ and the ratio of RFP: total area (RFP+GFP) was quantified (left). The intensity of RFP-only signals and total RFP signals were calculated by ImageJ on a pixel-by-pixel basis and the fluorescence ratio of RFP: total RFP were quantified (right). Values were stated as mean ± SEM (n = 4 per group). Statistical differences were evaluated using Student’s t test. *P < 0.05, **P < 0.01. Scale bar: 20 μm. (E and F) ER-phagy levels and quantitative analysis in the liver of inducible ER-TRG (Rosa CreERT2+/−; LSL-RFP-GFP-KDEL+/−) mice. Mice were treated with tamoxifen for 2 or 3 days, and samples were analyzed after 5 or 7 days. Values were stated as mean ± SEM (n = 4 group). Statistical differences were evaluated using Student’s t test. **P < 0.01. Scale bar: 20 μm. (G and H) ER-phagy levels and quantitative analysis in the small intestine of inducible ER-TRG (Rosa CreERT2+/−; LSL-RFP-GFP-KDEL+/−) mice. The mice were induced by tamoxifen for 2 or 3 days and the samples were analyzed after 5 or 7 days. Values were stated as mean ± SEM (n = 3–5 per group). Statistical differences were evaluated using two-way ANOVA. ###P < 0.001 (comparison between different cells under the same treatment), *P < 0.05 (comparison between the same cell under different treatments). Scale bar: 20 μm. (I and J) ER-phagy levels and quantitative analysis in the Purkinje cells of inducible ER-TRG (Rosa CreERT2+/−; LSL-RFP-GFP-KDEL+/−) mice. Mice were treated with tamoxifen for 2 or 3 days, and samples were analyzed after 5 or 7 days. The images were enlargement of Fig. S5 A. The number of RFP-only puncta per soma of Purkinje cells were calculated by ImageJ and quantified in each treatment. Values were stated as mean ± SEM (n = 4 per group). Statistical differences were evaluated using Student’s t test. *P < 0.05. Scale bar: 20 μm. See also Fig. S5. Source data are available for this figure: SourceData F9.
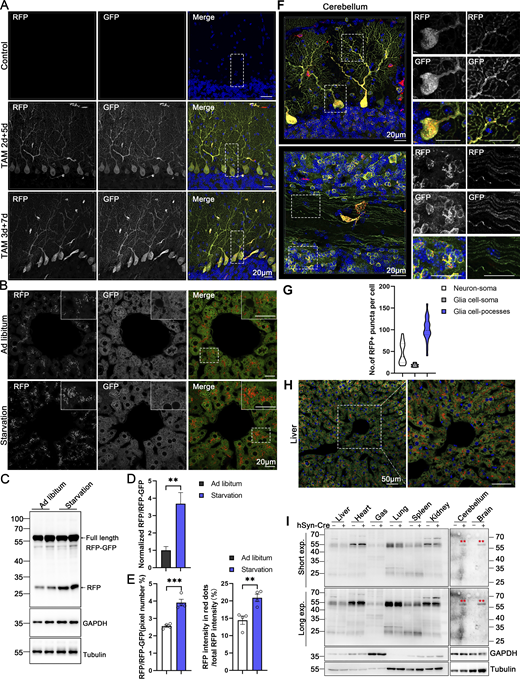
Assessment of ER-phagy activity in different tissues in inducible ER-TRG mice and in different CA-ER-TRG mice (related to Figs. 9 and 10 ). (A) Representative image of ER-phagy levels in cerebellum of inducible ER-TRG (Rosa CreERT2+/−; LSL-RFP-GFP-KDEL+/−) mice. The Rosa CreERT2−/−; LSL-RFP-GFP-KDEL+/−was used as control. (B–D) Analysis of ER-phagy levels in the liver of inducible ER-TRG (Rosa CreERT2+/−; LSL-RFP-GFP-KDEL+/−) mice by immunoblotting under ad libitum feeding and starvation conditions, respectively. Mice underwent a 16-h fast with free access to water, while control mice had ad libitum access to both food and water. Mice were treated with tamoxifen for 2 or 3 days, and samples were analyzed after 5 or 7 days. The immunoblots were quantified in panel D. Values were stated as mean ± SEM (n = 4 per group). Statistical differences were evaluated using Student’s t test. **P < 0.01. Scale bar: 20 μm. (E) Representative confocal images and quantitative analysis in the liver of inducible ER-TRG (Rosa CreERT2+/−; LSL-RFP-GFP-KDEL+/−) mice under starvation. Quantitative analysis revealed the ratio of RFP: total area (RFP+GFP) and the fluorescence ratio of RFP: total RFP intensity by ImageJ on a pixel-by-pixel basis. Values were stated as mean ± SEM (n = 4 per condition). Statistical differences were evaluated using Student’s t test. **P < 0.01, ***P < 0.001. Scale bar: 20 μm. (F) Assessment of ER-phagy in mature cerebellar neurons of CA-ER-TRG (+/−) mice. ER-TRG expression was induced in mature neurons using AAV-hSyn-Cre (n = 4 per group). RFP signals were detected in the soma and neuronal processes. Top: Combined RFP and GFP signals in the molecular layer. Bottom: Combined signals in the granule cell layer. Scale bar: 20 μm. (G) Quantitative analysis of ER-phagy levels in neurons and glia cells from AAV-hSyn-Cre-activated ER-TRG mice. The number of RFP-only puncta per soma or pocesses in hippocampal neurons and glia cells in brain was calculated using ImageJ and quantified for each treatment. n = 50–80 cells per group from three mice. (H) Confocal microscopy images of RFP and GFP fluorescence in the liver of AAV-TBG-Cre-activated ER-TRG (+/−) mice (n = 4 per group). The overlay of RFP and GFP signals corresponds with liver section images in ER-TRG mice. Scale bar: 50 μm. (I) Immunoblot analysis of ssRFP-GFP-KDEL in the brains of CA-ER-TRG mice revealed specific expression and ER-phagy signals in neurons induced by AAV-hSyn-Cre. Tissue homogenates from a control mouse and a CA-ER-TRG (+/−) transgenic mouse were examined using specific antibodies. Full-length RFP-GFP, double red asterisk (**) markers, were detected with an anti-RFP antibody. GAPDH and Tubulin were used as internal controls. Source data are available for this figure: SourceData FS5.
Assessment of ER-phagy activity in different tissues in inducible ER-TRG mice and in different CA-ER-TRG mice (related to Figs. 9 and 10 ). (A) Representative image of ER-phagy levels in cerebellum of inducible ER-TRG (Rosa CreERT2+/−; LSL-RFP-GFP-KDEL+/−) mice. The Rosa CreERT2−/−; LSL-RFP-GFP-KDEL+/−was used as control. (B–D) Analysis of ER-phagy levels in the liver of inducible ER-TRG (Rosa CreERT2+/−; LSL-RFP-GFP-KDEL+/−) mice by immunoblotting under ad libitum feeding and starvation conditions, respectively. Mice underwent a 16-h fast with free access to water, while control mice had ad libitum access to both food and water. Mice were treated with tamoxifen for 2 or 3 days, and samples were analyzed after 5 or 7 days. The immunoblots were quantified in panel D. Values were stated as mean ± SEM (n = 4 per group). Statistical differences were evaluated using Student’s t test. **P < 0.01. Scale bar: 20 μm. (E) Representative confocal images and quantitative analysis in the liver of inducible ER-TRG (Rosa CreERT2+/−; LSL-RFP-GFP-KDEL+/−) mice under starvation. Quantitative analysis revealed the ratio of RFP: total area (RFP+GFP) and the fluorescence ratio of RFP: total RFP intensity by ImageJ on a pixel-by-pixel basis. Values were stated as mean ± SEM (n = 4 per condition). Statistical differences were evaluated using Student’s t test. **P < 0.01, ***P < 0.001. Scale bar: 20 μm. (F) Assessment of ER-phagy in mature cerebellar neurons of CA-ER-TRG (+/−) mice. ER-TRG expression was induced in mature neurons using AAV-hSyn-Cre (n = 4 per group). RFP signals were detected in the soma and neuronal processes. Top: Combined RFP and GFP signals in the molecular layer. Bottom: Combined signals in the granule cell layer. Scale bar: 20 μm. (G) Quantitative analysis of ER-phagy levels in neurons and glia cells from AAV-hSyn-Cre-activated ER-TRG mice. The number of RFP-only puncta per soma or pocesses in hippocampal neurons and glia cells in brain was calculated using ImageJ and quantified for each treatment. n = 50–80 cells per group from three mice. (H) Confocal microscopy images of RFP and GFP fluorescence in the liver of AAV-TBG-Cre-activated ER-TRG (+/−) mice (n = 4 per group). The overlay of RFP and GFP signals corresponds with liver section images in ER-TRG mice. Scale bar: 50 μm. (I) Immunoblot analysis of ssRFP-GFP-KDEL in the brains of CA-ER-TRG mice revealed specific expression and ER-phagy signals in neurons induced by AAV-hSyn-Cre. Tissue homogenates from a control mouse and a CA-ER-TRG (+/−) transgenic mouse were examined using specific antibodies. Full-length RFP-GFP, double red asterisk (**) markers, were detected with an anti-RFP antibody. GAPDH and Tubulin were used as internal controls. Source data are available for this figure: SourceData FS5.
CA-ER-TRG mice facilitate cell type- and tissue-specific measurement of in vivo ER-phagy
As a proof-of-concept investigation, we selected the mouse brain, the most complex organ, to showcase the merits of spatial measurement of this tool. 4 wk after intravenous injection (tail vein) of a recombinant adeno-associated virus (AAV-PHP.eB) expressing Cre recombinase under a neuron-specific promoter (human Synapsin I, hSyn), we observed robust reporter expression in both the cell bodies and dendrites of Purkinje neurons in the cerebellar cortex (Fig. 10, A and B). The flask-shaped cell bodies exhibited modest levels of ER-phagy flux, while RFP+GFP− puncta were also observed in the dendrites, the extensions from cell bodies (Fig. S5 F). Similar ER-phagy flux patterns were observed in neurons in the CA1 region of the hippocampus in the forebrain (Fig. 10 C). Using a similar strategy, we labeled the ER network of astrocytes with a recombinant AAV-PHP.eB expressing Cre recombinase under an astrocyte-specific promoter (GFAP), revealing that ER-phagy flux in astrocytes is generally more robust than that in neurons (Fig. 10 D and Fig. S5 G). An unexpected feature of astrocytic ER-phagy was that the activity appeared to be more robust in pocesses than in the cell body (Fig. S5 G), highlighting the unknown reasons and mechanisms behind this intriguing phenotype. Additionally, we detected a small population of astrocytes showing mild ER-phagy activity around the hippocampus, indicating the heterogeneity of astrocytes in the brain (Fig. 10 D). To further demonstrate the broad application potential of CA-ER-TRG mice, we injected a recombinant AAV-expressing Cre recombinase under the control of the human thyroxine-binding globulin (TBG) promoter. This induced specific reporter expression in the liver, showing a similar ER-phagy flux pattern compared with ER-TRG mice (Fig. S5 H). Furthermore, the imaging results were confirmed by anti-RFP western blot analysis (Fig. 10, E and F; and Fig. S5 I). Together, CA-ER-TRG mice proved to be a versatile tool for cell- or tissue-specific assessment of ER-phagy in vivo.
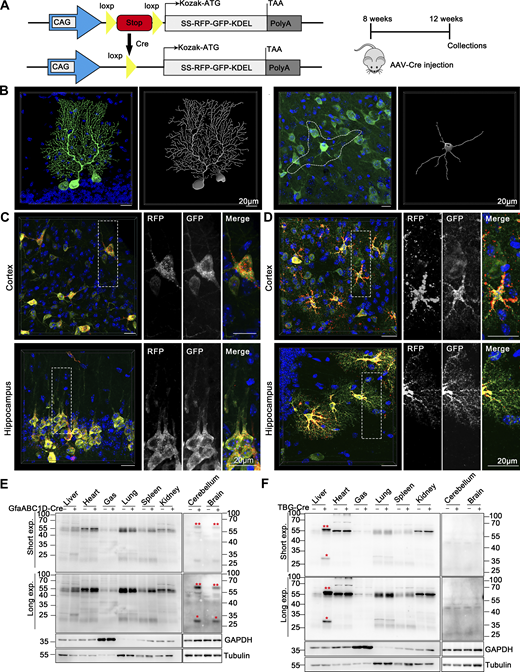
CA-ER-TRG mice enable spatiotemporal measurement of in vivo ER-phagy. (A) Generation of Cre-activated ER-TRG reporter mice (CA-ER-TRG) is illustrated. The gene targeting strategy (left) and the experimental procedure timeline (right) are depicted. CA-ER-TRG mice underwent AAV-Cre infection for 4 wk to induce reporter expression in specific cell types. (B) Confocal microscopy showcases GFP signals in the cerebellar and cerebral neurons of conditional ER-TRG (+/−) mice. Detailed images and 3D reconstructions reveal the ER morphology in Purkinje neurons of the cerebellum (left) and neurons in the brain (right). Infection with AAV-hSyn-Cre for 4 wk facilitated ER-TRG expression in mature neurons (n = 4 per group). Scale bar: 20 μm. (C) ER-phagy levels in mature forebrain neurons of CA-ER-TRG (+/−) mice were assessed. Expression of ER-TRG was induced in these neurons using AAV-hSyn-Cre. RFP-only signals were noted in the soma and axons of selected neurons. Top: Combined signals in the forebrain cortex. Bottom: Combined RFP and GFP signals in the CA1 region of the hippocampus (n = 4 per group). Scale bar: 20 μm. (D) Representative confocal images of RFP and GFP in CA-ER-TRG (+/−) mouse astrocytes. ER-TRG expression in astrocytes was induced using AAV-GFAP-Cre. ER-phagy levels varied among astrocytes in different brain regions. Top: High ER-phagy activity in cortical astrocytes (n = 4 per group). Bottom: Comparatively low activity in hippocampal astrocytes. Scale bar: 20 μm. (E and F) Expression of ssRFP-GFP-KDEL in various tissues of CA-ER-TRG (+/−) transgenic mice. Tissue homogenates from control and CA-ER-TRG (+/−) transgenic mice were analyzed via immunoblotting with specific antibodies. Activation of ssRFP-GFP-KDEL expression in the brain and liver was observed in mice treated with both AAV-GfaABC1D-Cre (E) and AAV-TBG-Cre (F). Full-length RFP-GFP, double red asterisk (**), and RFP fragments, single red asterisks (*), indicative of ER-phagy activity, were detected using an anti-RFP antibody. GAPDH and Tubulin served as internal controls. See also Fig. S5. Source data are available for this figure: SourceData F10.
CA-ER-TRG mice enable spatiotemporal measurement of in vivo ER-phagy. (A) Generation of Cre-activated ER-TRG reporter mice (CA-ER-TRG) is illustrated. The gene targeting strategy (left) and the experimental procedure timeline (right) are depicted. CA-ER-TRG mice underwent AAV-Cre infection for 4 wk to induce reporter expression in specific cell types. (B) Confocal microscopy showcases GFP signals in the cerebellar and cerebral neurons of conditional ER-TRG (+/−) mice. Detailed images and 3D reconstructions reveal the ER morphology in Purkinje neurons of the cerebellum (left) and neurons in the brain (right). Infection with AAV-hSyn-Cre for 4 wk facilitated ER-TRG expression in mature neurons (n = 4 per group). Scale bar: 20 μm. (C) ER-phagy levels in mature forebrain neurons of CA-ER-TRG (+/−) mice were assessed. Expression of ER-TRG was induced in these neurons using AAV-hSyn-Cre. RFP-only signals were noted in the soma and axons of selected neurons. Top: Combined signals in the forebrain cortex. Bottom: Combined RFP and GFP signals in the CA1 region of the hippocampus (n = 4 per group). Scale bar: 20 μm. (D) Representative confocal images of RFP and GFP in CA-ER-TRG (+/−) mouse astrocytes. ER-TRG expression in astrocytes was induced using AAV-GFAP-Cre. ER-phagy levels varied among astrocytes in different brain regions. Top: High ER-phagy activity in cortical astrocytes (n = 4 per group). Bottom: Comparatively low activity in hippocampal astrocytes. Scale bar: 20 μm. (E and F) Expression of ssRFP-GFP-KDEL in various tissues of CA-ER-TRG (+/−) transgenic mice. Tissue homogenates from control and CA-ER-TRG (+/−) transgenic mice were analyzed via immunoblotting with specific antibodies. Activation of ssRFP-GFP-KDEL expression in the brain and liver was observed in mice treated with both AAV-GfaABC1D-Cre (E) and AAV-TBG-Cre (F). Full-length RFP-GFP, double red asterisk (**), and RFP fragments, single red asterisks (*), indicative of ER-phagy activity, were detected using an anti-RFP antibody. GAPDH and Tubulin served as internal controls. See also Fig. S5. Source data are available for this figure: SourceData F10.
Discussion
We anticipate that these ER-phagy reporter mice will also facilitate sophisticated investigations into ER biology in vitro. First, these transgenic mice offer a substantial repository of FP-tagged whole organs or cell lines. These can be employed to isolate ER membranes for downstream studies, encompassing biochemistry, proteomics, metabolomics, or transcriptomics analyses. Second, microscopy-based ER research has encountered challenges in various cell types, including neurons and immune cells, which tend to be more sensitive to invasive genetic manipulations such as virus- or non-virus-based transfections. These reporter mice address the challenges by providing primary cells with FP-labeled organelles, offering more reliable research materials. Third, given that the content, size, morphology, and turnover rate of the ER structure can serve as indicators of the physiological status and stress conditions at the cellular or tissue levels, cell lines derived from the reporter mice can be conveniently employed for in vitro drug screening and toxicity evaluations.
As ER-phagy measurement relies on the ratio of RFP+GFP− to total fluorescence signals, we assert that the assessment of ER-phagy should be independent of the size of the ER network or the expression levels of the reporter. Indeed, our data demonstrates that in tissues expressing high levels of the reporter, ER-phagy is not necessarily robust. It is expected to detect highly intensified and differential zones of ER-phagy in organs such as the pancreas and thyroid gland, which play critical roles in secreting large amounts of protease or steroid hormones, respectively. Unexpectedly, we uncovered high ER-phagy flux in many tissues, including the adult lung alveoli and atrium, as well as the small intestines at P9. Additionally, we illustrate that these reporter mice can reveal the diversity of ER organization in specific subsets of cells within all investigated tissues.
The limitations of the study
The primary advantage of the probe lies in its broad coverage as it can illuminate the entire ER network and assess global ER-phagy flux in each individual cell of the transgenic reporter mice. Consequently, this reporter is unable to precisely evaluate the selective degradation of ER subdomains. Therefore, there is a need to design additional reporters to dissect the structure and lysosomal degradation of distinct ER substructures. The key to generating such specific reporters is to determine the optimal subdomain-targeting strategy. Unlike mitochondria, which form a discontinuous network, the ER is fully interconnected. Consequently, the overexpression of an ER membrane protein is expected to have two consequences. First, the overexpressed protein may be distributed (though not evenly) throughout the entire ER system. Second, the overexpression of subdomain-specific proteins can alter the structure and functionality of the ER (Chang et al., 2013; Chen et al., 2021; Fan et al., 2022; Fan et al., 2021; Hori et al., 2006; Jung et al., 2020; Lee et al., 2003; Lee et al., 2020b; Lin et al., 2012; Park et al., 2010; Pool, 2009; Schröder et al., 1999; Shibata et al., 2008; Voeltz et al., 2006; Wang et al., 2021; Xiao et al., 2017; Yamaguchi et al., 1999; Yao et al., 2018).
Previous studies have indicated that GFP-like proteins can accumulate in lysosomes (Katayama et al., 2008). However, the stability of GFP and RFP is crucial for establishing GFP cleavage assays and ratiometric tools. The RFP-GFP probe leverages the fluorescence quenching of GFP at acidic pH in autolysosomes, while RFP fluorescence remains stable in these conditions. Consequently, the constitutive accumulation of RFP in lysosomes may make it difficult to detect newly formed autolysosomes (Yim et al., 2022). To address this issue, a new strategy has been developed that can precisely measure autophagic flux in mammalian cell culture (Rudinskiy et al., 2022; Yim et al., 2022). It is currently unknown whether this new probe can be applied for in vivo autophagy flux assessment due to the need for in vivo administration of the Halo tag ligand. However, it provides a promising direction for future optimization of autophagy flux probes for in vivo application. In this study, while ER-TRG mice offer a convenient method to measure ER-phagy flux across different tissues, the effect of excessive RFP accumulation must be considered. To address these concerns, we generated conditional/inducible ER-phagy reporter mice, which may partially mitigate the RFP accumulation issues.
To depict a comprehensive landscape of organelle architecture and organelle-phagy in vivo, it is necessary to develop additional transgenic mouse tools for the in vivo characterization of other organelle-phagy processes, such as pexophagy, lipophagy, lysophagy, golgiphagy, and so on. With a library of these reporter mice, a systemic analysis of the organelle-phagy index and organelle architecture is expectable. These endeavors will provide a toolbox for organelle biology study, enabling a deeper understanding of the physio-pathological function of different selective autophagy processes.
Materials and methods
Mouse lines and animal care
The ER-TRG mice were created using CRISPR-Cas9 gene editing, following a constitutive knock-in strategy with the ssRFP-GFP-KDEL fusion protein. This process involved injecting a mixture of Cas9 protein, guide RNA (gRNA), and a donor vector containing a CAG promoter cassette and the open reading frame (ORF) for ssRFP-GFP-KDEL, including a Kozak sequence (GCCACC), into the H11 locus of the mouse genome. The injection was performed into the pronuclei of fertilized eggs from C57BL/6J mice supplied by Gempharmatech, China. Subsequently, the two-cell embryos were implanted into the oviducts of pseudopregnant foster mothers, as well as C57BL/6J mice from Gempharmatech, China. Genotyping of the offspring was conducted using PCR on genomic DNA extracted from tail biopsies. The primers used for ER-TRG genotyping to identify wild-type (WT) and knock-in alleles are in Table S1.
To generate inducible ER-TRG mice, we introduced a loxP-stop-loxP cassette between the CAG promoter and the ORF for the ssRFP-GFP-KDEL fusion protein, which included a Kozak sequence. This was followed by the established protocol outlined in the ER-TRG mouse model. Expression of ER-TRG was activated by Cre recombinase (termed CA-ER-TRG). For genotyping CA-ER-TRG to distinguish between WT and knock-in alleles, we used two primer pairs as shown in Table S1.
The RFP-GFP-Ckap4 and RFP-GFP-Reep5 knock-in mice were generated using CRISPR-Cas9 gene editing, following a constitutive knock-in strategy for the RFP-GFP fusion protein. This involved injecting a mixture of Cas9 protein, gRNA, and a donor vector—carrying the RFP-GFP ORF inserted at the 5′ terminus of the first exon of the Ckap4 and Reep5 loci—into the pronuclei of fertilized eggs from C57BL/6J mice. The resulting two-cell embryos were implanted into the oviducts of pseudopregnant foster mothers. Genotyping of the offspring was performed using PCR on genomic DNA from tail biopsies. The primers used for RFP-GFP-Ckap4 and RFP-GFP-Reep5 genotyping are provided in Table S1. All animal studies and breeding protocols were approved by the Zhejiang University Ethical Review Committee and conducted under the Office project license (Protocol No. IACUC-ZJU20220256).
Genetic models of altered ER-phagy activity
Mouse Atg7 oligonucleotides were cloned into pAV-U6 vectors, with the target sequence being 5′-TTCTGTCACGGTTCGATAATGTTCAAGAGACATTATCGAACCGTGACAGAATTTTTT-3′. The AAV9-pAV-U6-shAtg7 viruses were produced in accordance with the AAV packaging protocol provided by wzbio. A scrambled shRNA served as the control. To knock down Atg7 in ER-TRG mice, adult heterozygous mice carrying the ER-TRG gene received a 25 μl injection of AAV9-pAV-U6-shAtg7 virus (1 × 10¹³ copies per ml) intravenously. 2 mo after injection, the mice were euthanized, and their organs of interest were prepared for cryosectioning using a cryostat (NX50; Thermo Fisher Scientific). These sections were then analyzed using confocal imaging.
Physiological and pathological models of altered ER-Phagy activity
For assessing the effects of starvation, mice were fasted for 16 h in the cage, in which mice could drink water freely, while control mice were given ad libitum access to food and water. Liver samples were embedded in OCT compound (Sakura) and frozen sections were co-stained with DAPI (1 µg/ml; Beyotime).
To induce hepatocellular carcinoma in ER-TRG mice, mice were treated with a mixture of plasmids including PT3-EF1a-C-Myc, PT/Caggs-NRas-V12, and pCMV-SB11 as previously reported (Chen and Calvisi, 2014). This mixture comprised 19 µg of PT/Caggs-NRas-V12, 1 μg PT3-EF1a-C-Myc, and 2 µg pCMV-SB11, diluted in 2 ml of 0.9% NaCl, sterile-filtered, and rapidly injected into the lateral tail vein within 5–7 s. Control mice received a 200 μl PBS injection. Liver tumor nodules were assessed at 4 wk after treatment and subsequently excised for analysis.
For acute skeletal muscle injury and regeneration experiments, mice were anesthetized with sodium pentobarbital (50 mg/kg body mass) intraperitoneally and received a 20 μl injection of 10 µM CTX stock into the left tibialis anterior (TA) muscle. The contralateral limb, treated with PBS, served as a control. Muscles were harvested on days 1, 3, and 7 after CTX injection. The samples were then fixed in 4% PFA (Aladdin) and embedded in OCT compound for subsequent frozen section preparation.
Plasmids construction and stable cell line
ssRFP-GFP-KDEL, ssYPet-TOLLES-KDEL, RFP-GFP-RAMP4, and RFP-GFP-REEP5 were constructed by cloning their respective cDNAs into pcDNA5/FRT/TO-3XFlag using the BamHI site. Constructs of FAM134B-Flag, ATL3-Flag, CCPG1-Flag, RTN3L-Flag, SEC62-Flag, and TEX264-Flag were generated by inserting the corresponding cDNAs into pCDNA5/FRT/TO-3XFlag, which contains a carboxy-terminal Flag tag, using the BamHI site. ssRFP-GFP-KDEL was further subcloned into FUIPW using AscI and BamHI sites for the generation of stable cell lines. ssRFP-GFP-KDEL/HeLa stable cell lines were established through lentivirus infection and subsequently maintained with 1 µg/ml puromycin. Recombinant lentiviruses were produced in accordance with standard lentiviral packaging protocols.
Immunohistochemistry
To assess ER-phagy flux in vivo, mice were anesthetized and transcardially perfused with PBS to remove blood, followed by perfusion with freshly prepared 4% PFA (pH 7.0). Tissues were collected and postfixed in 4% PFA overnight at 4°C, using a volume of PFA ∼20 times that of the tissues to ensure thorough fixation. For certain experiments, tissues were briefly rinsed in PBS and immersion-fixed for 8–12 h at 4°C. After fixation, tissues were washed in PBS and subjected to density-dependent cryoprotection in 20% and 30% (wt/vol) sucrose/PBS solutions at 4°C. Cryoprotected tissues were embedded in OCT and sectioned using a cryostat. Sections were then mounted on adhesive slides (SHITAI) and stored at 4°C. For immunostaining, tissue sections were rehydrated and washed in PBS, followed by counterstaining with DAPI (1 µg/ml) for 10 min. After washing in PBS, sections were mounted using a mounting reagent (0100-01; SouthernBiotech). For immunohistochemical detection of specific markers, sections were rehydrated, washed in PBS, and then blocked and incubated in 1–5% BSA containing 0.3–0.8% Triton X-100, tailored to each primary antibody. For staining with monoclonal antibodies (CTSD, 1:200, CST; LAMP1, 1:200; CST), sections were blocked with goat serum for 1 h. Following a PBS wash, sections were incubated with fluorophore-conjugated secondary antibodies (1:500, Alexa Fluor 647; Thermo Fisher Scientific) for 1 h at room temperature. After subsequent washes in PBS, sections were counterstained with DAPI. Immunolabeled sections were then washed and mounted with the mounting reagent (0100-01; SouthernBiotech) for confocal imaging.
Fluorescence imaging
Immunohistochemistry was conducted as previously described (Lee et al., 2019). Immediately after sectioning, tissue sections were immunolabeled with specified antibodies overnight and then visualized using Alexa Fluor-conjugated secondary antibodies. Imaging was carried out on a Zeiss LSM 800 laser scanning confocal microscope equipped with a Plan-Apochromat 63×/1.4-NA oil-immersion objective, 40×/0.95-NA air-immersion objective, and photomultiplier tube detector with the following settings: GFP (ex: 488 nm, em: 480–580 nm), RFP (ex: 561 nm, em: 575–700 nm), DAPI (ex: 353 nm, em: 40–495 nm), and Alexa Fluor 647 (ex: 633 nm, em: 640–710 nm), utilizing separate scanning tracks for each excitation and emission set. For tandem fluorescence acquisition, imaging was performed on an LSM 880 laser scanning confocal microscope with Plan-Apochromat 63×/1.4-NA oil immersion objective, with these settings: GFP (ex: 488 nm, em: 480–580 nm with MBS 488), RFP (ex: 561 nm, em: 575–700 nm with MBS 458/561), TOLLES (ex: 445 nm, em: 460–500 nm with MBS 458), and YPet (ex: 514 nm, em: 530–580 nm with MBS 458/514), again using separate scanning tracks for each set, as previously reported (Katayama et al., 2020; Lee et al., 2019). Images were acquired using ZEN (blue edition) software. 3D reconstructions were performed by Imaris 9.3.1 software. GFP, in its monomeric form, is brighter than RFP. However, when RFP accumulates in vesicular structures and becomes multimeric, it emits a significantly brighter signal than its monomeric state, resulting in vesicle signal intensities that exceed the “background” of cytosolic RFP monomer. This phenomenon does not occur with GFP. Consequently, gain adjustments are made individually for each fluorophore and may vary to optimally visualize different tissues. Gain settings are determined based on the RFP intensity in the tissue sections and are kept consistent across the same tissues in comparative studies.
For quantification, gain settings were optimized by averaging the gain of six sections for each channel, ensuring signal maximization below saturation while preventing undersaturation based on the “gain/offset histogram” tool in Zen Black. This approach allowed for clear visualization of unsaturated, separate RFP puncta in the cells. Subsequently, GFP fluorescence intensity was adjusted to distinctly highlight RFP-only puncta and minimize the diffuse RFP+GFP+ signal. In most images, the GFP signal was slightly increased to delineate the contours of cells and tissues more clearly. CTSD and LAMP1 gains and offsets were set using the same criteria when applicable. Each image represents a minimum of four to five animals.
AAV-based Cre recombinase delivery to CA-ER-TRG mice
AAV-based Cre recombinase delivery was employed to activate ER-TRG gene expression in specific cells of CA-ER-TRG mice. These mice were administered AAV encoding Cre via tail-vein injections. The adenovirus-associated virus, produced by the viral core facility at Zhejiang University, was titrated to a concentration of 1 × 10¹³ copies per mL for the injections. AAV-PHP.eB-hSyn-Cre and AAV-PHP.eB-GFAP-Cre/AAV-PHP.eB-GfaABC1D-Cre vectors were utilized to induce ER-TRG expression in mature neurons and astrocytes, respectively, within the mouse brain. For hepatocyte targeting, AAV2/8-TBG-Cre (OBIO) was used. 4 wk after injection, the mice were anesthetized and transcardially perfused with PBS. Subsequently, mouse tissues were fixed, sectioned using a cryostat, and prepared for confocal imaging analysis.
Cell culture and reagents
HeLa and ssRFP-GFP-KDEL/HeLa stable cell lines were cultured in Dulbecco’s Modified Eagle’s Medium (DMEM; BasalMedia Bio) supplemented with 10% fetal bovine serum (ExCell Bio) and 1% penicillin–streptomycin (Sigma-Aldrich) in a 37°C incubator under a humidified 5% CO2 atmosphere. MEFs were isolated from E13.5 embryos of time-mated pregnant females. The embryos were decapitated and eviscerated, and MEFs were obtained using standard protocols, and then cultured in DMEM supplemented with 10% fetal bovine serum and 1% penicillin–streptomycin, under the same incubation conditions. Primary hepatocytes, derived from adult male mouse liver, were prepared as previously described (Charni-Natan and Goldstein, 2020). This involved cannulating the vena cava after anesthesia, perfusing the liver to chelate calcium and clear blood, followed by perfusion with collagenase (Gibco) to dissociate the extracellular matrix before liver dissection. The hepatocytes were then harvested and cultured in DMEM with 10% fetal bovine serum and 1% penicillin–streptomycin in a 37°C incubator with a humidified 5% CO2 atmosphere. Dorsal root ganglion neurons were prepared as previously reported (Wang and Marquardt, 2012). The neurons, isolated from E14.5 embryos of pregnant mice, were cultured in Neurobasal Medium. This medium was prepared by adding 5 ml of B-27 supplement (1:50; Thermo Fisher Scientific), 2.5 ml of L-glutamic acid (50 mM; Sigma-Aldrich), 0.92 g of L-glutamine (Sigma-Aldrich), and 2.5 ml of penicillin–streptomycin (100×) to 240 ml of Neurobasal Medium (Gibco), and then filter-sterilized. For LysoTracker staining (1:5,000; Thermo Fisher Scientific), cells were incubated for 1 h at 37°C in a growth medium containing LysoTracker, in preparation for subsequent imaging.
Antibodies and western blotting
Cells for protein analysis were lysed in 1 × loading buffer, while animal tissues, specifically mouse tissues, were rapidly excised, snap-frozen in liquid nitrogen, and stored at −80°C. These tissues were then homogenized on ice in a 10-fold mass excess of ice-cold RIPA buffer containing 50 mM Tris-HCl (pH 7.5), 1 mM EDTA, 1 mM EGTA, 1% Triton X-100, 1 mM sodium orthovanadate, 50 mM NaF, 5 mM sodium pyrophosphate, 0.27 M sucrose, Complete protease inhibitor cocktail (Roche), and phosphatase inhibitor (Selleck). Lysates were clarified by centrifugation at 13,000 g for 30 min at 4°C. The supernatants were carefully removed, snap-frozen, and stored at −80°C. For electrophoresis, 20–30 μg of denatured protein lysates were loaded onto the same SDS-PAGE gel. The resolved proteins were subsequently transferred to polyvinylidene fluoride (PVDF) membranes (Millipore) using standard techniques to compare protein expression levels. Immunoblots were blocked with 5% BSA and incubated overnight at 4°C with primary antibodies against PERK (1:1,000; CST), phosphorylated PERK (p-PERK, 1:1,000; CST), RFP (1:2,000; Thermo Fisher Scientific), CKAP4 (1:4,000; Proteintech), REEP5 (1:2,000; Proteintech), p62 (1:2,000; ABclonal), LC3 (1:2,000; Proteintech), ATG7 (1:10,000; CST), Tubulin (1:2,000; Proteintech), and GAPDH (1:2,000; Proteintech). Goat anti-rabbit antibody (1:5,000; Proteintech) was used for detection. Immunodetection was performed using an enhanced chemiluminescence (ECL) kit (Tanon). All antibodies used in this study are listed in Table S2. Images were captured by an imaging scanning system (5200; Tanon). Band intensity quantification was performed with ImageJ.
Fluorescence quantification
We established a method that quantifies the intensity-weighted distribution of RFP/GFP fluorescence ratios on a per-pixel basis (Kaizuka et al., 2016; Katayama et al., 2020; Sun et al., 2015). Also, the number of RFP or mCherry positive puncta was used to assess the organelles-phagy level (Lee et al., 2019; McWilliams et al., 2016) in some conditions. In mouse studies, pixel intensities of GFP and RFP signals in the targeted tissue area were obtained using the ROI tool in ImageJ.
Assessment of ER-phagy using ER-TRG or CA-ER-TRG is shown in Fig. S2 J. (i) Image of a hepatic section from the CA-ER-TRG mouse. (B) Pixel intensity map of the hepatic region of a CA-ER-TRG mouse shown in the previous panel. Analysis of fluorescence images and creation of ratiometry images were performed using ImageJ. In the ratiometric images, the red signal represents high RFP/GFP and high ER-phagy flux and the blue signal represents low RFP/GFP and low ER-phagy flux. Binarized images of (ii) are displayed on the right, generated using the threshold tool with Otsu’s method in ImageJ (Otsu, 1979). (iv) Histograms depict RFP/GFP ratios from tissue signals shown in (B), with the red dotted line indicating the threshold. (v) Define the level of ER-phagy from two aspects: (a) ER-phagy is defined as the number of pixels of RFP-only puncta divided by the total pixels (RFP + GFP), which is used to delineate the total area of tissue or cells because some section images did not completely fill the field of view. (b) ER-phagy is also defined as the fluorescence intensity ratio of lysosomal signals (RFP-only puncta) to RFP signals.
For quantitative assessment of ER-phagy and lysosome signals, each dataset was composed of three tiled images: RFP, GFP, and LAMP1 or CTSD images. Image processing was performed using ImageJ. First, two types of ER-phagy images: merge (RFP + GFP) and ratio (RFP/GFP) images were created. The ER-phagy merge images were useful for delineating the localization of ER and ER-phagy signals in cells or tissues. Next, the ER-phagy ratio images were superimposed with LAMP1 or CTSD immunostaining images to outline the ER-lysosomes signals (RFP+LAMP1+ or RFP+CTSD+) according to the presence of ER-phagy and lysosome signals by ImageJ. LAMP1 or CTSD-positive structures (identified in far red/Alexa Fluor 647) were found using Otsu’s method in ImageJ (Otsu, 1979); ER-phagy is defined as the ratio of RFP-only puncta pixels to the total pixels (RFP + GFP). Similarly, ER-phagy was also characterized by the fluorescence intensity ratio of lysosomal signals (RFP-only puncta) to the total RFP signals.
Another approach to quantifying ER–lysosome signaling is applicable when there are fewer isolated RFP dots in cells or tissues, or when the boundaries of these RFP dots are clearly defined. The R, G, and B intensity values of signals were calculated and transformed into a hue angle and saturation range in ImageJ. This hue angle was then converted to color using the linearized Hue color wheel (Lee et al., 2019). Signals were selected via the color threshold tool and segmented into discrete puncta using the automatic watershed function, effectively isolating individual puncta for enumeration. The number of RFP puncta per standard area was determined. Hue is the attribute of a color discerned as red, green, and blue, which is dependent on its dominant wavelength and independent of intensity. Hue angles, usually represented as an angle on a circle, were linearized in this study to illustrate the maturation process from ER fragments to RFP puncta in lysosomes, as detected by ssRFP-GFP-KDEL in the green-red spectrum. We adopted hue angle parameters for each subtype of the autophagy–lysosome pathway to indicate the relative acidity of different autolysosome populations. If the hue angle saturation fell below 25%, the color was considered unsaturated and thus white. By combining this with CTSD/LAMP1 labeling through in vivo or in vitro immunocytochemistry, visualized as blue fluorescence, we could identify and quantify the numbers of each vesicle type (i.e., autophagosome, autolysosome, or lysosome) and their relative acidification states based on hue and saturation parameters from the full spectrum analysis.
The average of four images from each tissue sample was taken and the values were normalized to the average value seen in the controls, assigned the value of one. In each experimental model, all imaging parameters remain the same for all data acquisition.
Statistical analysis
All experiments were independently replicated at least three times. Statistical significance was determined using Prism 5 (GraphPad), with methods detailed in the figure legends. Values were stated as mean ± SEM of at least three independent experiments and some error bars represent SD which was also noted in the figure legends. *P < 0.05 was considered to be statistically significant.
Online supplemental material
Fig. S1 shows the expression of different ER-phagy reporters in the cell line. Fig. S2 shows the identification of ER-phagy reporter mouse. Fig. S3 shows the spatial assessment of ER-phagy activity and ER architecture in different tissues. Fig. S4 shows the assessment of ER-phagy in physio-pathological perturbations. Fig. S5 shows the assessment of ER-phagy activity in different tissues in inducible ER-TRG mice and demonstrates ER-phagy in different CA-ER-TRG mice following AAV-mediated Cre injection. Table S1 shows oligonucleotides used in this work. Table S2 shows the list of reagents and resources used in this study.
Data availability
Further information and requests for reagents and resources should be directed to and will be fulfilled by the lead contact, Q. Sun ([email protected]). All unique reagents generated in this study are available from the Lead Contact with a completed Materials Transfer Agreement.
Acknowledgments
We thank the Center of Cryo-Electron Microscopy Zhejiang University and the Imaging Center of Zhejiang University School of Medicine for assistance with confocal microscopy.
The National Natural Science Foundation supported this study under Grant 32025012, 92254307, 31970695, 31771525, 91754113 to Q. Sun, 32400612 to Y. Sang; Ministry of Science and Technology of the People’s Republic of China supported this study under Grant 2021YFC2700901 to Q. Sun).
Author contributions: Y. Sang: Conceptualization, Formal analysis, Investigation, Methodology, Project administration, Software, Validation, Visualization, Writing - original draft, Writing - review & editing, B. Li: Conceptualization, Formal analysis, Investigation, Methodology, Validation, Visualization, Writing - original draft, Writing - review & editing, T. Su: Investigation, Validation, H. Zhan: Formal analysis, Investigation, Validation, Y. Xiong: Resources, Z. Huang: Validation, C. Wang: Conceptualization, Data curation, X. Cong: Formal analysis, M. Du: Methodology, Y. Wu: Resources, H. Yu: Resources, X. Yang: Resources, K. Ding: Resources, X. Wang: Resources, Supervision, X. Miao: Methodology, W. Gong: Methodology, L. Wang: Resources, J. Zhao: Investigation, Methodology, Resources, Y. Zhou: Methodology, Resources, W. Liu: Resources, Writing - review & editing, X. Hu: Data curation, Formal analysis, Investigation, Q. Sun: Conceptualization, Funding acquisition, Project administration, Resources, Supervision, Writing - original draft, Writing - review & editing.
References
Q. Sun is a lead contact.

