


Centrioles are microtubule-based organelles responsible for forming centrosomes and cilia, which serve as microtubule-organizing, signaling, and motility centers. Biogenesis and maintenance of centrioles with proper number, size, and architecture are vital for their functions during development and physiology. While centriole number control has been well-studied, less is understood about their maintenance as stable structures with conserved size and architecture during cell division and ciliary motility. Here, we identified CCDC15 as a centriole protein that colocalizes with and interacts with the inner scaffold, a crucial centriolar subcompartment for centriole size control and integrity. Using ultrastructure expansion microscopy, we found that CCDC15 depletion affects centriole length and integrity, leading to defective cilium formation, maintenance, and response to Hedgehog signaling. Moreover, loss-of-function experiments showed CCDC15’s role in recruiting both the inner scaffold protein POC1B and the distal SFI1/Centrin-2 complex to centrioles. Our findings reveal players and mechanisms of centriole architectural integrity and insights into diseases linked to centriolar defects.
Introduction
Centrioles are microtubule-based organelles that maintain a conserved number and structure across many eukaryotic cells (Arquint et al., 2014; Azimzadeh and Marshall, 2010; Breslow and Holland, 2019; Brito et al., 2012). They recruit pericentriolar material (PCM) to assemble centrosomes, which act as microtubule-organizing centers in diverse cellular processes including mitotic spindle assembly, cell cycle progression, cell polarity, and migration (Bowler et al., 2019; Chavali et al., 2014; Conduit et al., 2015). In quiescent cells, they act as basal bodies to template the formation of the primary cilium, motile cilia, or flagella. While the primary cilium is non-motile and functions as a signaling nexus for developmentally important signaling pathways, motile cilia and flagella are required for movement of liquid across specialized epithelia and cell motility (Boutin and Kodjabachian, 2019; Mirvis et al., 2018; Sánchez and Dynlacht, 2016; Wheway et al., 2018). Proper functioning of centrioles during these processes requires spatiotemporal control of their number, size, and architecture (Azimzadeh and Marshall, 2010; Loncarek and Bettencourt-Dias, 2018; Nigg and Raff, 2009). Therefore, biogenesis of centrioles is a highly regulated, multistep process, and its deregulation is implicated in many human pathologies including cancer, primary microcephaly, and ciliopathies (Bettencourt-Dias et al., 2011; Braun and Hildebrandt, 2017; Kathem et al., 2014; Nigg and Raff, 2009; Wang and Dynlacht, 2018; Wheway et al., 2014).
In animal cells, centrioles are composed of nine microtubule triplets radially arranged in a cylinder of about ∼250 nm in diameter and ∼450 nm in length (Chrétien et al., 1997; LeGuennec et al., 2021; Loncarek and Bettencourt-Dias, 2018). Although centriole size varies across different species and different cell types in the same species, it is kept relatively constant in cells (Loncarek and Bettencourt-Dias, 2018). Centrioles are inherently polar with microtubule minus ends at their proximal ends and microtubule plus ends at their distal ends (Loncarek and Bettencourt-Dias, 2018). During centriole assembly, the proximal ends contain the cartwheel structure that scaffolds centriole assembly, participates in dictating the diameter of the centriole barrel, and imparts its ninefold symmetry. On the other side, their distal ends contain appendages that are required for cilium assembly and microtubule anchorage (Guichard et al., 2018; Nakazawa et al., 2007). In contrast to the dynamic cytoplasmic microtubules, centriolar microtubules are exceptionally stable, resisting depolymerization from drug and cold treatments, mitotic onset, and showing limited turnover in pulse-chase studies (Belmont et al., 1990; Bornens et al., 1987; Kochanski and Borisy, 1990; Mitchison and Kirschner, 1986). Importantly, the stable nature of centrioles enables them to withstand mechanical forces during cell division and ciliary and flagellar motility (Abal et al., 2005; Bayless et al., 2012; Junker et al., 2022; Meehl et al., 2016; Pearson et al., 2009).
In most cells, centrioles duplicate precisely only once in early S phase, which involves the formation of a procentriole adjacent to each pre-existing centriole (Carvalho-Santos et al., 2010; Firat-Karalar and Stearns, 2014; Holland et al., 2010). Procentrioles subsequently elongate until mitosis and are then segregated to the daughter cells by the mitotic spindle. To date, multiple different mechanisms and molecular players have been described for their roles in establishment and maintenance of centriole size and integrity (Mofatteh et al., 2021; Sharma et al., 2021). First, a group of microtubule-associated proteins were shown to regulate centriole length by acting upon centriolar microtubules. On one hand, CPAP, CEP120, CEP295/Ana1, and SPICE act as activators of centriole length via promoting elongation, stabilization, and/or posttranslational modification of centriolar microtubules (Chang et al., 2016; Comartin et al., 2013; Galletta et al., 2016; Saurya et al., 2016; Schmidt et al., 2009; Sharma et al., 2021). On the other hand, CP110-CEP97 complex acts as an inhibitor by capping the distal ends of centrioles and restricting microtubule growth or depolymerizing/destabilizing centriolar microtubules (Comartin et al., 2013; Franz et al., 2013; Schmidt et al., 2009; Sharma et al., 2021; Spektor et al., 2007). In fly spermatids, CEP152 cooperates with CEP97 for centriole length control (Galletta et al., 2016). Modifications of tubulin subunits such as acetylation, detyrosination, and glutamylation may also contribute to the stability of the centriolar microtubules (Bayless et al., 2012; Guichard et al., 2023; Wloga et al., 2017). In addition to regulation via centriolar microtubules, cartwheel length and centriole copy number have been proposed to vary depending on the levels of the cartwheel building block Sas-6, which was also shown to regulate centriole length and integrity in mouse embryonic stem cells (Dias Louro et al., 2021; Grzonka and Bazzi, 2022, Preprint). Another emerging mechanism that promotes proper centriole length is the initiation and timing of centriole biogenesis by the oscillations of PLK4 at the base of the growing centrioles (Aydogan et al., 2018, 2020). A conserved negative feedback loop between PLK4 and CEP152 was shown to constitute the oscillations of this clock in flies and human cells (Aydogan et al., 2020; Boese et al., 2018; Takao et al., 2019). Moreover, changing levels of CP110 and CEP97 were shown to alter the PLK4 oscillation and the growth of the cartwheel at the proximal end of centrioles (Aydogan et al., 2022; Lee et al., 2017). To sum up, these lines of data highlight the complexity of centriole size regulation.
Recent advances in expansion microscopy and cryo-tomography have resulted in discovering the inner scaffold in the central region of the centriole. It has been characterized as a regulator of centriole length and integrity (Atorino et al., 2020; Le Guennec et al., 2020; Mercey et al., 2022; Pearson et al., 2009; Schweizer et al., 2021; Steib et al., 2020). Cryo-tomography analysis of the inner scaffold in different organisms defined it as an evolutionarily conserved structural feature that forms a periodic, helical structure composed of repeating units of scaffold protein complexes (Le Guennec et al., 2020). Ultrastructure expansion microscopy (U-ExM) analysis of the centrioles revealed nanoscale organization of POC5, POC1B, FAM161A, Centrin-2, WDR90, γ-TURC, and HAUS6 at the centriole lumen (Hamel et al., 2017; Le Guennec et al., 2020; Schweizer et al., 2021; Steib et al., 2020). Although POC5, POC1B, and FAM161A localization was restricted to the central region of the centriole, Centrin-2 was shown to localize both to the distal and central regions. POC5, POC1B, FAM161A, and Centrin-2 form a complex that binds to microtubules via FAM161A, and another microtubule-associated protein, WDR90, connects the inner scaffold to the microtubule triplets of the centrioles (Le Guennec et al., 2020; Steib et al., 2020). Centrin-2 also forms a complex with SFI1 at the distal end (Laporte et al., 2022). Loss-of-function studies defined functions for WDR90, augmin, and POC5, and thereby for the inner scaffold, during centriole length regulation and stabilization of the centriole architecture (Schweizer et al., 2021). Additionally, POC1 was shown to localize to centriolar microtubules and function in assembling centrioles with proper length and integrity in different organisms (Blachon et al., 2009; Keller et al., 2009; Pearson et al., 2009; Venoux et al., 2013). In human cells, POC1B forms a functional complex with CEP44 that ensures structural integrity of centrioles (Atorino et al., 2020). The distal SFI1/Centrin-2 complex was also described for their roles in conferring stability on centrioles. Disruption of the inner scaffold or the SFI1/Centrin-2 complex also resulted in defective primary cilium formation. Consistent with these phenotypes, mutations affecting POC1B, POC5, Centrin-2, and FAM161A were linked to inherited retinal degeneration caused by loss of photoreceptor cells (Langmann et al., 2010; Mercey et al., 2022; Roosing et al., 2014; Weisz Hubshman et al., 2018; Ying et al., 2019).
Cellular functions and disease links of the inner scaffold highlight its functional significance in cells and organisms. Application of the U-ExM method to investigate known centrosome proteins has started to define the composition of the inner scaffold as well as other centriolar subcompartments (Chen et al., 2015; Gambarotto et al., 2019, 2021; Kong and Loncarek, 2021; Laporte et al., 2022; Mahen, 2022; Mercey et al., 2022; Odabasi et al., 2023; Sahabandu et al., 2019; Schweizer et al., 2021; Steib et al., 2022; Tiryaki et al., 2022; Tsekitsidou et al., 2023). However, its targeted nature limited the identification of the full repertoire of inner scaffold proteins. Here, we generated proximity interaction maps for POC5 and Centrin-2 and used these maps to define CCDC15 as a new centriolar protein, which colocalizes and interacts with known inner scaffold proteins. CCDC15 depletion resulted in defective recruitment of the inner scaffold protein POC1B and distal end SFI1/Centrin-2 complex. Consequently, its loss compromised centriole size and integrity, wherein the basal body had a reduced ability to form primary cilium. The cilia that formed in CCDC15-depleted cells were shorter and defective in responding to Hedgehog stimuli. Our findings identify CCDC15 as a new regulator of centriole size and architectural integrity and thereby, for maintaining the ability of centrioles to template the assembly and maintenance of cilia.
Results
Proximity mapping of POC5 and Centrin-2 identifies new centriole proteins
To define new regulators of centriole size and integrity, we identified the proximity interaction maps of Centrin-2 and POC5 in human embryonic kidney (HEK293T) cells using the BioID approach. To this end, we generated cells that stably express V5BirA* (hereafter BirA*) fusions of POC5 and Centrin-2 and validated them by blotting and staining for V5 to detect the fusion protein, streptavidin to detect biotinylated proteins, and γ-tubulin to mark the centrosome and/or acetylated-tubulin to mark the centriole (Fig. 1, A–C). BirA*-fusions of Centrin-2 and POC5 both localized to the centrosome and stimulated biotinylation there (Fig. 1 A). For nanoscale mapping of the fusion proteins at the centrosome, we performed U-ExM in the stable cells stained for V5 and acetylated tubulin. BirA*-POC5 localized to the inner scaffold, whereas BirA*-Centrin-2 localizes to the inner scaffold and distal end of centrioles (Fig. 1 C). In addition to centrosomes, both fusion proteins localized to and induced biotinylation in the cytoplasm and/or nucleus (Fig. 1 A). Quantification of streptavidin fluorescence across their different pools showed that non-centrosomal biotinylation is more abundant than centrosomal biotinylation for both BirA*-Centrin-2 and BirA*-POC5 (Fig. S1 A). Finally, immunoblotting of cell lysates confirmed the expression of the fusion proteins and efficient pulldown of the biotinylated proteins including POC5 and Centrin-2 (Fig. 1 B). To distinguish between centrosomal and non-centrosomal fusion protein levels and biotinylation, we immunoblotted nuclear, cytoplasmic, and centrosomal fractions for V5 and streptavidin. Consistent with the immunofluorescence data (Fig. S1 A), non-centrosomal BirA*-Centrin-2 and BirA*-POC5 and biotinylated proteins were more prevalent than their centrosomal counterparts (Fig. S1 B).

Identification of POC5 and Centrin-2 proximity interactome. (A) Biotinylation of the centrosome by V5BirA*-POC5 and V5BirA*-Centrin-2. HEK293T cells stably expressing V5BirA*-POC5 and V5BirA*-Centrin-2 were treated with biotin for 18 h. Cells were then fixed and stained for the protein of interest with V5, biotinylated proteins with fluorescent streptavidin, and centrosome with anti-γ-tubulin antibody. DNA was visualized with DAPI. Scale bar, 10 μm. (B) HEK293T cells stably expressing V5BirA*-POC5 and V5BirA*-Centrin-2 were lysed, and biotinylated proteins were precipitated by streptavidin beads. The initial sample (initial) and immunoprecipitated biotinylated proteins (pulldown) were run on a gel and immunoblotted with fluorescent-coupled streptavidin and V5 antibodies. (C) Representative confocal images of HEK293T::V5BirA*-POC5 and HEK294T::V5BirA*-Centrin-2 centrioles expanded using U-ExM and stained for tubulin (magenta) and V5 (green). Scale bar, 1 μm. (D) POC5 and Centrin-2 proximity interactome map. High-confidence proximity interactors of POC5 and Centrin-2 were determined by using NSAF analysis. The interactome map containing the first 100 proximity interactome of Centrin-2 and all the proximity interactors POC5 was drawn in CytoScape and the shared interactome was visualized in green circles. The circle size corresponds to the fold change. (E) Cellular compartment analysis of the shared proximity interactors of Centrin-2 and POC5. The GO analysis of the shared proximity interactome was determined using DAVID. Source data are available for this figure: SourceData F1.
Identification of POC5 and Centrin-2 proximity interactome. (A) Biotinylation of the centrosome by V5BirA*-POC5 and V5BirA*-Centrin-2. HEK293T cells stably expressing V5BirA*-POC5 and V5BirA*-Centrin-2 were treated with biotin for 18 h. Cells were then fixed and stained for the protein of interest with V5, biotinylated proteins with fluorescent streptavidin, and centrosome with anti-γ-tubulin antibody. DNA was visualized with DAPI. Scale bar, 10 μm. (B) HEK293T cells stably expressing V5BirA*-POC5 and V5BirA*-Centrin-2 were lysed, and biotinylated proteins were precipitated by streptavidin beads. The initial sample (initial) and immunoprecipitated biotinylated proteins (pulldown) were run on a gel and immunoblotted with fluorescent-coupled streptavidin and V5 antibodies. (C) Representative confocal images of HEK293T::V5BirA*-POC5 and HEK294T::V5BirA*-Centrin-2 centrioles expanded using U-ExM and stained for tubulin (magenta) and V5 (green). Scale bar, 1 μm. (D) POC5 and Centrin-2 proximity interactome map. High-confidence proximity interactors of POC5 and Centrin-2 were determined by using NSAF analysis. The interactome map containing the first 100 proximity interactome of Centrin-2 and all the proximity interactors POC5 was drawn in CytoScape and the shared interactome was visualized in green circles. The circle size corresponds to the fold change. (E) Cellular compartment analysis of the shared proximity interactors of Centrin-2 and POC5. The GO analysis of the shared proximity interactome was determined using DAVID. Source data are available for this figure: SourceData F1.
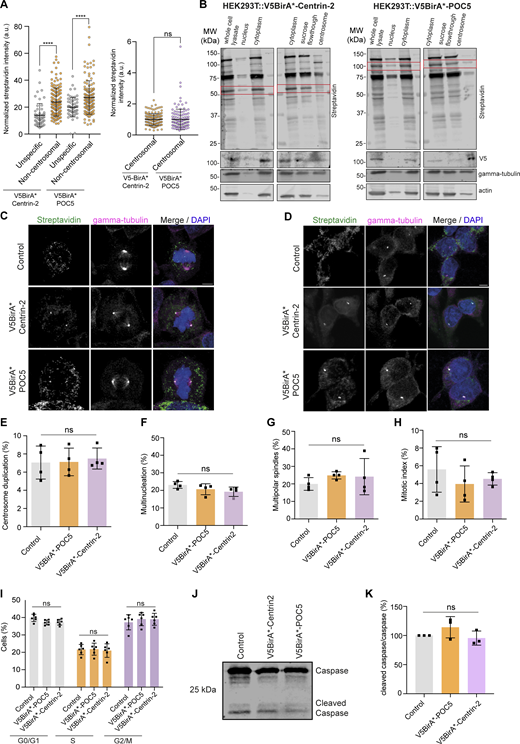
Characterization of stable lines expressing V5BirA* fusions of Centrin-2 and POC5. (A) Quantification of centrosomal and non-centrosomal biotinylation in HEK293T::V5BirA*-Centrin-2 and HEK293T::V5BirA*-POC5 cells treated with 50 μm biotin for 18 h. Streptavidin fluorescence levels were measured from maximum-intensity projections, and average means of the centrosomal levels were normalized to one in each experiment. n = 50 cells per experiment. Data represent the mean of three independent experiments. HEK293T::V5BirA*-Centrin-2: unspecific = 13.98% ± 8.7, centrosomal = 1% ± 0.38, non-centrosomal = 23.82% ± 10.44, P < 0.0001; HEK293T::V5BirA*-POC5: unspecific = 19.94% ± 7.2, centrosomal = 1% ± 0.66, non-centrosomal = 27.12% ± 12.51, P = 0.9831, two-sided t test. (B) Immunoblot analysis of centrosomal and non-centrosomal biotinylation in HEK293T::V5BirA*-Centrin-2 and HEK293T::V5BirA*-POC5 cells. HEK293T::V5BirA*-Centrin-2 and HEK293T::V5BirA*-POC5 cells were treated with 5 μg/ml nocodazole and cytochalasin B for 1 h at 37°C. Cells were then lysed in hypotonic buffer (whole cell lysate), dounce homogenized, and centrifuged. Pellets after centrifugation were prepared as the nuclear fraction. Supernatant (cytosolic fraction) was then centrifuged on a discontinuous sucrose gradient, gradient fractions were collected, and centrosome fractions were pooled (centrosome fraction). The remaining fraction above the sucrose gradient was collected as the “sucrose flowthrough.” 0.1% of each sample was loaded to SDS-PAGE gel. Samples were blotted for the indicated proteins. Cytoplasm samples in the streptavidin and V5 blots that share the actin and tubulin loading control were from the same sample. Cytoplasm sample of the actin and tubulin loading control corresponds to the same lane in the western blot. Red rectangle indicates V5BirA*-Centrin-2 and V5BirA*-POC5 in streptavidin blot. (C) Representative immunofluorescence images of mitotic control, HEK293T::V5BirA*-Centrin-2, and HEK293T::V5BirA*-POC5 cells fixed and stained for streptavidin, γ-tubulin, and DAPI. Scale bar, 5 μm. (D) Representative images of interphase control, HEK293T::V5BirA*-Centrin-2, and HEK293T::V5BirA*-POC5 cells stained for streptavidin and γ-tubulin. DNA was stained with DAPI. Centrosome number >2 was quantified as “centrosome amplification.” Cells with >1 nucleus were quantified as “multinucleated.” Scale bar, 5 μm. (E–H) Quantification for (E) percentage of centrosome duplication (control = 7.1% ± 1.8, V5BirA*-POC5 = 7.12% ± 1.5, V5BirA*-Centrin-2 = 7.5% ± 1.2, P = 0.9088); (F) multinucleation (control = 4.6% ± 0.4, V5BirA*-POC5 = 4.1% ± 0.6, V5BirA*-Centrin-2 = 3.8% ± 0.5, P = 1,644); (G) multipolar spindles (control = 19.9% ± 3.6, V5BirA*-POC5 = 24.9% ± 2.1, V5BirA*-Centrin-2 = 24.2% ± 10.3, P = 0.5306); (H) mitotic index (control = 5.6% ± 2.6, V5BirA*-POC5 = 3.9% ± 2.0, V5BirA*-Centrin-2 = 4.5% ± 0.7, P = 5,034). n > 100 cells per experiment. Data represent mean value from four experiments per condition. Error bars, SD. ns: non-significant, one-way ANOVA. (I) Cell cycle profile of control, HEK293T::V5BirA*-Centrin-2, and HEK293T::V5BirA*-POC5 cells. Cells were fixed with ethanol and stained with Muse Cell Cycle kit. Data represent mean value from three independent experiments with two technical replicates per condition. Error bars, ± SD. ns: non-significant, two-way ANOVA. For G0/G1phase, control = 39.82% ± 2.09, V5BirA*-POC5 = 37.18% ± 1.38, V5BirA*-Centrin-2 = 37.33% ± 1.66; for S phase, control = 21.58% ± 2.96, V5BirA*-POC5 = 21.82% ± 3.46, V5BirA*-Centrin-2 = 21.02% ± 3.90; for G2/M phase, control = 37.28% ± 4.37, V5BirA*-POC5 = 39.10% ± 3.78, V5BirA*-Centrin-2 = 39.02% ± 3.44. For G0/G1 phase control versus V5BirA*-POC5 P = 0.3287, control versus V5BirA*-Centrin-2 P = 0.3706, V5BirA*POC5 versus V5BirA*-Centrin-2 P = 0.9963; for S phase, control versus V5BirA*-POC5 P = 0.9910, control versus V5BirA*-Centrin-2 P = 0.9484, V5BirA*POC5 versus V5BirA*-Centrin-2 P = 0.8999; for G2/M phase, control versus V5BirA*-POC5 P = 0.5842, control versus V5BirA*-Centrin-2 P = 0.6127, V5BirA*POC5 versus V5BirA*-Centrin-2 P = 0.9989. (J) Relative expression of Caspase3 in control, HEK293T::V5BirA*-Centrin-2, and HEK293T::V5BirA*-POC5 cells. Cells were lysed and immunoblotted with antibodies against Caspase3. (K) Quantification of Caspase3 band intensities in control, HEK293T::V5BirA*-Centrin-2, and HEK293T::V5BirA*-POC5 cells. Data represent mean value from three independent experiments per condition. Error bars, SD. Control = 100%, HEK293T::V5BirA*-POC5 = 114% ± 18, HEK293T::V5BirA*-Centrin-2 = 96% ± 12; P = 0.3485 and P = 0.8786, respectively, one-way ANOVA. **** P < 0.0001, ns: non-significant. Source data are available for this figure: SourceData FS1.

Characterization of stable lines expressing V5BirA* fusions of Centrin-2 and POC5. (A) Quantification of centrosomal and non-centrosomal biotinylation in HEK293T::V5BirA*-Centrin-2 and HEK293T::V5BirA*-POC5 cells treated with 50 μm biotin for 18 h. Streptavidin fluorescence levels were measured from maximum-intensity projections, and average means of the centrosomal levels were normalized to one in each experiment. n = 50 cells per experiment. Data represent the mean of three independent experiments. HEK293T::V5BirA*-Centrin-2: unspecific = 13.98% ± 8.7, centrosomal = 1% ± 0.38, non-centrosomal = 23.82% ± 10.44, P < 0.0001; HEK293T::V5BirA*-POC5: unspecific = 19.94% ± 7.2, centrosomal = 1% ± 0.66, non-centrosomal = 27.12% ± 12.51, P = 0.9831, two-sided t test. (B) Immunoblot analysis of centrosomal and non-centrosomal biotinylation in HEK293T::V5BirA*-Centrin-2 and HEK293T::V5BirA*-POC5 cells. HEK293T::V5BirA*-Centrin-2 and HEK293T::V5BirA*-POC5 cells were treated with 5 μg/ml nocodazole and cytochalasin B for 1 h at 37°C. Cells were then lysed in hypotonic buffer (whole cell lysate), dounce homogenized, and centrifuged. Pellets after centrifugation were prepared as the nuclear fraction. Supernatant (cytosolic fraction) was then centrifuged on a discontinuous sucrose gradient, gradient fractions were collected, and centrosome fractions were pooled (centrosome fraction). The remaining fraction above the sucrose gradient was collected as the “sucrose flowthrough.” 0.1% of each sample was loaded to SDS-PAGE gel. Samples were blotted for the indicated proteins. Cytoplasm samples in the streptavidin and V5 blots that share the actin and tubulin loading control were from the same sample. Cytoplasm sample of the actin and tubulin loading control corresponds to the same lane in the western blot. Red rectangle indicates V5BirA*-Centrin-2 and V5BirA*-POC5 in streptavidin blot. (C) Representative immunofluorescence images of mitotic control, HEK293T::V5BirA*-Centrin-2, and HEK293T::V5BirA*-POC5 cells fixed and stained for streptavidin, γ-tubulin, and DAPI. Scale bar, 5 μm. (D) Representative images of interphase control, HEK293T::V5BirA*-Centrin-2, and HEK293T::V5BirA*-POC5 cells stained for streptavidin and γ-tubulin. DNA was stained with DAPI. Centrosome number >2 was quantified as “centrosome amplification.” Cells with >1 nucleus were quantified as “multinucleated.” Scale bar, 5 μm. (E–H) Quantification for (E) percentage of centrosome duplication (control = 7.1% ± 1.8, V5BirA*-POC5 = 7.12% ± 1.5, V5BirA*-Centrin-2 = 7.5% ± 1.2, P = 0.9088); (F) multinucleation (control = 4.6% ± 0.4, V5BirA*-POC5 = 4.1% ± 0.6, V5BirA*-Centrin-2 = 3.8% ± 0.5, P = 1,644); (G) multipolar spindles (control = 19.9% ± 3.6, V5BirA*-POC5 = 24.9% ± 2.1, V5BirA*-Centrin-2 = 24.2% ± 10.3, P = 0.5306); (H) mitotic index (control = 5.6% ± 2.6, V5BirA*-POC5 = 3.9% ± 2.0, V5BirA*-Centrin-2 = 4.5% ± 0.7, P = 5,034). n > 100 cells per experiment. Data represent mean value from four experiments per condition. Error bars, SD. ns: non-significant, one-way ANOVA. (I) Cell cycle profile of control, HEK293T::V5BirA*-Centrin-2, and HEK293T::V5BirA*-POC5 cells. Cells were fixed with ethanol and stained with Muse Cell Cycle kit. Data represent mean value from three independent experiments with two technical replicates per condition. Error bars, ± SD. ns: non-significant, two-way ANOVA. For G0/G1phase, control = 39.82% ± 2.09, V5BirA*-POC5 = 37.18% ± 1.38, V5BirA*-Centrin-2 = 37.33% ± 1.66; for S phase, control = 21.58% ± 2.96, V5BirA*-POC5 = 21.82% ± 3.46, V5BirA*-Centrin-2 = 21.02% ± 3.90; for G2/M phase, control = 37.28% ± 4.37, V5BirA*-POC5 = 39.10% ± 3.78, V5BirA*-Centrin-2 = 39.02% ± 3.44. For G0/G1 phase control versus V5BirA*-POC5 P = 0.3287, control versus V5BirA*-Centrin-2 P = 0.3706, V5BirA*POC5 versus V5BirA*-Centrin-2 P = 0.9963; for S phase, control versus V5BirA*-POC5 P = 0.9910, control versus V5BirA*-Centrin-2 P = 0.9484, V5BirA*POC5 versus V5BirA*-Centrin-2 P = 0.8999; for G2/M phase, control versus V5BirA*-POC5 P = 0.5842, control versus V5BirA*-Centrin-2 P = 0.6127, V5BirA*POC5 versus V5BirA*-Centrin-2 P = 0.9989. (J) Relative expression of Caspase3 in control, HEK293T::V5BirA*-Centrin-2, and HEK293T::V5BirA*-POC5 cells. Cells were lysed and immunoblotted with antibodies against Caspase3. (K) Quantification of Caspase3 band intensities in control, HEK293T::V5BirA*-Centrin-2, and HEK293T::V5BirA*-POC5 cells. Data represent mean value from three independent experiments per condition. Error bars, SD. Control = 100%, HEK293T::V5BirA*-POC5 = 114% ± 18, HEK293T::V5BirA*-Centrin-2 = 96% ± 12; P = 0.3485 and P = 0.8786, respectively, one-way ANOVA. **** P < 0.0001, ns: non-significant. Source data are available for this figure: SourceData FS1.
To examine whether stable expression of BirA*-fusions of Centrin-2 alters functions associated with these proteins, we characterized cells for cell cycle progression, centrosome amplification, and apoptosis (Fig. S1, C–K). First, we immunostained wild type HEK293T cells and HEK293T cells stably expressing BirA*-Centrin-2 or BirA*-POC5 for markers of the centrosome, microtubules, and DNA and quantified their mitotic phenotypes (Fig. S1, C and D). For both cell lines, there was no difference in the percentage of cells with centrosome amplification, multinucleation, and spindle multipolarity, and in their mitotic index (Fig. S1, E–H). Moreover, flow cytometry analysis of asynchronous cells confirmed that control and BirA*-POC5 or BirA*-Centrin-2–expressing cells had similar cell cycle profiles (Fig. S1 I). Finally, immunoblotting for cleaved Caspase3 showed that apoptosis was not activated in these cells (Fig. S1, J and K).
For large-scale pulldowns, asynchronous stable cells were grown in 5 × 15 cm plates and incubated with 50 μM biotin for 18 h. Following denaturing lysis, biotinylated proteins were precipitated by streptavidin beads and analyzed by mass spectrometry. High-confidence proximity interactors of POC5 and Centrin-2 were defined by filtering out low-confidence interactors using three different analysis methods and thresholds as described in the methods (Table S1). First, we performed normalized spectral abundance factor (NSAF) analysis and included proteins with log2 NSAF value >1 (Firat-Karalar et al., 2014; Zybailov et al., 2006). Second, we accounted for proteins identified in at least two replicates. Third, we removed common mass spectrometry contaminants (>30% of the contaminants) by using the contaminant repository for affinity purification—mass spectometry data (CRAPome; Mellacheruvu et al., 2013). Altogether, these thresholds yielded 68 and 480 proteins as high-confidence interactors of POC5 and Centrin-2, respectively (Table S1 and Fig. S2)

Gene enrichment analysis of the POC5 and Centrin-2 proximity interactomes. (A and B) GO enrichment analysis of Centrin-2 proximity interactors based on their cellular compartments and biological process. The x axis represents the log-transformed P value (Fisher’s exact test) of GO terms. (C and D) GO enrichment analysis of POC5 proximity interactors based on their cellular compartments and biological process. The x axis represents the log-transformed P value (Fisher’s exact test) of GO terms. (E and F) Centrin-2 and POC5 proximity interactome maps. High-confidence proximity interactors of POC5 and Centrin-2 were determined by using NSAF and CRAPome analysis. The interaction map was generated using STRING protein interaction database and the proximity interactome of Centrin-2 was drawn in CytoScape. The clusters were determined by the ClusterONE plug-in cytoscape.

Gene enrichment analysis of the POC5 and Centrin-2 proximity interactomes. (A and B) GO enrichment analysis of Centrin-2 proximity interactors based on their cellular compartments and biological process. The x axis represents the log-transformed P value (Fisher’s exact test) of GO terms. (C and D) GO enrichment analysis of POC5 proximity interactors based on their cellular compartments and biological process. The x axis represents the log-transformed P value (Fisher’s exact test) of GO terms. (E and F) Centrin-2 and POC5 proximity interactome maps. High-confidence proximity interactors of POC5 and Centrin-2 were determined by using NSAF and CRAPome analysis. The interaction map was generated using STRING protein interaction database and the proximity interactome of Centrin-2 was drawn in CytoScape. The clusters were determined by the ClusterONE plug-in cytoscape.
To validate the proximity interaction maps of Centrin-2 and POC5, we performed Gene Ontology (GO) enrichment analysis based on their “biological process” and “cellular compartment” (Table S2). As shown in Fig. S1, Centrin-2 and POC5 proximity maps were enriched for GO categories that are relevant for their published functions during centrosomal, cytoplasmic and/or nuclear biological processes, and related cellular compartments (Azimzadeh et al., 2009; Dantas et al., 2013; Heydeck et al., 2020; Khouj et al., 2019; Resendes et al., 2008; Salisbury et al., 2002; Steib et al., 2020; Yang et al., 2010; Ying et al., 2019). For example, the highly enriched GO categories for biological processes include cell division, protein folding, mRNA splicing, and chromatin remodeling for Centrin-2 and centriole replication, protein localization to centrosome, and cilium assembly for POC5 (Fig. S2, A–D). Moreover, GO term analysis of cellular compartment showed significant enrichment for centriole, centrosome, nuclear speckles, and centriolar satellites for both Centrin-2 and POC5 (Fig. S2, A–D). In addition to GO analysis, we ranked POC5 and Centrin-2 proximity interactors by their fold change into an interaction network, combining STRING database and ClusterONE plug-in on Cytoscape (Fig. S2, E and F). The resulting network identified a diverse array of proteins from five major functional clusters (P < 0.005) for Centrin-2 and two major clusters for POC5. These clusters include nucleoplasm, cell junctions, mitotic spindle and spindle pole, nucleolus and centriole and basal body for Centrin-2, and centrosome and extracellular exosome for POC5 (Fig. S2, E and F).
To identify new centriole proteins, we focused on the proximity interactors shared by POC5 and Centrin-2 datasets, which included 27 proteins from five major cellular compartments from the centriole/inner scaffold, centrosome, centriolar satellites, cytoplasm/nucleoplasm, and nuclear speckles (Fig. 1, D and E). The identification of previously characterized centriole proteins FAM161A, POC1B, HAUS6, CEP135, and C2CD3 validated our proximity maps as resources for future studies. Among the shared interactors, we chose CCDC15 for further cellular characterization as it had been identified in the centriolar satellite proteome and in proximity maps of centrosome/centriolar satellite proteins including the ones involved in biogenesis of centrioles (i.e., PLK4, KIAA0753; Firat-Karalar et al., 2014; Gheiratmand et al., 2019; Gupta et al., 2015; Quarantotti et al., 2019). CCDC15 was also implicated in tumorigenesis (Tang et al., 2020).
CCDC15 localizes to centrioles throughout the cell cycle
We investigated the localization of endogenous CCDC15 and mNeonGreen (mNG)-CCDC15 fusion protein in human retinal pigment epithelium 1 (RPE1) cells (Fig. 2 and Fig. S3). Antibodies against CCDC15 and the centriole marker Centrin-2 showed that CCDC15 localizes to the centrosome throughout the cell cycle (Fig. 2 A). CCDC15 was detected as two foci per cell in interphase and four foci per cell from G2 through mitosis, showing that it is a centriole protein (Fig. 2 A). Of note, centrosomal levels of CCDC15 remained unaltered upon nocodazole-induced microtubule depolymerization (Fig. S3, A and B). Similar to its endogenous localization, transiently expressed mNG-CCDC15 localized to the centrosomes in RPE1 and U2OS cells (Fig. S3, C and D). As assessed by colocalization with the centriolar satellite marker PCM1, mNG-CCDC15 localized to centriolar satellites in all U2OS cells and about 80% of RPE1 cells (Fig. S3, C–E). In satellite-less RPE1::PCM1−/− cells, centrosomal CCDC15 levels were reduced compared with controls (18.5% reduction, P < 0.0001), suggesting that centriolar satellites play a role in regulating centrosomal CCDC15 levels (Fig. S3, F and G; Odabasi et al., 2020).

CCDC15 is stably associated with centrosomes throughout the cell cycle. (A) Localization of endogenous CCDC15 to the centrioles in different cell cycle stages. RPE1 cells were stained with antibodies against the centriole marker Centrin-2 and CCDC15. DNA was visualized with DAPI. Scale bar, 5 μm; insets, 1 μm. (B) Spatiotemporal dynamics of CCDC15 during cell cycle. RPE1 cells stably expressing mNG-CCDC15 during mNG-CCDC15 were imaged every 2 min. Scale bar, 1 μm; insets, 0.25 μm. (C) FRAP analysis of CCDC15 dynamics at centrioles. RPE1 cells stably expressing mNG-CCDC15 were grown in a glass-bottom dish; centrioles indicated with yellow circles (3 μm2) were photobleached and then assessed at the indicated times after photobleaching. Scale bar, 500 nm. (D) Percentage of recovery graph of C. Individual FRAP experiments from two biological replicates were fitted into one-phase association curves. n = 11 cells for one centriole curve and n = 15 cells for two centrioles curve. (E) Half-time analyses were calculated using recovery data from D. Error bars, SD. (F) Percentage of mobile and immobile pools of CCDC15 at centrioles were calculated from D. Error bars, SD.
CCDC15 is stably associated with centrosomes throughout the cell cycle. (A) Localization of endogenous CCDC15 to the centrioles in different cell cycle stages. RPE1 cells were stained with antibodies against the centriole marker Centrin-2 and CCDC15. DNA was visualized with DAPI. Scale bar, 5 μm; insets, 1 μm. (B) Spatiotemporal dynamics of CCDC15 during cell cycle. RPE1 cells stably expressing mNG-CCDC15 during mNG-CCDC15 were imaged every 2 min. Scale bar, 1 μm; insets, 0.25 μm. (C) FRAP analysis of CCDC15 dynamics at centrioles. RPE1 cells stably expressing mNG-CCDC15 were grown in a glass-bottom dish; centrioles indicated with yellow circles (3 μm2) were photobleached and then assessed at the indicated times after photobleaching. Scale bar, 500 nm. (D) Percentage of recovery graph of C. Individual FRAP experiments from two biological replicates were fitted into one-phase association curves. n = 11 cells for one centriole curve and n = 15 cells for two centrioles curve. (E) Half-time analyses were calculated using recovery data from D. Error bars, SD. (F) Percentage of mobile and immobile pools of CCDC15 at centrioles were calculated from D. Error bars, SD.

Analysis of CCDC15 localization in MTEC cultures and purified centrosomes. (A) Centriolar recruitment of CCDC15 does not depend on microtubules. RPE1 cells were treated with DMSO (vehicle control) or nocodazole. Cells were fixed and stained for CCDC15, α-tubulin, and γ-tubulin. DNA was visualized with DAPI. Scale bar, 1 μm, insets, 0.25 μm. (B) Quantification of A. Error bars, SD. n > 100 cells per experiment. Data represent mean value from two independent experiments per condition. siControl = 1 ± 0.4, siCCDC15 = 0.95 ± 0.43, P = 0.1113, two-sided t test. (C) Localization of CCDC15 in transiently transfected RPE1 cells. RPE1 cells were transfected with mNG-CCDC15, fixed, and stained for CCDC15 and Centrin-2. DNA was visualized with DAPI. Scale bar, 1 μm, insets, 0.25 μm. (D) Localization of CCDC15 in transiently transfected U2OS cells. U2OS cells were transfected with mNG-CCDC15, fixed, and stained for CCDC15 and Centrin-2. DNA was visualized with DAPI. Scale bar, 1 μm. (E) Quantification of C and D. Error bars, SD. n > 100 cells per experiment. Data represent mean value from two independent experiments per condition. U2OS centrosome and satellite localization: 100%, RPE1 only centrosome localization: 220.3% ± 2.3, centrosome and satellite localization: 79.7% ± 2.3. (F) Role of centriolar satellites in centrosomal targeting of CCDC15. RPE1 wild-type (WT) and satellite-less PCM1 knockout (KO) cells were fixed and stained for CCDC15, PCM1, and DNA. Scale bar, 1 μm, insets, 0.25 μm. (G) Quantification of E. n > 100 cells per experiment. Data represent mean value from two independent experiments per condition. RPE1 WT = 1 ± 0.4, RPE1 PCM1 KO = 0.82 ± 0.34. P < 0.0001, two-sided t test. (H) Representative confocal images of MTEC ALI+4 centrioles expanded using U-ExM and stained for tubulin (magenta) and CCDC15 (green). Scale bar, 5 μm. (I) Representative confocal images of HEK293T centrioles expanded using U-ExM and stained for tubulin (magenta) and CCDC15 (green). Scale bar, 1 μm. (J) Representative 3D-SIM images of CCDC15 localization relative to proximal and distal end markers of centrioles. Centrosomes purified from HEK293T cells were fixed with methanol and stained for CCDC15 and markers for distal appendages (CEP164), proximal end linker (Rootletin), centriole distal end lumen (Centrin-3), and PCM (γ-tubulin). Scale bar, 1 μm. **** P < 0.0001, ns: non-significant.

Analysis of CCDC15 localization in MTEC cultures and purified centrosomes. (A) Centriolar recruitment of CCDC15 does not depend on microtubules. RPE1 cells were treated with DMSO (vehicle control) or nocodazole. Cells were fixed and stained for CCDC15, α-tubulin, and γ-tubulin. DNA was visualized with DAPI. Scale bar, 1 μm, insets, 0.25 μm. (B) Quantification of A. Error bars, SD. n > 100 cells per experiment. Data represent mean value from two independent experiments per condition. siControl = 1 ± 0.4, siCCDC15 = 0.95 ± 0.43, P = 0.1113, two-sided t test. (C) Localization of CCDC15 in transiently transfected RPE1 cells. RPE1 cells were transfected with mNG-CCDC15, fixed, and stained for CCDC15 and Centrin-2. DNA was visualized with DAPI. Scale bar, 1 μm, insets, 0.25 μm. (D) Localization of CCDC15 in transiently transfected U2OS cells. U2OS cells were transfected with mNG-CCDC15, fixed, and stained for CCDC15 and Centrin-2. DNA was visualized with DAPI. Scale bar, 1 μm. (E) Quantification of C and D. Error bars, SD. n > 100 cells per experiment. Data represent mean value from two independent experiments per condition. U2OS centrosome and satellite localization: 100%, RPE1 only centrosome localization: 220.3% ± 2.3, centrosome and satellite localization: 79.7% ± 2.3. (F) Role of centriolar satellites in centrosomal targeting of CCDC15. RPE1 wild-type (WT) and satellite-less PCM1 knockout (KO) cells were fixed and stained for CCDC15, PCM1, and DNA. Scale bar, 1 μm, insets, 0.25 μm. (G) Quantification of E. n > 100 cells per experiment. Data represent mean value from two independent experiments per condition. RPE1 WT = 1 ± 0.4, RPE1 PCM1 KO = 0.82 ± 0.34. P < 0.0001, two-sided t test. (H) Representative confocal images of MTEC ALI+4 centrioles expanded using U-ExM and stained for tubulin (magenta) and CCDC15 (green). Scale bar, 5 μm. (I) Representative confocal images of HEK293T centrioles expanded using U-ExM and stained for tubulin (magenta) and CCDC15 (green). Scale bar, 1 μm. (J) Representative 3D-SIM images of CCDC15 localization relative to proximal and distal end markers of centrioles. Centrosomes purified from HEK293T cells were fixed with methanol and stained for CCDC15 and markers for distal appendages (CEP164), proximal end linker (Rootletin), centriole distal end lumen (Centrin-3), and PCM (γ-tubulin). Scale bar, 1 μm. **** P < 0.0001, ns: non-significant.
We examined CCDC15 dynamics during cell division by time-lapse imaging of RPE1 cells that stably express mNG-CCDC15 (Fig. 2 B and Video 1). Consistent with its centriolar localization, mNG-CCDC15 localized to four foci in dividing cells. To investigate the dynamics of CCDC15 association with the centrioles, we photobleached one or both centrioles in interphase cells and quantified fluorescence recovery over time (Fig. 2, C and D). In both cases, only ∼40% of the mNG-CCDC15 fluorescence recovered rapidly (halftime of ∼10 s), identifying the remaining 60% as immobile CCDC15 pool (Fig. 2, E and F). This result indicates that the majority of CCDC15 is stably associated with the centrosome, resembling the behavior of other centriolar proteins like RTTN and POC1B (Sydor et al., 2018; Venoux et al., 2013).
CCDC15 dynamic localization during cell cycle. U2OS cells stably expressing mNG-CCDC15 were imaged with confocal microscopy every 2 min. Scale bar, 1 µm.
CCDC15 dynamic localization during cell cycle. U2OS cells stably expressing mNG-CCDC15 were imaged with confocal microscopy every 2 min. Scale bar, 1 µm.
To determine the subcentrosomal localization of CCDC15, we determined its localization in reference to the markers of the centriole distal end lumen (Centrin-3), centriole proximal end linker (Rootletin, C-Nap1), proximal centriole (SAS-6), centriole microtubule wall (polyglutamylated tubulin), and PCM (γ-tubulin, CEP152) by imaging cells using three-dimensional structured illumination microscopy (3D-SIM; Fig.3 A). CCDC15 localized to the central region of centrioles between the distal marker Centrin-3 and the proximal end markers Rootletin and γ-tubulin (Fig. 3 A). While CEP152 formed a ring at the proximal end of the centriole, CCDC15 localized in the center of the CEP152 ring. Consistently, CCDC15 localized in the center of the centriole wall distal to SAS-6 (Fig. 3 A). These results show that CCDC15 resides in the centriole lumen.

CCDC15 localizes to the centrioles and interacts with inner scaffold proteins. (A) Representative 3D-SIM micrographs are shown for CCDC15 relative to different markers of the centriole and PCM. RPE1 cells were fixed with methanol and stained for CCDC15 and markers for PCM (γ-tubulin and CEP152), proximal end linker (Rootletin and CNAP-1), proximal marker (SAS-6), centriole microtubule wall (polyglutamylated tubulin), and centriole distal end lumen (Centrin-3). The cartoons indicate the relative localization of the indicated proteins at the centrosome. The fluorescence intensity along the line drawn in the micrographs was plotted as a function of the distance along the line. Scale bar, 500 nm. (B) CCDC15 has proximity interactions with centriolar inner core proteins FAM161A, POC5, POC1B, and Centrin-3. HEK293T cells were transiently transfected with V5-BirA* or V5-BirA*-CCDC15. Following 18-h biotin incubation, cells were lysed, and biotinylated proteins were precipitated by streptavidin beads. The initial sample and immunoprecipitated (IP) biotinylated proteins were run on a gel and immunoblotted with fluorescent streptavidin and antibodies against FAM161A, POC5, POC1B, Centrin-3, and V5. (C) CCDC15 interacts with endogenous centriole inner core proteins including FAM161A, POC5, POC1B, and Centrin-3 but not with proximal end protein SAS6. HEK293T cells were transfected with GFP or GFP-CCDC15 plasmids. 24 h after transfection, cell lysates were collected and CCDC15 was precipitated using GBP beads. The initial sample and immunoprecipitated proteins were run on a gel and immunoblotted with indicated proteins and GFP. (D) Displacement of CCDC15 to the microtubules upon coexpression with FAM161A. U2OS cells were transfected with only mNG-CCDC15, mCherry-FAM161A, or both. Cells were fixed with methanol and stained with antibodies against the epitope tags and the microtubule marker α-tubulin. Scale bar, 10 μm. Source data are available for this figure: SourceData F3.
CCDC15 localizes to the centrioles and interacts with inner scaffold proteins. (A) Representative 3D-SIM micrographs are shown for CCDC15 relative to different markers of the centriole and PCM. RPE1 cells were fixed with methanol and stained for CCDC15 and markers for PCM (γ-tubulin and CEP152), proximal end linker (Rootletin and CNAP-1), proximal marker (SAS-6), centriole microtubule wall (polyglutamylated tubulin), and centriole distal end lumen (Centrin-3). The cartoons indicate the relative localization of the indicated proteins at the centrosome. The fluorescence intensity along the line drawn in the micrographs was plotted as a function of the distance along the line. Scale bar, 500 nm. (B) CCDC15 has proximity interactions with centriolar inner core proteins FAM161A, POC5, POC1B, and Centrin-3. HEK293T cells were transiently transfected with V5-BirA* or V5-BirA*-CCDC15. Following 18-h biotin incubation, cells were lysed, and biotinylated proteins were precipitated by streptavidin beads. The initial sample and immunoprecipitated (IP) biotinylated proteins were run on a gel and immunoblotted with fluorescent streptavidin and antibodies against FAM161A, POC5, POC1B, Centrin-3, and V5. (C) CCDC15 interacts with endogenous centriole inner core proteins including FAM161A, POC5, POC1B, and Centrin-3 but not with proximal end protein SAS6. HEK293T cells were transfected with GFP or GFP-CCDC15 plasmids. 24 h after transfection, cell lysates were collected and CCDC15 was precipitated using GBP beads. The initial sample and immunoprecipitated proteins were run on a gel and immunoblotted with indicated proteins and GFP. (D) Displacement of CCDC15 to the microtubules upon coexpression with FAM161A. U2OS cells were transfected with only mNG-CCDC15, mCherry-FAM161A, or both. Cells were fixed with methanol and stained with antibodies against the epitope tags and the microtubule marker α-tubulin. Scale bar, 10 μm. Source data are available for this figure: SourceData F3.
Given its centriolar localization profile and identification in the proximity interactome of Centrin-2 and POC5, we next performed affinity purification experiments to examine whether it has proximity and physical interactions with the inner scaffold proteins (Fig. 3, B and C). First, we performed streptavidin pulldowns in biotin-treated cells expressing V5BirA*-CCDC15 or V5BirA* (negative control; Fig. 3 B). Centrin-2, POC5, POC1B, and FAM161A were detected among the biotinylated proteins coprecipitated from cells expressing V5BirA*-CCDC15, but not V5BirA* (Fig. 3 B). Next, we examined their physical interaction by GFP pulldown experiments in cells expressing GFP-CCDC15 and found that Centrin-2, POC5, POC1B, and FAM161A coprecipitated with GFP-CCDC15, but not GFP (Fig. 3 C). GFP-CCDC15 did not interact with SASS6, a centriole protein that does not localize to the inner scaffold (Fig. 3 C). These results identify CCDC15 as a new centriole protein that interacts with inner scaffold proteins and suggest that these interactions might underlie its functions at the centriole.
Given that the inner scaffold ensures stability of centrioles via binding to centriolar microtubules, we investigated the nature of CCDC15 interaction with microtubules. The microtubule-associated protein FAM161A was shown to act as a scaffold to recruit inner scaffold proteins POC5 and POC1B to the microtubules (Le Guennec et al., 2020). Therefore, we hypothesized that CCDC15 depended on FAM161A for its recruitment to microtubules. To test this, mNG-CCDC15 and mCherry-FAM161A were expressed alone or in combination in U2OS cells (Fig. 3 D). Although inner scaffold proteins tend to self-associate, mNG-CCDC15 did not induce the formation of filamentous structures and localized to centrioles when expressed alone (Fig. 3 D). Strikingly, its coexpression with FAM161A resulted in its redistribution to microtubules (Fig. 3 D). This result suggests that CCDC15 might form a microtubule-associated complex with inner scaffold proteins.
CCDC15 is a component of the centriole inner scaffold
To map CCDC15 localization within the centriole at nanoscale resolution, we analyzed its distribution using U-ExM (Gambarotto et al., 2019). In RPE1 cells immunostained with antibodies against CCDC15 and tubulin, we found that CCDC15 localizes to the inner core of the centrioles, as shown in longitudinal and top views (Fig. 4, A and B). Longitudinal views suggest a potential helical arrangement of CCDC15 on the inner scaffold, aligning with its documented periodic, helical structure (Le Guennec et al., 2020). From longitudinal views, we calculated centriole length as represented by tubulin staining as 446.7 nm (±45.3 nm) and CCDC15 length inside the centriole as 250.1 (±41.1 nm; Fig. 4 C). This indicates that CCDC15 spans 55% ± 4.1 nm of the centrioles (Fig. 4 D). From the top views, we calculated the average distance between CCDC15 and tubulin maximum intensity signal from the exterior to the interior of the centriole and found that it was Δ = 17 ± 2 nm, showing that CCDC15 signal is shifted toward the centriole lumen relative to the tubulin signal (Fig. 4 E). This positioning is consistent with the reported localization profiles of other inner scaffold proteins. Comparing their relative displacements suggests that CCDC15 might localize between POC1B and FAM161A (Le Guennec et al., 2020; Steib et al., 2020). U-ExM analysis also revealed CCDC15 localization to the inner scaffold in other cell types, such as differentiating mouse tracheal epithelial cells (MTEC) at ALI (air liquid interferance) +4 and HEK293T cells (Fig. S3, H and I). 3D-SIM imaging of purified centrosomes revealed CCDC15’s localization at the centrosomes between distal markers CEP164 and Centrin-3 and proximal markers Rootletin and γ-tubulin (Fig. S3 J). Collectively, our data identify CCDC15 as a new inner scaffold component.

CCDC15 localizes to the inner scaffold. (A) Representative confocal images of RPE1 mature centrioles expanded using U-ExM and stained for tubulin (magenta) and CCDC15 (green). Scale bar, 1 μm. (B) Top-view confocal images of RPE1 mature centriole images in U-ExM stained for tubulin in magenta and CCDC15 in green. Scale bar, 1 μm. (C) Respective lengths of tubulin and CCDC15 based on A. Error bars, SD. n > 15 centrioles from two independent experiments. Tubulin: 446 nm ± 45, CCDC15: 250 ± 41 nm. (D) Position of CCDC15 along the centriole with its respective percentage of centriole coverage, which was calculated as 55% based on C. (E) Plot profile of CCDC15 (green) and tubulin (magenta). The distance between the tubulin and CCDC15 rings were calculated as 17 nm ± 2 based on C. (F) Timing of CCDC15 centriolar recruitment during centriole duplication. Representative confocal images of RPE1 centrioles at the different stages of centriole duplication were shown. RPE1 cells synchronized in S/G2 phase were expanded using U-ExM and stained for tubulin (magenta) and CCDC15 (green). Procentriole lengths were indicated below the micrographs. Arrows mark the procentrioles. Scale bar, 1 μm. (G) Quantification of CCDC15 fluorescence intensity at different stages of centriole duplication. Normalized CCDC15 fluorescence intensity at the procentrioles was plotted against procentriole length. CCDC15 fluorescence intensity for each centriole was normalized to the mean CCDC15 fluorescence intensity of all centrioles (=1) quantified per experiment. Error bars, SD. n = 30 centrioles. Data represent mean value from three independent experiment. 0–200 nm: 0.31 ± 27, 200–400 nm: 1.23 ± 0.75, >400 nm: 1.49 ± 0.74. P < 0.0001, ns: non-signficant. P < 0.0001, two-sided t test. **** P < 0.0001, ns: non-significant. (H) Representative confocal images of CCDC15 localization (green) at the basal bodies (magenta) in RPE1 cells serum starved for 24 h and expanded using U-ExM. Scale bar, 1 μm. (I) Expression profile of CCDC15 in synchronized cells. Lysates were run on western blot and immunoblotted with CCDC15, CyclinA2, and GAPDH antibodies. U2OS cells were synchronized at the G1/S transition using a double thymidine (DT) block, then released into the cell cycle. Lysates prepared from cells at different time points were immunoblotted for CCDC15, CyclinA2 (marker for the G2/M phase), and GAPDH (loading control). Arrow marks the band for CCDC15. (J) Quantification of band intensities of CCDC15 and CyclinA2 normalized to the actin (loading control). Data represents mean value from three independent experiments. Error bars, SD. P = 0.0286, two-sided t test. *P < 0.05. Source data are available for this figure: SourceData F4.
CCDC15 localizes to the inner scaffold. (A) Representative confocal images of RPE1 mature centrioles expanded using U-ExM and stained for tubulin (magenta) and CCDC15 (green). Scale bar, 1 μm. (B) Top-view confocal images of RPE1 mature centriole images in U-ExM stained for tubulin in magenta and CCDC15 in green. Scale bar, 1 μm. (C) Respective lengths of tubulin and CCDC15 based on A. Error bars, SD. n > 15 centrioles from two independent experiments. Tubulin: 446 nm ± 45, CCDC15: 250 ± 41 nm. (D) Position of CCDC15 along the centriole with its respective percentage of centriole coverage, which was calculated as 55% based on C. (E) Plot profile of CCDC15 (green) and tubulin (magenta). The distance between the tubulin and CCDC15 rings were calculated as 17 nm ± 2 based on C. (F) Timing of CCDC15 centriolar recruitment during centriole duplication. Representative confocal images of RPE1 centrioles at the different stages of centriole duplication were shown. RPE1 cells synchronized in S/G2 phase were expanded using U-ExM and stained for tubulin (magenta) and CCDC15 (green). Procentriole lengths were indicated below the micrographs. Arrows mark the procentrioles. Scale bar, 1 μm. (G) Quantification of CCDC15 fluorescence intensity at different stages of centriole duplication. Normalized CCDC15 fluorescence intensity at the procentrioles was plotted against procentriole length. CCDC15 fluorescence intensity for each centriole was normalized to the mean CCDC15 fluorescence intensity of all centrioles (=1) quantified per experiment. Error bars, SD. n = 30 centrioles. Data represent mean value from three independent experiment. 0–200 nm: 0.31 ± 27, 200–400 nm: 1.23 ± 0.75, >400 nm: 1.49 ± 0.74. P < 0.0001, ns: non-signficant. P < 0.0001, two-sided t test. **** P < 0.0001, ns: non-significant. (H) Representative confocal images of CCDC15 localization (green) at the basal bodies (magenta) in RPE1 cells serum starved for 24 h and expanded using U-ExM. Scale bar, 1 μm. (I) Expression profile of CCDC15 in synchronized cells. Lysates were run on western blot and immunoblotted with CCDC15, CyclinA2, and GAPDH antibodies. U2OS cells were synchronized at the G1/S transition using a double thymidine (DT) block, then released into the cell cycle. Lysates prepared from cells at different time points were immunoblotted for CCDC15, CyclinA2 (marker for the G2/M phase), and GAPDH (loading control). Arrow marks the band for CCDC15. (J) Quantification of band intensities of CCDC15 and CyclinA2 normalized to the actin (loading control). Data represents mean value from three independent experiments. Error bars, SD. P = 0.0286, two-sided t test. *P < 0.05. Source data are available for this figure: SourceData F4.
During centriole duplication, inner scaffold proteins including POC5 and WDR90 are recruited to procentrioles in early G2 and reach full incorporation by the end of G2 (Azimzadeh et al., 2009; Steib et al., 2020). To investigate the timing of CCDC15 centriolar recruitment during centriole biogenesis, we examined CCDC15 localization relative to the length of procentrioles at different stages of centriole duplication (Fig. 4, F and G). To this end, we performed U-ExM imaging in synchronized cells stained for CCDC15 and acetylated tubulin (Fig. 4 F). Quantification of normalized CCDC15 centriole intensity relative to procentriole length showed that CCDC15 did not localize to centrioles in early stages of centriole duplication and was recruited to the central core in elongated centrioles (Fig. 4 G). In cells that formed primary cilia upon serum starvation, CCDC15 localized to the central core of their basal bodies (Fig. 4 H). In parallel, we quantified the protein expression profile of CCDC15 in cells synchronized at the G1/S transition using a double thymidine block, then released into the cell cycle. Lysates prepared from cells at different time points were immunoblotted for CCDC15 and Cyclin A2, a cyclin marker for the G2/M phase (Ding et al., 2018; Silva Cascales et al., 2021). CCDC15 levels increased gradually form early S phase until mitosis (0–8 h; Fig. 4, I and J). These results demonstrate that CCDC15 is a cell cycle–regulated protein recruited during procentriole assembly.
CCDC15 regulates centriole length and structure
To investigate CCDC15 functions at centrioles, we performed siRNA-mediated loss-of-function experiments and phenotypically characterized CCDC15-depleted cells by imaging-based assays. As assessed by immunofluorescence, CCDC15 was efficiently depleted from RPE1 cells 96 h after transfection with an siRNA against CCDC15 (Fig. S4 A). Centrosomal CCDC15 levels were reduced by about 70% in CCDC15-depleted cells as compared with control cells (Fig. S4 A). We also used U-ExM to determine the extent of CCDC15 loss from centrioles transfected with CCDC15 siRNA. About 49.6% (±4.0) of the centrioles still had CCDC15 fluorescence signal at one of the centrioles upon CCDC15 siRNA treatment (Fig. 5, A and B). The inefficient depletion of the mature centriole pool of CCDC15 is analogous to what was observed upon depletion of other centriole lumen and inner scaffold proteins including WDR90 and HAUS6 (Schweizer et al., 2021; Steib et al., 2020).
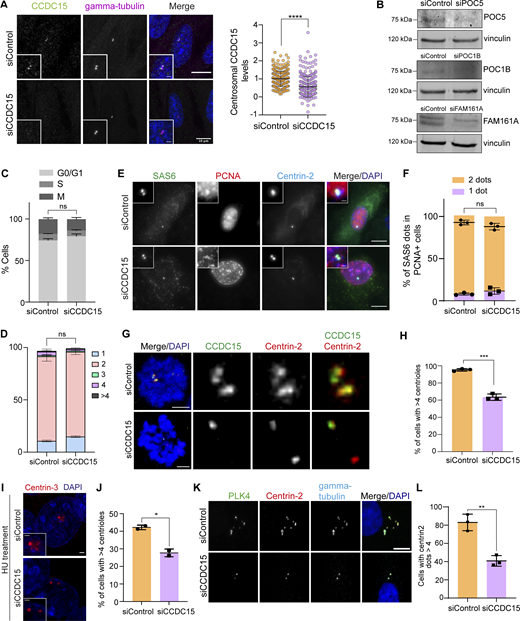
CCDC15 is required for centriole amplification, but not canonical centriole duplication. (A) Immunofluorescence validation of CCDC15 depletion by siRNA treatment in RPE1 cells. RPE1 cells were transfected with control and CCDC15 siRNAs. 96 h after transfection, cells were fixed with methanol and stained for CCDC15 and γ-tubulin. Error bars, SD. n > 100 cells per experiment. Data represent mean value from three experiments per condition. siControl: 1 ± 0.43, siCCDC15: 0.56 ± 0.55, P < 0.0001, two-sided t test. Scale bar, 10 μm, insets, 2 μm. Statistical analysis was done by normalizing the values to the mean of siControl. Absolute intensity for CCDC15 was not plotted. Instead, intensities were normalized to the average CCDC15 intensity of the control sample. (B) Validation of siRNA-mediated depletion of POC5, POC1B, and FAM161A in RPE1 cells. Cells were transfected with control or POC5, POC1B, and FAM161A siRNAs and extracts from these cells were immunoblotted for the indicated proteins and vinculin as loading control. (C) Cell cycle profile of control and CCD15-depleted RPE1 cells. RPE1 cells were transfected with control and CCDC15 siRNAs. 96 h after transfection, cells were fixed with ethanol and stained with Muse Cell Cycle kit. Error bars, SD. Data represent mean value from two independent experiments per condition. For G0/G1 phase, siControl = 74.20% ± 2.12, siCCDC15 = 79.20% ± 2.83, P = 0.1835%; for S phase, siControl = 6.95% ± 0.78, siCCDC15 = 7.8% ± 0.42, P = 0.3077; for G2/M phase, siControl = 17.80% ± 1.70, siCCDC15 = 13.60% ± 2.12, P = 0.1603, one-way ANOVA. (D) Quantification of centriole number in control or CCDC15 siRNA–transfected asynchronous RPE1 cells. Error bars, SD. n > 100 cells per experiment. Data represent mean value from two independent experiments per condition. Centriole number >4 siControl = 0.71% ± 0.3, siCCDC15 = 0.62% ± 0.5, P = 0.7397, two-sided t test. (E) Representative immunofluorescence images of control and CCDC15-depleted cells stained for SAS6, PCNA, and Centrin-2. DNA was visualized with DAPI. Scale bar, 10 μm, insets, 2 μm. (F) Quantification of SAS6 dots in PCNA-positive cells in D. Error bars, SD. n > 50 cells per experiment. Data represent mean value from three experiments per condition. SAS6 2 dots: siControl = 93% ± 3, siCCDC15 = 88% ± 4, P = 0.1565; SAS6 1 dot: siControl = 8% ± 1, siCCDC15 = 12% ± 4, P = 0.2172, two-sided t test. (G) Representative images of centrioles in control and CCDC15-depleted RPE1 cells synchronized by STLC treatment. Cells were transfected with control and CCDC15 siRNA and treated with 50 µM STLC for 18 h before fixation. Cells were then stained for CCDC15 and Centrin-2. The DNA was visualized with DAPI. Scale bar, 10 μm. (H) Quantification of cells with more than four centrioles based on F. Error bars, SD. n > 100 cells per experiment. Data represent mean value from three experiments per condition. siControl = 95% ± 1, siCCDC15 = 63% ± 4, P = 0.0002, two-sided t test. (I) CCDC15 depletion compromises S phase arrest overduplication of centrioles. U2OS cells were transfected with control siRNA or CCDC15 siRNA and arrested in S phase by hydroxyurea treatment for 48 h. Cells were then stained with CCDC15 and Centrin-3. DNA was visualized with DAPI. Scale bar, 10 μm, insets, 2 μm. (J) Quantification of cells with >4 centrioles based on H. Error bars, SD. n > 100 cells per experiment. Data represent mean value from two experiments per condition. siControl = 42% ± 1, siCCDC15 = 28% ± 2, P = 0.0148, two-sided t test. (K) CCDC15 depletion compromises PLK4-induced centriole amplification. RPE-1 cells stably expressing Tet-inducible Plk4 were depleted of CCDC15 by siRNA for 72 h then treated with doxycycline for 18 h to induce Plk4 expression. Cells were fixed and stained for PLK4, Centrin-2, and γ-tubulin. DNA was visualized with DAPI. Scale bar, 10 μm. (L) Quantification of cells with more than four centriole dots based on J. Error bars, SD. n > 100 cells per experiment. Data represent mean value from three experiments per condition. siControl = 83% ± 9, siCCDC15 = 41% ± 6, P = 0.0024, two-sided t test. * P < 0.05, ** P < 0.01, *** P < 0.001, **** P < 0.0001, ns: non-significant. Source data are available for this figure: SourceData FS4.

CCDC15 is required for centriole amplification, but not canonical centriole duplication. (A) Immunofluorescence validation of CCDC15 depletion by siRNA treatment in RPE1 cells. RPE1 cells were transfected with control and CCDC15 siRNAs. 96 h after transfection, cells were fixed with methanol and stained for CCDC15 and γ-tubulin. Error bars, SD. n > 100 cells per experiment. Data represent mean value from three experiments per condition. siControl: 1 ± 0.43, siCCDC15: 0.56 ± 0.55, P < 0.0001, two-sided t test. Scale bar, 10 μm, insets, 2 μm. Statistical analysis was done by normalizing the values to the mean of siControl. Absolute intensity for CCDC15 was not plotted. Instead, intensities were normalized to the average CCDC15 intensity of the control sample. (B) Validation of siRNA-mediated depletion of POC5, POC1B, and FAM161A in RPE1 cells. Cells were transfected with control or POC5, POC1B, and FAM161A siRNAs and extracts from these cells were immunoblotted for the indicated proteins and vinculin as loading control. (C) Cell cycle profile of control and CCD15-depleted RPE1 cells. RPE1 cells were transfected with control and CCDC15 siRNAs. 96 h after transfection, cells were fixed with ethanol and stained with Muse Cell Cycle kit. Error bars, SD. Data represent mean value from two independent experiments per condition. For G0/G1 phase, siControl = 74.20% ± 2.12, siCCDC15 = 79.20% ± 2.83, P = 0.1835%; for S phase, siControl = 6.95% ± 0.78, siCCDC15 = 7.8% ± 0.42, P = 0.3077; for G2/M phase, siControl = 17.80% ± 1.70, siCCDC15 = 13.60% ± 2.12, P = 0.1603, one-way ANOVA. (D) Quantification of centriole number in control or CCDC15 siRNA–transfected asynchronous RPE1 cells. Error bars, SD. n > 100 cells per experiment. Data represent mean value from two independent experiments per condition. Centriole number >4 siControl = 0.71% ± 0.3, siCCDC15 = 0.62% ± 0.5, P = 0.7397, two-sided t test. (E) Representative immunofluorescence images of control and CCDC15-depleted cells stained for SAS6, PCNA, and Centrin-2. DNA was visualized with DAPI. Scale bar, 10 μm, insets, 2 μm. (F) Quantification of SAS6 dots in PCNA-positive cells in D. Error bars, SD. n > 50 cells per experiment. Data represent mean value from three experiments per condition. SAS6 2 dots: siControl = 93% ± 3, siCCDC15 = 88% ± 4, P = 0.1565; SAS6 1 dot: siControl = 8% ± 1, siCCDC15 = 12% ± 4, P = 0.2172, two-sided t test. (G) Representative images of centrioles in control and CCDC15-depleted RPE1 cells synchronized by STLC treatment. Cells were transfected with control and CCDC15 siRNA and treated with 50 µM STLC for 18 h before fixation. Cells were then stained for CCDC15 and Centrin-2. The DNA was visualized with DAPI. Scale bar, 10 μm. (H) Quantification of cells with more than four centrioles based on F. Error bars, SD. n > 100 cells per experiment. Data represent mean value from three experiments per condition. siControl = 95% ± 1, siCCDC15 = 63% ± 4, P = 0.0002, two-sided t test. (I) CCDC15 depletion compromises S phase arrest overduplication of centrioles. U2OS cells were transfected with control siRNA or CCDC15 siRNA and arrested in S phase by hydroxyurea treatment for 48 h. Cells were then stained with CCDC15 and Centrin-3. DNA was visualized with DAPI. Scale bar, 10 μm, insets, 2 μm. (J) Quantification of cells with >4 centrioles based on H. Error bars, SD. n > 100 cells per experiment. Data represent mean value from two experiments per condition. siControl = 42% ± 1, siCCDC15 = 28% ± 2, P = 0.0148, two-sided t test. (K) CCDC15 depletion compromises PLK4-induced centriole amplification. RPE-1 cells stably expressing Tet-inducible Plk4 were depleted of CCDC15 by siRNA for 72 h then treated with doxycycline for 18 h to induce Plk4 expression. Cells were fixed and stained for PLK4, Centrin-2, and γ-tubulin. DNA was visualized with DAPI. Scale bar, 10 μm. (L) Quantification of cells with more than four centriole dots based on J. Error bars, SD. n > 100 cells per experiment. Data represent mean value from three experiments per condition. siControl = 83% ± 9, siCCDC15 = 41% ± 6, P = 0.0024, two-sided t test. * P < 0.05, ** P < 0.01, *** P < 0.001, **** P < 0.0001, ns: non-significant. Source data are available for this figure: SourceData FS4.

CCDC15 depletion leads to shorter and structurally aberrant centrioles. (A) CCDC15 depletion leads to shorter centrioles. Representative confocal images of expanded centrioles from control and CCDC15-depleted cells stained for CCDC15 (green) and tubulin (magenta). RPE1 cells were transfected with control or CCDC15 siRNA. 96 h after transfection, cells were expanded by U-ExM. Note that CCDC15 was efficiently depleted from only one of the centrioles in most cells (white arrow). Scale bar, 200 nm. (B) Quantification of percentage of CCDC15-positive centrioles based on A. n > 40 centrioles per experiment. Data represents mean value from three independent experiments. Error bars, SD. siControl = 100%, siCCDC15 = 48% ± 4. P = 0.0031, two-sided t test. (C) Centriole length quantification based on A. Error bars, SD. n > 10 centrioles per experiment. Data represents mean value from three independent experiments. siControl: 413 nm ± 66, siCCDC15: 367 nm ± 62. P = 0.0001, two-sided t test. Centrioles depleted of CCDC15 were 45 nm shorter compared with control centrioles in RPE1 cells. (D) Changes in diameter in distal (d), central (c), and proximal (p) regions of the centrioles. RPE1 cells were transfected with control or CCDC15 siRNA and expanded by U-ExM 96 h after transfection. Gels were stained with tubulin (magenta) and endogenous CCDC15 (green) antibodies. Scale bar, 200 nm. (E) Quantification of D. Error bars, SD. n > 10 centrioles per experiment. Data represents mean value from three independent experiments. Distal region: siControl: 222 nm ± 26, siCCDC15: 232 nm ± 25, P = 0.0828; core region siControl: 233 nm ± 23, siCCDC15: 247 nm ± 28, P = 0.0204; proximal region siControl: 242 nm ± 23, siCCDC15: 242 nm ± 27, P = 0.9856, two-sided t test. (F) Representative confocal images of expanded centrioles in control and CCDC15-depleted RPE1 cells stained for CCDC15 (green) and tubulin (magenta). Different types of structural defects of CCDC15-depleted cells were represented, which included centrioles with broken, wider or shorter microtubule walls. Scale bar, 200 nm. (G) Depletion of POC1B and POC5 lead to shorter centrioles while FAM161A has no effect. Representative confocal images of expanded centrioles from control, POC1B, POC5, and FAM161A-depleted cells stained for tubulin (magenta). RPE1 cells were transfected with control, POC1B, POC5, and FAM161A siRNA. 48 h for POC1B and POC5 and 76 h for FAM161A after transfection, cells were expanded by U-ExM. Scale bar, 200 nm. (H) Centriole length quantification based on G. Error bars, SD. n > 10 centrioles per experiment. Data represents mean value from three independent experiments. POC1B: siControl: 400.6 nm ± 36.1, siPOC1B: 341.5 ± 44.39 nm, P < 0.0001; POC5: siControl: 414.1 nm ± 38.3, siPOC5: 432.7 nm ± 44.8, P = 0.0647, FAM161A: siControl: 447.8 nm ± 59.7, siFAM161A: 436.3 nm ± 64, P = 0.3549, two-sided t test. * P < 0.05, *** P < 0.001, **** P < 0.0001, ns: non-significant.
CCDC15 depletion leads to shorter and structurally aberrant centrioles. (A) CCDC15 depletion leads to shorter centrioles. Representative confocal images of expanded centrioles from control and CCDC15-depleted cells stained for CCDC15 (green) and tubulin (magenta). RPE1 cells were transfected with control or CCDC15 siRNA. 96 h after transfection, cells were expanded by U-ExM. Note that CCDC15 was efficiently depleted from only one of the centrioles in most cells (white arrow). Scale bar, 200 nm. (B) Quantification of percentage of CCDC15-positive centrioles based on A. n > 40 centrioles per experiment. Data represents mean value from three independent experiments. Error bars, SD. siControl = 100%, siCCDC15 = 48% ± 4. P = 0.0031, two-sided t test. (C) Centriole length quantification based on A. Error bars, SD. n > 10 centrioles per experiment. Data represents mean value from three independent experiments. siControl: 413 nm ± 66, siCCDC15: 367 nm ± 62. P = 0.0001, two-sided t test. Centrioles depleted of CCDC15 were 45 nm shorter compared with control centrioles in RPE1 cells. (D) Changes in diameter in distal (d), central (c), and proximal (p) regions of the centrioles. RPE1 cells were transfected with control or CCDC15 siRNA and expanded by U-ExM 96 h after transfection. Gels were stained with tubulin (magenta) and endogenous CCDC15 (green) antibodies. Scale bar, 200 nm. (E) Quantification of D. Error bars, SD. n > 10 centrioles per experiment. Data represents mean value from three independent experiments. Distal region: siControl: 222 nm ± 26, siCCDC15: 232 nm ± 25, P = 0.0828; core region siControl: 233 nm ± 23, siCCDC15: 247 nm ± 28, P = 0.0204; proximal region siControl: 242 nm ± 23, siCCDC15: 242 nm ± 27, P = 0.9856, two-sided t test. (F) Representative confocal images of expanded centrioles in control and CCDC15-depleted RPE1 cells stained for CCDC15 (green) and tubulin (magenta). Different types of structural defects of CCDC15-depleted cells were represented, which included centrioles with broken, wider or shorter microtubule walls. Scale bar, 200 nm. (G) Depletion of POC1B and POC5 lead to shorter centrioles while FAM161A has no effect. Representative confocal images of expanded centrioles from control, POC1B, POC5, and FAM161A-depleted cells stained for tubulin (magenta). RPE1 cells were transfected with control, POC1B, POC5, and FAM161A siRNA. 48 h for POC1B and POC5 and 76 h for FAM161A after transfection, cells were expanded by U-ExM. Scale bar, 200 nm. (H) Centriole length quantification based on G. Error bars, SD. n > 10 centrioles per experiment. Data represents mean value from three independent experiments. POC1B: siControl: 400.6 nm ± 36.1, siPOC1B: 341.5 ± 44.39 nm, P < 0.0001; POC5: siControl: 414.1 nm ± 38.3, siPOC5: 432.7 nm ± 44.8, P = 0.0647, FAM161A: siControl: 447.8 nm ± 59.7, siFAM161A: 436.3 nm ± 64, P = 0.3549, two-sided t test. * P < 0.05, *** P < 0.001, **** P < 0.0001, ns: non-significant.
Inner scaffold proteins were described for their functions during centriole size integrity and architecture. Therefore, we first investigated how CCDC15 loss affects these processes. Using U-ExM, we calculated centriole length using tubulin length as a proxy and found that CCDC15-depleted centrioles exhibited a slight decrease (about 10%) in centriole length relative to control cells (Fig. 5 C). To quantify morphological changes, we determined the diameter of the proximal, central, and distal regions of the centrioles. Despite a slight increase in the diameter in the central core region, the centriole diameter at the proximal and distal regions remained unaltered (Fig. 5, D and E). Notably, we also found structurally abnormal centrioles in about 12% of CCDC15-depleted cells, displaying open, broken, wider, or shorter microtubule walls (Fig. 5 F). Together, these results show that CCDC15 is required for centriole length control and integrity.
To gain insight into the mechanisms by which CCDC15 works together with the inner scaffold proteins it interacts with, we quantified centriole length in control cells and cells depleted for POC5, POC1B, and FAM161A. To this end, we depleted the inner scaffold proteins POC5, POC1B, and FAM161A using previously described siRNAs and validated their depletion by immunoblotting (Fig. S4 B). While POC5 depletion resulted in longer centrioles, POC1B resulted in shorter centrioles (Fig. 5, G and H). FAMA161A depletion did not alter centriole length (Fig. 5, G and H). These results indicate that CCDC15 and POC1B act as positive regulators of centrioles length, whereas POC5 acts as a negative regulator.
To determine the functional consequences of centriole abnormalities associated with CCDC15 depletion, we performed assays to assess cell cycle progression and centriole duplication. Flow cytometry analysis of the asynchronous cells showed that control and CCDC15-depleted cells had similar cell cycle profiles (Fig. S4 C). We also quantified centriole numbers by counting the number of centrin-positive foci in asynchronous cultures and found that CCDC15 had no effect on the number of centrioles (Fig. S4 D). We further investigated cartwheel assembly by counting the number of SAS-6 foci in cells positive for nuclear-proliferating cell nuclear antigen (PCNA), a marker of DNA replication. The percentage of control and CCDC15-depleted cells with two foci were similar, indicating that CCDC15 is not required for centrosomal SAS-6 recruitment (Fig. S4, E and F). However, when the mitotic time was extended to 18 h by treatment with the Eg5 inhibitor (+)-S-trityl-L-cysteine (STLC), we found that 63.4% ± 3.8 of CCDC15-depleted cells had the expected number of at least four centrin foci as compared with 95.3% ± 1.5 of control cells (Fig. S4, G and H). This result suggests centriole destabilization associated with CCDC15 loss, which was also reported for the centriole lumen protein HAUS6 (Schweizer et al., 2021). In addition to canonical duplication, we tested whether CCDC15 is required for centriole amplification. U2OS cells were transfected with control and CCDC15 siRNAs and treated with hydroxyurea for 48 h to induce centriole amplification. We observed that 42.3% ± 1.3 control and 27.7% ± 2.2 of CCDC15-depleted cells had >4 centrioles (Fig. S4, I and K). We also assayed centriole amplification in RPE1::PLK4 inducible line upon control and CCDC15 treatment. There, 83.1% ± 9.1 control and 40.8% ± 5.8 of CCDC15-depleted cells had more than four centrioles (Fig. S4, K and L). Results from centriole duplication and amplification assays show that CCDC15 is required for efficient centriole amplification, but not for canonical centriole duplication.
CCDC15 and other inner scaffold proteins cooperate for their recruitment to centrioles
CCDC15 might confer centriole stability on centrioles via regulating the inner scaffold. We tested this hypothesis by analyzing the localization of five known inner scaffold components POC5, POC1B, Centrin-2, and FAM161A in RPE1 cells treated with control and CCDC15 siRNAs. First, we quantified the coverage of these proteins along the centriole by U-ExM in cells stained for the inner scaffold proteins and centriole marker (Fig. 6, A and B). While the centriolar coverage of POC5 slightly increased, the coverage of POC1B decreased. In contrast, CCDC15 depletion did not alter the central core coverage of Centrin-2 and FAM161A. In addition to their subcentrosomal mapping by U-ExM, we quantified the centrosomal abundance of inner scaffold proteins. As compared with control cells, the centrosomal abundance of POC5 increased, POC1B decreased, and Centrin-2 and FAM161 remained unaltered upon CCDC15 depletion (Fig. S5, A–C). To validate the specificity of CCDC15 functions in recruitment of inner scaffold proteins, we also quantified the centrosomal levels of the PCM protein CEP63 and the distal appendage protein CEP164 and found no statistical differences in their levels between control and CCDC15-depleted cells (Fig. S5, D and E). The trends in the centrosomal abundance changes were similar to the ones quantified by U-ExM (Fig. 6 B). These results show that CCDC15 depletion results in defective recruitment of POC1B to the central core of the centrioles.

CCDC15 is required for recruitment of inner scaffold proteins to the centriole central core and distal end. (A) Representative U-ExM images of centriolar core proteins POC5 (orange), FAM161A (gray), POC1B (blue), and Centrin-2 (green) in control or CCDC15-depleted RPE1 cells. Cells were expanded 96 h after siRNA transfection and immunostained with the indicated antibodies for inner core proteins and tubulin (magenta) for centrioles. Top view of centrioles for Centrin-2 was represented in addition to the longitudinal views represented for all proteins. Scale bar, 200 nm. (B) Quantification of coverages of the centriolar proteins in A. Error bars, SD. n > 20 centrioles per experiment. Data represent mean value from two independent experiments per condition. POC5 coverage: siControl = 52% ± 10, siCCDC15 = 58% ± 12, P = 0.0174; FAM161A coverage: siControl = 50% ± 14, siCCDC15 = 53% ± 15, P = 0.2981; POC1B coverage: siControl = 62% ± 12, siCCDC15 = 53% ± 12, P = 0.0006; Centrin-2 coverage: siControl = 60% ± 12, siCCDC15 = 61% ± 9, P = 0.7254, two-sided t test. (C) Quantification of centrioles positive for Centrin-2 at the distal region of centrioles in control or CCDC15-depleted RPE1 cells based on A. Error bars, SD. n > 20 centrioles per experiment. Data represent mean value from three independent experiments per condition. siControl = 81.25% ± 3, siCCDC15 = 52.46% ± 0.96, P < 0.0001, two-sided t test. (D) Representative U-ExM images of SFI1 protein in control, CCDC15, and POC5 siRNA-depleted RPE1 cells. Cells were expanded and immunostained with SFI1 (green) and tubulin (magenta) antibodies. Scale bar, 200 nm. (E) Quantification of centrioles positive for SFI1 at the distal region of centrioles in control and CCDC15-depleted RPE1 cells based on D. Error bars, SD. n > 20 centrioles per experiment. Data represent mean value from three independent experiments per condition. siControl = 93.25% ± 0.1, siCCDC15 = 56.38% ± 2.2, P < 0.0001; siControl = 96.5% ± 1.5, siPOC5 = 96.4% ± 1.5, P = 0.9625, two-sided t test. (F) Representative U-ExM images of coverages of CCDC15 in control, POC5, POC1B, and FAM161A-depleted RPE1 cells. Cells were expanded and immunostained with CCDC15 (green) and tubulin (magenta) antibodies. Scale bar, 200 nm. (G) Quantification of CCDC15 coverage with respect to tubulin represented in in control, POC5, POC1B, and FAM161A-depleted RPE1 cells represented in F. Error bars, SD. n > 10 centrioles per experiment. Data represent mean value from three independent experiments per condition. siControl = 48.5% ± 11, siPOC1B = 40.6% ± 12.4, P = 0.0062; siPOC5 = 53.1% ± 8.2, P = 0.0538; siFAM61A = 48.8% ± 10.8, non-significant, two-sided t test. (H) Representative U-ExM images of centrioles from RPE1 cells transfected with control siRNA or CCDC15 and POC1B siRNAs together. Cells were stained for CCDC15 and POC1B in green and tubulin in magenta. Scale bar, 500 nm. (I) Representative U-ExM images of defective centrioles in CCDC15 and POC1B co-depleted cells. Cells were costained with CCDC15 and POC1B in green and tubulin in magenta. Scale bar, 500 nm. (J) Centriole length quantification of I. Error bars, SD. n > 15 centrioles per experiment. Data represents mean value from two independent experiment. siControl: 1 ± 0.13, siCCDC15: 0.87 ± 0.11, P < 0.0001, siCCDC15/siPOC1B: 0.84 ± 0.10, P = 0.2588, two-sided t test. Statistical analysis was done by normalizing the values to the mean of siControl. (K) Percentage of cells with defective centrioles for the indicated cells in CCDC15 and POC1B co-depleted cells. n > 15 centrioles per experiment. Error bars, SD. Data represents mean value from two independent experiments. siControl = 3.35% ± 1.1, siCCDC15 = 12% ± 0.28, siCCDC15/siPOC5 = 23.5% ± 1.13. For siControl-siCCDC15 P = 0.0080, for siCCDC15-siCCDC15/POC1B P = 0.0051, for siControl-siCCDC15/siPOC1B P = 0.0029, two-sided t test. * P < 0.05, ** P < 0.01, *** P < 0.001, **** P < 0.0001, ns: non-significant.
CCDC15 is required for recruitment of inner scaffold proteins to the centriole central core and distal end. (A) Representative U-ExM images of centriolar core proteins POC5 (orange), FAM161A (gray), POC1B (blue), and Centrin-2 (green) in control or CCDC15-depleted RPE1 cells. Cells were expanded 96 h after siRNA transfection and immunostained with the indicated antibodies for inner core proteins and tubulin (magenta) for centrioles. Top view of centrioles for Centrin-2 was represented in addition to the longitudinal views represented for all proteins. Scale bar, 200 nm. (B) Quantification of coverages of the centriolar proteins in A. Error bars, SD. n > 20 centrioles per experiment. Data represent mean value from two independent experiments per condition. POC5 coverage: siControl = 52% ± 10, siCCDC15 = 58% ± 12, P = 0.0174; FAM161A coverage: siControl = 50% ± 14, siCCDC15 = 53% ± 15, P = 0.2981; POC1B coverage: siControl = 62% ± 12, siCCDC15 = 53% ± 12, P = 0.0006; Centrin-2 coverage: siControl = 60% ± 12, siCCDC15 = 61% ± 9, P = 0.7254, two-sided t test. (C) Quantification of centrioles positive for Centrin-2 at the distal region of centrioles in control or CCDC15-depleted RPE1 cells based on A. Error bars, SD. n > 20 centrioles per experiment. Data represent mean value from three independent experiments per condition. siControl = 81.25% ± 3, siCCDC15 = 52.46% ± 0.96, P < 0.0001, two-sided t test. (D) Representative U-ExM images of SFI1 protein in control, CCDC15, and POC5 siRNA-depleted RPE1 cells. Cells were expanded and immunostained with SFI1 (green) and tubulin (magenta) antibodies. Scale bar, 200 nm. (E) Quantification of centrioles positive for SFI1 at the distal region of centrioles in control and CCDC15-depleted RPE1 cells based on D. Error bars, SD. n > 20 centrioles per experiment. Data represent mean value from three independent experiments per condition. siControl = 93.25% ± 0.1, siCCDC15 = 56.38% ± 2.2, P < 0.0001; siControl = 96.5% ± 1.5, siPOC5 = 96.4% ± 1.5, P = 0.9625, two-sided t test. (F) Representative U-ExM images of coverages of CCDC15 in control, POC5, POC1B, and FAM161A-depleted RPE1 cells. Cells were expanded and immunostained with CCDC15 (green) and tubulin (magenta) antibodies. Scale bar, 200 nm. (G) Quantification of CCDC15 coverage with respect to tubulin represented in in control, POC5, POC1B, and FAM161A-depleted RPE1 cells represented in F. Error bars, SD. n > 10 centrioles per experiment. Data represent mean value from three independent experiments per condition. siControl = 48.5% ± 11, siPOC1B = 40.6% ± 12.4, P = 0.0062; siPOC5 = 53.1% ± 8.2, P = 0.0538; siFAM61A = 48.8% ± 10.8, non-significant, two-sided t test. (H) Representative U-ExM images of centrioles from RPE1 cells transfected with control siRNA or CCDC15 and POC1B siRNAs together. Cells were stained for CCDC15 and POC1B in green and tubulin in magenta. Scale bar, 500 nm. (I) Representative U-ExM images of defective centrioles in CCDC15 and POC1B co-depleted cells. Cells were costained with CCDC15 and POC1B in green and tubulin in magenta. Scale bar, 500 nm. (J) Centriole length quantification of I. Error bars, SD. n > 15 centrioles per experiment. Data represents mean value from two independent experiment. siControl: 1 ± 0.13, siCCDC15: 0.87 ± 0.11, P < 0.0001, siCCDC15/siPOC1B: 0.84 ± 0.10, P = 0.2588, two-sided t test. Statistical analysis was done by normalizing the values to the mean of siControl. (K) Percentage of cells with defective centrioles for the indicated cells in CCDC15 and POC1B co-depleted cells. n > 15 centrioles per experiment. Error bars, SD. Data represents mean value from two independent experiments. siControl = 3.35% ± 1.1, siCCDC15 = 12% ± 0.28, siCCDC15/siPOC5 = 23.5% ± 1.13. For siControl-siCCDC15 P = 0.0080, for siCCDC15-siCCDC15/POC1B P = 0.0051, for siControl-siCCDC15/siPOC1B P = 0.0029, two-sided t test. * P < 0.05, ** P < 0.01, *** P < 0.001, **** P < 0.0001, ns: non-significant.

CCDC15 and inner scaffold proteins depend on each other for centrosomal abundance. (A–E) Representative images and quantification of effect of CCDC15 depletion on centrosomal levels of (A) POC1B and Centrin-2 (for POC1B, siControl = 1 ± 0.45 siCCDC15 = 0.62 ± 0.35, P < 0.0001; and for Centrin-2, siControl = 1 ± 0.38, siCCDC15 = 0.97 ± 0.35, P = 0.2083); (B) POC5 (siControl = 1 ± 0.01, siCCDC15 = 1.15 ± 0.06, P < 0.0001); (C) FAM161A (siControl = 1 ± 0.57, siCCDC15 = 0.97 ± 0.58, P = 0.6618); (D) CEP63 (siControl = 1 ± 0.23, siCCDC15 = 0.96 ± 0.17, P = 0.2143); and (E) CEP164 (siControl = 1 ± 0.14, siCCDC15 = 0.98 ± 0.16, P = 0.5910). RPE1 cells were fixed 96 h after transfection with control or CCDC15 siRNA and stained for the indicated proteins. DNA was visualized with DAPI. Error bars, SD. n > 100 cells per experiment. Data represent mean value from three experiments per condition. Two-sided t test. Scale bar, 1 μm, insets, 0.5 μm. (F) Representative images of the effect of POC5, POC1B, or FAM161A depletion on centrosomal levels of CCDC15. RPE1 cells were fixed 96 h after transfection with the indicated siRNAs and stained for CCDC15, Cenrin-2, and γ-tubulin. DNA was visualized with DAPI. Scale bar, 5 μm. (G) Quantification of CCDC15 centrosomal intensity based on F. Error bars, SD. n > 100 cells per experiment. Data represent mean value from three experiments per condition. siControl = 1 ± 0.4; siPOC1B = 0.44 ± 0.32; siPOC5 = 1.3 ± 0.53; siFAM161A = 0.64 ± 0.24, P < 0.0001, two-sided t test. **** P < 0.0001, ns: non-significant.

CCDC15 and inner scaffold proteins depend on each other for centrosomal abundance. (A–E) Representative images and quantification of effect of CCDC15 depletion on centrosomal levels of (A) POC1B and Centrin-2 (for POC1B, siControl = 1 ± 0.45 siCCDC15 = 0.62 ± 0.35, P < 0.0001; and for Centrin-2, siControl = 1 ± 0.38, siCCDC15 = 0.97 ± 0.35, P = 0.2083); (B) POC5 (siControl = 1 ± 0.01, siCCDC15 = 1.15 ± 0.06, P < 0.0001); (C) FAM161A (siControl = 1 ± 0.57, siCCDC15 = 0.97 ± 0.58, P = 0.6618); (D) CEP63 (siControl = 1 ± 0.23, siCCDC15 = 0.96 ± 0.17, P = 0.2143); and (E) CEP164 (siControl = 1 ± 0.14, siCCDC15 = 0.98 ± 0.16, P = 0.5910). RPE1 cells were fixed 96 h after transfection with control or CCDC15 siRNA and stained for the indicated proteins. DNA was visualized with DAPI. Error bars, SD. n > 100 cells per experiment. Data represent mean value from three experiments per condition. Two-sided t test. Scale bar, 1 μm, insets, 0.5 μm. (F) Representative images of the effect of POC5, POC1B, or FAM161A depletion on centrosomal levels of CCDC15. RPE1 cells were fixed 96 h after transfection with the indicated siRNAs and stained for CCDC15, Cenrin-2, and γ-tubulin. DNA was visualized with DAPI. Scale bar, 5 μm. (G) Quantification of CCDC15 centrosomal intensity based on F. Error bars, SD. n > 100 cells per experiment. Data represent mean value from three experiments per condition. siControl = 1 ± 0.4; siPOC1B = 0.44 ± 0.32; siPOC5 = 1.3 ± 0.53; siFAM161A = 0.64 ± 0.24, P < 0.0001, two-sided t test. **** P < 0.0001, ns: non-significant.
Nanoscale mapping of Centrin-2 revealed its dual localization at the central core region and the distal end of the centrioles (Le Guennec et al., 2020; Steib et al., 2020). Centrin-2 was recently described to form a complex with SFI1 to regulate centriole architecture and ciliogenesis (Laporte et al., 2022). Therefore, we examined whether CCDC15 depletion could affect the distal end localization of Centrin-2 and SFI1. Remarkably, analysis of the top and longitudinal views of centrioles showed that CCDC15 depletion resulted in a significant decrease in the percentage of cells with distal Centrin-2 and SFI1 pools at the distal end of centrioles (Fig. 6, A and C–E). To further confirm the specificity of this phenotype, we depleted the inner scaffold protein POC5 and examined its impact on centriolar localization of SFI1. As previously described, POC5 depletion did not alter the percentage of cells with distal SFI1 centriolar pools (Fig. 6, D and E; Laporte et al., 2022). These results identify CCDC15 as a dual regulator of centriolar recruitment of inner scaffold protein POC1B and the distal end SFI1/Centrin-2 complex.
Once we identified CCDC15’s role in localizing inner scaffold proteins at the centriole, we next investigated the complementary effect, asking if inner scaffold proteins could regulate CCDC15 recruitment. Using U-ExM, we first quantified the CCDC15 centriolar coverage in these cells. While the centriolar coverage of CCDC15 increased upon POC5 depletion and decreased upon POC1B depletion, it remained unaltered upon FAM161A depletion (Fig. 6, F and G). Consistently, the centrosomal abundance of CCDC15 decreased in POC1B or FAM161A-depleted cells and increased in POC5-depleted cells (Fig. S5, F and G). Taken together the positive or negative regulatory roles of CCDC15, POC1B, and POC5 suggest that CCDC15 might cooperate with POC1B and compete with POC5 during centriole length regulation.
Since our results show that POC1B and CCDC15 rely on each other for their centriolar localization, we hypothesized that they might cooperate during regulation of centriole stability and length. To test this, we depleted CCDC15 by itself or together with POC1B and confirmed their efficient codepletion by U-ExM analysis of cells stained for CCDC15 and POC1B (Fig. 6 H). Although their codepletion did not have an additive effect on centriole shortening, the percentage of defective centrioles increased by about twofold in codepleted cells relative to POC1B and CCDC15 depletion alone (Fig. 6, H–K). Notably, the observed phenotypes in centriole wall breakage and shape were more severe in codepleted cells (Fig. 6 I). These results indicate that CCDC15/POC1B codepletion enhances centriole architecture abnormalities.
CCDC15 is required for formation and maintenance of primary cilium
Previous studies showed that the inner scaffold proteins including WDR90, Centrin-2, and POC5, as well as the distal SFI1/Centrin-2 complex are required for proper cilium formation and function (Delaval et al., 2011; Hassan et al., 2019; Laporte et al., 2022; Prosser and Morrison, 2015; Steib et al., 2020). To investigate whether CCDC15 functions are required for efficient cilium formation and maintenance, we depleted CCDC15 in RPE1 cells and quantified the percentage of ciliated cells upon 24-h serum starvation. While control cells ciliated at 70.1% ± 6.4, CCDC15-depleted cells ciliated at 45.6% ± 0.8 (Fig. 7, A and B). As quantified from immunofluorescence images and assessed by U-ExM, the cilia that formed in CCDC15-depleted cells were significantly shorter in length (Fig. 7, A, C, and D). Since CCDC15 was not efficiently depleted from the mother centriole, we investigated the link between CCDC15 absence and defective cilium by U-ExM to select depleted cells. We costained CCDC15 with acetylated tubulin, which marks the cilium. While CCDC15-positive centrioles formed primary cilia, centrioles that lacked CCDC15 signal formed shorter and defective cilia (Fig. 7 D). This result further corroborates the role of CCDC15 in the efficiency of cilium formation and cilium maintenance.

CCDC15 depletion results in reduced ciliation and inefficient redistribution of signaling proteins in response to Hedgehog stimulus. (A) Representative immunofluorescence images of ciliogenesis defects in RPE1 cells. Cells were transfected with control or CCDC15 siRNA. 72 h after transfection, cells were serum-starved for 24 h, fixed, and immunostained for the primary cilium with acetylated tubulin antibody (Acet-tubulin) and the centrosome with γ-tubulin antibody. DNA was visualized with DAPI. Yellow dashed boxeds mark the zoomed-in primary cilium. Scale bar, 10 μm, insets, 2 μm. (B and C) Quantification of ciliogenesis efficiency and length for A. Error bars, SD. n > 100 cells per experiment. Data represent mean value from three experiments per condition. Ciliation percentage: siControl = 70% ± 6, siCCDC15 = 46% ± 0.8, P = 0.0027. Cilium length: siControl = 3 μm ± 0.7, siCCDC15 = 2.3 μm ± 0.4, P < 0.0001, two-sided t test. (D) Representative U-ExM images of control and CCDC15-depleted RPE1 cells serum starved for 24 h. Centrioles and primary cilium were stained with tubulin (magenta) antibody and CCDC15 (green). Different ciliary defects associated with basal bodies efficiently depleted for CCDC15 were represented (panel on the right). Scale bar, 200 nm. (E) Representative immunofluorescence images of the effect of CCDC15 depletion on ciliary recruitment of SMO. Control and CCDC15 siRNA–depleted RPE1 cells were treated with 200 nM SAG for 24 h, fixed and stained for SMO, acetylated tubulin (Ac-tub), and DAPI. Yellow dashed boxes mark the zoomed-in primary cilium. Scale bar, 10 μm, insets, 1 μm. (F) Quantification of E. Error bars, SD. n > 50 cells per experiment. Data represent mean value from three independent experiments. SMO-positive cilia: siControl 56% ± 1, siCCDC15 25% ± 6, P = 0.0003, two-sided t test. (G) Representative images of the effect of CCDC15 depletion on basal body levels of IFT88. RPE1 cells were transfected with control or CCDC15 siRNA, fixed and stained for IFT88, acetylated tubulin, and γ-tubulin. DNA was visualized with DAPI. Yellow dashed boxes mark the zoomed-in primary cilium. Scale bar, 10 μm, insets, 1 μm. (H) Quantification of G. Graphs indicate IFT88 levels normalized to γ-tubulin levels at the basal body. Error bars, SD. n > 50 cells per experiment. Data represent the mean of three independent experiments. siControl = 1 ± 0.34, siCCDC15 = 0.67 ± 0.37. P < 0.0001, two-sided t test. ** P < 0.01, *** P < 0.001, **** P < 0.0001, ns: non-significant.
CCDC15 depletion results in reduced ciliation and inefficient redistribution of signaling proteins in response to Hedgehog stimulus. (A) Representative immunofluorescence images of ciliogenesis defects in RPE1 cells. Cells were transfected with control or CCDC15 siRNA. 72 h after transfection, cells were serum-starved for 24 h, fixed, and immunostained for the primary cilium with acetylated tubulin antibody (Acet-tubulin) and the centrosome with γ-tubulin antibody. DNA was visualized with DAPI. Yellow dashed boxeds mark the zoomed-in primary cilium. Scale bar, 10 μm, insets, 2 μm. (B and C) Quantification of ciliogenesis efficiency and length for A. Error bars, SD. n > 100 cells per experiment. Data represent mean value from three experiments per condition. Ciliation percentage: siControl = 70% ± 6, siCCDC15 = 46% ± 0.8, P = 0.0027. Cilium length: siControl = 3 μm ± 0.7, siCCDC15 = 2.3 μm ± 0.4, P < 0.0001, two-sided t test. (D) Representative U-ExM images of control and CCDC15-depleted RPE1 cells serum starved for 24 h. Centrioles and primary cilium were stained with tubulin (magenta) antibody and CCDC15 (green). Different ciliary defects associated with basal bodies efficiently depleted for CCDC15 were represented (panel on the right). Scale bar, 200 nm. (E) Representative immunofluorescence images of the effect of CCDC15 depletion on ciliary recruitment of SMO. Control and CCDC15 siRNA–depleted RPE1 cells were treated with 200 nM SAG for 24 h, fixed and stained for SMO, acetylated tubulin (Ac-tub), and DAPI. Yellow dashed boxes mark the zoomed-in primary cilium. Scale bar, 10 μm, insets, 1 μm. (F) Quantification of E. Error bars, SD. n > 50 cells per experiment. Data represent mean value from three independent experiments. SMO-positive cilia: siControl 56% ± 1, siCCDC15 25% ± 6, P = 0.0003, two-sided t test. (G) Representative images of the effect of CCDC15 depletion on basal body levels of IFT88. RPE1 cells were transfected with control or CCDC15 siRNA, fixed and stained for IFT88, acetylated tubulin, and γ-tubulin. DNA was visualized with DAPI. Yellow dashed boxes mark the zoomed-in primary cilium. Scale bar, 10 μm, insets, 1 μm. (H) Quantification of G. Graphs indicate IFT88 levels normalized to γ-tubulin levels at the basal body. Error bars, SD. n > 50 cells per experiment. Data represent the mean of three independent experiments. siControl = 1 ± 0.34, siCCDC15 = 0.67 ± 0.37. P < 0.0001, two-sided t test. ** P < 0.01, *** P < 0.001, **** P < 0.0001, ns: non-significant.
To assess the signaling competence of cilia that formed upon CCDC15 loss, we quantified cellular response to Hedgehog pathway activation. To this end, control and CCDC15-depleted cells were serum starved for 48 h to promote cilia formation and then stimulated for 24 h with 200 nM Smoothened (SMO) agonist (SAG). We then characterized SMO translocation efficacy to the cilia. As compared with control cells, CCDC15 depletion significantly decreased the percentage of SMO-positive cilia (Fig. 7, E and F). These results show that the cilia that form upon CCDC15 depletion do not efficiently respond to the Sonic hedgehog pathway.
Finally, we investigated whether the ciliary defects associated with CCDC15 loss were due to defects in centrioles’ ability to recruit key ciliogenesis factors. Given the important roles of the IFT-B (intraflagellar transport B) machinery during cilium assembly and length regulation, we assessed how CCDC15 depletion affects basal body recruitment of the IFT-B component IFT88 in control and CCDC15-depleted cells (Mirvis et al., 2018; Nakayama and Katoh, 2018; Pazour et al., 2002). As compared with control cells, we observed a significant decrease in IFT88 levels at the basal body upon CCDC15 depletion, suggesting direct or indirect functions for CCDC15 in this process (Fig. 7, G and H).
Discussion
The inner scaffold of the centrioles recently emerged as an important centriolar subcompartment that regulates centriole integrity, architecture, and function and is implicated in diseases affecting the retina. Using U-ExM, coimmunoprecipitation and loss-of-function experiments, we identified CCDC15 as a centriole inner scaffold component critical for centriole length and integrity and, thereby, for its ability to template assembly of a functional primary cilium. CCDC15 interacts and colocalizes with known inner scaffold proteins and acts as a dual regulator of centriolar recruitment of the inner scaffold protein POC1B and the distal end SFI1/Centrin-2 complex. Our findings suggest a model where CCDC15 functions as part of the inner scaffold to ensure assembly of full-length centrioles with proper architecture and function.
Loss-of-function experiments uncovered CCDC15 functions during regulation of centriole size and integrity. Since similar functions were described for WDR90 and POC5, our results corroborate the role of the inner scaffold in these processes. We also found that CCDC15 and POC1B depletion led to shorter centrioles and POC5 depletion led to longer centrioles in RPE1 cells. Similar to CCDC15 and POC1B, depletion of HAUS6 led to shorter centrioles in RPE1 cells (Schweizer et al., 2021). On the other hand, WDR90 and POC5 depletion resulted in longer centrioles in interphase and shorter centrioles in prometaphase in U2OS cells (Steib et al., 2020). These results highlight the complexity of centriole length regulation by inner scaffold proteins in different cell cycle phases and cell types.
To elucidate the molecular basis of CCDC15-associated centriolar defects, we examined its interaction, localization, and centriolar colocalization dependency with known inner scaffold proteins. Notably, CCDC15 and POC1B localizations to the inner scaffold were interdependent and their codepletion exacerbated centriole shortening phenotypes compared with CCDC15 depletion alone. These findings define POC1B and CCDC15 as positive regulators of centriole length. In contrast to POC1B, CCDC15 depletion led to an increase in the centriolar coverage and levels of POC5, which acts as a negative regulator of centriole length in U2OS and RPE1 cells. Taken together, our results suggest that CCDC15 cooperates with POC1B and competes with POC5 during centriole length regulation. Moreover, they raise the exciting possibility that centriole length can be regulated by opposing activities of inner scaffold proteins. Future studies that explore the relationship among centriole core proteins are required to uncover the precise mechanisms by which they regulate centriole integrity and size.
The distal end of the centrioles is directly engaged in ciliogenesis via removal of the CP110/CEP97 centriole cap complex and recruitment of ciliogenesis factors (Kim and Dynlacht, 2013; Sánchez and Dynlacht, 2016). For example, the inner scaffold protein Centrin-2 also localizes to the centriole distal end where it interacts with SFI1 and regulates centriole architecture as well as ciliogenesis by removing the CP110 cap (Laporte et al., 2022). Unlike Centrin-2, CCDC15 localization was limited to the central core of the centrioles, which is reminiscent of most of the known inner scaffold proteins (Hamel et al., 2017; Laporte et al., 2022; Le Guennec et al., 2020; Steib et al., 2020). Despite its central core localization, CCDC15 depletion resulted in the loss of the distal pool of Centrin-2 without altering its localization to the central core. How CCDC15 regulates centriolar recruitment of distal end proteins without spatially occupying this region remains elusive. Perhaps CCDC15 transiently localizes to this region during centriole assembly, which might explain its presence in the proximity map of Centrin-2. Alternatively, CCDC15 might mediate the interaction between the inner scaffold and distal end proteins via Centrin-2.
Our findings highlight CCDC15’s role in primary cilium assembly, maintenance, and length regulation. While defective cilium assembly and maintenance is a recurrent phenotype associated with depletion of proteins that are required for centriole structural integrity like WDR90, POC5, and POC1B, the underlying regulatory mechanisms remain elusive (Mercey et al., 2022; Pearson et al., 2009; Schweizer et al., 2021; Steib et al., 2020). Since cilium formation requires elongation of microtubule doublets at the distal end of mother centrioles, defects in the inner scaffold might interfere with the ability of centrioles to template primary cilium assembly. Centriole architecture aberrations could disrupt the recruitment of ciliogenesis factors to the centrioles, which is supported by compromised IFT88 targeting to centrioles in CCDC15-depleted cells. Moreover, SFI1/Centrin-2 complex shown to regulate ciliogenesis via centriole cap removal and distal appendage organization (Laporte et al., 2022). Future studies are required to fully uncover the inner scaffold’s exact role in cilium assembly.
Although centrioles in CCDC15-depleted cells ciliated less efficiently relative to control cells, we did not observe any defect in canonical centriole duplication, which is initiated on the wall of the pre-existing centrioles at a single site during S phase. Similarly, loss-of-function studies of other inner scaffold proteins like WDR90 and POC5 did not alter centriole numbers, implying that morphological and structural features governed by the inner scaffold don’t influence canonical centriole duplication (Azimzadeh et al., 2009; Hamel et al., 2017). Intriguingly, CCDC15 depletion led to defects in centriole amplification induced by S phase arrest or PLK4 overexpression. It is possible that the aberrant centrioles associated with loss of the inner scaffold cannot withstand the forces exerted by the extra procentrioles during centriole amplification. It would therefore be interesting to study the role of the inner scaffold during centriole amplification in specialized cells such as multiciliated epithelia and olfactory cells.
Mutations in genes encoding the inner scaffold proteins POC5, POC1B, Centrin-2, and FAM161A were reported in human retinal disorders, which lead to photoreceptor degeneration and vision loss (Langmann et al., 2010; Roosing et al., 2014; Weisz Hubshman et al., 2018; Ying et al., 2019). Due to its interactions with these proteins, CCDC15 might be a candidate gene for retinopathies. Further research, including patient DNA sequencing and in vivo studies, is needed to explore this. Abnormalities in centriole size have implications beyond ciliopathies. A screen in the NCI-60 cancer cell line panel for centrosome abnormalities found deregulation of centriole length as a recurrent feature of cancer (Marteil et al., 2018). Overelongated centrioles were shown to enhance microtubule nucleation and chromosomal instability (Marteil et al., 2018). Notably, aberrant CCDC15 splicing was associated with esophageal squamous cell carcinoma tumorigenesis (Tang et al., 2020). A deeper understanding of CCDC15’s role and mechanisms in these settings can shed light on tumorigenic and developmental processes.
Materials and methods
Plasmids
pDEST-GFP-CCDC15, pLVPT2-V5-BirA*-POC5, and p pLVPT2-V5-BirA*-Centrin-2 were generated by Gateway recombination between donor plasmids and the indicated Gateway destination plasmids. mCherry-FAM161A were previously described in Le Guennec et al. (2020). Full-length CCDC15 was amplified by PCR and cloned into pCDH-EF1-mNG-T2A-Puro lentiviral expression plasmid.
Cell culture, transfection, and lentiviral transduction
Human telomerase immortalized retinal pigment epithelium cells (hTERT-RPE1, ATCC, CRL-4000) and inducible RPE1::Tet-Myc-PLK4 (provided by B. Tsou [Memorial Sloan-Kettering Center, New York, NY; Hatch et al., 2010]) were cultured with Dulbecco’s modified Eagle’s Medium DMEM/F12 50/50 medium (Cat. # P04-41250; Pan Biotech) supplemented with 10% fetal bovine serum (FBS, Ref. # 10270-106, Lot # 42Q5283K; Life Technologies) and 1% penicillin–streptomycin (Cat. # 1540-122; Gibco). Human embryonic kidney (HEK293T, CRL-3216; ATCC) and osteosarcoma epithelial (U2OS, HTB-96; ATCC) cells were cultured with DMEM medium (Cat. # P04-03590; Pan Biotech) supplemented with 10% FBS and 1% penicillin–streptomycin. All cell lines were authenticated by Multiplex Cell Line Authentication and were tested for mycoplasma by MycoAlert Mycoplasma Detection Kit (Lonza). MTEC cultures were grown on Transwell filters using published protocols prepared as previously described (Vladar and Brody, 2013; Vladar and Stearns, 2007). Briefly, trachea were excised, opened longitudinally to expose the lumen, and then incubated in 1.5 mg/ml Pronase E in F-12K nutrient mixture (Invitrogen) at 4°C for about 18 h. Epithelial cells were dislodged from digested trachea samples by gentle agitation and harvested in F-12K with 10% FBS. After pelleting, cells were incubated in 0.5 mg/ml DNase I for 5 min at 4°C, followed by centrifugation at 400 × g for 10 min at 4°C. The resulting pellet was resuspended in DMEM/F-12 (Invitrogen) with 10% FBS and incubated on a Primaria tissue culture dish (Corning) for 3.5 h at 37°C in 5% CO2. Nonadherent cells were harvested, repelleted, resuspended in MTEC Plus medium, and seeded onto Transwell-Clear filters (Corning). Upon reaching confluency, cells were exposed to an air–liquid interface (ALI) using MTEC serum-free medium supplemented with 1 μM DAPT in the chamber below the filter. MTECs were fixed at specific time points after ALI establishment.
U2OS cells were transfected with the plasmids using Lipofectamine 2000 and according to the manufacturer’s instructions (Thermo Fisher Scientific). For pulldown experiments, a total of 10 µg of plasmids was transfected to HEK293T cells using 1 mg/ml polyethylenimine, MW 25 kD (PEI). For microtubule depolymerization experiments, cells were treated with 10 µg/ml nocodazole (Cat. #M1404; Sigma-Aldrich) or vehicle (dimethyl sulfoxide) for 1 h at 37°C. For cell synchronization experiments, 5 µM STLC (Cat. #2799-07-7; Alfa-Aesar) was used for 16 h at 37°C. For hydroxyurea treatment, U2OS cells are treated with 4 mM hydroxyurea for 48 h. Lentivirus was generated using pLVPT2-V5-BirA*-POC5 and p pLVPT2-V5-BirA*-Centrin-2 plasmids as transfer vectors. HEK293T cells were transduced with the indicated lentivirus and selected with 2 µg/ml puromycin for 4–6 d until all the control cells died.
For cell cycle analysis, cells were synchronized at the G1/S boundary by a double-thymidine block. Briefly, cells were incubated in complete media supplemented with 2 mM thymidine (Sigma-Aldrich) for 16 h, washed with PBS and incubated in complete media for 9 h, and finally incubated in complete media supplemented with 2 mM thymidine for 16 h. To release the cells from the arrest, cells were washed in PBS and incubated in complete media and collected at different time points for immunoblotting analysis. To synchronize cells in G2, synchronized cells were treated with 10 μM RO-3306 (Selleckchem) for 24 h and fixed for U-ExM analysis.
siRNA transfections
Cells were seeded onto coverslips at 30–40% confluency and transfected with 50 nM of siRNA in two sequential transfections using Lipofectamine RNAiMAX (Life Technologies) in OPTI-MEM (Life Technologies) according to the manufacturer’s instructions. Depletion of proteins was confirmed at 48, 72, or 96 h after transfection by immunofluorescence and immunoblotting. CCDC15 was depleted using a siRNA with sequence 5′-GCAGUACCUGAGACAUAGATT-3′ (Cat. # s36888; Ambion). For depletion of POC5 (5′-CAACAAAUUCUAGUCAUACUU-3′ and antisense 5′-GUAUGACUAGAAUUUGUUGCU-3′; Dharmacon), POC1B (5′-GAUUCCGUUGGAUUUGCAA-3′; Dharmacon), and FAM161A (siRNA pool 5′-CCAACCUAGAAAAAGAGUATT-3′, 5′-CCACAAUUACAGUACCGGATT-3′, and 5′-GCAAAAAGAAGAACGGAGAtt-3′; Dharmacon) published siRNA sequences were used (Atorino et al., 2020; Di Gioia et al., 2012; Steib et al., 2020).
Immunofluorescence, antibodies, and microscopy
Cells were grown on coverslips, washed twice with PBS, and fixed with either ice-cold methanol at −20°C for 10 min or 4% PFA in cytoskeletal buffer (10 mM PIPES, 3 mM MgCl2, 100 mM NaCl, 300 mM sucrose, pH 6.9) supplemented with 5 mM EGTA and 0.1% Triton X for 15 min at 37°C. After washing twice with PBS, cells were blocked with 3% BSA in PBS + 0.1% Triton X-100 and incubated with primary antibodies in blocking solution for 1 h at room temperature. Cells were washed three times with PBS and incubated with secondary antibodies and DAPI (Thermo Fisher Scientific) at 1:2,000 for 45 min at room temperature. Following three washes with PBS, cells were mounted using Mowiol mounting medium containing N-propyl gallate (Sigma-Aldrich). Primary antibodies used for immunofluorescence were rabbit anti-CCDC15 (1:1,000, PA5-59184; Invitrogen), mouse anti-Centrin-2 (1:1,000, 04-1624; Sigma-Aldrich), mouse anti-γ-tubulin (GTU88, 1:5,000, T6557; Sigma-Aldrich), mouse anti-Cep164 (1:1,000, sc515403; Santa Cruz Biotechnology), mouse anti-SAS6 (1:1,000, sc81431; Santa Cruz Biotechnology), mouse anti-Rootletin (1:500, sc374056; Santa Cruz Biotechnology), mouse anti-PCNA (1:1,000, SC56; Santa Cruz Biotechnology), mouse anti-glutamylated-tubulin (GT335, 1:1,000, AG-20B-0020; Adipogen), mouse anti-Centrin-3 (1:1,000, H8141-3EG; Abnova), mouse anti-V5 (1:1,000, 46-0705; Invitrogen), mouse anti-GFP (1:1,000, A-11120; Life Technologies), rabbit anti-CEP63 (1:1,000, 06-1292; Millipore), rabbit anti-CEP152 (1:1,000, A302-479; Bethyl), mouse anti-α-tubulin (DM1A, 1:10,000, T926-2ML; Sigma-Aldrich), rabbit anti-POC5 (1:750, A303-341A; Invitrogen), rabbit anti-POC1B (1:1,000, PA5-24495; Thermo Fisher Scientific), rabbit anti-FAM161(1:1,000, PA5-56935; Invitrogen), rabbit anti-Centrin-1 (1:1,000, 127941AP; Proteintech), rabbit anti-PCM1 (1:1,000, custom polyclonal antibody raised against PCM1 [1,665–2,026] amino acid fragment purified from Escherichia coli, previously described in Firat-Karalar et al. [2014]), rabbit anti-CP110 (12780-1-AP; Proteintec), mouse anti-CNAP-1 (1:1,000, SC390540; Santa Cruz Biotechnology), mouse anti-SMO (1:500, sc166685; Santa Cruz Biotechnology), rabbit anti-IFT88 (1:1,000, 12780-1-AP; Proteintech), and mouse anti-acetylated tubulin (1:10,000, 059M4812V; Sigma-Aldrich). Secondary antibodies used for immunofluorescence experiments were AlexaFluor goat anti-mouse IgG2a 488 (A21131; Life Technologies), AlexaFluor goat anti-rabbit IgG 488 (A21141; Life Technologies), AlexaFluor goat anti-mouse IgG2a 568 (A21134; Invitrogen), AlexaFluor goat anti-rabbit IgG 568 (A10042; Life Technologies), AlexaFluor goat anti-mouse IgG2b 568 (A21144; Life Technologies), AlexaFluor goat anti-mouse IgG2a 633 (A21136; Invitrogen), AlexaFluor goat anti-mouse IgG1 633 (A21126; Life Technologies), AlexaFluor goat anti-mouse IgG2b 633 (A21146; Life Technologies), and they were used at 1:2,000. Biotinylated proteins were detected with streptavidin coupled to AlexaFluor 568 (S11226; Life Technologies).
Confocal microscopy was performed with a Leica TCS SP8 laser-scanning inverted confocal microscope system equipped for four-color imaging with 405, 488, 561, and 633 nm laser lines, four detection channels (1 photomultiplier tube and 3 Hybrid Detectors), HC PL APO CS2 63 × 1.4 NA and HC PL APO CS2 40 × 1.3 NA oil objectives and an incubation chamber. Pinhole diameter was set to 1 µm. Images were acquired at 20–50 focal planes with 0.2–0.5 µm z-spacing, line averaging set to 2–3 and 400 Hz unidirectional xyz scan mode. An image format of 1,024 × 1,024 pixels and an additional 2–4× optical zoom were used for sample acquisition. The system was controlled with the Leica Application Suite X Software (Leica). Deconvolution was performed using the Huygens Professional (Scientific Volume Imaging). For time-lapse live imaging, asynchronous cells were imaged at 37°C with 5% CO2 with a frequency of 2 min per frame with 0.5-µm step size and 3.5-µm stack size in a 512 × 512-pixel format using HC PL APO CS2 40 × 1.3 NA oil objective. For centrosomal protein level quantifications, images were acquired with Leica DMi8 fluorescent microscope with a stack size of 5–8 µm and step size of 0.3 µm in 1,024 × 1,024-pixel format using HC PL APO CS2 63 × 1.4 NA oil objective.
3D-SIM imaging was performed using Elyra 7 with Lattice SIM2 (Carl Zeiss Microscopy) with a Plan-Apochromat 63×/1.4 Oil DIC M27 objective, 405/488/561/633 nm laser illumination, and standard excitation and emission filter sets. A sCMOS (version 4.2 CL HS) camera was used to acquire images with 110 nm z-spacing over 5–10-μm thickness. Laser powers at the objective focal plane were in the 2–12% range, exposure time was between 50 and 250 ms, and camera gain values were between 5 and 50 during image acquisition. The raw data were reconstructed using the SIM module of ZEN Black Software. Channel alignment was conducted using a calibrated file generated from super-resolution Tetraspec beads (Carl Zeiss Microscopy).
Quantitative immunofluorescence of centrosomal and ciliary levels of proteins was performed by acquiring a z-stack of cells using identical gain and exposure settings, determined by adjusting settings based on the fluorescence signal in the control cells. The z-stacks were used to assemble maximum-intensity projections. The centrosome regions in these images were defined by centrosomal marker γ-tubulin or centrin staining for each cell and the total pixel intensity of a circular 3 μm2 area centered on the centrosome in each cell was measured using ImageJ and defined as the centrosomal intensity. The ciliary regions in these images were defined by ciliary markers ARL13B or acetylated tubulin staining for each cell. Total pixel intensity of fluorescence within the region of interest was measured using ImageJ (National Institutes of Health, Bethesda, MD; Schneider et al., 2012). Background subtraction was performed by quantifying fluorescence intensity of a region of equal dimensions in the area proximate to the centrosome or cilium. Statistical analysis was done by normalizing these values to their mean. Efficiency of primary cilium formation was quantified by counting the total number of cells, and the number of cells with primary cilia, as detected by DAPI and acetylated tubulin staining, respectively. The cilium length was quantified using acetylated tubulin as the primary cilium marker.
Quantitative immunofluorescence of centrosomal and non-centrosomal biotinylation of biotin-treated HEK293T::V5BirA*-Centrin-2 or HEK293T::V5BirA*-POC5 cells immunostained with streptavidin, γ-tubulin, and DAPI was performed by acquiring a z-stack of cells using identical gain and exposure settings. The z-stacks were used to assemble maximum-intensity projections. For centrosomal biotinylation, the total pixel intensity of a circular 5 μm2 area centered on the centrosome marked by γ-tubulin in each cell was measured using ImageJ. For whole-cell biotinylation, the total pixel intensity of the whole cell whose boundary was defined by cytoplasmic γ-tubulin signal was measured using ImageJ. Non-centrosomal biotinylation was calculated by subtracting centrosomal biotinylation from whole-cell biotinylation values. Cells that did not express V5BirA*-Centrin-2 or V5BirA*-POC5 were used as internal controls for endogenous biotinylation, which we defined as unspecific biotinylation. Statistical analysis was done by normalizing these values to the mean of centrosomal intensities (=1).
Fluorescence recovery after photobleaching (FRAP)
RPE1::mNG-CCDC15 cells were kept at 37°C with 5% CO2 in the incubation chamber. FRAP experiments were performed with a Leica TCS SP8 laser-scanning inverted confocal microscope system using an HC PL APO CS2 63 × 1.4 NA oil objective. A 488 nm argon laser with 100% power was used for both imaging and photobleaching. The FRAP wizard of Leica LAS X was used for each experiment; the parameters were set to use a very low laser power for imaging, an efficient bleaching close to the image background, and enough postbleach time points were collected to reach the plateau of the recovery curve or to calculate it. Region of interest was set to include either one centriole or two centrioles. A z-stack of 8 µm with 0.5-µm step size was taken during pre- and postbleaching for both one- and two-centriole FRAP experiments. Maximal projection of the files was performed in Leica LAS X software and analysis was done in ImageJ. Recovery graph quantifications, t-half, and mobile pool quantifications were done using the equations as described (Sprague et al., 2004).
Immunoprecipitation
HEK293T cells were transfected with indicated plasmids. 48 h after transfection, cells were washed and lysed either with LAP200 buffer (50 mM HEPES, pH 7.4, 100 mM KCl, 1 mM EGTA, 1 mM MgCl2, 10% glycerol, 0.3% NP40 freshly supplemented with protease inhibitors, 10 μg/ml Leupeptin, Pepstatin, and Chymostatin, 1 mM PMSF) or radioimmunoprecipitation assay buffer (50 mM Tris, pH 8, 150 mM NaCl, 0.1% SDS, 0.5% sodium deoxycholate, 1% Triton X-100, freshly supplemented with 1 mM DTT and protease inhibitors, 10 μg/ml Leupeptin, Pepstatin, and Chymostatin, 1 mM PMSF) for GBP (GFP binding protein) and streptavidin beads, respectively. Lysates were centrifuged at 13,000 rpm for 10 min at 4°C and supernatants were transferred to a tube. 100 μl from each sample was saved as input. The rest of the supernatant was immunoprecipitated with GFP-Agarose (GTA-100; Chromotek) or Streptavidin agarose resin (20359; Thermo Fisher Scientific) beads overnight at 4°C. After washing 3× with their respective lysis buffer, samples were resuspended in SDS containing sample buffer. The samples were immunoblotted with the indicated antibodies.
Cell lysis, centrosome enrichment, and immunoblotting
Cells were washed with PBS twice and lysed in the lysis buffer (50 mM Tris-HCl, pH 7.6, 150 mM NaCl, 1% Triton X-100), tumbled at 4°C for 40 min, and centrifuged at 15,000 g. Protein concentration was measured with Bradford solution (Bio-Rad Laboratories). The resulting supernatant was added with 6× sample buffer and boiled for 10 min at 95°C.
Centrosome-enriched fractions were prepared from these cells by sucrose gradient centrifugation as described previously (Firat-Karalar and Stearns, 2015). Briefly, cells were treated with 5 μg/ml nocodazole (Sigma-Aldrich) and 5 μg/ml cytochalasin B (Sigma-Aldrich) for 1 h at 37°C. Cells were then lysed in lysis buffer (20 mM HEPES, pH 7.8, 5 mM K-acetate, 0.5 mM MgCI2, 0.5 mM DTT, protease inhibitors), dounce homogenized, and centrifuged at 2,500 g for 5 min. The resulting supernatant was then centrifuged on a discontinuous sucrose gradient (70, 50, and 40% sucrose) at 26,000 g for 1 h. Gradient fractions were collected from the top, centrosome fractions were pooled and lysed at 25°C in lysis buffer (50 mM Tris, pH 7.4, 500 mM NaCI, 0.4% SDS, 5 mM EDTA, 1 mM DTT, 2% Triton X-100, protease inhibitors) and sonicated. For immunofluorescence analysis, centrosome fractions were pelleted onto coverslips using centrifugation.
Samples from cell lysates or centrosome fractions were boiled in sample buffer, resolved by SDS-PAGE, and transferred to nitrocellulose membrane (Bio-Rad Laboratories). Membranes were blocked with 5% milk in Tris-buffered saline containing 1% Tween-20 (Sigma-Aldrich; TBST).
The primary antibody was incubated either at 4°C overnight or at room temperature for a duration of 2 h. Following this, membranes were washed three times with TBST for 5 min per wash. Subsequently, membranes were incubated with the secondary antibody at room temperature for 1 h, which was followed by three times wash with TBST for 15 min per wash. After the washes, membranes were scanned in Li-Cor Odyssey Infrared Imaging System software (Li-Cor Biosciences) at 169 µm. The primary antibodies used for immunoblotting are mouse anti-GFP (1:2,000, A11120; Invitrogen), mouse anti-V5 (1:500, 46-0705; Invitrogen), rabbit anti-FAM161A (1:1,000, PA5-56935; Invitrogen), rabbit anti-POC5 (1:1,000, A303-341A; Bethyl), rabbit anti-POC1B (1:1,000, PA5-24495; Invitrogen), mouse anti-Centrin-3 (1:1,000, H8141-3EG; Abnova), and mouse anti-SAS6 (1:1,000, sc81431; Santa Cruz Biotechnology), rabbit anti-Caspase3 (1:1,000, 19677-1-AP; Proteintech), mouse anti-γ-tubulin (T6557; Sigma-Aldrich) and mouse anti-β-actin (1:1,000, 60008-1-Ig; Proteintech). Secondary antibodies used for western blotting experiments were IRDye680 streptavidin (926-68079; LI-COR), IRDye680- and IRDye 800-coupled and were used at 1:10,000 (catalog no. 926-68070 and 926-32211, respectively; LI-COR Biosciences). Quantifications of band intensities and cropping of the images were performed in ImageJ. A square around the bands for CCDC15, Cyclin A2, and actin at different time points was drawn and the intensity of the band and the background were measured. The background was subtracted from the band intensity. CCDC15 and Cyclin A2 band intensities are normalized to actin intensity and to 1. The graph for this quantification was plotted in GraphPadPrism7.
Cell cycle analysis
RPE1 cells were seeded to 12-well plates and treated with either control siRNA or CCDC15 siRNA for 96 h HEK293T::V5BirA*-POC5 and HEK293T::V5BirA*-Centrin-2 cells were seeded to 12-well plates. Cells were collected with trypsin, centrifuged at 300 g for 5 min, and washed with 1X PBS. 50 μl of PBS was left at the bottom of the tube and the pellet was resuspended in the PBS. The resuspended cells were added onto the 1 ml of 70% ethanol drop by drop while gently vortexing. Fixed cells were incubated at −20°C for 3 h prior to staining. Cells were centrifuged at 300 g for 5 min, washed with 1X PBS, and stained with 200 μl Muse Cell Cycle Reagent (Luminex Corporation) for 30 min before analysis. Samples are run in The Guava Muse Cell Analyzer.
U-ExM and image analysis
U-ExM was performed as previously described (Gambarotto et al., 2021). Briefly, RPE1 cells were grown on 12 mm coverslips in a 24-well plate. Coverslips were incubated in 1.4% formaldehyde/2% acrylamide solution in 1X PBS for 5 h at 37°C. Cells are embedded into a gel prepared with Monomer Solution (for one gel, 25 μl of sodium acrylamide, stock solution at 38% [wt/wt] diluted with nuclease-free water, 12.5 μl of acrylamide, 2.5 μl of bisacrylamide, and 5 μl of 10X PBS) supplemented with tetramethylethylenediamine and ammonium persulfate (final concentration of 0.5%) for 1 h at 37°C. Denaturation was performed at 95°C for 90 min and gels were stained with primary antibodies for 3 h at 37°C. Gels were washed three times 10 min at RT with 1X PBS with 0.1% Triton-X (PBS-T). Secondary antibody incubation is carried out for 2 h 30 at 37°C and gels are washed with three times 10 min washes in PBS-T at RT. Gels were expanded in 100 ml distilled water three times before imaging. The diameter of the gels is measured with a ruler and the expansion factor is calculated by dividing the diameter to 12 mm. Gels were cropped into pieces and mounted to 24-mm coverslips coated with Poly-D-lysine. For MTEC U-ExM, this protocol is used with adaptations for processing the MTEC filters as described previously (Kong and Loncarek, 2021; Sahabandu et al., 2019).
The images are taken with Leica SP8 confocal microscope with 0.30-μm z-intervals and deconvolved in Huygens software. The primary antibodies used in these experiments are rabbit anti-CCDC15 (1:500, PA5-59184; Invitrogen), rabbit anti-POC5 (1:500, A303-341A; Invitrogen), rabbit anti-POC1B (1:500, PA5-24495; Thermo Fisher Scientific), rabbit anti-FAM161A (1:500, PA5-56935; Invitrogen), rabbit anti-SFI1 (1:500, 13550-1-AP; Proteintech), mouse anti-Centrin-2 (1:500, 04-1624; Sigma-Aldrich), rabbit anti-CEP164 (1:500, 22227-1-AP; Proteintech), AA344 (1:250, scFv-S11B, β-tubulin) and AA345 (1:250, scFv-F2C, α-tubulin). The secondary antibodies used in these experiments are goat anti-rabbit IgG 488 (A21141; Life Technologies), and goat anti-mouse IgG (H+L) 594 (A11005; Invitrogen) at 1:1,000, and goat anti-guinea pig 568 (1:1,000, A-11075; Invitrogen).
For U-ExM data, RPE1 cells that are in G1 phase are quantified. Coverages of the proteins in U-ExM images are calculated as previously published (Le Guennec et al., 2020). For diameter measurements, a straight line from the exterior to the interior of the centriole was drawn displaying a resolved signal for both tubulin and the core protein. The position value of the core protein’s maximum fluorescence intensity was aligned to the position of the corresponding tubulin maximal intensity for tubulin measurement. The values for the distance were plotted and analyzed in GraphPadPrism7.
For measurement of centriole diameter at distinct positions, a straight line spanning the centriole is drawn within the distal, middle, and proximal regions with respect to the positions of POC5, POC1B, and FAM161A. The distal region is taken as the portion of the centriole above the staining of POC5, FAM161A, or POC1B, and the proximal region as the region below them. The middle part is defined as the middle of each centriole. Since centrioles are oriented orthogonally and tethered to each other at their proximal ends in interphase cells, we also used the orientation of the centriole pairs as a proxy to determine the proximal and distal ends of the centrioles. The plot profile toll of Fiji is used to gather the data and it was analyzed by the script described in Le Guennec et al. (2020).
Centrioles were considered defective when the roundness of the centriole was lost or the microtubule walls were broken or incomplete. In the longitudinal views of centrioles, defective centrioles were visualized as heterogenous acetylated signals along the centriole wall or irregularities in the cylindrical organization of the centriole wall.
Quantitative immunofluorescence of CCDC15 during different stages of centriole duplication was performed by acquiring a z-stack of expanded cells using identical gain and exposure settings. The z-stacks were used to assemble maximum-intensity projections. The length of procentrioles was measured as described above. Statistical analysis was performed by normalizing CCDC15 intensity of each centriole to the mean CCDC15 intensity of all centrioles (=1). Normalized CCDC15 intensities were plotted against the length of centrioles.
Biotin-streptavidin affinity purification
For large-scale BioID experiments, HEK293T stably expressing V5-BirA*-POC5 or V5-BirA*-Centrin-2 were grown in 5 × 15 cm plates in complete medium supplemented with 50 μM biotin for 18 h. Following biotin treatment, cells were lysed in lysis buffer (20 mM HEPES, pH 7.8, 5 mM K-acetate, 0.5 mM MgCI2, 0.5 mM DTT, protease inhibitors) and sonicated. An equal volume of 4°C 50 mM Tris (pH 7.4) was added to the extracts and insoluble material was pelleted. Soluble materials from whole cell lysates were incubated with Streptavidin agarose beads (Thermo Fisher Scientific). Beads were collected and washed twice in wash buffer 1 (2% SDS in dH2O), once with wash buffer 2 (0.2% deoxycholate, 1% Triton X-100, 500 mM NaCI, 1 mM EDTA, and 50 mM Hepes, pH 7.5), once with wash buffer 3 (250 mM LiCI, 0.5% NP-40, 0.5% deoxycholate, 1% Triton X-100, 500 mM NaCI, 1 mM EDTA, and 10 mM Tris, pH 8.1), and twice with wash buffer 4 (50 mM Tris, pH 7.4, and 50 mM NaCI). 10% of the sample was reserved for western blot analysis and 90% of the sample to be analyzed by mass spectrometry was washed twice in 50 mM NH4HCO3. Mass spectrometry analysis were performed as previously described (Arslanhan et al., 2021; Gurkaslar et al., 2020).
Mass spectrometry data analysis
For identification of high-confidence proximity interaction maps for Centrin-2 and POC5, data from three biological replicates for V5-BirA*-Centrin-2, four biological replicates for V5-BirA*-POC5 were used along with control V5BirA* data as published in Arslanhan et al. (2021). For mass spectrometry analysis, NSAF values were generated for each protein by dividing each peptide spectrum match (PSM) value by the total PSM count in that dataset. The fold change was calculated by dividing the NSAF values of POC5 and Centrin-2 interactors by their NSAF values in control datasets. The NSAF values equal to 0 in the control condition were replaced with the smallest NSAF values represented in the dataset. Proteins with log2 NSAF value >1 as well as proteins identified in at least two biological replicates were accounted. Furthermore, the remaining proteins were submitted to CRAPome (https://reprint-apms.org), which is a contaminant repository for mass spectrometry data collected from affinity purification experiments and a list with contaminancy percentage (%) was calculated (Mellacheruvu et al., 2013). Proteins with contaminancy percentage >30% were considered as a contaminant and removed. The interaction maps were drawn with 480 and 68 interactors for Centrin-2 and POC5, respectively. The GO terms for the proximity interactors were determined by using the Database for Annotation, Visualization, and Integrated Discovery (DAVID).
For Fig. S2, E and F, we performed the network analyses for all the proximity interactors of Centrin-2 and POC5, and high-confidence interactors ranked by their relative fold change in V5-BirA*-Centrin-2 and V5-BirA*-POC5 dataset versus V5-BirA* dataset. The interaction networks of these proteins are plotted using STRING database, and the map is visualized by CytoScape. The functional clusters and GO categories for these clusters are determined with the Clustering with Overlapping Neighborhood Expansion (ClusterONE) plug-in of Cytoscape and BinGO plug-ins (P < 0.05). GO terms were determined by using DAVID. The network output file was visualized using Cytoscape 3.7.2 (Nepusz et al., 2012).
Statistical analysis
Statistical results, average, and standard deviation values were computed and plotted by using Prism (GraphPad). Student’s t test was applied to compare the statistical significance of the measurements unless otherwise stated. The following key is used for asterisk placeholders for P values in the figures: *P < 0.05, **P < 0.01, ***P < 0.001, ****P < 0.0001.
Online supplemental material
Fig. S1 shows the characterization of cell lines used for proximity-labeling experiments; Fig. S2 shows gene enrichment analysis of the POC5 and Centrin-2 proximity interactomes; Fig. S3 shows analysis of CCDC15 localization in different cell types and purified centrosomes; Fig. S4 shows validation of efficient CCDC15 depletion in cell lines and results from the characterization of CCDC15’s role in centriole duplication; and Fig. S5 shows localization dependency analysis of CCDC15 and known inner scaffold proteins. Table S1 includes the full list of proteins identified after mass spectrometry analysis of proximity-labeling samples and results from analysis of each step that led to the high-confidence interactomes for POC5 and Centrin-2; Table S2 shows GO analysis of high-confidence interactors for POC-5 and Centrin-2; and Video 1 shows dynamic localization of CCDC15 during the cell cycle.
Data availability
Mass spectrometry data files are included in the supplementary tables. All other data are available from the corresponding author upon reasonable request.
Acknowledgments
We acknowledge Irem S. Dilbaz for preparing MTEC filters and Koç University Proteomics Facility, Büşra Akarlar, and Nurhan Özlü for mass spectrometry analysis.
This project received funding from the European Research Council Starting Grant No. 679140 to E.N. Firat-Karalar, European Molecular Biology Organization Installation Grant and Young Investigator Award to E.N. Firat-Karalar, Istanbul Development Agency TR10/21/YEP/0057 grant to E.N. Firat-Karalar, the Scientific and Technological Research Institution of Turkey BIDEB 120C148 grant to E.N. Firat-Karalar and TBTK-0065-7203 to S. Cengiz-Emek, and the Swiss National Science Foundation PP00P3_157517 and 310030_205087 to P. Guichard and V. Hamel.
Author contributions: M.D. Arslanhan conducted most experiments and analyzed the data. S. Cengiz-Emek and E. Odabasi contributed to revision experiments. S. Cengiz-Emek conducted immunoprecipitation and cell synchronization experiments and superresolution imaging in cells. E. Odabasi conducted centrosome enrichment experiments and their analysis and prepared samples for U-ExM. E. Steib trained M.D. Arslanhan in the application of the U-ExM approach to the centrosomes. P. Guichard and V. Hamel provided feedback on experimental design, analysis, and the manuscript. E.N. Firat-Karalar supervised the project. E.N. Firat-Karalar and M.D. Arslanhan conceptualized the work and wrote the manuscript. E.N. Firat-Karalar, P. Guichard, and V. Hamel obtained funding. All authors edited and discussed the manuscript.

