


Astrocyte reactivity can directly modulate nervous system function and immune responses during disease and injury. However, the consequence of human astrocyte reactivity in response to specific contexts and within neural networks is obscure. Here, we devised a straightforward bioengineered neural organoid culture approach entailing transcription factor–driven direct differentiation of neurons and astrocytes from human pluripotent stem cells combined with genetically encoded tools for dual cell-selective activation. This strategy revealed that Gq-GPCR activation via chemogenetics in astrocytes promotes a rise in intracellular calcium followed by induction of immediate early genes and thrombospondin 1. However, astrocytes also undergo NF-κB nuclear translocation and secretion of inflammatory proteins, correlating with a decreased evoked firing rate of cocultured optogenetic neurons in suboptimal conditions, without overt neurotoxicity. Altogether, this study clarifies the intrinsic reactivity of human astrocytes in response to targeting GPCRs and delivers a bioengineered approach for organoid-based disease modeling and preclinical drug testing.

Introduction
The use of human pluripotent stem cell (hPSC)–derived neural cells as long-term sphere cultures (a.k.a. spheroids and organoids) has emerged as a more appropriate model of the brain microenvironment as compared with dissociated monolayer culture methods (Sloan et al., 2017; Di Lullo and Kriegstein, 2017; Amin and Paşca, 2018; Benito-Kwiecinski and Lancaster, 2019; Garreta et al., 2021; Krencik et al., 2017b). Although human organoid-based disease models are being increasingly utilized, including for the investigation of neuroinflammation (Dang et al., 2020; Thomas et al., 2017; Ormel et al., 2018), there are significant caveats with current approaches for efficient experimentation. Specifically, the generation and characterization of mature multicellular sphere cultures through temporal differentiation of progenitor cells is extensively time consuming, can produce high cellular asynchrony, and may yield undesired non-neuroectodermal cells such as microglia (Bhaduri et al., 2020; Ormel et al., 2018; Matsui et al., 2020). Furthermore, current approaches lack effective means to manipulate and stimulate cellular activity of these neural networks, including glial cells, to model brain activity in healthy and diseased states. Altogether, the current neural organoid state of the art has room for improvement towards cellular biology research and translational applications including disease modeling and testing of experimental medicine.
Astrocytes comprise a major glial cell type within the human central nervous system, and they dynamically react during various conditions (including aging, neurodegeneration, and viral infection) in a context-dependent manner (Escartin et al., 2021; Verkhratsky et al., 2019; Yu et al., 2020a; Sofroniew, 2020). Human astrocytes exhibit genetic signatures and functional attributes distinct from their rodent counterparts (Oberheim Bush and Nedergaard, 2017; Kelley et al., 2018; Li et al., 2021; Krencik et al., 2017a); still, given a lack of experimental models to investigate astrocytes within established human neuronal networks, the reactivity of mature human astrocytes in response to specific stimuli remains obscure. Furthermore, the distinction between the inflammatory reactivity of astrocytes compared with that of microglia and their drug responsiveness is confounding as these glial cell types exhibit a subset of overlapping phenotypes (Vainchtein and Molofsky, 2020; Han et al., 2021). Development of well-defined human neural organoids containing mature astrocytes may provide an effective tool to investigate the dynamics of astrocyte reactivity and the downstream consequence upon neuronal activity.
One primary experimental approach designed to define human astrocyte reactivity in vitro consists of proinflammatory protein treatment to monocultures, followed by coculture with neurons (Table S1); however, the consequence of selective stimulation of astrocytes within established human neural networks is yet to be detailed. It is known that the presence of neurons and neuron-derived intercellular signaling molecules activates intracellular pathways of astrocytes and elicits functional changes (Sardar et al., 2021; Hasel et al., 2017). An emerging technology for cell-specific activation to mimic neurotransmitter signaling from neurons or drug responsiveness within multicellular models is chemogenetic-mediated G protein–coupled receptor (GPCR) signaling pathway stimulation (Hirbec et al., 2020; Yu et al., 2020b). Previous rodent studies have revealed that chemogenetic activation of Gi-GPCR leads to hyperactivation of neurons through thrombospondin 1 signaling, and there is overlapping responsiveness to Gq signaling (Nagai et al., 2019; Yu et al., 2020b; Nagai et al., 2021). Thus, here we sought to use a similar chemogenetic approach to dissect the reactivity of human astrocytes and to determine the consequence upon cocultured neurons by incorporating bioengineering techniques into neural organoids.
To enable these studies, we optimized and defined several advancements to multicellular organoid culture systems to yield an experimental platform via integration of transdifferentiation techniques (e.g., all-inducible) and cell type–specific genetically encoded tools. This approach revealed that Gq-GPCR activation via chemogenetic stimulation in human astrocytes elicits a complex reactivity that includes potential beneficial consequences such as thrombospondin 1 secretion yet also induces an NF-κB–mediated inflammatory response and a glial scar-like state, which subsequently correlates with reduced neuronal activity but without apparent neurotoxicity. These results indicate that caution is needed during astrocyte modulation paradigms to tune beneficial versus detrimental effects as desired. Broadly, this all-inducible approach delivers a foundation for further advancements such as identifying astrocyte-secreted neurotropic or neurotoxic substances, incorporation of immune cell types, and scalable manufacturing for high-throughput testing of modulatory drugs as an alternative to less-defined, non-bioengineered organoid approaches.
Results
Characterization of rapidly produced chemogenetic astrocytes from human pluripotent stem cells
First, we aimed to rapidly and efficiently generate human astrocytes from hPSCs with chemogenetic capabilities. We developed a protocol (related to previous approaches; Table S2) to transdifferentiate functional astrocytes (i.e., iAstros) from hPSCs as a faster and improved alternative to our previous method of generating temporally differentiated immature astrocytes (Krencik et al., 2011; Krencik and Zhang, 2011). We conducted combinatorial insertion of doxycycline (dox)-inducible gliogenic transcription factors SRY-box transcription factor 9 (Sox9) and nuclear factor 1 A (NFIA) into the citramalyl-CoA lyase (CLYBL) safe-harbor locus with transcription activator-like effector nuclease (TALEN)–based genetic engineering (Cerbini et al., 2015). To induce transdifferentiation of the resultant line, small molecules were added in neural-supportive media for 2 d to promote neuralization in the presence of dox (Fig. 1, A and B), although this step was determined to not be necessary. After 2 and 4 d of dox treatment, we confirmed upregulation of Sox9 and NFIA proteins via Western immunoblotting and immunocytochemistry (ICC), respectively, compared to neural progenitor cells (NPCs) without dox treatment (Fig. S1, A and B). Moreover, in as few as 8 d, we detected low levels of filamentous glial fibrillary acidic protein (GFAP) via ICC and discovered a relatively high expression of known astrocyte-restricted markers via quantitative PCR (qPCR) in iAstros (Fig. S1, C and D). Importantly, by postinduction day 12, RNA sequencing (RNAseq) validated that day-12 iAstros exhibited significantly higher levels (Padj ≤ 0.05) of numerous known mature-astrocyte markers (previously identified at day 210 in hPSC-derived astrocytes [Krencik et al., 2015]) compared to NPCs (Figs. 1 C and S1, E and F; and Data S1), such as the human astrocyte-specific marker PMP2 (Kelley et al., 2018).

Genetic engineering enables rapid production of inducible human astrocytes. (A) TALEN targeting of inducible Sox9 and NFIA to generate inducible iAstro line. (B) Differentiation timeline of inducible astrocytes (iAstros, red) and neural progenitor cells (NPCs, blue) from hPSCs. S/D/X, SB431542/DMH-1/XAV939. (C) RNAseq selection criteria of Padj ≤ 0.05 from 15,150 total genes with FPKM > 1 yielded 1,766 DEGs (left). A subset of mature astrocyte-related transcripts upregulated (red) in day-12 iAstros compared with NPCs (n = 3 each) is highlighted in a volcano plot inset (right) of log2FoldChange versus −log10(Padj). (D) iAstro ICC in the presence of dox versus control NPCs (left). Day-12 iAstros exhibited mature astrocyte markers, including S100 and filamentous GFAP (n = 5 images each; top right). Expression of GFAP continued past 7 wk of culture (bottom right). (E) Semiquantitative proteomic analysis identified a total of 2,556 proteins from iAstros and NPCs (left). A subset of astrocyte-related proteins secreted from day-12 iAstros (restricted to those differentially upregulated in RNAseq) is shown as log10(iFOT × 105) (top) and log2FoldChange (bottom) compared with those from NPCs (n = 3 each). (F) Representative calcium traces (presented as a fraction of peak intensity; top) and average frequency of oscillations (bottom) of NPCs and iAstros (n = 16–49 cells or ROIs from 4 to 5 videos per group). 100 µM ATP was added to maximally simulate and synchronize cellular calcium levels (see Video 1). (G) Intracellular calcium levels in iAstros and hM3Dq-positive chemogenetic Astrostim cells in response to 10 µM CNO treatment (see Video 2). Data are presented as ratios of fluorescence intensity (F) to baseline intensity (n = 10 cells or ROIs from each of four videos per group; bold lines and bar plots indicate averages). All scale bars: 100 µm. Results are shown as mean ± SEM. For E, significance was determined using a two-tailed unpaired t test, with *, P ≤ 0.05; ***, P ≤ 0.001; ****, P ≤ 0.0001 (see asterisks overlaid on heatmap). Source data are available for this figure: SourceData F1.
Genetic engineering enables rapid production of inducible human astrocytes. (A) TALEN targeting of inducible Sox9 and NFIA to generate inducible iAstro line. (B) Differentiation timeline of inducible astrocytes (iAstros, red) and neural progenitor cells (NPCs, blue) from hPSCs. S/D/X, SB431542/DMH-1/XAV939. (C) RNAseq selection criteria of Padj ≤ 0.05 from 15,150 total genes with FPKM > 1 yielded 1,766 DEGs (left). A subset of mature astrocyte-related transcripts upregulated (red) in day-12 iAstros compared with NPCs (n = 3 each) is highlighted in a volcano plot inset (right) of log2FoldChange versus −log10(Padj). (D) iAstro ICC in the presence of dox versus control NPCs (left). Day-12 iAstros exhibited mature astrocyte markers, including S100 and filamentous GFAP (n = 5 images each; top right). Expression of GFAP continued past 7 wk of culture (bottom right). (E) Semiquantitative proteomic analysis identified a total of 2,556 proteins from iAstros and NPCs (left). A subset of astrocyte-related proteins secreted from day-12 iAstros (restricted to those differentially upregulated in RNAseq) is shown as log10(iFOT × 105) (top) and log2FoldChange (bottom) compared with those from NPCs (n = 3 each). (F) Representative calcium traces (presented as a fraction of peak intensity; top) and average frequency of oscillations (bottom) of NPCs and iAstros (n = 16–49 cells or ROIs from 4 to 5 videos per group). 100 µM ATP was added to maximally simulate and synchronize cellular calcium levels (see Video 1). (G) Intracellular calcium levels in iAstros and hM3Dq-positive chemogenetic Astrostim cells in response to 10 µM CNO treatment (see Video 2). Data are presented as ratios of fluorescence intensity (F) to baseline intensity (n = 10 cells or ROIs from each of four videos per group; bold lines and bar plots indicate averages). All scale bars: 100 µm. Results are shown as mean ± SEM. For E, significance was determined using a two-tailed unpaired t test, with *, P ≤ 0.05; ***, P ≤ 0.001; ****, P ≤ 0.0001 (see asterisks overlaid on heatmap). Source data are available for this figure: SourceData F1.

Characterization of inducible astrocytes. (A) Control NPCs (−Dox) and iAstros (+Dox) 6 d after induction from transgenic hPSCs, with the mApple reporter, before cell line purification. Dox treatment induced cell migration and morphological changes. (B) Western immunoblotting confirmed upregulation of Sox9 and NFIA proteins after 2 d of initial transgene induction (dox treatment) compared with the control (left). ICC confirmed expression of Sox9 and NFIA proteins after 4 d (right) in a mixed population. (C) GFAP was evident after 8 d in the presence of, but not without, dox treatment. Expression increased with 2-d treatment of ciliary neurotrophic factor (CNTF), known to stimulate astrocyte GFAP production. (D) Confirmation of transgene induction and astrocyte-restricted gene expression by qPCR in day-8 iAstros, normalized to NPCs and compared to temporally derived human astrocytes (hAstros; n = 1 each). (E) Subset of upregulated mature astrocyte-related transcripts are shown in heatmaps as log2(FPKM+1) (top) and log2FoldChange (bottom) of day-12 iAstros compared to NPCs (n = 3 each). (F) Subset of astrocyte-related transcripts plotted as log2(FPKM+1) for iAstros and NPCs (n = 3 each). (G) Mature iAstros exhibited astrocyte markers including S100 (top) and filamentous GFAP (bottom). Images are replicated from Fig. 1 D with increased magnification of astrocyte morphology. (H) Ki67 expression indicated decreased proliferation with maturation of day-12 iAstros, compared with highly proliferative NPCs (n = 6 images each). (I) GFAP and S100 continued to be highly expressed in day-50+ iAstro spheres. (J) Representative still frames of ATP-induced calcium oscillation in iAstros and NPCs (see Fig. 1 F). (K) Targeting scheme used to generate hM3Dq-expressing iAstros (Astrostim). (L) Confirmation of transgene induction and astrocyte-restricted gene expression by qPCR in Astrostim cells after 2 d of dox treatment, normalized to day-2 no-dox controls (left) and after 15 and 30 d of dox treatment, normalized to day 15 no-dox controls (right; n = 3 each). (M) Live images of Astrostim cells with (bottom) and without (top) CNO treatment, after 1 d (left), 2 d (middle), and 4 d (right). (N) Ki67 expression indicated decreased proliferation with Astrostim cell maturation over a period of 4 wk (n = 8–9 images each). (O) Chronic CNO stimulation up to 14 d did not significantly alter the number of metabolically active Astrostim cells in monolayer culture compared to 2-h CNO treatment, as measured by monolayer viability assay (n = 3 each). Scale bars:I, 20 µm;A right, 500 µm; all others, 100 µm. Results are shown as mean ± SEM where appropriate. For E and F, significance was determined using the DESeq2 R package (see asterisks overlaid on heatmap). For L, significance was determined using a one-way ANOVA followed by Tukey’s multiple comparison test, with **, P ≤ 0.01; ***, P ≤ 0.001; ****, P ≤ 0.0001.

Characterization of inducible astrocytes. (A) Control NPCs (−Dox) and iAstros (+Dox) 6 d after induction from transgenic hPSCs, with the mApple reporter, before cell line purification. Dox treatment induced cell migration and morphological changes. (B) Western immunoblotting confirmed upregulation of Sox9 and NFIA proteins after 2 d of initial transgene induction (dox treatment) compared with the control (left). ICC confirmed expression of Sox9 and NFIA proteins after 4 d (right) in a mixed population. (C) GFAP was evident after 8 d in the presence of, but not without, dox treatment. Expression increased with 2-d treatment of ciliary neurotrophic factor (CNTF), known to stimulate astrocyte GFAP production. (D) Confirmation of transgene induction and astrocyte-restricted gene expression by qPCR in day-8 iAstros, normalized to NPCs and compared to temporally derived human astrocytes (hAstros; n = 1 each). (E) Subset of upregulated mature astrocyte-related transcripts are shown in heatmaps as log2(FPKM+1) (top) and log2FoldChange (bottom) of day-12 iAstros compared to NPCs (n = 3 each). (F) Subset of astrocyte-related transcripts plotted as log2(FPKM+1) for iAstros and NPCs (n = 3 each). (G) Mature iAstros exhibited astrocyte markers including S100 (top) and filamentous GFAP (bottom). Images are replicated from Fig. 1 D with increased magnification of astrocyte morphology. (H) Ki67 expression indicated decreased proliferation with maturation of day-12 iAstros, compared with highly proliferative NPCs (n = 6 images each). (I) GFAP and S100 continued to be highly expressed in day-50+ iAstro spheres. (J) Representative still frames of ATP-induced calcium oscillation in iAstros and NPCs (see Fig. 1 F). (K) Targeting scheme used to generate hM3Dq-expressing iAstros (Astrostim). (L) Confirmation of transgene induction and astrocyte-restricted gene expression by qPCR in Astrostim cells after 2 d of dox treatment, normalized to day-2 no-dox controls (left) and after 15 and 30 d of dox treatment, normalized to day 15 no-dox controls (right; n = 3 each). (M) Live images of Astrostim cells with (bottom) and without (top) CNO treatment, after 1 d (left), 2 d (middle), and 4 d (right). (N) Ki67 expression indicated decreased proliferation with Astrostim cell maturation over a period of 4 wk (n = 8–9 images each). (O) Chronic CNO stimulation up to 14 d did not significantly alter the number of metabolically active Astrostim cells in monolayer culture compared to 2-h CNO treatment, as measured by monolayer viability assay (n = 3 each). Scale bars:I, 20 µm;A right, 500 µm; all others, 100 µm. Results are shown as mean ± SEM where appropriate. For E and F, significance was determined using the DESeq2 R package (see asterisks overlaid on heatmap). For L, significance was determined using a one-way ANOVA followed by Tukey’s multiple comparison test, with **, P ≤ 0.01; ***, P ≤ 0.001; ****, P ≤ 0.0001.
After 12 d, we used ICC to confirm a near-homogenous population of iAstros exhibiting filamentous GFAP (98.9 ± 0.6%) and S100 (96.3 ± 0.9%), with the majority expressing membrane-localized CD44; none of these markers were observed in NPCs (Figs. 1 D and S1 G). At increasing time points, we observed a substantial reduction in Ki67, an indicator of cell growth potential (Fig. S1 H), and an obvious cessation of proliferation. Astrocyte protein markers and complex morphologies continued past day 50 (Figs. 1 D and S1 I), during which time iAstros could optionally be cultured as spheres. In concurrence with RNAseq, unbiased semiquantitative proteomic analysis of iAstro-conditioned media revealed a significantly increased abundance (P ≤ 0.05) of proteins characteristic of synaptogenic astrocytes, including SPARCL1 and THBS1 (Allen and Eroglu, 2017), among other proteins (Fig. 1 E and Data S2). As a confirmation of functional activity, iAstros displayed post-ATP intracellular calcium oscillations, a well-known phenomenon in astrocytes (Volterra et al., 2014) that was not detected in NPCs (Figs. 1 F, S1 J, and Video 1). In summary, these studies provide a baseline resource of iAstro characteristics in naive conditions and validate a simplified differentiation approach to produce synchronized human astrocytes without the addition of serum or other stimulants.
iAstro calcium response to ATP. Representative examples of intracellular calcium imaging of NPCs (left) and iAstros (right) in response to ATP treatment, visualized with Fluo4 dye. See Fig. 1 F. Frame rate: 25 frames per second (fps).
iAstro calcium response to ATP. Representative examples of intracellular calcium imaging of NPCs (left) and iAstros (right) in response to ATP treatment, visualized with Fluo4 dye. See Fig. 1 F. Frame rate: 25 frames per second (fps).
Finally, we devised a method of selectively initiating astrocyte reactivity so as to enable subsequent assessment of the downstream consequence on neurons within bioengineered organoids. Previously, we discovered that overactive intracellular MAPK signaling in patient-specific human astrocytes (expressing a disease-associated mutant form of HRas proto-oncogene, GTPase) dysregulated extracellular signaling (Krencik et al., 2015). In the current study, we alternatively examined what type of response could be elicited by over-activating iAstros using a genetically encoded chemogenetic tool to enable on-demand, cell-intrinsic manipulation. To this end, hM3Dq was co-engineered into the same CLYBL locus as Sox9 and NFIA, on opposite strands, to produce chemogenetic iAstros (i.e., Astrostim cells; Fig. S1, K–N). Next, we conducted intracellular calcium imaging to verify activation as it is an expected downstream consequence of Gq pathway activation (Kofuji and Araque, 2021). At day 12 of dox-induced differentiation, acute application of the hM3Dq receptor ligand clozapine-N-oxide (CNO) elicited an obvious and robust upregulation of intracellular calcium in Astrostim cells (3.1-fold average increase from baseline levels) as compared with CNO-treated, hM3Dq-negative iAstros (Fig. 1 G and Video 2). Furthermore, we determined that chronic CNO treatment of 2 h and up to 14 d did not significantly impact cellular metabolism (Fig. S1 O), suggesting that chronic chemogenetic-based reactivity does not induce cell-autonomous toxicity.
Astrostim cell calcium response to CNO. Representative examples of intracellular calcium imaging of day-12 iAstros (left) and Astrostim cells (right) at baseline and in response to media-only and CNO treatments, visualized with Fluo4 dye. See Fig. 1 G. Frame rate: 40 fps.
Astrostim cell calcium response to CNO. Representative examples of intracellular calcium imaging of day-12 iAstros (left) and Astrostim cells (right) at baseline and in response to media-only and CNO treatments, visualized with Fluo4 dye. See Fig. 1 G. Frame rate: 40 fps.
High-throughput production and assessment of neural organoids using genetically encoded tools
Second, we aimed to develop a system to monitor neuronal activity within bioengineered organoids as a readout in the presence of reactive astrocytes. We devised two distinct genetic encoding methods. We initially sought to identify whether chemogenetic activation of human astrocytes caused major alterations in neuronal health or activity (such as leading to neurotoxicity [Liddelow et al., 2017] or hyperexcitability [Nagai et al., 2019]) using excitatory neurons directly induced from hPSCs (i.e., iNeurons) following our previously detailed protocol (Cvetkovic et al., 2018; Krencik et al., 2017b). Briefly, hPSCs containing an inducible neurogenin 2 (NEUROG2, also known as NGN2) transgene were directly differentiated with the addition of dox in a basal, neural-supportive medium (NM). To enable interrogation of neuronal activity in response to astrocyte stimulation, we utilized an iNeuron line with a genetically encoded calcium indicator (GCaMP6). Next, we generated cocultures of GCaMP6-expressing iNeurons in the presence of 10% day-30 Astrostim cells and examined the cocultures with live calcium imaging (Fig. 2 A). After an initial 9 d of coculture (Fig. 2 B) or monoculture (Fig. S2 A), cells were chronically treated with CNO and assessed 12–14 d later. Under all conditions, neurons that exhibited spontaneous oscillations of calcium activity during imaging were observed, although with high variability between both individual cells and replicates, providing evidence that this paradigm does not induce overt toxicity or hyperactivity. However, since the use of calcium imaging of single cells can be labor intensive and is unable to measure high frequency neuronal activity, we next sought to devise and optimize an alternative approach.

Validation of neuronal sphere cultures as a readout for health and activity. (A) iNeurons expressing a genetically encoded calcium indicator (GCaMP6) were cocultured with Astrostim (10:1) for 9 d. After subsequent chronic CNO treatment (12–14 d), calcium imaging was performed to measure spontaneous oscillations. Scale bar: 50 µm; inset: 10 µm. (B) Representative calcium trace of a control (non–CNO treated) coculture (top), presented as a ratio of fluorescence intensity (F) to maximum intensity. Average frequency of intracellular calcium oscillations (bottom) of control and CNO-treated cocultures (n = 2–4 cells or ROIs from three to five videos or cocultures per group). (C) Timeline of differentiation of OptoNeurons from hPSCs (top). Large-scale formation of OptoNeuron sphere cultures (with YFP-fused ChR2) was achieved using microwell plates (bottom). Dissociated cells compacted over time to form spheres. Scale bars: 200 µm. (D) Neural spheres formed with microwell (µ-well) plates allowed for customizable cellular density and demonstrated more consistent shape (circularity, with a value of 1 representing a circle; left) and size (right) compared with cultures which were allowed to self-aggregate (n = 6–33 spheres each). (E) RNAseq of day-14 OptoNeuron sphere cultures confirmed significant upregulation of neuronal-restricted genes compared to day-12 iAstros (n = 3; for Padj ≤ 0.05, FPKM > 1); see Data S3. (F) OptoNeuron spheres were attached to microelectrode arrays (MEAs) for live electrophysiological recordings. Shown are two merged spheres on an MEA (left). OptoNeurons on MEAs elicited voltage spikes after acutely induced blue light optical stimulation (5 ms pulse width) at increasing frequencies (right; see Fig. S3). Scale bar: 200 µm. (G) Viability (n = 7; measured by a CellTiter-Glo 3D Assay and normalized to sphere area; left) and spontaneous (middle) and blue light–evoked (right) activity of day-21 OptoNeuron spheres (n = 7–41 electrodes each, after threshold) under different media conditions, including neural media NM or BP, with or without ascorbic acid and BDNF/GDNF growth factors (GF). Results are shown as mean ± SEM. In D and G, dots represent individual spheres or electrodes. For G, significance was determined using a one-way ANOVA followed by Tukey’s multiple comparison test, with *, P ≤ 0.05; **, P ≤ 0.01; ****, P ≤ 0.0001.
Validation of neuronal sphere cultures as a readout for health and activity. (A) iNeurons expressing a genetically encoded calcium indicator (GCaMP6) were cocultured with Astrostim (10:1) for 9 d. After subsequent chronic CNO treatment (12–14 d), calcium imaging was performed to measure spontaneous oscillations. Scale bar: 50 µm; inset: 10 µm. (B) Representative calcium trace of a control (non–CNO treated) coculture (top), presented as a ratio of fluorescence intensity (F) to maximum intensity. Average frequency of intracellular calcium oscillations (bottom) of control and CNO-treated cocultures (n = 2–4 cells or ROIs from three to five videos or cocultures per group). (C) Timeline of differentiation of OptoNeurons from hPSCs (top). Large-scale formation of OptoNeuron sphere cultures (with YFP-fused ChR2) was achieved using microwell plates (bottom). Dissociated cells compacted over time to form spheres. Scale bars: 200 µm. (D) Neural spheres formed with microwell (µ-well) plates allowed for customizable cellular density and demonstrated more consistent shape (circularity, with a value of 1 representing a circle; left) and size (right) compared with cultures which were allowed to self-aggregate (n = 6–33 spheres each). (E) RNAseq of day-14 OptoNeuron sphere cultures confirmed significant upregulation of neuronal-restricted genes compared to day-12 iAstros (n = 3; for Padj ≤ 0.05, FPKM > 1); see Data S3. (F) OptoNeuron spheres were attached to microelectrode arrays (MEAs) for live electrophysiological recordings. Shown are two merged spheres on an MEA (left). OptoNeurons on MEAs elicited voltage spikes after acutely induced blue light optical stimulation (5 ms pulse width) at increasing frequencies (right; see Fig. S3). Scale bar: 200 µm. (G) Viability (n = 7; measured by a CellTiter-Glo 3D Assay and normalized to sphere area; left) and spontaneous (middle) and blue light–evoked (right) activity of day-21 OptoNeuron spheres (n = 7–41 electrodes each, after threshold) under different media conditions, including neural media NM or BP, with or without ascorbic acid and BDNF/GDNF growth factors (GF). Results are shown as mean ± SEM. In D and G, dots represent individual spheres or electrodes. For G, significance was determined using a one-way ANOVA followed by Tukey’s multiple comparison test, with *, P ≤ 0.05; **, P ≤ 0.01; ****, P ≤ 0.0001.
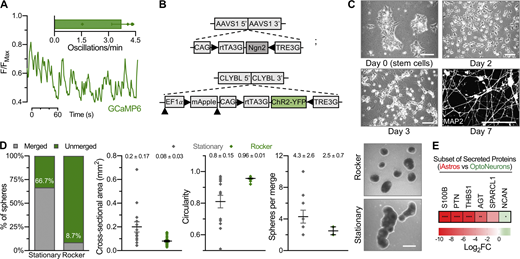
Genetically encoded tools in human neurons. (A) Live calcium imaging of iNeurons expressing a genetically encoded calcium indicator (GCaMP6). Spontaneous calcium oscillations were measured as a function of time in day-19–21 GCaMP6-only monocultures (n = 2–5 cells or ROIs from five monocultures or videos). (B) OptoNeuron (iNeuron) targeting scheme. (C) Differentiation of OptoNeurons from hPSCs to a pure population expressing MAP2 on day 7. Scale bars: top left, 500 µm; all others, 100 µm. (D) Spheres that were cultured under continuous gentle rocking conditions generally remained as single, unmerged spheres compared to those cultured under stationary conditions after 24 h (left); moreover, spheres displayed smaller cross-sectional areas and greater circularity (middle) under rocking conditions. Those spheres that did merge under rocking conditions had fewer spheres per merged aggregate than those cultured under stationary conditions (right; n = 15–23 spheres per group). Dots represent individual electrodes, with mean ± SEM values shown above dot plots. Scale: 500 µm. (E) In comparison with media conditioned by day-9 OptoNeuron sphere cultures, day-12 iAstro–conditioned media contained significantly increased abundance of synaptogenic proteins, as confirmed by unbiased semiquantitative proteomic analysis. Only astrocyte-related proteins from Fig. 1 E were considered for this statistical comparison; see Data S2. Heatmap represents average of log2FoldChange (n = 3 each), with *, P ≤ 0.05; **, P ≤ 0.01; ****, P ≤ 0.0001 (see asterisks overlaid on heatmap).

Genetically encoded tools in human neurons. (A) Live calcium imaging of iNeurons expressing a genetically encoded calcium indicator (GCaMP6). Spontaneous calcium oscillations were measured as a function of time in day-19–21 GCaMP6-only monocultures (n = 2–5 cells or ROIs from five monocultures or videos). (B) OptoNeuron (iNeuron) targeting scheme. (C) Differentiation of OptoNeurons from hPSCs to a pure population expressing MAP2 on day 7. Scale bars: top left, 500 µm; all others, 100 µm. (D) Spheres that were cultured under continuous gentle rocking conditions generally remained as single, unmerged spheres compared to those cultured under stationary conditions after 24 h (left); moreover, spheres displayed smaller cross-sectional areas and greater circularity (middle) under rocking conditions. Those spheres that did merge under rocking conditions had fewer spheres per merged aggregate than those cultured under stationary conditions (right; n = 15–23 spheres per group). Dots represent individual electrodes, with mean ± SEM values shown above dot plots. Scale: 500 µm. (E) In comparison with media conditioned by day-9 OptoNeuron sphere cultures, day-12 iAstro–conditioned media contained significantly increased abundance of synaptogenic proteins, as confirmed by unbiased semiquantitative proteomic analysis. Only astrocyte-related proteins from Fig. 1 E were considered for this statistical comparison; see Data S2. Heatmap represents average of log2FoldChange (n = 3 each), with *, P ≤ 0.05; **, P ≤ 0.01; ****, P ≤ 0.0001 (see asterisks overlaid on heatmap).
To enable and accelerate the ability to measure high-frequency neural activity within bioengineered organoids, we incorporated an optogenetic tool into the CLYBL locus of iNeurons by TALEN-mediated insertion of inducible Channelrhodopsin2 (ChR2) tagged with YFP (i.e., OptoNeurons; Figs. 2 C and S2, B and C). Homogeneous OptoNeuron spheres were produced in microwell plates after differentiation (Fig. 2 C) with more consistent shape and size compared with highly variable and nonuniform self-aggregated cultures. For example, microwell-produced OptoNeuron spheres consisting of 4,000 or 10,000 cells exhibited average circularity measurements of 0.95 ± 0.01 each, compared with 0.57 ± 0.1 for self-aggregated cultures, after 7 d. Similarly, after a week, self-aggregated cultures reached an average diameter of 1.3 ± 0.3 mm, surpassing the limit of oxygen diffusion (Rouwkema et al., 2009; compared with 0.29 ± 0.02 and 0.38 ± 0.02 mm diameters for microwell-derived spheres containing 4,000 or 10,000 cells each, respectively; Fig. 2 D). Maintenance under continuous gentle rocking conditions ensured that spheres maintained a homogeneous shape and prevented sphere fusion (Fig. S2 D).
Next, we produced a transcriptomic and secretomic resource to define cell type–specific differences between induced astrocytes and neurons. Specifically, RNAseq of OptoNeuron spheres confirmed significant upregulation (Padj ≤ 0.05) of neuronal-restricted transcripts including NEUROD2, glutamate receptors GRIA4, GRIK5, and GRM7, and synapse-related factors SYN1, SYNP4, SYP, and SYT13, as compared with iAstros (Fig. 2 E and Data S3). As confirmed by unbiased semiquantitative proteomic analysis, iAstro-conditioned media contained significantly increased abundance (P ≤ 0.05) of many intercellular signaling and synaptogenic proteins in comparison with OptoNeuron-conditioned media from sphere cultures (Fig. S2 E and Data S2). We also cross-referenced this cell subtype–restricted transcriptomic signature to consensus high-fidelity transcriptional cell subtype signature of 50 genes that were previously identified across multiple databases from human brain tissue (Kelley et al., 2018). We found that 41/50 of the previously identified human astrocyte signature genes were significantly increased (adjusted P [Padj] < 0.01) in iAstros compared to iNeurons (Data S3), confirming a similar identity to cells within the native brain. This included biomarkers with known function such as channels and transporters (GJA1, ATP1A2, AQP4, and SLC1A3). Interestingly, one signature transcript that was not significantly different, SLC1A2 (which encodes the glutamate transporter 1 protein, GLT-1), was not restricted in iAstros potentially due to moderate expression in neurons. This correlates with our previous findings that the SLC1A2 transcript and/or protein is highly increased in hPSC-derived astrocytes (Krencik et al., 2017b) and mouse embryonic stem cell–derived astrocytes (Sardar et al., 2021) when cocultured in the presence of iNeurons, which brings to light the importance of the external environmental signals in modeling bona fide functional astrocytes. Altogether, these resources provide valuable insight into the major distinctions between cell subtypes and further validate the transdifferentiation approach.
Finally, we utilized monoculture spheres to test the hypothesis that OptoNeurons are sensitive to specific external factors, including those known to be produced by astrocytes. We first tested light-evoked neural activity by plating OptoNeuron spheres onto multielectrode arrays (MEAs; Figs. 2 F and S3 A). OptoNeurons, but not iNeurons lacking the ChR2 transgene (Fig. S3 B), responded consistently and robustly to light-gated ion-channel activation from a 470-nm light-emitting diode (LED) over a range of stimulus frequencies (Figs. 2 F and S3, C and D), confirming a reliable light-induced response. We then tested the effect of supplementing brain-derived and glial cell line-derived neurotrophic factors (BDNF and GDNF, respectively) and an antioxidant (ascorbic acid) to the basal neural medium (i.e., NM+GF). As expected, the addition of these commonly used neural culture supplements promoted long-term adhesion to substrates and increased metabolic activity of day-21 OptoNeuron spheres. Furthermore, we determined that culturing neurons in BrainPhys (BP), an optimized medium that supports neuronal in vitro activity (Bardy et al., 2015), also enhanced OptoNeuron sphere adhesion and metabolic activity compared to NM (Figs. 2 G and S3, E and F). The addition of growth factors and ascorbic acid to BP (i.e., BP+GF) further increased these effects while also significantly increasing (P ≤ 0.05) both the spontaneous and light-evoked firing rate of OptoNeurons on MEAs (Figs. 2 G and S3, E and F). Specifically, targeting neuroprotection via Trk receptor activation with BDNF and NT3 treatment in NM media replicated this trend by significantly increasing (P ≤ 0.05) sphere viability compared with the non-treated control (Fig. S3 G), suggesting that the neuronal health status is critical for OptoNeuron activity at this time point.

Optogenetic stimulation and recording of human neurons. (A) A 30 mm distance (d) from the MEA electrodes provided an optimal power density of ∼0.29 mW/mm2 from a 470 nm LED, while limiting noise on the MEA measurement system. (B) Non-optogenetic iNeurons (i.e., GCaMP6) did not respond to blue light stimulation (denoted as +) on MEAs (n = 18–24 electrodes each). (C) Raster plots of OptoNeuron monocultures in response to increasing optical stimulation frequency (1–40 Hz) at pulse widths varying from 1 to 5 ms. Below 3 ms, there was minimal detectable pacing of cells in response to light. A 5 ms pulse width was deemed optimal for subsequent experiments. Each horizontal row represents one electrode (pre-threshold; n = 20 electrodes per group). (D) As there was no detectable correlation between spontaneous and stimulated (1–40 Hz) firing rates, we determined a minimum threshold cutoff of 0.1 Hz for both spontaneous and stimulated firing rates. This threshold was applied across monoculture and coculture groups. Dotted lines indicate linear regression fits (top). Inset boxes (bottom) show detail from x = [0,0.3]Hz and y = [0,0.8]Hz. (E and F) Spontaneous versus light-induced firing rates (n = 7–41 electrodes each, after threshold) of day-21 OptoNeuron spheres on MEAs (E) and temporal attachment to Matrigel (F; n = 8–9 spheres each time point) under different media conditions (see Fig. 2 G). (G) Viability (n = 5–10; measured by a CellTiter-Glo 3D Assay and normalized to sphere area) of day-12 and day-18 spheres in NM+Dox, in the absence or presence of chronic BDNF and NT3 treatment. Results are shown as mean ± SEM. In B, D and E, dots represent individual spheres or electrodes. For B, E, and G, significance was determined using two-tailed paired t tests, with *, P ≤ 0.05; **, P ≤ 0.01; ***, P ≤ 0.001; ****, P ≤ 0.0001.

Optogenetic stimulation and recording of human neurons. (A) A 30 mm distance (d) from the MEA electrodes provided an optimal power density of ∼0.29 mW/mm2 from a 470 nm LED, while limiting noise on the MEA measurement system. (B) Non-optogenetic iNeurons (i.e., GCaMP6) did not respond to blue light stimulation (denoted as +) on MEAs (n = 18–24 electrodes each). (C) Raster plots of OptoNeuron monocultures in response to increasing optical stimulation frequency (1–40 Hz) at pulse widths varying from 1 to 5 ms. Below 3 ms, there was minimal detectable pacing of cells in response to light. A 5 ms pulse width was deemed optimal for subsequent experiments. Each horizontal row represents one electrode (pre-threshold; n = 20 electrodes per group). (D) As there was no detectable correlation between spontaneous and stimulated (1–40 Hz) firing rates, we determined a minimum threshold cutoff of 0.1 Hz for both spontaneous and stimulated firing rates. This threshold was applied across monoculture and coculture groups. Dotted lines indicate linear regression fits (top). Inset boxes (bottom) show detail from x = [0,0.3]Hz and y = [0,0.8]Hz. (E and F) Spontaneous versus light-induced firing rates (n = 7–41 electrodes each, after threshold) of day-21 OptoNeuron spheres on MEAs (E) and temporal attachment to Matrigel (F; n = 8–9 spheres each time point) under different media conditions (see Fig. 2 G). (G) Viability (n = 5–10; measured by a CellTiter-Glo 3D Assay and normalized to sphere area) of day-12 and day-18 spheres in NM+Dox, in the absence or presence of chronic BDNF and NT3 treatment. Results are shown as mean ± SEM. In B, D and E, dots represent individual spheres or electrodes. For B, E, and G, significance was determined using two-tailed paired t tests, with *, P ≤ 0.05; **, P ≤ 0.01; ***, P ≤ 0.001; ****, P ≤ 0.0001.
Validation of an all-inducible, multicellular organoid approach with cell-specific activation
Third, we aimed to verify an approach to rapidly produce all-inducible bioengineered organoids with on-demand options to modulate cellular activity by combining dissociated day-2 OptoNeurons with day-12 iAstros, yielding uniform spheres (Fig. 3A). Within 1 d of coculture, iAstros exhibited short primary branches extending into the tissue. These cocultures displayed cell-restricted markers including astrocyte-specific S100 and the neuronal presynaptic marker Synapsin1, as visualized by ICC (Figs. 3 B and S4 A, and Videos 3 and 4). By 21 d of coculture, iAstros had complex morphologies and elongated branching throughout the spheres, as well as a close association with presynaptic structures (Fig. S4, A and B and Video 5), similar as previously reported using noninducible human astrocytes within sphere cultures (Krencik et al., 2017b).

Cell-specific activation of astrocytes within all-inducible bioengineered organoids. (A) Differentiated iAstros or Astrostim cells were cocultured with OptoNeurons. (B) Neural spheres have genetically encoded capabilities for cell-selective optogenetic (neuronal) or chemogenetic (astrocyte-specific) activation. Cocultures exhibited cell-restricted markers including S100 (see Video 3). Scanning electron microscopy scale: 100 µm; inset: 10 µm. S100/ChR2/DAPI scale and inset: 200 µm. (C) Spheres containing day-22 OptoNeurons or cocultured with iAstros (1:1) exhibited significantly increased firing rates when exposed to 40 Hz blue light stimulation (denoted as +) on MEAs (n = 6–19 electrodes each, after threshold). OptoNeurons, Coculture, and iAstros data are shown left to right in the plots. (D) Astrostim-OptoNeuron coculture spheres (1:1,000), visualized with YFP-fused ChR2 and stained for S100, with (bottom) and without (top) 2-d CNO treatment. Shown are 1-µm slices (left) and maximum projections (133 µm, right). Scale: 50 µm. See Video 6. (E) Chronic CNO treatment of Astrostim cells for up to 18 d did not significantly affect viability of cocultured OptoNeurons (1:10) compared with controls, as measured by a CellTiter-Glo 3D Assay. Luminescence readings were normalized to sphere cross-sectional areas (n = 12–24 spheres each). (F) A significant increase in secreted THBS1 protein was observed in conditioned media from coculture spheres with 2-d CNO treatment compared with controls, as measured by ELISA (n = 3 each). (G) Spontaneous and light-induced response of OptoNeuron–Astrostim cocultures (10:1) on MEAs under basal conditions (NM). 11-d chronic treatment of cocultures resulted in significantly decreased activity compared with controls (n = 25–32 electrodes each, postthreshold). (H) Spontaneous and light-induced response of OptoNeuron–Astrostim cocultures (10:1) on MEAs under optimal conditions (BP+GF). Chronic 16-d CNO treatment did not significantly alter light-induced firing rates (n = 64–84 electrodes each, after threshold; left). Representative traces are shown (right). Results are shown as mean ± SEM. For F, significance was determined using a two-tailed unpaired t test. In C, E–H, dots represent individual electrodes or spheres. For C, G, and H, significance was determined using a two-tailed paired t test to compare spontaneous to light-induced firing rates within the same groups only. For G and H, significance was determined using a one-way ANOVA followed by a Šidák post hoc test for multiple comparisons between spontaneous or light-induced firing rates across groups, with *, P ≤ 0.05; **, P ≤ 0.01; ***, P ≤ 0.001; ****, P ≤ 0.0001.
Cell-specific activation of astrocytes within all-inducible bioengineered organoids. (A) Differentiated iAstros or Astrostim cells were cocultured with OptoNeurons. (B) Neural spheres have genetically encoded capabilities for cell-selective optogenetic (neuronal) or chemogenetic (astrocyte-specific) activation. Cocultures exhibited cell-restricted markers including S100 (see Video 3). Scanning electron microscopy scale: 100 µm; inset: 10 µm. S100/ChR2/DAPI scale and inset: 200 µm. (C) Spheres containing day-22 OptoNeurons or cocultured with iAstros (1:1) exhibited significantly increased firing rates when exposed to 40 Hz blue light stimulation (denoted as +) on MEAs (n = 6–19 electrodes each, after threshold). OptoNeurons, Coculture, and iAstros data are shown left to right in the plots. (D) Astrostim-OptoNeuron coculture spheres (1:1,000), visualized with YFP-fused ChR2 and stained for S100, with (bottom) and without (top) 2-d CNO treatment. Shown are 1-µm slices (left) and maximum projections (133 µm, right). Scale: 50 µm. See Video 6. (E) Chronic CNO treatment of Astrostim cells for up to 18 d did not significantly affect viability of cocultured OptoNeurons (1:10) compared with controls, as measured by a CellTiter-Glo 3D Assay. Luminescence readings were normalized to sphere cross-sectional areas (n = 12–24 spheres each). (F) A significant increase in secreted THBS1 protein was observed in conditioned media from coculture spheres with 2-d CNO treatment compared with controls, as measured by ELISA (n = 3 each). (G) Spontaneous and light-induced response of OptoNeuron–Astrostim cocultures (10:1) on MEAs under basal conditions (NM). 11-d chronic treatment of cocultures resulted in significantly decreased activity compared with controls (n = 25–32 electrodes each, postthreshold). (H) Spontaneous and light-induced response of OptoNeuron–Astrostim cocultures (10:1) on MEAs under optimal conditions (BP+GF). Chronic 16-d CNO treatment did not significantly alter light-induced firing rates (n = 64–84 electrodes each, after threshold; left). Representative traces are shown (right). Results are shown as mean ± SEM. For F, significance was determined using a two-tailed unpaired t test. In C, E–H, dots represent individual electrodes or spheres. For C, G, and H, significance was determined using a two-tailed paired t test to compare spontaneous to light-induced firing rates within the same groups only. For G and H, significance was determined using a one-way ANOVA followed by a Šidák post hoc test for multiple comparisons between spontaneous or light-induced firing rates across groups, with *, P ≤ 0.05; **, P ≤ 0.01; ***, P ≤ 0.001; ****, P ≤ 0.0001.

OptoNeuron–astrocyte coculture and dual modulation. (A) Representative confocal Z stack of a single GFAP-positive astrocyte within coculture spheres (ratio of 1:1,000 iAstros:OptoNeurons) after 1 d of coculture (i.e., sphere formation) revealed multiple primary branches immediately extending into the tissue. By day 21, iAstros were extensively elongated and branched. Scale: 100 µm. (B) Synaptophysin (SYP)-positive presynaptic puncta were observed in close proximity to astrocytes by day 21 of coculture. Scale: 50 µm. (C) Spheres containing day-22 OptoNeuron monocultures or OptoNeuron-iAstro cocultures (1:1) demonstrated significantly increased firing rates when exposed to 40 Hz blue light stimulation (+), as measured on MEAs on day 22 of neuronal differentiation with 0.1 Hz cutoff threshold (n = 6–19 electrodes each, after threshold). Shown are mean firing rates after threshold with 40 Hz optical stimulation (left), stimulated response as a percentage of the spontaneous firing rate (middle), and Log2FoldChange (stimulated/spontaneous firing rates; right). Firing rates results are also displayed in Fig. 3 C. OptoNeurons, coculture, and iAstros data are shown left to right in the plots. (D) Oxygen consumption rates (OCR) of iAstro monocultures and OptoNeuron–iAstro cocultures (1:1) at baseline, ATP-linked, maximal, and spare capacity respiration (after treatment with oligomycin, carbonyl cyanide-4 (trifluoromethoxy) phenylhydrazone (FCCP), and rotenone/antimycin A, respectively), as measured by Seahorse assay (n = 6 spheres each). (E) Control (top) and 6-d CNO–treated (bottom) spheres stained for Synapsin1. Scale: 50 µm. (F) Average ClCasp3 signal as a fraction of total nuclear signal (measured by DAPI) in control and 6-d CNO–treated coculture spheres (n = 7–10 images each). (G) THBS1 protein was significantly increased in astrocyte-conditioned media from monocultures of Astrostim cells stimulated with 2-d CNO treatment compared with controls, as measured by ELISA (n = 3 each). (H) Neither OptoNeurons in monoculture (left) nor cocultured with Astrostim cells (10:1; right) displayed a significant different in either spontaneous or light-induced firing rates with 2-h or 2-d CNO treatment, compared with controls (n = 8–24 electrodes each, after threshold). Results are shown as mean ± SEM. In C and H, dots represent individual spheres or electrodes. For H, significance was determined using a one-way ANOVA followed by Tukey’s multiple comparison test between spontaneous or light-induced firing rates across groups, with *, P ≤ 0.05.

OptoNeuron–astrocyte coculture and dual modulation. (A) Representative confocal Z stack of a single GFAP-positive astrocyte within coculture spheres (ratio of 1:1,000 iAstros:OptoNeurons) after 1 d of coculture (i.e., sphere formation) revealed multiple primary branches immediately extending into the tissue. By day 21, iAstros were extensively elongated and branched. Scale: 100 µm. (B) Synaptophysin (SYP)-positive presynaptic puncta were observed in close proximity to astrocytes by day 21 of coculture. Scale: 50 µm. (C) Spheres containing day-22 OptoNeuron monocultures or OptoNeuron-iAstro cocultures (1:1) demonstrated significantly increased firing rates when exposed to 40 Hz blue light stimulation (+), as measured on MEAs on day 22 of neuronal differentiation with 0.1 Hz cutoff threshold (n = 6–19 electrodes each, after threshold). Shown are mean firing rates after threshold with 40 Hz optical stimulation (left), stimulated response as a percentage of the spontaneous firing rate (middle), and Log2FoldChange (stimulated/spontaneous firing rates; right). Firing rates results are also displayed in Fig. 3 C. OptoNeurons, coculture, and iAstros data are shown left to right in the plots. (D) Oxygen consumption rates (OCR) of iAstro monocultures and OptoNeuron–iAstro cocultures (1:1) at baseline, ATP-linked, maximal, and spare capacity respiration (after treatment with oligomycin, carbonyl cyanide-4 (trifluoromethoxy) phenylhydrazone (FCCP), and rotenone/antimycin A, respectively), as measured by Seahorse assay (n = 6 spheres each). (E) Control (top) and 6-d CNO–treated (bottom) spheres stained for Synapsin1. Scale: 50 µm. (F) Average ClCasp3 signal as a fraction of total nuclear signal (measured by DAPI) in control and 6-d CNO–treated coculture spheres (n = 7–10 images each). (G) THBS1 protein was significantly increased in astrocyte-conditioned media from monocultures of Astrostim cells stimulated with 2-d CNO treatment compared with controls, as measured by ELISA (n = 3 each). (H) Neither OptoNeurons in monoculture (left) nor cocultured with Astrostim cells (10:1; right) displayed a significant different in either spontaneous or light-induced firing rates with 2-h or 2-d CNO treatment, compared with controls (n = 8–24 electrodes each, after threshold). Results are shown as mean ± SEM. In C and H, dots represent individual spheres or electrodes. For H, significance was determined using a one-way ANOVA followed by Tukey’s multiple comparison test between spontaneous or light-induced firing rates across groups, with *, P ≤ 0.05.
Complexity of iAstros in sphere cultures. 3D z-stack of day-20 iAstros expressing S100. iAstros were cocultured with iNeurons at a 1:1,000 ratio for 2 wk. Frame rate: 15 fps.
Complexity of iAstros in sphere cultures. 3D z-stack of day-20 iAstros expressing S100. iAstros were cocultured with iNeurons at a 1:1,000 ratio for 2 wk. Frame rate: 15 fps.
Synapsin1 in coculture spheres. Z-stack of Synapsin1 staining (color depth coded, as noted). iAstros were cocultured with OptoNeurons at a 1:10 ratio. Frame rate: 10 fps.
Synapsin1 in coculture spheres. Z-stack of Synapsin1 staining (color depth coded, as noted). iAstros were cocultured with OptoNeurons at a 1:10 ratio. Frame rate: 10 fps.
GFAP and Synaptophysin in coculture spheres. Z-stack of GFAP (red) and Synaptophysin (white) staining. iAstros were cocultured with OptoNeurons (1:1,000) for 21 d. See Fig. S4, A and B. Frame rate: 25.2 fps.
GFAP and Synaptophysin in coculture spheres. Z-stack of GFAP (red) and Synaptophysin (white) staining. iAstros were cocultured with OptoNeurons (1:1,000) for 21 d. See Fig. S4, A and B. Frame rate: 25.2 fps.
During light stimulation in basal NM media, we observed significantly increased (P ≤ 0.01) firing rates (>3,600 ± 480% increase in measured spikes over time with cocultured iAstros and >2,200 ± 600% increase without, compared to spontaneous activity; Figs. 3 C and S4 C). As expected, cocultures exhibited a reduction in average measured firing rates due to a 50% decrease in the number of total neurons. Finally, OptoNeuron–iAstro cocultures exhibited stable metabolic health as measured by oxygen consumption rates (Fig. S4 D).
To ascertain whether chemogenetic activation of astrocytes alters neuronal function, we next generated multicellular sphere cocultures of OptoNeurons and Astrostim cells for the capacity of dual, cell-specific modulation. These bioengineered organoids maintained an even dispersion of astrocytes over time (Fig. 3 D, and Videos 6 and 7) and Synapsin1 (Fig. S4 E), similar to non-treated controls. Chronic CNO treatment ranging from 6 to 18 d did not cause a significant neurotoxicity within cocultures, as measured by cleaved caspase-3 (ClCasp3) expression (Fig. S4 F) and a 3D viability assay (Fig. 3 E). Next, we utilized ELISA to test whether, similar to rodent chemogenetic studies (Yu et al., 2020b; Nagai et al., 2019), there was a change in levels of THBS1 (a well-studied astrocyte signaling molecule involved in synaptogenesis as well as inflammatory signaling [Gutierrez et al., 2011]). This revealed a significant increase (P ≤ 0.05) in secreted THBS1 protein with CNO treatment, both in conditioned media from Astrostim cell monocultures (from 9.7 ± 0.3 to 14.3 ± 1.2 ng/ml; Fig. S4 G) and from bioengineered organoids containing Astrostim cells and OptoNeurons (from 6.6 ± 1.3 to 12.3 ± 0.97 ng/ml; Fig. 3 F).
S100 in coculture spheres. Z-stack of Astrostim cells expressing S100. Astrostim cells were cocultured with OptoNeurons at a 1:500 ratio and treated with CNO for 2 d. See Fig. 3 D. Frame rate: 20 fps.
S100 in coculture spheres. Z-stack of Astrostim cells expressing S100. Astrostim cells were cocultured with OptoNeurons at a 1:500 ratio and treated with CNO for 2 d. See Fig. 3 D. Frame rate: 20 fps.
S100 and ChR2-YFP OptoNeurons in coculture spheres. 3D z-stack of Astrostim cells expressing S100. Astrostim cells were cocultured with OptoNeurons (ChR2-YFP) at a 1:500 ratio and treated with CNO for 2 d. See Fig. 3 D. Frame rate: 20 fps.
S100 and ChR2-YFP OptoNeurons in coculture spheres. 3D z-stack of Astrostim cells expressing S100. Astrostim cells were cocultured with OptoNeurons (ChR2-YFP) at a 1:500 ratio and treated with CNO for 2 d. See Fig. 3 D. Frame rate: 20 fps.
As measured by MEA recordings, both control and CNO-treated groups exhibited light-induced activation (with significantly increased mean firing rates compared to spontaneous activity), demonstrating viable neurons. Under basal conditions (NM), CNO-treated groups exhibited significantly decreased activity (P ≤ 0.01) compared to control cocultures (Fig. 3 G). However, after 3 wk of coculture with Astrostim cells under optimal conditions (BP+GF), OptoNeurons exhibited no significant difference in average light-induced firing rates with 16 d of chronic CNO treatment (Fig. 3 H). This result is similar to those reported in rodent studies (Diaz-Castro et al., 2021). Subsequently, neither OptoNeurons in monoculture nor those cocultured with Astrostim cells displayed a significant difference in either spontaneous or light-induced firing rates with acute 2-h or 2-d CNO treatment, compared with controls (Fig. S4 H). In conclusion, chemogenetic activation of astrocytes is detrimental to neural activity under minimal conditions, yet this deficit is not apparent under supportive environmental conditions.
Chemogenetic astrocyte activation elicits a dynamic inflammatory reaction
Fourth, we aimed to determine the potential underlying mechanisms through which astrocyte activation leads to decreased neuronal activity in sphere cocultures under minimal conditions by assessing reactivity at acute and relatively chronic time points. We performed RNAseq at day 14 (Data S4) and found that Astrostim cells responded to 2-h CNO treatment with significant transcript upregulation (Padj ≤ 0.05) of numerous immediate early genes (IEGs) and thrombospondin 1 (THBS1), among numerous other transcripts with potential intercellular signaling effects including connective tissue growth factor (CCN2, also known as CTGF) and leukemia inhibitory factor (Figs. 4 A and S5 A). Because astrogliosis is a dynamic and diverse cellular response, we also investigated the consequence of longer activation (2-d treatment; Fig. 4 B). Gene expression of Astrostim cells was compared against markers corresponding to previously published astrocyte phenotypes (Liddelow et al., 2017; Diaz-Castro et al., 2019), with identified genes further classified by an upregulation in iAstros compared with NPCs (i.e., “astrocyte-restricted”; Fig. S5 A). Subclassifications of reactive astrocytes—termed pan, A1 (neurotoxic), and A2 (neuroprotective; Zamanian et al., 2012)—have been proposed to define the reaction based on transcriptional signatures (and effects upon neurons). Here, over-activation of Astrostim cells resulted in upregulation of several markers associated with each of these subcategories at both time points, suggesting that this classification system does not specifically apply (similar as reported in other contexts [Yu et al., 2020b]). Instead, we identified a signature of transcripts that strongly indicates an inflammatory response. In addition to IEGs such as Fos proto-oncogene, AP-1 transcription factor subunit and early growth response 4, this subset includes C-X-C motif chemokine ligand 8, C-C motif chemokine ligand 2 (CCL2) and prostaglandin-endoperoxidase synthase 2 (PTGS2; Fig. S5 A), similar to markers commonly observed after inflammatory cytokine treatment of human astrocytes (Table S1). Specifically, after a 2-h CNO treatment, Kyoto Encyclopedia of Genes and Genomes (KEGG) analyses identified TNF signaling, IL-17 signaling, MAPK signaling, Kaposi sarcoma–associated herpesvirus infection, and NF-κB signaling as the top five significantly upregulated pathways (Padj ≤ 0.0001) at the 2-h CNO treatment of Astrostim cells (Figs. 4 C, S5 B, and Data S4). Compared to the 2-h CNO treatment, a 2-d CNO treatment revealed a significant upregulation of KEGG pathways involving protein processing, focal adhesion, proteoglycans, and extracellular matrix interactions, among others (Fig. S5 C). Notably, transcripts that encode inflammation-related factors included TLR4, and those which encode extracellular matrix-related factors reminiscent of glial scar included integrin subunit α 1. Altogether, these data suggest that astrocyte reactivity is dynamic over time and involves multiple signaling pathways.

Characterization of chemogenetic astrocyte reactivity and discovery of downstream intracellular and extracellular signaling mechanisms. (A and B) Subset of inflammatory transcripts upregulated (purple) in day 14 Astrostim cells treated with CNO for 2 h (A) or 2 d (B), compared with nontreated control cells (gray; n = 3 each), as detected by RNAseq; see Data S4. (C) Top 5 KEGG pathways significantly upregulated in 2-h CNO treatment of Astrostim cells, shown as a simplified connectome map (CNet plot). Pathways are shown as hubs (gray, containing KEGG IDs and number of DEGs in pathway) with associated genes (purple). See Fig. S5 B and Data S4. For all pathways, Padj ≤ 0.0001. KS, Kaposi sarcoma. (D) CNO and IL-1α+TNF-α (10 ng/ml) treatments increased NF-κB nuclear translocation compared with controls. Shown are NF-κB (white) and DAPI (magenta) signals with insets of single cells (top left) and nuclear NF-κB confined to DAPI mask regions (top right), as well as nuclear NF-κB signal intensities normalized to controls (bottom; n = 3 each). (E) Gene expression of the inflammatory marker CCL2 significantly decreased with 2-h pretreatment of 20 µM Dex preceding 2-h and 2-d CNO treatment of Astrostim cells (normalized to non–Dex-treated controls; n = 5 each). (F) Gene expression of the inflammatory marker CCL2 decreased with 2-h pretreatment of 1 µM IκB inhibitor ACHP preceding 2-h and 2-d CNO treatment of Astrostim cells (normalized to non–ACHP treated controls; n = 4 each). (G) Quantification of CCL2 protein in cell lysate (left) or conditioned media (right) was quantified by ELISA. As expected, CNO treatment significantly increased CCL2 protein levels from non–CNO treated controls. Application of ACHP or Dex to Astrostim cells preceding CNO treatment significantly decreased CCL2 protein levels (n = 3 each). Asterisks under bars indicate a significant increase in CCL2 levels with CNO treatment, compared with the control; asterisks above bars indicate a significant decrease in CCL2 levels with drug pretreatments, compared with CNO treatment alone. All scale bars: 100 µm; inset of D: 10 µm. Results are shown as mean ± SEM. For D–F, significance was determined using two-tailed unpaired t tests. For G, significance was determined using a one-way ANOVA followed by Tukey’s multiple comparison test, with *, P or Padj ≤ 0.05; **, P or Padj ≤ 0.01; ***, P or Padj ≤ 0.001; ****, P or Padj ≤ 0.0001.
Characterization of chemogenetic astrocyte reactivity and discovery of downstream intracellular and extracellular signaling mechanisms. (A and B) Subset of inflammatory transcripts upregulated (purple) in day 14 Astrostim cells treated with CNO for 2 h (A) or 2 d (B), compared with nontreated control cells (gray; n = 3 each), as detected by RNAseq; see Data S4. (C) Top 5 KEGG pathways significantly upregulated in 2-h CNO treatment of Astrostim cells, shown as a simplified connectome map (CNet plot). Pathways are shown as hubs (gray, containing KEGG IDs and number of DEGs in pathway) with associated genes (purple). See Fig. S5 B and Data S4. For all pathways, Padj ≤ 0.0001. KS, Kaposi sarcoma. (D) CNO and IL-1α+TNF-α (10 ng/ml) treatments increased NF-κB nuclear translocation compared with controls. Shown are NF-κB (white) and DAPI (magenta) signals with insets of single cells (top left) and nuclear NF-κB confined to DAPI mask regions (top right), as well as nuclear NF-κB signal intensities normalized to controls (bottom; n = 3 each). (E) Gene expression of the inflammatory marker CCL2 significantly decreased with 2-h pretreatment of 20 µM Dex preceding 2-h and 2-d CNO treatment of Astrostim cells (normalized to non–Dex-treated controls; n = 5 each). (F) Gene expression of the inflammatory marker CCL2 decreased with 2-h pretreatment of 1 µM IκB inhibitor ACHP preceding 2-h and 2-d CNO treatment of Astrostim cells (normalized to non–ACHP treated controls; n = 4 each). (G) Quantification of CCL2 protein in cell lysate (left) or conditioned media (right) was quantified by ELISA. As expected, CNO treatment significantly increased CCL2 protein levels from non–CNO treated controls. Application of ACHP or Dex to Astrostim cells preceding CNO treatment significantly decreased CCL2 protein levels (n = 3 each). Asterisks under bars indicate a significant increase in CCL2 levels with CNO treatment, compared with the control; asterisks above bars indicate a significant decrease in CCL2 levels with drug pretreatments, compared with CNO treatment alone. All scale bars: 100 µm; inset of D: 10 µm. Results are shown as mean ± SEM. For D–F, significance was determined using two-tailed unpaired t tests. For G, significance was determined using a one-way ANOVA followed by Tukey’s multiple comparison test, with *, P or Padj ≤ 0.05; **, P or Padj ≤ 0.01; ***, P or Padj ≤ 0.001; ****, P or Padj ≤ 0.0001.
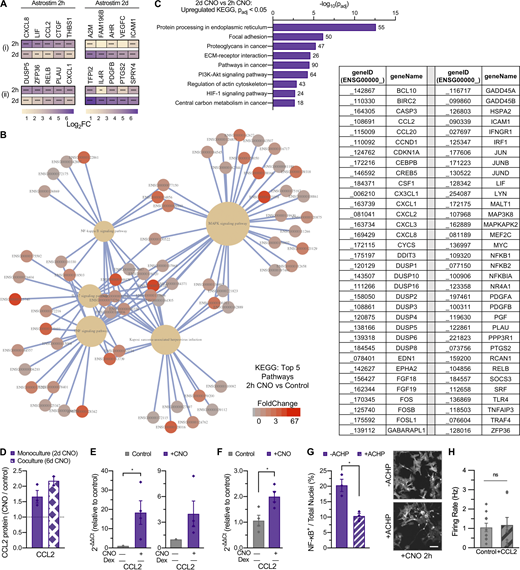
Inflammatory response and Astrostim cell intracellular signaling mechanisms via chemogenetic activation of human astrocytes. (A) Subset of reactive astrocyte markers significantly upregulated in day-12 Astrostim cells after 2-h (left) and 2-d (right) CNO treatment compared to controls (n = 3 each), as detected by RNAseq and shown as log2FoldChange. Identified genes were (i) restricted or (ii) not restricted to those also upregulated in iAstros compared with NPCs, with IEGs omitted; see Data S4. (B) Complete connectome map (CNet plot) of top 5 KEGG pathways significantly upregulated in 2-h CNO treatment of Astrostim cells (see Fig. 4 C). Pathways are shown as yellow hubs (left), with associated genes listed as geneIDs (right) and colorized according to FoldChange. (C) Top KEGG pathways upregulated in 2-d CNO treatment compared with 2-h CNO treatment. Numbers indicate total DEG counts concerning these pathways, for Padj ≤ 0.0001 and −log10(Padj) > 2. (D) Quantification of conditioned media using a Quantibody Human Cytokine Array revealed that CCL2 (MCP-1) protein was consistently secreted upon CNO treatment from Astrostim cells in monoculture (2-d CNO; n = 3) as well as in coculture spheres with OptoNeurons (6-d CNO; n = 2). (E) 2-h (left) and 2-d (right) CNO treatment resulted in upregulation of CCL2 expression in Astrostim cell monocultures, as quantified by qPCR (n = 4 each). (F) 6-d CNO treatment resulted in significant upregulation of CCL2 expression within cocultures spheres of Astrostim cells and OptoNeurons, as quantified by qPCR (n = 4 each). (G) Pretreatment with 10 µM of the IκB inhibitor ACHP for 1 h significantly decreased nuclear NF-κB signal in Astrostim cells, compared with Astrostim cells without ACHP pretreatment (n = 3 groups each, with five images per group). Scale: 100 µm. (H) Chronic (15 d) treatment with 100 nM recombinant human CCL2 in BP+GF did not significantly alter neuronal firing rates on MEAs compared with non–CCL2 treated controls (n = 8–10). Results are shown as mean ± SEM. In H, dots represent individual electrodes. For A, significance was determined using the DESeq2 R package. For E–G, significance was determined using two-tailed unpaired t tests, with *, P ≤ 0.05; **, P ≤ 0.01; ***, P ≤ 0.001; ****, P ≤ 0.0001 (see asterisks overlaid on heatmap).

Inflammatory response and Astrostim cell intracellular signaling mechanisms via chemogenetic activation of human astrocytes. (A) Subset of reactive astrocyte markers significantly upregulated in day-12 Astrostim cells after 2-h (left) and 2-d (right) CNO treatment compared to controls (n = 3 each), as detected by RNAseq and shown as log2FoldChange. Identified genes were (i) restricted or (ii) not restricted to those also upregulated in iAstros compared with NPCs, with IEGs omitted; see Data S4. (B) Complete connectome map (CNet plot) of top 5 KEGG pathways significantly upregulated in 2-h CNO treatment of Astrostim cells (see Fig. 4 C). Pathways are shown as yellow hubs (left), with associated genes listed as geneIDs (right) and colorized according to FoldChange. (C) Top KEGG pathways upregulated in 2-d CNO treatment compared with 2-h CNO treatment. Numbers indicate total DEG counts concerning these pathways, for Padj ≤ 0.0001 and −log10(Padj) > 2. (D) Quantification of conditioned media using a Quantibody Human Cytokine Array revealed that CCL2 (MCP-1) protein was consistently secreted upon CNO treatment from Astrostim cells in monoculture (2-d CNO; n = 3) as well as in coculture spheres with OptoNeurons (6-d CNO; n = 2). (E) 2-h (left) and 2-d (right) CNO treatment resulted in upregulation of CCL2 expression in Astrostim cell monocultures, as quantified by qPCR (n = 4 each). (F) 6-d CNO treatment resulted in significant upregulation of CCL2 expression within cocultures spheres of Astrostim cells and OptoNeurons, as quantified by qPCR (n = 4 each). (G) Pretreatment with 10 µM of the IκB inhibitor ACHP for 1 h significantly decreased nuclear NF-κB signal in Astrostim cells, compared with Astrostim cells without ACHP pretreatment (n = 3 groups each, with five images per group). Scale: 100 µm. (H) Chronic (15 d) treatment with 100 nM recombinant human CCL2 in BP+GF did not significantly alter neuronal firing rates on MEAs compared with non–CCL2 treated controls (n = 8–10). Results are shown as mean ± SEM. In H, dots represent individual electrodes. For A, significance was determined using the DESeq2 R package. For E–G, significance was determined using two-tailed unpaired t tests, with *, P ≤ 0.05; **, P ≤ 0.01; ***, P ≤ 0.001; ****, P ≤ 0.0001 (see asterisks overlaid on heatmap).
Because the CNO-induced transcriptional signature related to inflammation includes many NF-κB target genes (Liu et al., 2017), we tested whether Astrostim cell activation initiated nuclear translocation of the NF-κB protein complex. Indeed, similar to the addition of inflammatory cytokines interleukin 1 α (IL-1α) and TNF-α, 2-h and 2-d CNO treatments stimulated average increases of 1.7-fold and 1.5-fold, respectively, in the nuclear NF-κB signal compared with no-treatment control cells (Fig. 4 D; P ≤ 0.05). To test the specificity of this pathway, and as proof of principle for using this approach for drug testing, we aimed to assess whether the CNO-induced signature could be manipulated with anti-inflammatories currently in clinical use. In order to identify abundant druggable biomarkers of astrocyte reactivity, we performed unbiased profiling of inflammatory cytokines. Measurement of proteins in conditioned media using a cytokine array revealed that CCL2 (also known as MCP-1) protein secretion from Astrostim cells in monoculture consistently increased after CNO treatment (1.7 ± 0.2-fold average increase with 2-d CNO) as well as in coculture spheres with OptoNeurons (2.2 ± 0.1-fold average increase with 6-d CNO; Fig. S5 D). Utilizing qPCR, we verified a significant upregulation (P ≤ 0.05) of CCL2 transcripts in Astrostim cell monocultures after the 2-h CNO treatment and a robust upregulation after the 2-d CNO treatment (18.3- and 4.0-fold average increases in expression, respectively; Fig. S5 E), as well as a significant upregulation (P ≤ 0.05) of CCL2 within cocultures spheres of Astrostim cells and OptoNeurons after the 6-d CNO treatment (twofold increase; Fig. S5 F). Therefore, we identified CCL2 as a dependable astrocyte reactivity biomarker to use as a readout for drug testing.
The glucocorticoid receptor signaling pathway is known to repress transcription of numerous proinflammatory genes by interfering with NF-κB signaling and other transcriptional networks (including those regulated by AP-1, which is composed of IEG members similar to those observed in the Astrostim cell signature; Cain and Cidlowski, 2017). First, we tested the effect of the glucocorticoid receptor agonist dexamethasone (Dex) on decreasing the expression of the CCL2 biomarker. Astrostim cells pretreated with 20 µM Dex for 2 h before application of 2-h or 2-d CNO (with continued Dex treatment) exhibited significantly decreased expression of CCL2 (average decreases of 49.1% and 56.9%, respectively; P ≤ 0.01), as assessed by qPCR (Fig. 4 E). Similarly, directly targeting NF-κB translocation with the IκB inhibitor 2-amino-6-[2-(cyclopropylmethoxy)-6-hydroxyphenyl]-4-(4-piperidinyl)-3-pyridinecarbonitrile (ACHP) significantly decreased (P ≤ 0.05) the nuclear NF-κB signal in Astrostim cells undergoing CNO treatment (Fig. S5 G) and also decreased transcript levels of CCL2 by 31.0% and 43.8% with 2-h and 2-d CNO treatment, respectively (Fig. 4 F).
Finally, we ascertained whether CCL2 protein secretion could be modulated with these treatments. We similarly treated Astrostim cells with 20 µM Dex or 1 µM ACHP during CNO application and subsequently quantified CCL2 protein in Astrostim cell lysate and conditioned media. As expected, secretion of CCL2 protein increased significantly (P ≤ 0.01) with 2-d CNO treatment, both with and without drug pretreatment, as measured by ELISA (Fig. 4 G). Pretreatment of ACHP or Dex to Astrostim cells before continued treatment during CNO application significantly decreased (P ≤ 0.001) CCL2 protein levels in cell lysates from 0.1 ± 0.002 ng/ml to 0.07 ± 0.001 or 0.08 ± 0.002 ng/ml, respectively, compared with the non-drug treated CNO group. Similarly, ACHP or Dex pretreatment significantly decreased (P ≤ 0.0001) CCL2 protein levels in Astrostim cell-conditioned media from 3.8 ± 0.2 ng/ml to 1.2 ± 0.02 or 1.4 ± 0.07 ng/ml, respectively. Finally, we tested whether CCL2 is a key astrocyte-derived protein responsible for decreased neuronal activity. Chronic (15 d) treatment with 100 nM recombinant human CCL2 in BP+GF optimal media did not significantly alter neuronal firing rates on MEAs compared to non–CCL2-treated controls (Fig. S5 H), suggesting that CCL2 is insufficient to mimic the proinflammatory responses induced by Astrostim cell activation in bioengineered organoids and that, likely, other factors, or a combination of factors, are responsible.
In summary, these data reveal that direct activation of human astrocytes via the Gq-GPCR signaling pathway leads to a complex and dynamic response that includes a potentially beneficial extracellular signaling via secretion of synaptogenic proteins, yet also a detrimental reactivity correlating with a classic inflammatory signature, independent of cross-communication with other immune cells or exogenous treatment with inflammatory cytokines. Thus, modulation approaches targeting astrocytes should consider potential caveats from chronic activation and chemogenetic-based activation provides an alternative paradigm to inflammatory cytokine treatment that can enable on-demand modeling of neuroinflammatory reactivity within bioengineered organoids.
Discussion
Defining reactivity of astrocytes within distinct contexts is necessary to better understand their relationship with neuronal networks and to identify therapeutic targets, such as GPCRs, for manipulating reactivity states (Patel et al., 2019; Escartin et al., 2021). Despite providing improvements over monolayer culture approaches and variable neural organoid systems, the bioengineering innovations described in this study undoubtedly contain remaining caveats. For example, rapid transdifferentiation techniques may limit the study of neurodevelopmental conditions. In addition, although our model utilizes pure and synchronous human cellular populations that reduce the need for purification of mature cells or single-cell profiling and eliminate confounding signals from other undefined cell types (such as progenitors), it also oversimplifies the complex relationships between numerous cell types within the nervous system. However, this coculture approach also offers the ability to increase cellular complexity; for example, the addition of other inducible cell types (e.g., microglia, oligodendrocytes, interneurons, endothelia, etc.) and of regional specification to generate cellular subtypes, which can be adapted as customizable components to create more practical and dynamic multicellular models. Because of this added experimental modularity, this human cellular research tool has a myriad of potential applications as an effective platform for basic research studies, translational disease modeling, drug screening, and diagnostics.
The non-cell autonomous contributions of astrocytes to neuronal network development and degeneration have long been an interest for investigating intercellular communication in the nervous system. Chemogenetic tools provide a method to simulate the astrocyte response to neuronal activity, as recently reviewed in detail (Shen et al., 2021). We determined that CNO immediately activates astrocytes, and this reactivity persists with chronic treatment at least for 11 d. However, it remains untested whether astrocytes can return to baseline nonreactive states after the removal of CNO and whether reactivity will affect synchronous synaptic network activity at later stages of maturation. This study revealed that direct activation of human astrocytes (specifically through the Gq-GPCR pathway) leads to a complex signature of numerous inflammatory factors that cannot simply be concluded as a beneficial or detrimental type of reactivity. For example, THBS1 secretion is thought to benefit neuronal activity as it is a known promoter of synapse formation; however, excessive THBS1 may elicit downstream neuropathic hyperactivity (Nagai et al., 2019), which may further lead to excitotoxicity. Similarly, we confirmed that activation of astrocytes leads to production of inflammatory cytokines such as CCL2, which is a well-known immune cell recruitment molecule, yet can also directly activate neuronal activity (Duan et al., 2018). However, CCL2 treatment alone was not sufficient to modulate neuronal firing rates; thus, alternative mechanisms such as oxidative stress, prostaglandins, and/or dysregulated lipids, for example, may be at play. Interestingly, one of the top genes induced in our study was PTGS2, which was similarly identified in a recent chemogenetic microglial study which reported that prostaglandin E2 modulates neuronal activity (Klawonn et al., 2021). Surprisingly, we did not detect an increase in IL6 transcripts, which is reported in numerous reactive astrocyte studies including a recent report that IL-1β treatment leads to reduced neuronal activity partially through secretion of IL-6 protein (Vadodaria et al., 2021), suggesting that the state of inflammatory reactivity via Gq-GPCR activation is distinct from other inflammation paradigms. In future studies, it will also be important to test whether chronic GPCR activation induces a neurotoxic effect through release of saturated lipids, as recently reported for astrocytes treated with inflammatory cytokines (Guttenplan et al., 2021). In contrast to a gain-of-function detrimental signaling process, it is also possible that a loss of astrocyte trophic support underlies contributions to intercellular changes. A key concern is understanding the balance of these inflammatory mediators. In acute reactivity, this inflammatory response likely has neuroprotective effects; however, excessive neuroinflammatory signaling to innate and adaptive immune cells can lead to degeneration.
In this study, we did not observe the neurotoxicity that has been described in other inflammatory reactivity studies (Barbar et al., 2020). This may be explained by various differences in experimental paradigms (maturation stage of neurons and astrocytes, different method to induce astrocyte reactivity, different endpoint measurements, etc.). However, as described by Guttenplan et al. (2020), an astrocyte-induced neurotoxic effect upon neurons likely requires additional disease-associated stressors such as genetic mutations in neurons or microenvironmental factors. This is supported by our studies comparing minimal and optimal conditions. In this study, the combined use of BP media and/or growth factors was able to significantly improve health and activity under baseline conditions and in the presence of reactive astrocytes. As these distinct media and growth factors have numerous downstream consequences on cellular health and/or neuroprotection compared to minimal conditions, our studies do not pinpoint the exact mechanism involved but altogether strongly suggests that general improvement of neuronal health can reduce detrimental effects of reactive astrocytes. Thus, we expect that our culture approach could be also utilized for modeling and drug discovery of neurodegenerative conditions depending on the experimental paradigm, such as in the context of patient-specific, genetic-mutant cell lines. Although chemogenetic activation of astrocytes is not a traditional approach to elicit inflammation, the response from chronic activation appears to be strikingly similar to that of cytokine treatment and permits a new avenue to understand how intracellular signaling pathways may cross-communicate with gene networks that activate the inflammatory response. Because this approach of astrocyte-specific stimulation does not lead to overt neurotoxicity, it creates a baseline platform that enables the investigation of functional astrocyte–neuron interactions during acute stimulation and inflammation during chronic activation, both within a practical experimental timeframe.
Materials and methods
Plasmid construction and transgenic cell line generation
Stem cells
hPSCs (WTC-11, #GM25256; Coriell Institute) were cultured in pluripotent maintenance medium (hPSC medium) consisting of TeSR-E8 basal medium with supplements (STEMCELL Technologies) and 1× antibiotic-antimycotic (Gibco). 1 × 10⁶ cells were plated in a 6-cm dish and were transfected using Lipofectamine Stem transfection reagent (Invitrogen) with a ratio of 0.5 µg of Left-TALEN (plasmid #62196; Addgene [Cerbini et al., 2015]), 0.5 µg of Right-TALEN (plasmid #62197; Addgene [Cerbini et al., 2015]), and 1 µg of integrating vector. Transfected cells stably expressing their respective fluorescent reporters were then manually picked and clonally expanded, as detailed below. Positive clones containing the expression cassette were selected via manual sorting and FACS using cell line–respective promoter-driven fluorescent reporters and subsequently expanded to generate pure lines. All subcloned genes were placed downstream of a dox-inducible Tet-ON promoter (rtTA3G-TRE3G) using TALEN genetic engineering technology (Cerbini et al., 2015). The NEBuilder HiFi DNA Assembly Cloning Kit and its associated protocols (New England Biolabs) were used. Transgene sequences were confirmed by sequencing. Primers used for cloning are listed in Table S3.
iAstro cell line
To generate the iAstro hPSC line, we subcloned both SOX9 and NFIA coding sequences (separated by a T2A ribosome skipping sequence) to a pUCM donor vector containing a CLYBL homology arm (plasmid #105841; Addgene [Fernandopulle et al., 2018]). Positive clones were selected using an EF1alpha promoter-driven mApple reporter.
Astrostim cell line
The Astrostim hPSC line was generated by cotransfecting the iAstro plasmid along with a donor plasmid which instead contained hM3Dq (subcloned from plasmid #80948; Addgene [Chen et al., 2016]). Positive clones were selected using an EF1alpha promoter-driven mEmerald reporter and mApple.
GCaMP6 iNeuron cell line
GCaMP6m was synthesized and subcloned into a lentiviral vector downstream of an EF1alpha promoter into a previously generated iNeuron line containing NEUROG2 in the AAVS1 locus (Krencik et al., 2017b).
OptoNeuron cell line
The optogenetic iNeuron hPSC line was generated by incorporating a second transgene into a previously generated iNeuron line containing NEUROG2 in the AAVS1 locus (Krencik et al., 2017b). YFP-fused ChR2 with a H134R mutation (plasmid #20942; Addgene [Zhang et al., 2007]) was directed into the CLYBL safe-harbor locus (i.e., “OptoNeuron” for cells containing both ChR2 and NEUROG2 transgenes). Positive clones were selected using an EF1alpha promoter-driven mApple reporter.
Cell differentiation and sphere culture
To induce differentiation of hPSCs, TeSR-E8 basal medium was exchanged with NM consisting of DMEM/F-12 with GlutaMAX (Thermo Fisher Scientific), 1× antibiotic-antimycotic, 0.5× B-27 and 0.5× N-2 supplements (Gibco), and 2 mg/ml heparin (Sigma-Aldrich). Differentiation of transgenic cell lines was induced with the addition of 2 µg/ml doxycycline hydrochloride (NM+Dox; Sigma-Aldrich). For OptoNeuron differentiation, cells were maintained as a monolayer in NM+Dox for 2 d. For iAstro or Astrostim cell differentiation, cells were maintained as a monolayer in NM+Dox with 2 µM SB431542 (STEMCELL Technologies), 2 µM DMH-1 (STEMCELL Technologies), and 2 µM XAV939 (Tocris) small molecules (Tchieu et al., 2017) to promote neural induction for 2 d (+S/D/X) and then subsequently maintained in NM+Dox and split after reaching 100% confluency. After accutase cell detachment treatment (Sigma-Aldrich), single-cell suspensions of day-12 iAstro or Astrostim cultures were combined with day-2 OptoNeurons in Aggrewell 800 24-well microwell plates (STEMCELL Technologies) in desired ratios (e.g., 1:1, 1:10, 1:500, or 1:1,000 with equivalent total cell numbers, as stated in figure captions) in the presence of rho-kinase inhibitor Y27632 (Tocris) to generate OptoNeuron spheres as previously described (Cvetkovic et al., 2018; Krencik et al., 2017b). Spheres were removed from microwell plates and maintained in suspension culture until the time of experimentation. Optionally, basal media was gradually switched to BP (STEMCELL Technologies) with supplements (BP+GF) including ascorbic acid (Sigma-Aldrich), recombinant human BDNF and GDNF (both from Peprotech) starting on day 7. Half the media was exchanged every other day for sphere cultures.
Calcium imaging
Live imaging
Live cells were allowed to adhere to Matrigel-coated slides for 48 h prior to imaging and then loaded with 2 µM Fluo-4 AM (Invitrogen) fluorescent calcium indicator dye in phenol red–free media for 30 min. Pluronic F127 (20% vol/vol of Fluo-4) was added to promote dye uptake. After washing, cells were incubated for an additional 30 min and then promptly imaged. In order to obtain representative baseline activity, cells were recorded for 3 min before applying any treatment. Media-only treatments were applied during live imaging to control for cellular responses to mechanical stimulation. Cells were acutely treated with 100 µM ATP (Thermo Fisher Scientific) or 10 µM CNO (R&D Systems), as indicated.
Data analyses
For ATP experiments, regions of interest (ROIs) were selected using ImageJ. Fluorescent intensities were obtained using the Analyze function in the ROI manager and then unbiasedly analyzed in PeakCaller, a MATLAB-based script (Artimovich et al., 2017), to measure spike frequencies. For Astrostim cell acute CNO experiments, ImageJ was used to obtain the Z-profile, a quantitative correlate of fluorescence intensity, of each video. ROIs were created by delineating 10 clearly defined cells per replicate; an additional ROI was placed over an open patch in the video to obtain a background measurement for normalization. Maximum values from timepoints corresponding to the baseline, media, and CNO treatment time frames were collected and divided by baseline peaks to calculate relative change in fluorescent intensity. For GCaMP6 monoculture and coculture experiments, ROIs selected using ImageJ were used to isolate the mean gray values over time. Neurons displaying one or fewer calcium spikes throughout the duration of the video were not considered active and were subsequently excluded from the analysis. Collected mean gray values were analyzed using PeakCaller in order to quantify spike frequency (peaks/s) in a given recording.
Gene expression marker and transcriptome analyses
qPCR
Cells were collected in TRI Reagent and RNA was purified using a Direct-zol RNA Kit (Zymo Research) with on-column DNase treatment, according to the manufacturer’s instructions. RNA concentration was quantified using a benchtop spectrophotometer/fluorometer (Denovix), and reverse transcription was performed with iScript RT Supermix (Bio-Rad). qPCR was performed with cDNA using SsoAdvanced Universal SYBR Green Supermix (Bio-Rad) on a Fast Real-Time PCR System (7900HT; Applied Biosystems), with GAPDH as an internal control for normalization. Changes in gene expression were calculated by computing fold changes (2−ΔΔCt) compared with control groups. Primers are listed in Table S3.
RNAseq
Purified total RNA was analyzed for quality via microfluidic electrophoresis using a Bioanalyzer 2100 (Agilent). Samples were sent to Novogene Corporation for library construction, sequencing, and bioinformatic analysis. A threshold value of fragments per kilobase of transcript per million mapped reads (FPKM) > 1 was set to determine whether a gene was expressed. Differential expression analysis was performed using the DESeq2 R package (Anders and Huber, 2010) to identify differentially expressed genes (DEGs). The resulting P-values were adjusted using Benjamini and Hochberg’s approach for controlling the false discovery rate (Padj ≤ 0.05). Day-14 OptoNeurons (cultured as spheres) were compared with Day-12 iAstros using DESeq2 analysis of DEGs, as presented in Data S3. For Astrostim cells, gene expression was compared against markers corresponding to pan, A1, and A2 astrocyte phenotypes (Liddelow et al., 2017; Diaz-Castro et al., 2019). Top Gene Ontology and KEGG pathways are included in Data S1 and S4. The top 5 KEGG pathways which were significantly upregulated in the 2-h CNO treatment of Astrostim cells (with Padj ≤ 0.001) were included in Figs. 4 C and S5 C. Connectome maps (CNet plots; Jia et al., 2019) were created by Novogene. Sequencing data have been deposited in the National Center for Biotechnology Information’s Gene Expression Omnibus, with accession no. GSE187436.
Proteomic analysis
Unbiased semiquantitative secretomics
iAstros and NPCs were maintained either in monolayer cultures or cocultured as spheres after differentiation to collect astrocyte-conditioned media, as noted. OptoNeurons were differentiated for 2 d and then cultured as spheres for 7 d. Medium was replaced with DMEM/F-12 without phenol red or supplements, with appropriate treatments as noted. Conditioned media from three replicates were collected for an additional 2 d (after completing a 2-d CNO treatment of Astrostim cells, as noted) and passed through a 0.22-µm filter. For mass spectrometry, samples were sent to a core facility for unbiased semiquantitative secretomic analyses. Relative fraction of total (iFOT) values were determined [reported as log10(iFOT × 105), in order to perform two-tailed t tests between normally distributed groups]. As described previously (Jung et al., 2017), missing values (iFOT = 0) were replaced with a value equal to one half of the minimum detected value in the dataset in order to determine fold change between groups (averaged across three replicates) using log2 transformation. Results were not considered for proteins whose iFOT values were zero for all samples. The mass spectrometry proteomics data have been deposited to the ProteomeXchange Consortium via the Proteomics IDEntifications partner repository, with dataset identifier PXD030821.
ELISA and cytokine arrays
For drug treatment studies, 20 µM Dex (Sigma-Aldrich) and 1 or 10 µM ACHP (Tocris) were pretreated to Astrostim cells before continued treatment during CNO application, as described. Conditioned media were collected during a period of 2 d in the absence of phenol red, as described above and in experimental details. The cell lysate was collected and digested using radioimmunoprecipitation assay Lysis and Extraction Buffer (Thermo Fisher Scientific), according to the manufacturer’s instructions. Sample concentrations were first measured using a BCA Protein Assay Kit (Pierce). Samples were analyzed using human MCP-1 (CCL2) or thrombospondin 1 ELISA kits (RayBiotech) according to the manufacturer’s instructions. For conditioned media samples, 213 or 226 µg of protein, respectively, was loaded into each well of the plates. For cell lysate samples, 53.5 µg of protein was loaded into each well. The measured absorbance was compared to a standard curve to determine protein concentration, which was normalized to the total protein added per well. A Quantibody Human Cytokine Array Kit (QAH-CYT-1-1; RayBiotech) was utilized to quantify MCP-1 (CCL2) protein in conditioned media from Astrostim cells and coculture spheres, according to the manufacturer’s instructions.
Optostimulation and electrophysiology
MEA preparation
6-well MEA (Multi Channel Systems) surfaces were sterilized and coated with 0.1 mg/ml poly-D-lysine (Millipore) for 1 h at 37°C, rinsed 3× with sterile H2O, and coated with 25 µg/ml laminin (Gibco) for 1 h at 37°C. Spheres were resuspended in NM+Dox and allowed to adhere to the surfaces of MEAs for 48 h before recording. Half the media was exchanged with BP (STEMCELL Technologies) every other day, as well as 1 h before recording.
Optostimulation
We designed a custom in-house optical stimulation apparatus consisting of a single 700 mA 470 nm LED enclosed in a 3D-printed dark box (Lulzbot 5.0) and activated using programmable parameters controlled by Multi Channel Experimenter software (Multi Channel Systems). Light density was determined using a PM121D optical power meter (Thorlabs) and characterized as a function of distance in order to determine an optimal firing rate-induction paradigm without causing noise interference. The LED was positioned 30 mm above the surface of the MEA, corresponding to a power density of 0.29 mW/mm2.
MEA recording and data analysis
MEAs were placed on a multielectrode array system (MEA2100; Multi Channel Systems) with a temperature-controlled headstage. A spike threshold of 5× SD above the background noise was applied in Multi Channel Experimenter software. Recordings were obtained without (i.e., spontaneous) and with (i.e., blue light–induced) optostimulation. Raw data were exported using Multi Channel DataManager (Multi Channel Systems) and analyzed in NeuroExplorer software (v5.0; Nex Technologies) using Firing Rate Analysis, Autocorrelogram, Raster, and Rate Histogram functions. Individual electrodes were considered active if they passed a 0.1 Hz firing rate (1 spike/10 s) cutoff for basal conditions or a 1 Hz firing rate for optimal conditions. Stimulated firing rates (number of detected spikes over time) were collected from the first 5 s of light-induced stimulation.
Cellular assays
Western blotting
Cell pellets were lysed in radioimmunoprecipitation assay buffer (50 mM Tris-HCl pH 8, 150 mM NaCl, 1% NP40, 0.5% sodium deoxycholate, 0.1% SDS) with freshly added protease inhibitors for 30 min at 4°C. The lysates were then centrifuged at 13,000 rpm for 30 min at 4°C, and the supernatant was collected for Western blot. Protein concentrations were determined using Protein Assay Dye Reagent Concentrate (Bio-Rad) with standards, and 10 µg of the lysate was loaded on 15% SDS-PAGE gels that were transferred to nitrocellulose membranes. Primary antibodies against NFIA and Sox9 (see Table S4) were added to membranes at a 1:500 dilution in 5% milk blocking buffer overnight at 4°C. The membranes were washed in Tris buffer with Tween 20 and incubated with anti-rabbit secondary antibody at 1:10,000 dilution for 1 h at room temperature. The membranes were again washed in Tris buffer with Tween 20 and developed using Luminol reagent (Santa Cruz).
Viability
For monolayer culture viability assays, CNO-treated cells were plated on Matrigel-coated 96-well plates at a density of 50,000 cells/well for 48 h prior to assay. At the time of the assay, media was exchanged to phenol red-free NM+Dox and supplemented with CellTiter 96 Aqueous One Solution Reagent according to the manufacturer’s instructions (Promega). The reaction was allowed to proceed for 4 h before absorbance was read at 490 nm using a microplate reader (Tecan). Media-only blanks were subtracted, and absorbance values were normalized to baseline CNO treatments, as noted. For 3D viability assays, coculture spheres containing OptoNeurons and Astrostim cells (10:1) were treated with or without CNO for varying time points and then incubated with equal volumes of phenol red–free media and CellTiter-Glo 3D Reagent (Promega) in opaque-walled, clear-bottom 96-well plates. The viability assay was carried out according to the manufacturer’s instructions and luminescence was measured using a microplate reader (Tecan). As luminescence varied linearly with sphere size, the measured values were normalized to cross-sectional areas of each sphere.
Oxygen consumption rate and mitochondrial activity
Day-14 monoculture and 1:1 coculture spheres were plated on Matrigel-coated XF96 V3 PS cell-culture microplates for 48 h prior to assay on a Seahorse XFe96 Analyzer (Agilent). The XF Cell Mito Stress Test Kit (Agilent) was used with 1.5 µM oligomycin, 1 µM FCCP, and 0.5 µM Rotenone/AntimycinA. Six total measurements were taken at each phase, at intervals of 6 min. Concentration curves were performed to determine optimal sphere seeding density and reagent concentrations within the detection range of the assay.
Immunohistochemistry
Preparation
Cells or sphere cultures were fixed in 4% paraformaldehyde at 4°C for 30 min and rinsed with PBS, 3× 10 min. Cultures were permeabilized in primary blocking buffer consisting of PBS with 0.25% Triton X-100 (Sigma-Aldrich) and 5% (vol/vol) goat serum (BioLegend) at room temperature for 30 min. Primary blocking buffer with primary antibodies was added overnight at 4°C. After rinsing, cultures were incubated with secondary blocking buffer (PBS with 5% goat serum) and secondary antibodies for 2 h at room temperature. Cultures were then rinsed, incubated with DAPI (Invitrogen) for 10 min at room temperature, rinsed, and mounted on glass slides. Fixed monolayer cultures were mounted in Fluoromount-G (Southern Biotech), whereas sphere cultures were cleared, mounted, and imaged in a fructose/glycerol solution (Dekkers et al., 2019). Antibodies, including fluorochromes used for secondary antibodies, are listed in Table S4.
Imaging and analysis
Live images (Fig. 2, C and F) were acquired with a DM IL LED inverted microscope with a DFC3000G camera (Leica). Otherwise, images were acquired on a TCS SPE confocal microscope with a HC PL APO 40×/1.30 oil objective and a DFC365 FX camera (all Leica). All images were acquired at room temperature (and for live images, within 5 min after removal from a 37°C incubator, in media without phenol red). Images and z-stacks were acquired using Leica Application Suite X software and analyzed with ImageJ software (National Institutes of Health).
Quantification of nuclear NF-κB localization
Astrostim cells were treated with 10 µM CNO or 10 ng/ml recombinant human IL-1α (BioLegend) and 10 ng/ml TNF-α (BioLegend) for 2 h or 2 d. ImageJ was used on the DAPI channel to apply a threshold, fill nuclear bodies using the “Fill Holes” function, and convert to a mask using the “Analyze Particles” function (allowing for acquisition of total nuclear area in pixel units). The DAPI mask was subtracted from the NF-κB channel using the “Image Calculator” function to create a composite image showing only nuclear-localized NF-κB signal. The NF-κB nuclear signal was quantified by measuring the raw integrated density (sum of the value of pixels within the image) and then divided by DAPI signal quantity measured from the mask to account for differences in cell numbers per image (n = 5–8 images each). Images from experimental groups (+CNO and +IL-1α/TNF-α) were then normalized to no-treatment groups to produce normalized intensity relative to controls. For drug treatment studies, Astrostim cells were pre-treated with 10 µM ACHP for 1 h before 2-h CNO treatment. Staining and imaging was performed as described above, and NF-κB nuclear signal was quantified as the percentage of positive nuclei out of total nuclei. Images were analyzed by an experimenter blind to the conditions.
Quantification of ClCasp3
Measurement of ClCasp3 expression was accomplished by first thresholding ClCasp3 images to eliminate background signal using the “Threshold” function in ImageJ. Next, artifacts that corresponded to signal sources too small to be true ClCasp3 were removed using the “Analyze Particles” function. The resulting mask was subsequently used to quantify the number of positive pixels using the “Histogram” function. In order to normalize to cell quantity in a given image, a mask was created from the DAPI channel using the “Analyze Particles” function, and positive pixels were again counted using the “Histogram” function.
Statistical analysis
Measurements are presented as mean ± SEM, unless otherwise noted. The number of sampled units (n) are noted in figure captions. Biological replicates were defined by distinct cellular populations from the start of differentiation, for all cell types. Replicates (technical or biological) are noted in figure captions. Data collection points and study endpoints were informed by genomic expression data (RNAseq or qPCR). Other measures of unbiased data collection, blinding, and analysis are noted in each section. Errors were calculated using individual cells, spheres, MEA electrodes, or images from technical replicates, as noted. Data from experiments using one biological replicate are averaged across technical replicates. For experiments with biological replicates, errors were calculated between replicates. Significance was tested using GraphPad Prism (GraphPad Software, Inc.) only for experiments using biological replicates or individual MEA electrodes, either using two-tailed paired or unpaired t tests (for comparison between single conditions) or one-way ANOVA followed by a Tukey or Šidák post hoc test (for comparison across multiple groups), as appropriate. Data distribution was assumed to be normal, but this was not formally tested. For RNAseq data, genes identified as having undergone significant changes in expression between control and experimental groups were defined by adjusted Padj ≤ 0.05, as calculated using the DESeq2 R package (Anders and Huber, 2010). In all figures, *, P ≤ 0.05; **, P ≤ 0.01; ***, P ≤ 0.001; ****, P ≤ 0.0001. Asterisks are not included if data were not acquired from biological replicates.
Online supplemental material
Fig. S1 confirms upregulation of SOX9 and NFIA, GFAP, and astrocyte-restricted gene expression in iAstros via Western blot, immunostaining, and qPCR. Fig. S2 demonstrates optimization of OptoNeuron (iNeuron) organoid culture. Fig. S3 shows optimization of OptoNeuron culture based on spontaneous and blue light–stimulated firing, measured by MEAs. Fig. S4 shows immunostaining of GFAP, synaptophysin, and synapsin 1 in iAstro:OptoNeuron cocultures and analysis of ClCasp3, THBS1, and firing rates of cocultures versus OptoNeuron controls. Fig. S5 shows the effect of CNO treatment on Astrostim cells through RNAseq, highlighting inflammatory genes and pathways, followed by measurement of CCL2 after exposure of cocultures and OptoNeurons to CNO. Data S1 contains RNAseq of day-12 iAstros compared with NPCs. Data S2 contains raw secretomic data of day-12 iAstros compared with NPCs and to day-9 OptoNeuron sphere cultures. Data S3 contains RNAseq of day-12 iAstros compared with day-14 OptoNeuron sphere cultures, as well as human brain tissue samples. Data S4 contains RNAseq of day-14 Astrostim cells with 2-h and 2-d CNO treatment compared with untreated controls. Table S1 summarizes methods for activating human astrogliosis. Table S2 summarizes methods for generating inducible astrocytes. Table S3 lists the primers used for plasmid construction and qPCR. Table S4 lists antibodies used for immunostaining and Western blot in this study. Video 1 shows intracellular calcium imaging of NPCs versus iAstros following ATP treatment. Video 2 shows intracellular imaging of iAstros versus Astrostim cells, with and without CNO treatment. Video 3 shows a z-stack of iAstros expressing S100 within iAstro:OptoNeuron coculture spheres. Video 4 shows a z-stack of an iAstro:OptoNeuron organoid immunostained with Synapsin1. Video 5 shows a z-stack of a GFAP and synaptophysin-immunostained iAstro:OptoNeuron organoid. Video 6 and Video 7 show z-stacks of Astrostim cells expressing S100 within Astrostim:OptoNeuron coculture spheres following 2 d of treatment with CNO.
Acknowledgments
Research reported in this publication was supported by the National Institute on Aging of the National Institutes of Health (NIH) under Award Number R21AG064567. The content is solely the responsibility of the authors and does not necessarily represent the official views of the National Institutes of Health. Research was also supported by Mission Connect (a program of TIRR Foundation; 019-114), The Michael J. Fox Foundation for Parkinson’s Research (17871), and Cancer Prevention and Research Institute of Texas Award (RP200655). We thank the RNA Core and Center for Bioenergetics at Houston Methodist Research Institute for technical support, Dr. Gillian Hamilton and Dr. Yi-Lan Weng at Houston Methodist Research Institute for helpful discussions, Bushra Biba at Novogene Corporation for assistance with biostatistics, and Dr. Sung Yun Jung and Antrix Jain at the Mass Spectrometry Proteomics Core at Baylor College of Medicine (BCM) for their assistance. The BCM Mass Spectrometry Proteomics Core is supported by the Dan L. Duncan Comprehensive Cancer Center NIH award (P30 CA125123), Cancer Prevention and Research Institute of Texas Core Facility Award (RP170005), and NIH High End Instrument award (S10 OD026804).
The authors declare no competing interests.
Author contributions: C. Cvetkovic, R. Patel, and R. Krencik designed experiments. R. Patel, M.K. Hogan, M.E. Ward, and R. Krencik designed new research tools and cell lines. C. Cvetkovic, A. Shetty, M. Anderson, N. Basu, S. Aghlara-Fotovat, S. Ramesh, D. Sardar, and R. Krencik collected data. C. Cvetkovic, R. Patel, A. Shetty, M. Anderson, and R. Krencik analyzed data. C. Cvetkovic and R. Krencik wrote the manuscript. D. Sardar, O. Veiseh, M.E. Ward, B. Deneen, and P.J. Horner provided intellectual content and scientific feedback.

