


Nutrient deprivation triggers the release of signal-sequence–lacking Acb1 and the antioxidant superoxide dismutase 1 (SOD1). We now report that secreted SOD1 is functionally active and accompanied by export of other antioxidant enzymes such as thioredoxins (Trx1 and Trx2) and peroxiredoxin Ahp1 in a Grh1-dependent manner. Our data reveal that starvation leads to production of nontoxic levels of reactive oxygen species (ROS). Treatment of cells with N-acetylcysteine (NAC), which sequesters ROS, prevents antioxidants and Acb1 secretion. Starved cells lacking Grh1 are metabolically active, but defective in their ability to regrow upon return to growth conditions. Treatment with NAC restored the Grh1-dependent effect of starvation on cell growth. In sum, starvation triggers ROS production and cells respond by secreting antioxidants and the lipogenic signaling protein Acb1. We suggest that starvation-specific unconventional secretion of antioxidants and Acb1-like activities maintain cells in a form necessary for growth upon their eventual return to normal conditions.
Introduction
Unconventional protein secretion is defined as the process by which eukaryotic cells export proteins that cannot enter the conventional ER–Golgi complex pathway. This fascinating process was noted upon the cloning of interleukin (IL)-1, which lacks a signal sequence for entry into the ER and yet is released by activated macrophages (Auron et al., 1984; Rubartelli et al., 1990). Since then, the repertoire of proteins released unconventionally has expanded considerably. The path taken by this class of proteins to reach the extracellular space varies. Briefly, Types I and II involve direct translocation across the plasma membrane, either via pores or ABC transporters, respectively, while Type III involves incorporation of the cargoes first into an intracellular membrane compartment (Nickel and Rabouille, 2018; Rabouille, 2017). FGF2 (Fibroblast Growth Factor 2) and Acyl-CoA binding protein (ACBP/AcbA/Acb1) are two of the best-studied examples of unconventionally secreted proteins thus far. FGF2 follows a Type II route, whereas Acb1 takes a Type III path that involves a cellular compartment called CUPS (Compartment for Unconventional Protein Secretion), the cytoplasmic proteins Grh1, and a subset of the endosomal sorting complex required for transport (ESCRTs; Cruz-Garcia et al., 2014, 2018; Curwin et al., 2016; Duran et al., 2010; Steringer et al., 2015, 2017). More recently, the export of cytoplasmic enzyme superoxide dismutase 1 (SOD1) was reported to follow the same pathway as Acb1, and both depend on a di-acidic motif (Cruz-Garcia et al., 2017). The release of IL-1β, however, does not appear to have a unifying theme, and depending on the cell type or stimulus, different mechanisms have been proposed that include pore formation via gasdermin D, autophagy mediation, and an intermediate membrane compartment (Andrei et al., 2004; Chiritoiu et al., 2019; Dupont et al., 2011; Liu et al., 2016; Rubartelli et al., 1990).
The release of Acb1 and SOD1 is triggered by nutrient starvation upon culturing yeast in potassium acetate. The secreted Acb1 in lower eukaryotes, such as yeast and slime mold, functions in signaling and regulating the starvation-induced cell differentiation program of sporulation (Anjard et al., 1998; Charmpilas et al., 2020; Kinseth et al., 2007; Manjithaya et al., 2010). In the human brain, the Acb1 orthologue ACBP (also known as Diazepam binding inhibitor) modulates GABA (γ-Aminobutyric Acid) receptor signaling, and, more recently in whole animals, ACBP has been identified as an important lipogenic signaling factor (Costa and Guidotti, 1991; Gandolfo et al., 2001; Bravo-San Pedro et al., 2019).
Here, we report that unconventionally secreted SOD1 is enzymatically active in the extracellular space. A starvation-specific secretome revealed enrichment in cytoplasmic enzymes that function in response to increased reactive oxygen species (ROS) production or oxidative stress. We show that ROS production during starvation is required for unconventional protein secretion in order to maintain cells in metabolically active form to survive until their return to normal growth conditions.
Results
Secreted SOD1 is functionally active
Culturing yeast in potassium acetate promotes SOD1 secretion, but is secreted SOD1 functionally active (Cruz-Garcia et al., 2017)? Wild-type and mutant SOD1 linked to the neurodegenerative disorder amyotrophic lateral sclerosis are reportedly secreted in a misfolded state when expressed in a motor neuron cell line (Grad et al., 2014); therefore, the enzymatic activity of extracellular SOD1 cannot be presumed. We employed a zymography-based assay to directly test whether secreted SOD1 is enzymatically active in yeast cells cultured in potassium acetate. A mild cell wall extraction assay developed to detect starvation-specific secretion of Acb1 and SOD1 was performed in nondenaturing conditions (Cruz-Garcia et al., 2017; Curwin et al., 2016). Intracellular and secreted proteins were then separated by native-gel electrophoresis, and a standardized in-gel SOD1 activity assay was performed as described previously (Beauchamp and Fridovich, 1971). Our data revealed that both the intracellular and secreted SOD1 were enzymatically active (Fig. 1 A). A corresponding Western blot indicated that a secreted pool of SOD1 was as active as its intracellular counterpart, suggesting that most, if not all, secreted SOD1 is functionally active (Fig. 1 A).
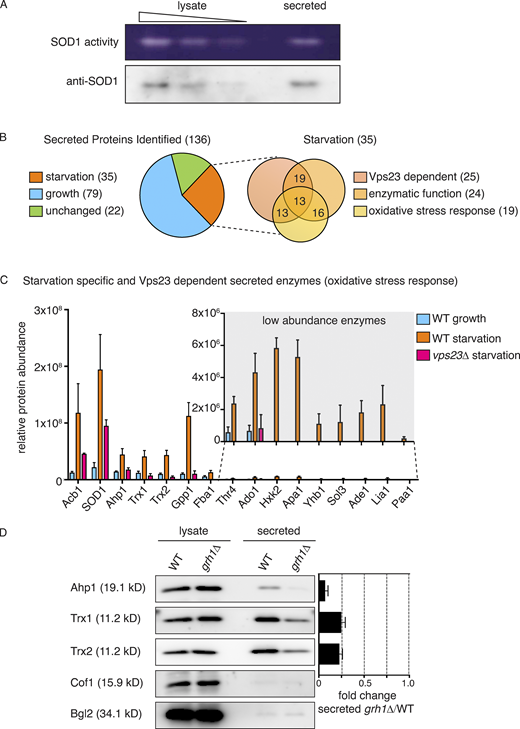
Starvation triggers secretion of cytoplasmic antioxidant enzymes. (A) Wild-type cells were grown to mid-logarithmic phase, washed twice, and cultured in 2% potassium acetate for 2.5 h. Cell wall proteins (secreted) were extracted and concentrated 139× with exchange to TBS. Separately, a smaller aliquot of the same cells was lysed in nondenaturing conditions in TBS (lysate). Lysate and secreted proteins were separated in nondenaturing 12% polyacrylamide gels and either transferred to a nitrocellulose membrane for Western blot analysis (anti-SOD1) or subjected to the zymography-based in-gel SOD activity assay (SOD1 activity). Samples of lysate fractions were loaded in decreasing amounts at a dilution of 1/10 to compare with the concentrated secreted fraction. The final relative loading is 80× more in the secreted fraction. (B) Mass spectrometry analysis of cell wall–extracted proteins (secreted proteins) from wild-type cells growing in nutrient-rich conditions (“growth”) versus cells cultured in potassium acetate for 2.5 h (“starvation”). Cell wall proteins from cells lacking Vps23 were also analyzed under starvation conditions. All three conditions were analyzed in triplicate, and statistical analyses were performed to classify the secreted proteins as growth versus starvation specific or unchanged (using a cutoff of a Log2FoldChange of at least ±1 and a P value of <0.06). Within the starvation-specific group, proteins were further classified as dependent on Vps23 or not for their presence in the cell wall, whether they perform an enzymatic activity, and whether they are annotated to affect response to oxidative stress according to the Saccharomyces Genome Database. Complete analyses of proteins identified and the classifications can be found in Table S1. (C) Chart plotting relative protein abundance of the starvation-specific/Vps23-dependent enzymes classified as affecting response to oxidative stress. SOD1, Ahp1, Trx1, and Trx2 directly regulate cellular redox balance, while the remaining are key enzymes in various cellular processes known to affect response to oxidative stress, such as glycolysis, gluconeogenesis, amino acid or nucleotide biosynthesis, and glycerol metabolism (Acb1 is included only as a reference). The average protein areas from the mass spectrometry analysis (Table S1) of the three triplicates for each protein was calculated, with the corresponding SEM (error bars), for each condition. A zoom of the low abundance enzymes is shown in the inset (note the scale difference). Complete descriptions of the enzymes can be found in Table 1. (D) Wild-type and grh1Δ cells were grown to mid-logarithmic phase, washed twice, and incubated in 2% potassium acetate for 2.5 h. Cell wall proteins were extracted from equal numbers of cells followed by precipitation with TCA (secreted). Lysates and secreted proteins were analyzed by Western blot, and the ratio of the secreted–lysate for the indicated cargo protein was determined and compared with that of wild type in each experiment. Statistical analyses were performed for the indicated unconventional cargo proteins and are represented as fold changes in grh1Δ cells compared with wild type (paired Student’s t test). Ahp1 = 0.07 ± 0.03, P = 0.0604; Trx1 = 0.25 ± 0.04, P = 0.0478; Trx2 = 0.23 ± 0.03, P = 0.0065. Error bars indicate SEM, n = 3. Cof1 is a nonsecreted, cytoplasmic protein used to monitor for cell lysis, while Bgl2 is a conventionally secreted cell wall protein. The loading of the secreted fraction is equivalent to 145× that of the lysate. Based on this, the amount of secreted compared with the total pool was calculated to be 0.3% for Ahp1, 0.6% for Trx1, and 0.8% for Trx2.
Starvation triggers secretion of cytoplasmic antioxidant enzymes. (A) Wild-type cells were grown to mid-logarithmic phase, washed twice, and cultured in 2% potassium acetate for 2.5 h. Cell wall proteins (secreted) were extracted and concentrated 139× with exchange to TBS. Separately, a smaller aliquot of the same cells was lysed in nondenaturing conditions in TBS (lysate). Lysate and secreted proteins were separated in nondenaturing 12% polyacrylamide gels and either transferred to a nitrocellulose membrane for Western blot analysis (anti-SOD1) or subjected to the zymography-based in-gel SOD activity assay (SOD1 activity). Samples of lysate fractions were loaded in decreasing amounts at a dilution of 1/10 to compare with the concentrated secreted fraction. The final relative loading is 80× more in the secreted fraction. (B) Mass spectrometry analysis of cell wall–extracted proteins (secreted proteins) from wild-type cells growing in nutrient-rich conditions (“growth”) versus cells cultured in potassium acetate for 2.5 h (“starvation”). Cell wall proteins from cells lacking Vps23 were also analyzed under starvation conditions. All three conditions were analyzed in triplicate, and statistical analyses were performed to classify the secreted proteins as growth versus starvation specific or unchanged (using a cutoff of a Log2FoldChange of at least ±1 and a P value of <0.06). Within the starvation-specific group, proteins were further classified as dependent on Vps23 or not for their presence in the cell wall, whether they perform an enzymatic activity, and whether they are annotated to affect response to oxidative stress according to the Saccharomyces Genome Database. Complete analyses of proteins identified and the classifications can be found in Table S1. (C) Chart plotting relative protein abundance of the starvation-specific/Vps23-dependent enzymes classified as affecting response to oxidative stress. SOD1, Ahp1, Trx1, and Trx2 directly regulate cellular redox balance, while the remaining are key enzymes in various cellular processes known to affect response to oxidative stress, such as glycolysis, gluconeogenesis, amino acid or nucleotide biosynthesis, and glycerol metabolism (Acb1 is included only as a reference). The average protein areas from the mass spectrometry analysis (Table S1) of the three triplicates for each protein was calculated, with the corresponding SEM (error bars), for each condition. A zoom of the low abundance enzymes is shown in the inset (note the scale difference). Complete descriptions of the enzymes can be found in Table 1. (D) Wild-type and grh1Δ cells were grown to mid-logarithmic phase, washed twice, and incubated in 2% potassium acetate for 2.5 h. Cell wall proteins were extracted from equal numbers of cells followed by precipitation with TCA (secreted). Lysates and secreted proteins were analyzed by Western blot, and the ratio of the secreted–lysate for the indicated cargo protein was determined and compared with that of wild type in each experiment. Statistical analyses were performed for the indicated unconventional cargo proteins and are represented as fold changes in grh1Δ cells compared with wild type (paired Student’s t test). Ahp1 = 0.07 ± 0.03, P = 0.0604; Trx1 = 0.25 ± 0.04, P = 0.0478; Trx2 = 0.23 ± 0.03, P = 0.0065. Error bars indicate SEM, n = 3. Cof1 is a nonsecreted, cytoplasmic protein used to monitor for cell lysis, while Bgl2 is a conventionally secreted cell wall protein. The loading of the secreted fraction is equivalent to 145× that of the lysate. Based on this, the amount of secreted compared with the total pool was calculated to be 0.3% for Ahp1, 0.6% for Trx1, and 0.8% for Trx2.
Identification of a family of secreted antioxidants
Wild-type yeast was cultured in growth or starvation medium, and the cell wall proteins were extracted under the conditions described previously (Curwin et al., 2016) and subsequently analyzed by mass spectrometry. We also analyzed cell wall proteins from cells lacking Vps23, which is required for secretion of Acb1 and SOD1, to assist in identification of proteins exported by the same pathway. All analyses were performed in triplicate with statistical evaluation (see Materials and methods). Using a cutoff of a log2FC (fold change) of at least ±1 and a P value of <0.06, the proteins were classified as starvation versus growth specific or unchanged (the complete mass spectrometry data and statistical analysis are shown in Table S1). A total of 136 secreted proteins were identified, of which 79 were enriched in growth (growth specific), 35 were enriched in starvation (starvation specific), and 22 exhibited no change upon starvation (Fig. 1 B and Table S1). As expected, levels of secreted Acb1 and SOD1 were significantly increased upon starvation (log2FC of 3.38 and 2.94, respectively), and their release was Vps23 dependent (Fig. 1 C and Table S1). Of the 35 starvation-specific proteins, 26 required Vps23 for their export (Fig. 1, B and C; and Table S1). Importantly, none of the starvation-specific secreted proteins contained a signal peptide for their entry into the ER, as predicted by SignalP 4.1 (Petersen et al., 2011). In fact, only 27 of the 136 total proteins identified contained a signal peptide, all of which were found to be secreted specifically in growth (Table S1).
We were surprised to find that, like SOD1, other enzymes directly involved in redox homeostasis were also secreted in a starvation-specific manner. These include the thiol-specific peroxiredoxin Ahp1, which reduces preferentially alkyl hydroperoxides, as well as the cytoplasmic thioredoxins of Saccharomyces cerevisiae, Trx1 and Trx2, which function to reduce redox active proteins, including Ahp1 (Holmgren, 1989; Lee et al., 1999). It is also noteworthy that thioredoxin was previously shown to be secreted unconventionally by mammalian cells (Rubartelli et al., 1992). Closer examination of the starvation-specific proteins revealed that 24 are enzymes that function in conserved processes known to affect cellular redox balance (e.g., glycolysis/gluconeogenesis, amino acid/nucleotide biosynthesis, and glycerol metabolism), and 19 are actually annotated to function in response to oxidative stress according to the Saccharomyces Genome Database (Fig. 1, B and C; and Table 1 and Table S2). The 15 enzymes involved in response to oxidative stress and dependent on Vps23 for their secretion are highlighted in Fig. 1 C and Table 1.
Starvation-specific/Vps23-dependent secreted enzymes with direct or indirect functions in response to oxidative stress
| Gene | Protein | Description |
|---|---|---|
| YJR104C/SOD1 | Superoxide dismutase [Cu-Zn] | Cytosolic copper-zinc superoxide dismutase; detoxifies superoxide |
| YLR109W/AHP1 | Peroxiredoxin | Thiol-specific peroxiredoxin; preferentially reduces alkyl hydroperoxides |
| YLR043C/TRX1 | Thioredoxin-1 | Cytoplasmic thioredoxin isoenzyme; part of thioredoxin system that protects cells against oxidative and reductive stress |
| YGR209C/TRX2 | Thioredoxin-2 | Cytoplasmic thioredoxin isoenzyme; part of thioredoxin system that protects cells against oxidative and reductive stress |
| YIL053W/GPP1 | Glycerol-3-phosphate phosphatase | Hydrolyzes glycerol-3-P; involved in glycerol biosynthesis |
| YKL060C/FBA1 | Fructose-bisphosphate aldolase | Catalyzes conversion of fructose-1,6-bisphosphate to glyceraldehyde-3-P and dihydroxyacetone-P; required for glycolysis and gluconeogenesis |
| YCR053W/THR4 | Threonine synthase | Catalyzes formation of threonine from O-phosphohomoserine |
| YJR105W/ADO1 | Adenosine kinase | Required for the utilization of S-adenosylmethionine |
| YGL253W/HXK2 | Hexokinase-2 | Phosphorylates glucose in cytosol; predominant hexokinase during growth on glucose |
| YCL050C/APA1 | AP4A phosphorylase | Catalyzes phosphorolysis of dinucleoside oligophosphates |
| YGR234W/YHB1 | Nitric oxide oxidoreductase | Flavohemoglobin that plays a role in oxidative and nitrosative stress responses |
| YHR163W/SOL3 | 6-phospho-gluconolactonase | Catalyzes the second step of the pentose phosphate pathway |
| YAR015W/ADE1 | Adenylosuccinate synthetase | Required for “de novo” purine nucleotide biosynthesis |
| YJR070C/LIA1 | Deoxyhypusine hydroxylase | Metalloenzyme that catalyzes hypusine formation |
| YDR071C/PAA1 | Polyamine acetyltransferase | Acetylates polyamines |
We focused on three enzymes mentioned above: Ahp1, Trx1, and Trx2. Like SOD1, they function directly in regulating redox homeostasis and are among the more abundant enzymes identified in the secretome (Fig. 1 C and Table S1). Secretion of SOD1 (and Acb1) requires Grh1 (Cruz-Garcia et al., 2017; Curwin et al., 2016), so we first tested the involvement of Grh1 in secretion of these enzymes. A secretion assay of wild-type and grh1Δ-starved cells revealed that the release of Ahp1, Trx1, and Trx2 upon starvation is also Grh1 dependent (Fig. 1 D). This, along with the finding that they require Vps23 for their release upon nutrient starvation, compels us to conclude that these antioxidant enzymes follow the same pathway of unconventional secretion as SOD1 and Acb1. Secretion of Acb1 and SOD1 was reported to be at ∼1% or less of its total cellular level (Cruz-Garcia et al., 2017; Curwin et al., 2016). Similarly, secretion of Ahp1, Trx1, and Trx2 was a minor fraction of the total protein pool, at 0.3%, 0.6%, and 0.8%, respectively.
Starvation leads to ROS production
Based on the known antioxidant function of these enzymes, we hypothesized that starvation increases ROS production, which signals their unconventional secretion. Direct detection of ROS in living cells by fluorescent dyes or expression of intracellular probes is ambiguous (Belousov et al., 2006; Chen et al., 2010; Gomes et al., 2005). Therefore, to confirm the production of ROS during starvation, we visualized the location of Yap1, the major transcription factor that responds to multiple forms of oxidative stress by its translocation to the nucleus (Kuge et al., 1997; Schnell et al., 1992). As a control, we exposed yeast cells to 1 mM H2O2, a strong oxidative stress to the cell that leads to rapid and complete translocation of Yap1-GFP to the nucleus (Fig. 2 A; Delaunay et al., 2000). Exposure of cells to lower amounts of H2O2 caused Yap1-GFP translocation, but to a much lesser extent (Fig. 2 A). In cells cultured in potassium acetate, Yap1-GFP could be detected in the nucleus by 2 h of starvation and in virtually all cells by 3 h (Fig. 2 B). Clearly then, cells cultured in starvation medium generate and sense oxidative stress, but not to the extent observed upon strong oxidative stress, such as exposure to 1 mM H2O2.

Starvation induces moderate intracellular ROS production, which is required for secretion of antioxidant enzymes and Acb1. (A) Yap1-GFP–expressing cells were grown to mid-logarithmic phase and incubated in the presence or absence of the indicated amount of H2O2 for 20 min before visualization by epifluorescence microscopy. Scale bar = 2 μm. (B) Yap1-GFP–expressing cells were grown to mid-logarithmic phase (growth), washed twice, and cultured in 2% potassium acetate for 2.5 h (starvation). Yap1-GFP was visualized by epifluorescence microscopy. DIC, differential interference contrast. Scale bar = 2 μm. (C) For detection of total protein carbonylation, wild-type cells were grown to mid-logarithmic phase (growth), washed twice, and cultured in 2% potassium acetate for 2.5 h (starvation). Growing cells were also subjected to 1 mM H2O2 treatment for 1 h as a positive control. Subsequently, cells were lysed and treated with streptomycin sulfate to remove nucleic acids, and protein carbonyl groups were labeled with FTC for 2 h in the dark. Proteins were precipitated with TCA, unbound FTC was removed, and protein pellets were resuspended and separated by SDS-PAGE. Fluorescence was visualized with the Typhoon scanner, while total protein was visualized separately by silver staining. Molecular weight (MW) marker in kiloDaltons (kDa). (D) Wild-type cells were grown to low-logarithmic phase and either treated with 10 mM NAC for 2 h (+) or not (−). Subsequently, equal cell numbers were washed twice and incubated in 2% potassium acetate for 2.5 h. Cell wall proteins were extracted and precipitated with TCA (secreted). Lysates and secreted proteins were analyzed by Western blot. The loading of the secreted fraction is equivalent to 145× that of the lysate. The ratio of secreted/lysate for each cargo was determined, and +NAC was normalized to −NAC in each experiment. Statistical analyses were performed for each cargo and are represented as fold change upon NAC treatment (paired Student’s t test). Acb1 = 0.32 ± 0.02, P = 0.0335; SOD1 = 0.27 ± 0.05, P = 0.032; Ahp1 = 0.26 ± 0.03, P = 0.0004; Trx1 = 0.17 ± 0.05, P = 0.0597; Trx2 = 0.13 ± 0.04, P = 0.002. Error bars indicate SEM, n = 3. Cof1 is nonsecreted, cytoplasmic protein used to monitor for cell lysis, while Bgl2 is a conventionally secreted cell wall protein. (E) For growth samples, wild-type cells were grown to mid-logarithmic phase and treated (+) or not (−) with 0.1 mM H2O2 for 1 h. For starvation (starv.) samples, wild-type cells were grown to mid-logarithmic phase, and equal cell numbers were washed twice and incubated in 2% potassium acetate for 2.5 h in the absence (−) or presence (+) of 0.1 mM H2O2. Subsequently, cells and samples were processed as in (A) to analyze secreted versus lysate pools of the indicated cargo proteins. The same statistical analyses were performed to compare the fold change upon H2O2 treatment in the growth or starvation conditions. The observed changes were minor and not found to be statistically significant. Error bars indicate SEM, n = 4. Cof1 is a nonsecreted, cytoplasmic protein used to monitor for cell lysis, while Bgl2 is a conventionally secreted cell wall protein. n.s., not significant.
Starvation induces moderate intracellular ROS production, which is required for secretion of antioxidant enzymes and Acb1. (A) Yap1-GFP–expressing cells were grown to mid-logarithmic phase and incubated in the presence or absence of the indicated amount of H2O2 for 20 min before visualization by epifluorescence microscopy. Scale bar = 2 μm. (B) Yap1-GFP–expressing cells were grown to mid-logarithmic phase (growth), washed twice, and cultured in 2% potassium acetate for 2.5 h (starvation). Yap1-GFP was visualized by epifluorescence microscopy. DIC, differential interference contrast. Scale bar = 2 μm. (C) For detection of total protein carbonylation, wild-type cells were grown to mid-logarithmic phase (growth), washed twice, and cultured in 2% potassium acetate for 2.5 h (starvation). Growing cells were also subjected to 1 mM H2O2 treatment for 1 h as a positive control. Subsequently, cells were lysed and treated with streptomycin sulfate to remove nucleic acids, and protein carbonyl groups were labeled with FTC for 2 h in the dark. Proteins were precipitated with TCA, unbound FTC was removed, and protein pellets were resuspended and separated by SDS-PAGE. Fluorescence was visualized with the Typhoon scanner, while total protein was visualized separately by silver staining. Molecular weight (MW) marker in kiloDaltons (kDa). (D) Wild-type cells were grown to low-logarithmic phase and either treated with 10 mM NAC for 2 h (+) or not (−). Subsequently, equal cell numbers were washed twice and incubated in 2% potassium acetate for 2.5 h. Cell wall proteins were extracted and precipitated with TCA (secreted). Lysates and secreted proteins were analyzed by Western blot. The loading of the secreted fraction is equivalent to 145× that of the lysate. The ratio of secreted/lysate for each cargo was determined, and +NAC was normalized to −NAC in each experiment. Statistical analyses were performed for each cargo and are represented as fold change upon NAC treatment (paired Student’s t test). Acb1 = 0.32 ± 0.02, P = 0.0335; SOD1 = 0.27 ± 0.05, P = 0.032; Ahp1 = 0.26 ± 0.03, P = 0.0004; Trx1 = 0.17 ± 0.05, P = 0.0597; Trx2 = 0.13 ± 0.04, P = 0.002. Error bars indicate SEM, n = 3. Cof1 is nonsecreted, cytoplasmic protein used to monitor for cell lysis, while Bgl2 is a conventionally secreted cell wall protein. (E) For growth samples, wild-type cells were grown to mid-logarithmic phase and treated (+) or not (−) with 0.1 mM H2O2 for 1 h. For starvation (starv.) samples, wild-type cells were grown to mid-logarithmic phase, and equal cell numbers were washed twice and incubated in 2% potassium acetate for 2.5 h in the absence (−) or presence (+) of 0.1 mM H2O2. Subsequently, cells and samples were processed as in (A) to analyze secreted versus lysate pools of the indicated cargo proteins. The same statistical analyses were performed to compare the fold change upon H2O2 treatment in the growth or starvation conditions. The observed changes were minor and not found to be statistically significant. Error bars indicate SEM, n = 4. Cof1 is a nonsecreted, cytoplasmic protein used to monitor for cell lysis, while Bgl2 is a conventionally secreted cell wall protein. n.s., not significant.
Carbonylation of proteins and lipids is an irreversible covalent modification that occurs in response to high levels of ROS and is an indicator of overall cellular damage due to excessive ROS production (Fedorova et al., 2014). Protein carbonylation can be detected by labeling total protein extracts with the fluorescent dye fluorescein-5-thiosemicarbazide (FTC), which specifically reacts with the carbonyl moiety on proteins. Again, we used growing cells exposed to 1 mM H2O2 as a control and compared the level of protein carbonylation in growing and starved cells. Our data revealed that starvation of cells in potassium acetate for 2.5 h did not lead to any detectable level of protein carbonylation, while cells treated with 1 mM H2O2 for 1 h had clearly increased levels of carbonylated proteins (Fig. 2 C). The combined evidence shows that cells starving in potassium acetate produce and respond to low, nondamaging amounts of ROS.
Elevated intracellular ROS is required for secretion
To test whether ROS production is a prerequisite for unconventional protein secretion, we tested the effect of antioxidant N-acetylcysteine (NAC) on secretion. To ensure that NAC was efficiently taken up by cells and to prevent the possibility that it might affect the ability of cells to sense starvation, growing cells were preincubated with 10 mM NAC for 2 h, washed, and resuspended in potassium acetate without NAC, so the starvation period was unchanged from a typical secretion assay. The cell walls were extracted and analyzed as before, revealing that this pretreatment with NAC was sufficient to significantly reduce secretion of all the unconventionally secreted cargoes tested (Fig. 2 D). We can thus conclude that starvation of yeast in potassium acetate leads to ROS production, which is required for unconventional secretion of antioxidant proteins. But is elevated ROS alone sufficient to induce secretion? To test this, we asked whether the addition of exogenous H2O2 to growing cells would lead to secretion of the antioxidant enzymes. H2O2 is the only ROS that can freely cross membranes, while charged ROS, such as the superoxide anion (O2−) or hydroxyl groups (OH−), cannot. We tested the addition of 0.1 mM H2O2, which was sufficient to induce Yap1-GFP translocation to the nucleus to a similar extent as observed upon starvation (Fig. 2, A and B). Growing and starving cells were exposed to 0.1 mM H2O2 for 1 h or the 2.5-h duration of starvation, and secreted antioxidant enzymes were analyzed by Western blot. The results reveal that exogenous addition of 0.1 mM H2O2 does not induce secretion during growth or enhance secretion upon starvation. Therefore, simply creating a pool of cytoplasmic ROS, specifically H2O2, is not sufficient to induce unconventional secretion of these antioxidants. This indicates the significance of specific species of reactive oxygen and/or the source of the ROS in antioxidant secretion.
The major source of ROS in most cell types is the mitochondrion, as by-products of aerobic respiration; therefore, we decided to investigate mitochondrial organization and function during starvation (Murphy, 2009). S. cerevisiae cells growing in glucose actively repress mitochondrial respiration and rely entirely on glycolysis for energy (Ahmadzadeh et al., 1996; Entian and Barnett, 1992). When the carbon source is changed to a nonfermentable one, such as glycerol, ethanol or acetate, cells switch to mitochondrial respiration as the major source of ATP (Boy-Marcotte et al., 1998). Our nutrient starvation conditions consisted of culturing cells in potassium acetate; therefore, we expected an acute decrease in ATP production due to lack of glucose, followed by a switch to mitochondrial respiration for ATP synthesis. To monitor the activity of the mitochondria in starvation conditions, we incubated cells with MitoTracker, which preferentially labels actively respiring mitochondria (Kholmukhamedov et al., 2013). We also expressed a mitochondrial-targetedDsRed fusion protein that labels mitochondria regardless of their activity (Meeusen et al., 2004). In cells grown in glucose, MitoTracker– and mito-DsRed–labeled mitochondria are identified as long tubules (Fig. 3, A and B). Upon a switch to potassium acetate, an increase in mitochondrial membrane potential was immediately apparent, as indicated by greatly increased intensity of MitoTracker labeling (Fig. 3 A). We also noted that mitochondrial morphology was altered, appearing much larger and rounded, as indicated by both the MitoTracker dye and mito-DsRed fusion protein (Fig. 3, A and B). By 2.5 h of starvation, all cells exhibited mitochondria with increased membrane potential and altered morphology. The increase of membrane potential indicates the mitochondria as the most likely source of ROS production during starvation. The altered mitochondrial morphology is reminiscent of the phenotype observed in ER-mitochondria encounter structure mutants, where contact with the ER is lost and mitochondrial division is affected (Kornmann et al., 2009; Murley et al., 2013). This raises the issue regarding the functionality of mitochondria. Mitochondria represent the sole source of ATP in these culture conditions; we therefore tested the effect of the chemical 2,4-DNP, which abolishes the proton gradient necessary for the mitochondrial ATP synthase function without directly affecting electron transport (Loomis and Lipmann, 1948). Treatment with 2,4-DNP strongly affected secretion of all cargo proteins tested in a dose-dependent manner (Fig. 3 C). Therefore, the process of unconventional secretion is ATP dependent, but this result also indicates mitochondria are the source ATP in these conditions. Uncoupling the events of ATP and ROS production in the mitochondria is therefore not feasible, as inhibitors will lead to loss of ATP production and some, such as Antimycin A, which inhibits complex III, will exacerbate ROS generation due to accumulation of upstream electron transport chain components (González-Flecha and Demple, 1995).

Starvation leads to large, rounded mitochondria with increased activity. (A) Wild-type cells were grown to mid-logarithmic phase (growth), washed twice, and cultured in 2% potassium acetate for 2.5 h (starvation). Cells from each condition were labeled with MitoTracker to examine mitochondrial activity and morphology. Cells were visualized by epifluorescence microscopy. DIC, differential interference contrast. Scale bar = 2 μm. (B) Wild-type cells expressing a mitochondrial-targeted DsRed construct were cultured and visualized as in (A). Scale bar = 2 μm. (C) Wild-type cells were grown to mid-logarithmic phase, washed twice, and cultured in 2% potassium acetate for 2.5 h in the presence of low or high 2,4-DNP (100 nM and 1 mM, respectively) and the corresponding low or high amount of DMSO carrier as control (1:2,000 and 1:500, respectively). Cell wall proteins were extracted from equal numbers of cells followed by precipitation with TCA. Lysates and cell wall–extracted proteins were analyzed by Western blot. The loading of the secreted fraction is equivalent to 145× that of the lysate. 2,4-DNP treatment strongly inhibited secretion of all proteins analyzed, with low dose ranging from 15% to 30% reduction, while high-dose 2,4-DNP virtually blocked secretion of the cargo proteins, ranging from 3% to 9% reduction (n = 4). Cof1 is a nonsecreted, cytoplasmic protein used to monitor for cell lysis, while Bgl2 is a conventionally secreted cell wall protein.
Starvation leads to large, rounded mitochondria with increased activity. (A) Wild-type cells were grown to mid-logarithmic phase (growth), washed twice, and cultured in 2% potassium acetate for 2.5 h (starvation). Cells from each condition were labeled with MitoTracker to examine mitochondrial activity and morphology. Cells were visualized by epifluorescence microscopy. DIC, differential interference contrast. Scale bar = 2 μm. (B) Wild-type cells expressing a mitochondrial-targeted DsRed construct were cultured and visualized as in (A). Scale bar = 2 μm. (C) Wild-type cells were grown to mid-logarithmic phase, washed twice, and cultured in 2% potassium acetate for 2.5 h in the presence of low or high 2,4-DNP (100 nM and 1 mM, respectively) and the corresponding low or high amount of DMSO carrier as control (1:2,000 and 1:500, respectively). Cell wall proteins were extracted from equal numbers of cells followed by precipitation with TCA. Lysates and cell wall–extracted proteins were analyzed by Western blot. The loading of the secreted fraction is equivalent to 145× that of the lysate. 2,4-DNP treatment strongly inhibited secretion of all proteins analyzed, with low dose ranging from 15% to 30% reduction, while high-dose 2,4-DNP virtually blocked secretion of the cargo proteins, ranging from 3% to 9% reduction (n = 4). Cof1 is a nonsecreted, cytoplasmic protein used to monitor for cell lysis, while Bgl2 is a conventionally secreted cell wall protein.
Clearly then, starvation in potassium acetate for 2.5 h induces a mild oxidative stress. Western blot of the intracellular pool of antioxidant enzymes indicated there is no up-regulation of the unconventionally secreted cargoes within this time frame, implying the cells have not responded to, or sensed yet, the oxidative stress (Fig. 2 E). This is in line with the fact that Yap1 translocation was observed in ∼100% of the cells only upon 2.5 h of starvation (Fig. 2 B). To gain a more comprehensive understanding of how cells respond to starvation with respect to the intracellular levels of the proteins, we took a quantitative, unbiased approach and performed a total proteome comparison of growing versus starved cells by stable isotope labeling with amino acids in cell culture (SILAC) followed by mass spectrometry. The full data are represented in Table S2 and a volcano plot (Fig. S1). None of the newly identified unconventionally secreted proteins were found to change significantly in abundance upon starvation. In fact, the data indicate few dramatic changes in the proteome of cells cultured for 2.5 h in potassium acetate compared with growing cells; levels of two proteins increased, and nine proteins decreased more than twofold of the 990 proteins identified, again indicating cells were still adapting to the new conditions. The six largest decreases after starvation were in cell wall–modifying enzymes that are secreted conventionally (Fig. S1 and Table S2). This is similar to the secretome data (Fig. 1 and Table S1) where we observed the absence of signal peptide–containing proteins upon starvation. This further shows that during starvation, conventional secretion is inhibited, but there is a net increase in secretion of signal sequence–lacking proteins.

Volcano plot representing the SILAC whole proteome comparison. Positive log2 fold changes represent increases and negative log2 fold changes represent decreases after 2.5 h of starvation (n = 3). Complete details are provided in Materials and methods. FC, fold change; P, statistical significance.
Volcano plot representing the SILAC whole proteome comparison. Positive log2 fold changes represent increases and negative log2 fold changes represent decreases after 2.5 h of starvation (n = 3). Complete details are provided in Materials and methods. FC, fold change; P, statistical significance.
Secretion of antioxidant enzymes during starvation, as well as treatment with NAC, potentiates regrowth upon return to normal conditions
The secreted antioxidants could provide protection to the cell wall or perhaps, through their activity, control the amplitude of ROS-mediated signaling (Dunnill et al., 2017; Hurd et al., 2012). Indeed, the latter hypothesis could explain why such small amounts of enzymes are secreted. Regardless, one would expect some form of advantage to unconventional secretion of antioxidants and proteins such as Acb1. Does secretion of antioxidants and Acb1 offer fitness advantage to cells after exposure to starvation? To test this, we measured the ability of cells to regrow after exposure to starvation for 3.5–4 h. Wild-type cells on average had 4.85 × 10⁶ colony-forming units per milliliter (CFU/ml), while grh1Δ and vps23Δ cells produced only 3.25 × 10⁵ and 7.17 × 10⁵ CFU/ml, respectively (Fig. 4 A). However, this decrease in CFU/ml is not a result of loss of viability as determined by calcein AM fluorescence. Calcein AM is a membrane permeant dye that only fluoresces in metabolically active or viable cells. Cells were also labeled with propidium iodide (PI) that is nonmembrane permeant and only taken up by dead cells. After 3.5–4 h of starvation, wild-type, grh1Δ, and vps23Δ cells showed 91.8%, 84.5%, and 89.9% metabolically active cells by calcein M fluorescence, respectively, and only <2% dead cells for wild-type and grh1Δ, while 9.7% of vps23Δ cells were stained by PI (Fig. 4 B). Therefore, the decrease in CFU/ml observed in grh1Δ and vps23Δ cells was not due to loss of cell viability. Importantly, we have observed that cells lacking Grh1 can adapt over time, leading to loss of phenotypes linked to unconventional secretion. When newly generated deletion strains were tested immediately in the CFU assay after 3.5 h of starvation, a strong and consistent decrease in CFU/ml was observed in all clones tested. However, the severity of this defect decreased when testing the same clones after longer periods (data not shown). How cells adapt to loss of Grh1 is an important new challenge.

NAC treatment prevents loss of ability to regrow after starvation. (A) Wild-type, grh1Δ, and vps23Δ cells were grown overnight in logarithmic phase, washed twice, and cultured in 2% potassium acetate for 3.5–4 h in the absence or presence of 10 mM NAC. Cell density was normalized to 1 OD/ml during the time of starvation. Subsequently, cells were serially diluted to a final dilution of 1:5,000, and 100 µl was plated on rich medium. After 2 d of growth at 30°C, the number of CFU per milliliter was counted. For wild-type cells, n = 7; for grh1Δ cells, n = 4 of freshly generated deletion strains; and for vps23Δ cells, n = 3. All relevant differences were found to be statistically significant by unpaired Student’s t test. Wild type (±NAC), P = 0.0218; wild type – grh1Δ (−NAC), P = 0.009; wild type – vps23Δ (−NAC), P = 0.0322; grh1Δ – grh1Δ (±NAC), P = 0.0049; and vps23Δ – vps23Δ (±NAC), P < 0.0001. Error bars indicate SEM. (B) The starving cultures without NAC from (A) were incubated with 5 µg/ml PI and 1 µg/ml calcein AM (Thermo Fisher Scientific) for 30 min in the dark before standard flow cytometry analysis using a FACSCanto (BD Biosciences). “negative” indicates wild-type cells without PI or calcein AM labeling. Data were analyzed with FlowJo software, v10. Representative dot plots are shown, indicating all three strains were mostly viable after 3.5–4 h of starvation based on calcein AM fluorescence (y axis, Q3). PI fluorescence is in the y axis.
NAC treatment prevents loss of ability to regrow after starvation. (A) Wild-type, grh1Δ, and vps23Δ cells were grown overnight in logarithmic phase, washed twice, and cultured in 2% potassium acetate for 3.5–4 h in the absence or presence of 10 mM NAC. Cell density was normalized to 1 OD/ml during the time of starvation. Subsequently, cells were serially diluted to a final dilution of 1:5,000, and 100 µl was plated on rich medium. After 2 d of growth at 30°C, the number of CFU per milliliter was counted. For wild-type cells, n = 7; for grh1Δ cells, n = 4 of freshly generated deletion strains; and for vps23Δ cells, n = 3. All relevant differences were found to be statistically significant by unpaired Student’s t test. Wild type (±NAC), P = 0.0218; wild type – grh1Δ (−NAC), P = 0.009; wild type – vps23Δ (−NAC), P = 0.0322; grh1Δ – grh1Δ (±NAC), P = 0.0049; and vps23Δ – vps23Δ (±NAC), P < 0.0001. Error bars indicate SEM. (B) The starving cultures without NAC from (A) were incubated with 5 µg/ml PI and 1 µg/ml calcein AM (Thermo Fisher Scientific) for 30 min in the dark before standard flow cytometry analysis using a FACSCanto (BD Biosciences). “negative” indicates wild-type cells without PI or calcein AM labeling. Data were analyzed with FlowJo software, v10. Representative dot plots are shown, indicating all three strains were mostly viable after 3.5–4 h of starvation based on calcein AM fluorescence (y axis, Q3). PI fluorescence is in the y axis.
Interestingly, treatment with NAC increased the CFU/ml of all three strains tested. Wild-type cells produced 8.91 × 10⁶ CFU/ml (1.8× more), while grh1Δ and vps23Δ cells now produced 7.45 × 10⁶ CFU/ml (18× more) and 5.76 × 10⁶ CFU/ml (8× more), respectively (Fig. 4 A). The grh1Δ cells were more restored to wild-type levels than vps23Δ cells. This likely reflects the fact that ESCRTs have numerous functions, particularly in starving cells, that may not be specific to unconventional protein secretion, while Grh1 is more specific to this process.
Conclusion
We have shown that culture of yeast in potassium acetate leads to moderate ROS production through increased activity of morphologically changed mitochondria. The cells respond by exporting functionally active antioxidants and Acb1. Although Acb1 is not known as an antioxidant, it is emerging as an important lipogenic signaling factor secreted upon starvation in metazoans (Bravo-San Pedro et al., 2019; Ryuda et al., 2011). We suggest ROS produced during starvation acts as a signal to release a variety of proteins that include antioxidants in order to maintain cells in a metabolically active, but otherwise dormant form (e.g., sporulation in yeast and Dictyostelium discoideum; Charmpilas et al., 2020; Duran et al., 2010; Kinseth et al., 2007; Manjithaya et al., 2010), until their return to normal growth conditions.
In sum, mitochondria in yeast cultured in acetate are hyperactive, which causes ROS production. ROS and mitochondrial function have already been shown to control IL-1β secretion in mammalian cells (Gabelloni et al., 2013; Jabaut et al., 2013; Zhou et al., 2011). GRASPs are also known to control IL-1β secretion in macrophages via the IRE1/PERK pathway (Chiritoiu et al., 2019). GRASPs and ROS thus emerge as conserved components of the unconventional secretory pathway. Mechanistically, cytoplasmic ROS could be sensed as stress signal by GRASPs/Grh1 and conveyed to the ER’s unfolded protein response pathway, which then navigates cells to respond internally and externally by aptly controlling the production and secretion of chaperones and scavengers. How ROS is produced under starvation, how Grh1 engages in these events, and how ER-specific unfolded protein response is recruited into the pathway of unconventional secretion are important new challenges to understand the mechanism by which cells cope with starvation until their return to normal growth conditions.
Materials and methods
Yeast strains and media
Yeast cells were grown in synthetic complete media (0.67% yeast nitrogen base without amino acids and 2% glucose supplemented with amino acid drop-out mix from FORMEDIUM). Wild-type strain is BY4741 (MATa his3Δ1 leu2Δ0 met15Δ0 ura3Δ0) originally obtained from EUROSCARF. Wild-type strain BY4742 was used for the SILAC analysis (MATalpha his3Δ1 leu2Δ0 lys2Δ0 ura3Δ0). Deletion strains were from the EUROSCARF MATa collection with individual genes replaced by KanMx4. Yap1-GFP was from the Invitrogen collection of C-terminally tagged proteins linked to His3Mx6. Plasmid pVT100U-mtDsRed (J. Nunnari, University of California, Davis, Davis, California) was expressed in strain BY4741 for visualization of mitochondria by microscopy. Multiple new grh1Δ::KanMx4 strains were generated during this study by amplification of the deletion cassette, with flanking homology, from the EUROSCARF strain using primers 5′-AGGGGTGCTGAGACTACTACTG-3′ and 5′-CATTGCCAACTATCGTTTACGTG-3′ and transformation into BY4741. Clones were confirmed by PCR amplifying a confirmation product using forward primer 5′-CATAAAAGAAATGGGCTTGTCGC-3′ that anneals just upstream of the integration site and reverse primer 5′-GAACCTCAGTGGCAAATCCT-3′ that anneals within the deletion cassette.
Antibodies
All antibodies were raised in rabbits and have been described previously. Anti-Ahp1, anti-Trx1, and anti-Trx2 were the generous gifts of Shusuke Kuge (Tohoku Medical and Pharmaceutical University, Sendai, Japan), Eric Muller (University of Washington, Seattle, WA), and Yoshiharu Inoue (Research Institute for Food Science, Kyoto University, Kyoto, Japan), respectively. Anti-Cof1 was kindly provided by John Cooper (Washington University in St. Louis, St. Louis, MO), and anti-Bgl2 was a gift from Randy Schekman (University of California, Berkeley, Berkeley, California). Anti-Acb1 antibody was generated by inoculating rabbits with recombinant, untagged Acb1 purified from bacteria. Specificity of the serum was confirmed by testing lysates prepared from acb1Δ cells. HRP conjugated anti-rabbit secondary was from Jackson Immunoresearch (Cat# 711–035-152).
Cell wall extraction assay
Yeast cells were inoculated at a density of 0.003–0.006 OD600nm/ml in SC medium at 25°C. The following day, when cells had reached OD600nm of 0.4–0.7, equal numbers of cells (16 OD600nm units) were harvested, washed twice in sterile water, resuspended in 1.6 ml of 2% potassium acetate, and incubated for 2.5 h. When growing cells were to be analyzed, 16 OD600nm units were directly harvested. The cell wall extraction buffer (100 mM Tris-HCl, pH 9.4, and 2% sorbitol) was always prepared fresh before use and kept on ice. To ensure no loss of cells and to avoid cell contamination in the extracted buffer, 2-ml tubes were siliconized (Sigmacote) before collection. Cells were harvested by centrifugation at 3,000×g for 3 min at 4°C, medium or potassium acetate was removed, and 1.6 ml of cold extraction buffer was added. Cells were resuspended gently by inversion and incubated on ice for 10 min, after which they were centrifuged as before, 3,000×g for 3 min at 4°C, and 1.3 ml of extraction buffer was removed to ensure no cell contamination. The remaining buffer was removed, the cells were resuspended in 0.8 ml of cold TE buffer (Tris-HCl, pH 7.5, and EDTA) with protease inhibitors (aprotinin, pepstatin, and leupeptin; Sigma), and 10 µl was boiled directly in 90 µl of 2× sample buffer (lysate). For Western blotting analysis, 30 µg of BSA (Sigma) carrier protein and 0.2 ml of 100% TCA (Sigma) was added to the extracted protein fraction. Proteins were precipitated on ice for 1 h, centrifuged 16,000 g for 30 min, and boiled in 50 µl 2× sample buffer. For detection, proteins (10 µl each of lysate or wall fractions) were separated in a 12% polyacrylamide gel before transfer to 0.2-µm nitrocellulose (GE Healthcare) for detection by Western blotting. For preparation of cell wall extracts for mass spectrometry analysis, no BSA carrier protein was added, and the proteins were precipitated with acetone and not TCA.
“In-gel” SOD activity assay
After starvation in 2% potassium acetate for 2.5 h, 8 × 16 OD600nm of cells were subjected to the cell wall extraction protocol as described above. Then, cell wall extracts were pooled and concentrated using Amicon Ultra centrifugal filter 3K devices with buffer exchange into TBS (50 mM Tris-HCl, pH 7.5, and 150 mM NaCl) up to a final volume of 75 µl. Also, after incubation in 2% potassium acetate, 16 OD600nm of cells were lysed by bead beating with glass beads in 800 µl of TBS containing protease inhibitors. Lysates were clarified by centrifugation at 16,000 g for 15 min. In-gel SOD activity assay was performed on 12% polyacrylamide gels as described earlier (Beauchamp and Fridovich, 1971). Lysates and concentrated cell wall extracts were separated under native conditions for 7 h at 40 mA. Following completion of the run, the gels were incubated in 2.45 mM Nitroblue Tetrazolium (Sigma) in distilled water for 20 min at room temperature in the dark, followed by an additional 15-min incubation with 28 µM riboflavin (Sigma) and 28 mM TEMED (Sigma) in 50 mM potassium phosphate buffer, pH 7.8. Then, the gels were rinsed twice in distilled water, illuminated under a bright white light for 20–30 min, and photographed using an Amersham Biosciences Imager 600. Image processing was performed with ImageJ 1.45r software.
Preparation of protein samples for secretome mass spectrometry
Samples were reduced with dithiothreitol (27 nmol, 1 h, 37°C) and alkylated in the dark with iodoacetamide (54 nmol, 30 min, 25°C). The resulting protein extract was first diluted 1/3 with 200 mM NH4HCO3 and digested with 0.9 µg LysC (Wako; cat #129–02541) overnight at 37°C and then diluted 1/2 and digested with 0.9 µg of trypsin (Promega; cat #V5113) for 8 h at 37°C. Finally, the peptide mix was acidified with formic acid and desalted with a MicroSpin C18 column (The Nest Group, Inc.) before liquid chromatography tandem-mass spectrometry analysis.
Preparation of samples for total proteome SILAC analysis
Yeast strain BY4742, which is an auxotroph for lysine, was grown for 2 d in 5 ml of SC media containing either 1 mM L-lysine (light) or 1 mM L-lysine [13C615N2] (heavy) until stationary phase. Cultures were then diluted to OD600nm ∼0.005 in 50 ml fresh medium of the same composition until reaching a density of 0.2–0.6. The heavy labeled cells were then washed twice in water and starved in 2% potassium acetate for 2.5 h. It was not possible to mix the cultures before lysis, as the starved cells would sense the nutrients from the growing culture. Therefore, 40 OD units each of growing and starved cells were first pelleted, resuspended in ice-cold lysis buffer (6 M urea, 50 mM Tris–Cl, pH 8.0, 0.5% SDS, 0.5% NP-40, and 10 mM DTT), and then mixed 1:1. Total cell extracts were prepared in triplicates by glass-bead disruption in lysis buffer. After removal of cell debris by centrifugation at 2,000 g, proteins were precipitated by the addition of TCA to a final concentration of 20%. The protein pellet was washed with ice-cold acetone, which was removed by drying the pellet at 50°C. Proteins were resuspended in a small amount of buffer (6 M urea and 50 mM Tris–Cl, pH 7.5) and quantified by the BCA quantification method (Bio-Rad). Urea concentration was reduced to 4 M, and the pH was adjusted to 8.8 with 25 mM Tris–HCl. Samples were digested with Lys-C in a 1:10 enzyme–protein ratio and desalted using an Oasis Plus HLB cartridge (Waters).
Mass spectrometric analysis
The peptide mixes were analyzed using a LTQ-Orbitrap XL (secretome) and an Orbitrap Fusion Lumos (SILAC) coupled to an EasyLC liquid chromatography system (Thermo Fisher Scientific). Peptides were loaded directly onto the analytical column at a flow rate of 1.5–2 µl/min using a wash-volume of four times the injection volume and were separated by reversed-phase chromatography using 25- and 50-cm C18 columns.
The mass spectrometer was operated in data-dependent mode with one full mass spectrometric scan per cycle followed by the sequential fragmentation of the 10 most intense ions with multiple charges.
The mass spectrometry proteomics data have been deposited in the ProteomeXchange Consortium via the PRIDE (Vizcaíno et al., 2016) partner repository, with the dataset identifiers PXD010849 (secretome) and PXD016815 (SILAC).
Data analysis
Proteome Discoverer software suite (v1.4; Thermo Fisher Scientific) and the Mascot search engine (v2.5; Matrix Science; Perkins et al., 1999) were used for the secretome peptide identification, whereas SILAC data were analyzed with MaxQuant software suite (v1.5.4.3) and the Andromeda search engine. Samples were searched against an S. cerevisiae database (version February 2014) containing a list of common contaminants and all the corresponding decoy entries. Trypsin (secretome) or Endopeptidase LysC (SILAC) was chosen as enzyme, and carbamidomethylation (C) was set as a fixed modification, whereas oxidation (M), acetylation, and (N-terminal) were used as variable modifications. The SILAC samples also included 13C6,15N2-Lys (+8) as variable modification. Searches were performed using a peptide tolerance of 4.5–7 ppm and a product ion tolerance of 0.5 D, and the resulting data files were filtered for FDR < 5%. Volcano plots of SILAC data were generated using R studio Bioconductor package EnhancedVolcano (Blighe et al., 2019).
Detection of total protein carbonylation
For detection of total protein carbonylation, wild-type cells were grown to mid-logarithmic phase (“growth”), washed twice, and cultured in 2% potassium acetate for 2.5 h (“starvation”). Growing cells were also subjected to 1 mM H2O2 treatment for 1 h as a positive control. Subsequently, cells were lysed by bead beating in carbonylation buffer (20 mM Na-phosphate, pH 6, 1 mM EDTA, and 6 M urea, plus protease inhibitors), and cell extracts were cleared by centrifugation at 10,000 g for 10 min at 4°C. Supernatants were treated with 1% streptomycin sulfate for 5 min to remove nucleic acids and cleared again by centrifugation at 10,000 g for 5 min at 4°C. Extracts were diluted to 1 µg/µl in carbonylation buffer, and 200 µl was labeled with 50 mM FTC (Fluka) for 2 h in the dark. Proteins were precipitated with TCA, and unbound FTC was removed by washing five times in ice-cold ethanol/ethyl acetate (1:1). Protein pellets were resuspended in 50 µl dissolving buffer (20 mM Na-phosphate, pH 8, 1 mM EDTA, and 8 M urea), and samples were prepared with 5× sample buffer without bromophenol blue for separation in a 12% SDS-acrylamide gel by running 5 µg of protein per lane in two separate gels. Total protein was visualized in one gel by silver staining, while fluorescent carbonylated proteins were visualized in the second gel using an Amersham Biosciences Typhoon scanner.
Fluorescence microscopy
After incubation in the appropriate medium, cells were harvested by centrifugation at 3,000 g for 3 min, resuspended in a small volume of the corresponding medium, spotted on a microscope slide, and imaged live with a DMI6000 B microscope (Leica Microsystems) equipped with a DFC 360FX camera (Leica Microsystems) using an HCX Plan Apochromat 100× 1.4 NA objective. Images were acquired using LAS AF software (Leica Microsystems), and processing was performed with ImageJ 1.47n software. For MitoTracker staining, 10 OD600nm of cells were harvested by centrifugation at 3,000 g for 4 min, resuspended at 5 OD600nm/ml in 100 nM MitoTracker Red CMXRos (Molecular Probes) diluted in phosphate-buffered saline, and incubated in the dark for 30 min. Then, ∼1.5 OD600nm of cells were harvested by centrifugation at 3,000 g for 3 min, resuspended in a small volume, spotted on a microscopy slide, and subsequently live imaged.
Statistical analysis
Statistical significance was determined by two-tailed t test in all the indicated experiments (secretion assays and CFU per milliliter formation after starvation). Data distribution was determined to be normal in the wild-type condition by Shapiro-Wilk test, where more replicates were performed and assumed to be normal in the deletion strains when n = 4 or less. Analyses were performed using GraphPad Prism software.
Online supplemental material
Fig. S1 shows a volcano plot of the SILAC data, highlighting minor changes in the proteome after starvation. Table S1 shows the complete secretome mass spectrometry data, including subsequent statistical analysis, and the classification of each identified protein as growth specific, starvation specific, or unchanged; as Vps23 dependent or Vps23 independent; or as containing or lacking a signal peptide. Table S2 shows the complete data of total proteome comparison of growth versus starvation by SILAC and subsequent statistical analysis. The 35 starvation-specific secreted cargoes are also highlighted separately, indicating no significant changes.
Acknowledgments
We thank members of the Malhotra laboratory for their valuable discussions. We also thank Dr. Elena Hidalgo (Universitat Pompeu Fabra [UPF]) and her laboratory members for their expertise and technical assistance related to oxidative stress. V. Malhotra is an Institució Catalana de Recerca i Estudis Avançats professor at the Centre for Genomic Regulation (CRG). We also acknowledge the Centre for Genomic Regulation/UPF Flow Cytometry Unit.
This work was funded by grants from the Spanish Ministry of Economy and Competitiveness (BFU2013-44188-P and BFU2016_75372-P to V. Malhotra). We acknowledge support of the Spanish Ministry of Economy, Industry and Competitiveness to the European Molecular Biology Laboratories (EMBL) partnership, the Programmes “Centro de Excelencia Severo Ochoa 2013–2017” (SEV-2012-0208 and SEV-2013-0347), and the Centres de Recerca de Catalunya (CERCA) Program/Generalitat de Catalunya. The mass spectrometry data were acquired at the Centre for Genomic Regulation/UPF Proteomics Unit, which is part of Proteored, PRB3, and is funded by El Instituto de Salud Carlos III (ISCIII) and European Regional Development Fund (ERDF; grant PT17/0019 of the PE I+D+i 2013–2016). This work reflects only the authors’ views, and the European Union (EU) community is not liable for any use that may be made of the information contained therein.
The authors declare no competing financial interests.
Author contributions: Following the CRediT nomenclature, D. Cruz-Garcia and N. Brouwers contributed to the investigation, resources, and visualization. A.J. Curwin contributed to the latter, as well as conceptualization, formal analysis, project administration, supervision, methodology, validation, writing—original draft and writing—review, and editing. V. Malhotra contributed to the conceptualization, funding acquisition, project administration, supervision, writing—original draft and writing—review, and editing.

