


Many cancer cells exhibit increased amounts of paucimannose glycans, which are truncated N-glycan structures rarely found in mammals. Paucimannosidic proteins are proposedly generated within lysosomes and exposed on the cell surface through a yet uncertain mechanism. In this study, we revealed that paucimannosidic proteins are produced by lysosomal glycosidases and secreted via lysosomal exocytosis. Interestingly, lysosomal exocytosis preferentially occurred in the vicinity of focal adhesions, protein complexes connecting the actin cytoskeleton to the extracellular matrix. Through genome-wide knockout screening, we identified that MYO18B, an actin crosslinker, is required for focal adhesion maturation, facilitating lysosomal exocytosis and the release of paucimannosidic lysosomal proteins to the extracellular milieu. Moreover, a mechanosensitive cation channel PIEZO1 locally activated at focal adhesions imports Ca2+ necessary for lysosome-plasma membrane fusion. Collectively, our study unveiled an intimate relationship between lysosomal exocytosis and focal adhesion, shedding light on the unexpected interplay between lysosomal activities and cellular mechanosensing.
Introduction
Lysosomes are intracellular organelles that break down biomolecules such as nucleic acids, proteins, lipids, and carbohydrates. The interior of lysosomes is maintained in an acidic environment, harboring ∼70 different hydrolytic enzymes (Braulke et al., 2024; Mindell, 2012). In addition to digestive functions, lysosomes play various roles, including serving as hubs for nutrient sensing and metabolism (Settembre and Perera, 2023). Among these multiple functions, lysosomal exocytosis, where lysosomes fuse with the plasma membrane, is a dynamic process involving the extracellular release of enzymes and other soluble cargoes from lysosomes and the exposure of lysosomal membrane proteins on the cell surface (Buratta et al., 2020). The induction of lysosomal exocytosis in non-secretory cells was initially discovered in response to host cell invasion of Trypanosoma cruzi, the protozoan parasite responsible for Chagas disease in humans (Tardieux. et al., 1992). Subsequent studies revealed that lysosomal exocytosis is a prevalent cellular response to plasma membrane injuries resulting from various extracellular stimuli, including pathogenic infections, bacterial pore-forming toxins, and mechanical wounding (Reddy. et al., 2001; von Hoven et al., 2017; Westman et al., 2022). This process plays a crucial role in repairing and restoring plasma membrane integrity.
Mechanistically, lysosomal exocytosis encompasses two relatively independent steps: anterograde vesicle transport and lysosome–plasma membrane fusion. The anterograde trafficking of lysosomes is primarily regulated by the small GTPase Arl8B, which orchestrates the movement of lysosomes toward the plasma membrane, preparing them for the subsequent fusion process (Hofmann and Munro, 2006). Arl8B is recruited to the lysosomal membrane by the BLOC one related complex (BORC) (Pu et al., 2015). In the GTP-bound state, Arl8B engages its effector, SKIP, which interacts with the kinesin-1 motor via kinesin light chains (Rosa-Ferreira and Munro, 2011). Alternatively, a mechanism involving Rab7A, initially known for its role in retrograde trafficking of lysosomes, has also been identified to contribute to anterograde trafficking (Johansson et al., 2007). Rab7A achieves this by recruiting FYCO1, which interacts with kinesin-1, supporting the anterograde movement of lysosomes (Raiborg et al., 2015). Once reaching the cell periphery, lysosomes that are likely tethered to cortical actin filaments fuse with the plasma membrane through interactions between Rab3A and non-muscle myosin IIA (NM IIA) (Encarnação et al., 2016). The fusion between lysosome and plasma membrane is a Ca2+-dependent process mediated by the soluble N-ethylmaleimide-sensitive factor attachment protein receptor (SNARE) proteins. The v-SNAREs located on lysosomes (VAMP7/8) interact with t-SNAREs on the plasma membrane (SNAP-23 and syntaxin-4) to form a trans-SNARE complex, a crucial step preceding lysosomal–plasma membrane fusion (Rao et al., 2004). Upon an elevation of intracellular Ca2+ level, synaptotagmin VII, a Ca2+-sensitive tethering factor on the lysosomal membrane, triggers the conformational change of trans-SNARE complex, leading to the fusion of the two membranes (Flannery et al., 2010).
In cases of plasma membrane injuries, the Ca2+ required for triggering lysosomal exocytosis is imported from the extracellular space. However, recent studies have revealed that lysosomal exocytosis occurs independent of external plasma membrane insults. For example, in Caenorhabditis elegans, invasive cells at invadopodia actively employ lysosomal exocytosis to breach the basement membrane (Naegeli et al., 2017). Cancer cells overexpressing acidic addicted phosphatase of regenerating liver 3 (PRL3) promote lysosomal exocytosis to export excess protons to support their survival in acidic microenvironments (Funato et al., 2020). β-Coronaviruses, including severe acute respiratory syndrome coronavirus 2 (SARS-CoV-2), exploit lysosomal exocytosis for their egress from host cells (Ghosh et al., 2020). These studies suggest that cells have intrinsic mechanisms to initiate lysosomal exocytosis, which remains unexplored.
Here, we initially focused on proteins modified by paucimannose, which is an understudied type of truncated N-glycans thought to mainly reside in cellular lysosomes or lysosome-like organelles under homeostatic conditions. Paucimannosidic N-glycans are characterized by a chitobiose core linked to up to three mannose residues, with the possibility of core fucosylation, resulting in glycan structures with the composition Man1-3GlcNAc2Fuc0-1 (Tjondro et al., 2019). Although paucimannose structures are prevalent in plants and invertebrates (Dam et al., 2013; Paschinger et al., 2019), they are relatively rare in human-derived samples (Tjondro et al., 2019). However, various tumor tissues and cancer cell lines display elevated paucimannose levels compared with their corresponding normal tissues and noncancerous cell lines (Chatterjee et al., 2019; Kawahara et al., 2021). Moreover, paucimannose has been detected on the surface and in the secretome of cancer cells (Chatterjee et al., 2019). Similar to mannose-6-phosphate, which is a key glycan signature regulating the trafficking of lysosomal proteins (Braulke and Bonifacino, 2009), paucimannose may also be involved in specific aspects of lysosomal function. However, the biosynthesis and trafficking mechanisms of these cancer-related paucimannosidic proteins remain unknown, preventing a comprehensive understanding of their dynamics and functional relevance in tumorigenic processes.
In this study, we demonstrated that paucimannosidic proteins are generated by lysosomal glycoside hydrolases and are exposed on the cell surface through lysosomal exocytosis. A pooled genome-wide gene screening identified MYO18B, an unconventional myosin, as a crucial regulator of lysosomal exocytosis in unstimulated “resting” cells. Moreover, our data demonstrated that lysosomal exocytosis preferentially occurs in the vicinity of focal adhesions (FAs), a protein complex connecting the actin cytoskeleton and extracellular matrix (ECM). MYO18B, as an actin crosslinker, promotes the assembly of actomyosin bundles, which connect to and facilitate the maturation of FAs. The contractile force generated by actomyosin bundles is transmitted to FAs, which potentially activates mechanosensitive cation channels (MSCs), including PIEZO1. This activation facilitates Ca2+ import from the extracellular space, triggering lysosomal exocytosis.
Results
Paucimannose generated in lysosomes is exposed on the cell surface via lysosomal exocytosis
To identify the specific proteins that are modified by paucimannosidic N-glycans, glycoproteomic analysis was performed in three human cell lines, HeLa (human cervical cancer cell line), THP-1 (human monocytic leukemia cell line), and HEK293 (human embryonic kidney cell line). The analysis identified 1,087, 607, and 1,157 intact glycopeptides derived from 202, 133, and 189 glycoproteins in HeLa, THP-1, and HEK293 cells, respectively (Table S1). Consistent with previous studies (Chatterjee et al., 2019), 33, 37, and 36 paucimannosidic peptides originating from 15, 16, and 17 glycoproteins were detected in HeLa, THP-1, and HEK293 cells, constituting 3.23%, 5.63%, and 3.35% of the total N-glycoproteome in these cell lines, respectively (Fig. 1, A and B; and Table S2). Gene ontology and pathway enrichment analysis of the glycoproteomic data indicated that paucimannosidic proteins were predominantly of lysosomal origin (21 of 34 [61.7%] proteins) in all three cell lines. Paucimannosidic peptides derived from both lysosomal membrane proteins (e.g., lysosomal associated membrane protein 1, LAMP1) and soluble proteins (e.g., prosaposin, PSAP) were detected (Fig. 1 B). This is in line with current literature, suggesting that paucimannosidic proteins reside primarily in lysosomes or, in neutrophils, in lysosome-like organelles i.e., azurophilic granules (Kawahara et al., 2023).

Lysosomal HEX-catalyzed paucimannose is exposed on the cell surface via lysosomal exocytosis. (A) Paucimannosidic proteins identified in HeLa, THP-1, and HEK293 cell lines. Paucimannosidic proteins are plotted on the x-axis, and the detected number of paucimannosidic peptides is plotted on the y-axis. Proteins of known lysosomal origin are indicated in red. Insert: Gene ontology (GO) enrichment analysis (cell component, CC) based on the paucimannosidic proteins detected in HeLa, THP-1, and HEK293 cells. See also Tables S1 and S2 for data. (B) Representative MS2 spectra of paucimannosidic peptides derived from LAMP1 (UniProt ID: P11279) and PSAP (UniProt ID: P07602) in HeLa cells. (C) Quantitative glycomics analysis of the relative abundance and the ratio of the paucimannose precursor Man3GlcNAc4Fuc1 and the paucimannosidic Man3GlcNAc2Fuc1 structure in WT, HEXA-, and HEXB-KO cells. Bar plots: ratio metric assessment of the relative abundance of relevant glycan structures in WT versus KO cells. (n = 3, independently analyzed samples, mean ± SD, unpaired one-tailed t test; *P ≤ 0.05, **P ≤ 0.01). (D) Representative confocal laser scanning microscopy (CLSM) images of WT HeLa cells stained by Mannitou Ab under unpermeabilized conditions with or without pitstop2 treatment. Bar, 10 µm. (E) Quantitative analysis of cell surface paucimannose level with or without pitstop2 treatment using Mannitou Ab. RFI, relative fluorescent intensity. The mean ± SD fluorescent intensity of mock treatment was set to unity (n = 15 images; N = 3 biological replicates; unpaired two-tailed t test; ***P ≤ 0.001). See also Fig. S1 A. (F) Representative CLSM images of WT HeLa cells stained by Mannitou Ab under unpermeabilized conditions with or without brefeldin A or vacuolin-1 treatment. Bar, 10 µm. (G) Quantitative analysis of cell surface paucimannose level with or without brefeldin A or vacuolin-1 treatment. The mean ± SD fluorescent intensity of mock treatment was set to unity (n = 15 images; N = 3 biological replicates; One-way ANOVA with Dunnett correction; ns, P > 0.05; **P ≤ 0.01). (H) Representative CLSM images of WT HeLa cells stained by Mannitou Ab under unpermeabilized conditions with or without ionomycin treatment. Bar, 10 µm. (I) Quantitative analysis of cell surface paucimannose level with or without ionomycin treatment. The mean ± SD fluorescent intensity of ionomycin treatment was set to unity (n = 15 images; N = 3 biological replicates; unpaired two-tailed t test; ***P ≤ 0.001). (J) Immunoblotting of biotinylated plasma membrane proteins. Cells were incubated in Hanks’ balanced salt solution (HBSS) containing Mg2+ and Ca2+ with or without ionomycin for 5 min at 37°C before biotinylation. After the isolation of biotinylated cell surface proteins by NeutrAvidin beads, CD44, LAMP1, and paucimannosidic proteins were detected by antibodies. Source data are available for this figure: SourceData F1.
Lysosomal HEX-catalyzed paucimannose is exposed on the cell surface via lysosomal exocytosis. (A) Paucimannosidic proteins identified in HeLa, THP-1, and HEK293 cell lines. Paucimannosidic proteins are plotted on the x-axis, and the detected number of paucimannosidic peptides is plotted on the y-axis. Proteins of known lysosomal origin are indicated in red. Insert: Gene ontology (GO) enrichment analysis (cell component, CC) based on the paucimannosidic proteins detected in HeLa, THP-1, and HEK293 cells. See also Tables S1 and S2 for data. (B) Representative MS2 spectra of paucimannosidic peptides derived from LAMP1 (UniProt ID: P11279) and PSAP (UniProt ID: P07602) in HeLa cells. (C) Quantitative glycomics analysis of the relative abundance and the ratio of the paucimannose precursor Man3GlcNAc4Fuc1 and the paucimannosidic Man3GlcNAc2Fuc1 structure in WT, HEXA-, and HEXB-KO cells. Bar plots: ratio metric assessment of the relative abundance of relevant glycan structures in WT versus KO cells. (n = 3, independently analyzed samples, mean ± SD, unpaired one-tailed t test; *P ≤ 0.05, **P ≤ 0.01). (D) Representative confocal laser scanning microscopy (CLSM) images of WT HeLa cells stained by Mannitou Ab under unpermeabilized conditions with or without pitstop2 treatment. Bar, 10 µm. (E) Quantitative analysis of cell surface paucimannose level with or without pitstop2 treatment using Mannitou Ab. RFI, relative fluorescent intensity. The mean ± SD fluorescent intensity of mock treatment was set to unity (n = 15 images; N = 3 biological replicates; unpaired two-tailed t test; ***P ≤ 0.001). See also Fig. S1 A. (F) Representative CLSM images of WT HeLa cells stained by Mannitou Ab under unpermeabilized conditions with or without brefeldin A or vacuolin-1 treatment. Bar, 10 µm. (G) Quantitative analysis of cell surface paucimannose level with or without brefeldin A or vacuolin-1 treatment. The mean ± SD fluorescent intensity of mock treatment was set to unity (n = 15 images; N = 3 biological replicates; One-way ANOVA with Dunnett correction; ns, P > 0.05; **P ≤ 0.01). (H) Representative CLSM images of WT HeLa cells stained by Mannitou Ab under unpermeabilized conditions with or without ionomycin treatment. Bar, 10 µm. (I) Quantitative analysis of cell surface paucimannose level with or without ionomycin treatment. The mean ± SD fluorescent intensity of ionomycin treatment was set to unity (n = 15 images; N = 3 biological replicates; unpaired two-tailed t test; ***P ≤ 0.001). (J) Immunoblotting of biotinylated plasma membrane proteins. Cells were incubated in Hanks’ balanced salt solution (HBSS) containing Mg2+ and Ca2+ with or without ionomycin for 5 min at 37°C before biotinylation. After the isolation of biotinylated cell surface proteins by NeutrAvidin beads, CD44, LAMP1, and paucimannosidic proteins were detected by antibodies. Source data are available for this figure: SourceData F1.
Guided by our previous observation that N-acetyl-β-hexosaminidase (HEX) activity is required for paucimannose generation in HL60 (human promyelocytic leukemia) cells (Ugonotti et al., 2022), we then investigated whether a similar mechanism governs paucimannose production in HeLa cells. To explore this, the genes encoding the HEX α- and β-subunits, HEXA and HEXB, were separately knocked out in HeLa cells. Glycomic analysis of HEXA- and HEXB-KO cells showed a notable shift in the ratio of the paucimannose precursor, Man3GlcNAc4Fuc1, to the paucimannosidic Man3GlcNAc2Fuc1 structure, increasing from 0.43 ± 0.12 in WT cells to 0.76 ± 0.20 and 1.18 ± 0.18 in KO cells, respectively (Fig. 1 C). These results indicate that lysosomal HEXs play significant roles in paucimannose generation in HeLa cells, consistent with similar mechanisms observed in HL60 cells and human primary neutrophils.
We have previously indicated that paucimannosidic proteins may also be secreted by cancer cells to the cell surface or extracellular space (Chatterjee et al., 2019). Consistent with this previous report, we were able to detect paucimannosidic epitopes on the surface of HeLa cells under unpermeabilized conditions using Mannitou Ab, a paucimannose-specific antibody (Fig. 1 D). Staining was observed as dot-like structures on the cell surface. This detection was enhanced by the broad-spectrum endocytosis inhibitor pitstop2, but almost completely abolished by a cell membrane-permeable Ca2+ chelator EGTA, suggesting that the presence of paucimannose on the cell surface is a result of membrane dynamics involving exocytosis and endocytosis (Fig. 1, D and E; and Fig. S1 A). To elucidate the predominant pathway for paucimannose exposure, two potential mechanisms were explored: conventional secretory pathway and lysosomal exocytosis. Brefeldin A, an inhibitor for COPI-mediated vesicle formation, was employed to block the transport from the endoplasmic reticulum-Golgi apparatus to the plasma membrane. In parallel, vacuolin-1, a PIKfyve inhibitor known to disrupt lysosome-plasma membrane fusion, was employed to inhibit lysosomal exocytosis (Sano et al., 2016). Immunofluorescence results showed that brefeldin A had a mild effect, whereas vacuolin-1 nearly completely inhibited Mannitou Ab recognition of paucimannose on the cell surface, indicating that lysosomal exocytosis is the more likely route for paucimannose secretion (Fig. 1, F and G). To further validate this finding, ionomycin, a Ca2+ ionophore that induces lysosomal exocytosis by importing Ca2+ into the cytoplasm from the extracellular space, was used. Treatment with ionomycin caused prominent secretion of paucimannose on the cell surface, as evidenced by enhanced immunofluorescence staining (Fig. 1, H and I). Cells were treated with or without ionomycin and cell surface proteins were biotinylated and purified to detect the enhancement of paucimannose exposure by lysosomal exocytosis. Immunoblotting analysis revealed that cell surface levels of LAMP1 and proteins detected by Mannitou Ab increased in samples treated with ionomycin, whereas CD44, a plasma membrane protein, was detected at similar levels in samples with or without ionomycin (Fig. 1 J). These results indicate that paucimannosidic proteins are formed by HEX α and β subunits in lysosomes and are exposed on the cell surface through lysosomal exocytosis.
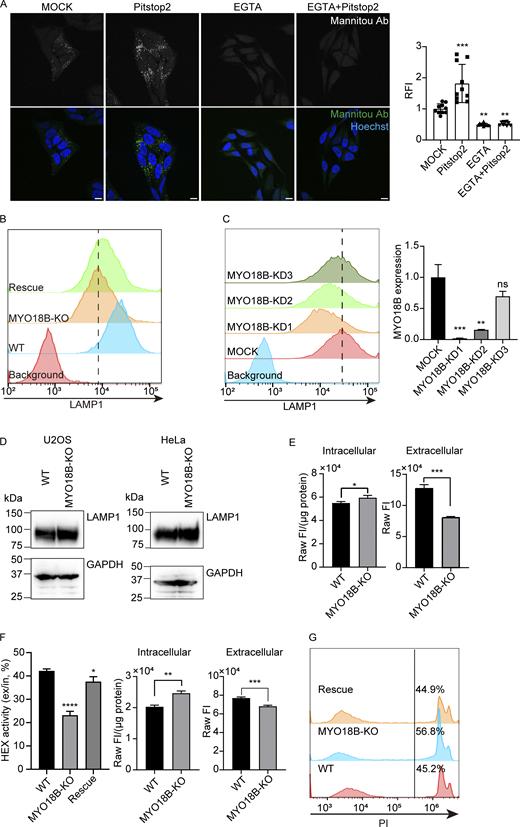
MYO18B is essential for lysosomal exocytosis.(A) Left: Representative CLSM images of WT HeLa cells stained by Mannitou Ab under unpermeabilized conditions with EGTA and/or Pitstop2 treatment. Bars, 10 µm. Right: Quantitative analysis of cell-surface paucimannose level with EGTA and/or Pitstop2 treatment. The mean ± SD fluorescent intensity of mock treatment was set to unity (n = 10 images; N = 2 biological replicates; One-way ANOVA with Dunnett correction; **P ≤ 0.01; ***P ≤ 0.001). Related to Fig. 1. (B) Representative flow cytometry result of cell-surface LAMP1 level in WT, MYO18B-KO and MYO18B-rescued U2OS cell lines. Related to Fig. 2. (C) Left: Representative flow cytometry results of cell-surface LAMP1 level in MYO18B knock-down U2OS cells. Right: RT-qPCR assessment of MYO18B mRNA level in MYO18B knock-down U2OS cells. Expression of MYO18B was normalized with hypoxanthine-guanine phosphoribosyl transferase (HPRT) (mean ± SD; n = 3, technical replicates; One-way ANOVA with Dunnett correction; ns, P > 0.05; **P ≤ 0.01; ***P ≤ 0.001). Related to Fig. 2. (D) Western blotting detection of total LAMP1 level in WT and MYO18B-KO HeLa and U2OS cells. Related to Fig. 2. (E) Raw fluorescent intensity detected in HEX activity assessment of WT and MYO18B-KO HeLa cells. The fluorescent intensity of intracellular fraction was normalized with protein amount (mean ± SD; n = 3, independently analyzed samples; unpaired two-tailed t test; *P ≤ 0.05; ***P ≤ 0.001). Related to Fig. 2. (F) Left: Representative result of HEX activity assay in WT and MYO18B-KO and MYO18B-rescued U2OS cells (mean ± SD; n = 3, independently analyzed samples; One-way ANOVA with Dunnett correction; *P ≤ 0.05; ****P ≤ 0.0001). Right: Raw fluorescent intensity detected in HEX activity assessment of WT and MYO18B-KO U2OS cells. The fluorescent intensity of intracellular fraction was normalized with protein amount (mean ± SD; n = 3, independently analyzed samples; unpaired two-tailed t test, **P ≤ 0.01, ***P ≤ 0.001). Related to Fig. 2. (G) Representative plasma membrane repairing assay results of WT, MYO18B-KO and MYO18B-rescued U2OS cells. Related to Fig. 2. Source data are available for this figure: SourceData FS1.

MYO18B is essential for lysosomal exocytosis.(A) Left: Representative CLSM images of WT HeLa cells stained by Mannitou Ab under unpermeabilized conditions with EGTA and/or Pitstop2 treatment. Bars, 10 µm. Right: Quantitative analysis of cell-surface paucimannose level with EGTA and/or Pitstop2 treatment. The mean ± SD fluorescent intensity of mock treatment was set to unity (n = 10 images; N = 2 biological replicates; One-way ANOVA with Dunnett correction; **P ≤ 0.01; ***P ≤ 0.001). Related to Fig. 1. (B) Representative flow cytometry result of cell-surface LAMP1 level in WT, MYO18B-KO and MYO18B-rescued U2OS cell lines. Related to Fig. 2. (C) Left: Representative flow cytometry results of cell-surface LAMP1 level in MYO18B knock-down U2OS cells. Right: RT-qPCR assessment of MYO18B mRNA level in MYO18B knock-down U2OS cells. Expression of MYO18B was normalized with hypoxanthine-guanine phosphoribosyl transferase (HPRT) (mean ± SD; n = 3, technical replicates; One-way ANOVA with Dunnett correction; ns, P > 0.05; **P ≤ 0.01; ***P ≤ 0.001). Related to Fig. 2. (D) Western blotting detection of total LAMP1 level in WT and MYO18B-KO HeLa and U2OS cells. Related to Fig. 2. (E) Raw fluorescent intensity detected in HEX activity assessment of WT and MYO18B-KO HeLa cells. The fluorescent intensity of intracellular fraction was normalized with protein amount (mean ± SD; n = 3, independently analyzed samples; unpaired two-tailed t test; *P ≤ 0.05; ***P ≤ 0.001). Related to Fig. 2. (F) Left: Representative result of HEX activity assay in WT and MYO18B-KO and MYO18B-rescued U2OS cells (mean ± SD; n = 3, independently analyzed samples; One-way ANOVA with Dunnett correction; *P ≤ 0.05; ****P ≤ 0.0001). Right: Raw fluorescent intensity detected in HEX activity assessment of WT and MYO18B-KO U2OS cells. The fluorescent intensity of intracellular fraction was normalized with protein amount (mean ± SD; n = 3, independently analyzed samples; unpaired two-tailed t test, **P ≤ 0.01, ***P ≤ 0.001). Related to Fig. 2. (G) Representative plasma membrane repairing assay results of WT, MYO18B-KO and MYO18B-rescued U2OS cells. Related to Fig. 2. Source data are available for this figure: SourceData FS1.
Genome-wide knockout gene screening identifies MYO18B as a key regulator of lysosomal exocytosis
To identify the key regulator of paucimannose exposure, we initially considered performing clustered regularly interspaced palindromic repeats (CRISPR)/Cas9-based genome-wide knockout (KO) screening with cell-surface paucimannose as a selection marker. However, cells stained with Mannitou Ab showed a relatively low fluorescence detected by flow cytometry, hampering this approach. Mannitou Ab is an IgM-type antibody inappropriate for flow cytometry applications, and without a suitable antibody another target that could serve as a proxy for surface paucimannose was required. Given that paucimannose is exposed on the cell surface predominantly through lysosomal exocytosis, we decided to use LAMP1 as the selection marker instead. LAMP1 is an abundant lysosomal membrane protein that is modified by paucimannose, making it a detectable and reliable screening marker for lysosomal exocytosis. Since paucimannose is constituently exposed on the cell surface (Fig. 1 D), we performed the screening without external stimuli to the plasma membrane to study the mechanisms regulating “basal” lysosomal exocytosis in THP-1 cells (Fig. 2 A). The cells were infected with the lentiviral single guide RNA (sgRNA) library GeCKO v2 and subjected to antibiotic selection. Subsequently, cells displaying a reduction of cell surface-resident LAMP1 were isolated using a cell sorter. After three rounds of enrichment, a population of cells exhibiting lower cell surface LAMP1 levels compared to parental THP-1 cells was obtained (Fig. 2 B). Genomic DNA from the enriched population was extracted, and DNA fragments containing the inserted sgRNAs were amplified. Subsequent next-generation sequencing revealed that sgRNA targeting MYO18B, a gene encoding unconventional myosin, was the top hit in the enriched cell population (Fig. 2 C).

Genome-wide KO gene screening identifies MYO18B as a key regulator of lysosomal exocytosis. (A) Schematic diagram of CRISPR/Cas9-based KO gene screening. After the GeCKO library was introduced to cells, cells showing low surface levels of LAMP1 were sorted. sgRNA sequences from sorted and unsorted populations were analyzed by deep sequencing. (B) Flow cytometry of THP-1 cells before and after three rounds of sorting for low cell surface LAMP1. (C) Scatter plot represents the gene screening results. The y-axis (beta score) is evaluated by the MAGeCK maximum likelihood estimation (MLE) algorithm, which describes the differentiated sgRNA reads between sorted and unsorted cells. (D) Flow cytometry of cell surface LAMP1 levels in WT and MYO18B-KO HeLa cell lines. See also Fig. S1 B. (E) Quantitative flow cytometry of cell surface LAMP1. Data are the relative mean ± SD from three independent experiments (One-way ANOVA with Dunnett correction; **P ≤ 0.01; ns, P > 0.05). (F) HEX secretion assay in HeLa cells. Data are the relative mean ± SD from three independent experiments (One-way ANOVA with Dunnett correction; ****P ≤ 0.0001; ***P ≤ 0.001). See also Fig. S1, E and F. (G) Schematic diagram of plasma membrane repairing assay mediated by SLO. (H) Plasma membrane repairing assay in HeLa cells. Rescue means MYO18B-KO cells stably expressing EGFP-MYO18B. See also Fig. S1 G. (I) Representative CLSM images of WT and MYO18B-KO HeLa cells stained by Mannitou Ab under unpermeabilized conditions. Bars, 10 µm. (J) Quantitative result of Mannitou Ab staining in WT and MYO18B-KO HeLa cells (mean ± SD; n = 15 images; N = 3 biological replicates; unpaired two-tailed t test; ****P ≤ 0.0001).
Genome-wide KO gene screening identifies MYO18B as a key regulator of lysosomal exocytosis. (A) Schematic diagram of CRISPR/Cas9-based KO gene screening. After the GeCKO library was introduced to cells, cells showing low surface levels of LAMP1 were sorted. sgRNA sequences from sorted and unsorted populations were analyzed by deep sequencing. (B) Flow cytometry of THP-1 cells before and after three rounds of sorting for low cell surface LAMP1. (C) Scatter plot represents the gene screening results. The y-axis (beta score) is evaluated by the MAGeCK maximum likelihood estimation (MLE) algorithm, which describes the differentiated sgRNA reads between sorted and unsorted cells. (D) Flow cytometry of cell surface LAMP1 levels in WT and MYO18B-KO HeLa cell lines. See also Fig. S1 B. (E) Quantitative flow cytometry of cell surface LAMP1. Data are the relative mean ± SD from three independent experiments (One-way ANOVA with Dunnett correction; **P ≤ 0.01; ns, P > 0.05). (F) HEX secretion assay in HeLa cells. Data are the relative mean ± SD from three independent experiments (One-way ANOVA with Dunnett correction; ****P ≤ 0.0001; ***P ≤ 0.001). See also Fig. S1, E and F. (G) Schematic diagram of plasma membrane repairing assay mediated by SLO. (H) Plasma membrane repairing assay in HeLa cells. Rescue means MYO18B-KO cells stably expressing EGFP-MYO18B. See also Fig. S1 G. (I) Representative CLSM images of WT and MYO18B-KO HeLa cells stained by Mannitou Ab under unpermeabilized conditions. Bars, 10 µm. (J) Quantitative result of Mannitou Ab staining in WT and MYO18B-KO HeLa cells (mean ± SD; n = 15 images; N = 3 biological replicates; unpaired two-tailed t test; ****P ≤ 0.0001).
To validate the screening results, MYO18B was disrupted in HeLa and human osteosarcoma U2OS cells by the CRISPR/Cas9, and the genotype of obtained clonal cells was annotated to confirm the successful KO (Data S1). The phenotype of cells deficient in MYO18B was subsequently verified. MYO18B-KO HeLa and U2OS cells exhibited reduced levels of cell surface LAMP1, which could be reversed by reintroducing enhanced green fluorescent protein (EGFP)-tagged MYO18B into KO cells (Fig. 2, D and E; and Fig. S1 B). Knocking down MYO18B using siRNA resulted in a similar phenotype to the knock-out cells. Two of the three siRNAs we used caused a decreased MYO18B mRNA level and reduced cell-surface LAMP1 expression. The last siRNA failed to suppress MYO18B mRNA levels and thus did not reduce cell-surface LAMP1 either (Fig. S1 C). Total LAMP1 at steady-state levels was detected without notable difference between WT and MYO18B-KO cells (Fig. S1 D), eliminating the possibility that the observed decrease in surface LAMP1 was due to reduced protein expression. Furthermore, the enzymatic activity of lysosomal HEX in the cell culture medium revealed a decrease in HEX secretion in MYO18B-KO cells, providing evidence that lysosomal exocytosis is compromised in the absence of MYO18B (Fig. 2 F; and Fig. S1, E and F).
To investigate whether lysosomal proteins, including LAMP1 and HEX, might be mis-secreted from the trans-Golgi network instead of being derived from lysosomal exocytosis, a streptolysin O (SLO)-based plasma membrane repair assay was employed. SLO, a bacterial pore-forming toxin, binds to cholesterol and oligomerizes to form pores on the plasma membrane. Lysosomal exocytosis facilitates the removal of such SLO-induced pores from the cell surface through lysosomal exocytosis-dependent endocytosis (Andrews, 2019), thereby preserving cell integrity (Fig. 2 G). After treatment with SLO, 26.0% of WT HeLa cells and 49.3% of MYO18B-KO cells were stained by propidium iodide (PI), a dye impermeable to the intact plasma membrane, indicating a diminished plasma membrane repair capacity in MYO18B-depleted cells. Conversely, an EGFP-positive population of EGFP-MYO18B rescued cells displayed an enhanced plasma membrane repair capability (15.4% PI-positive cells; 3.7% in EGFP-positive population [3.7% + 20.2%]), likely attributable to MYO18B overexpression. The EGFP-negative population exhibited a similar PI positivity rate (44.0%; 33.9% in EGFP-positive population [33.9% + 43.2%]) to that of MYO18B-depleted cells (Fig. 2 H). A similar trend was observed in U2OS cells (Fig. S1 G), indicating that MYO18B is critical for lysosomal exocytosis in the two investigated cancer cell lines similar to the THP-1 cell system.
Given that paucimannose is secreted through lysosomal exocytosis, MYO18B-KO cells would exhibit reduced paucimannose levels on the cell surface. To test this hypothesis, WT and MYO18B-KO HeLa cells were stained with Mannitou Ab under unpermeabilized conditions. Immunofluorescence results revealed a notably decreased staining signal for Mannitou Ab in MYO18B-KO cells, supporting the idea that MYO18B plays a crucial role in the lysosomal exocytosis process, including paucimannose secretion to the cell surface (Fig. 2, I and J).
Direct monitoring reveals impaired lysosomal exocytosis in MYO18B-KO cells
To directly monitor lysosomal exocytosis, VAMP7-pHluorin, a fusion protein combining the lysosome-specific v-SNARE VAMP7 with the pH-sensitive fluorescent protein ecliptic pHluorin, was utilized (Lachuer et al., 2023). The fluorescence of pHluorin is quenched in the acidic environment of the lysosomal lumen but emits fluorescence upon fusion of the lysosome with the plasma membrane, a process that neutralizes the pH. The fluorescence rapidly diminishes due to the lateral diffusion of VAMP7-pHluorin on the plasma membrane (Fig. 3 A). This process allows lysosomal exocytosis to be visualized as a “blink” under total internal reflection fluorescence (TIRF) microscopy, which detects fluorescent events near the cell surface over time (Fig. 3 B). To confirm that this probe correctly reflects lysosomal exocytosis, the localization of VAMP7-pHluorin was checked. As shown by immunofluorescence results, VAMP7-pHluorin colocalized well with LAMP1, indicating, as expected, that the fusion protein resides in the lysosomes (Fig. 3 C). In WT cells, frequent lysosomal fusion was detected (48 ± 16 fusion events per 30 s, per cell; Fig. 3, D and E; and Video 1). In contrast, a significant reduction in lysosome–plasma membrane fusion events (8 ± 6 fusion events per 30 s, per cell) was observed in MYO18B-KO cells using this method in line with earlier findings in Fig. 2 (Fig. 3, D and E; and Video 1). These observations further supported the fact that MYO18B is a positive regulator of lysosomal exocytosis.

Direct monitoring reveals impaired lysosomal exocytosis in MYO18B-KO cells. (A) Schematic diagram of fluorescence changes for VAMP7-pHluorin during lysosomal exocytosis. The fluorescence of pHluorin is quenched in the lysosome lumen (acidic pH), elevated by lysosome fusion with the plasma membrane (neutral pH), and rapidly diffused on the plasma membrane after membrane fusion. (B) Representative image of lysosomal exocytosis detected by TIRF microscopy using VAMP7-pHluorin. Bar, 5 µm in the original image (left) and 1 µm in the magnified montage (right). (C) Representative CLSM image of U2OS cells expressing VAMP7-pHluorin stained with LAMP1. Bar, 10 µm in original image (left) and 2 µm in magnified images (right). The Pearson correlation coefficient between LAMP1 and VAMP7-pHluorin is 0.753 in the magnified image. (D) Lysosomal exocytosis detected by TIRF microscopy in WT and MYO18B-KO U2OS cells. Lysosome-plasma membrane fusion events are represented as magenta dots. Bar, 5 µm. (E) Quantification results of lysosome-plasma membrane fusion events during 30 s live imaging in WT and MYO18B-KO U2OS cells (mean ± SD; n = 31 cells; N = 6 biological replicates; unpaired two-tailed t test; ****P ≤ 0.0001). See also Video 1.
Direct monitoring reveals impaired lysosomal exocytosis in MYO18B-KO cells. (A) Schematic diagram of fluorescence changes for VAMP7-pHluorin during lysosomal exocytosis. The fluorescence of pHluorin is quenched in the lysosome lumen (acidic pH), elevated by lysosome fusion with the plasma membrane (neutral pH), and rapidly diffused on the plasma membrane after membrane fusion. (B) Representative image of lysosomal exocytosis detected by TIRF microscopy using VAMP7-pHluorin. Bar, 5 µm in the original image (left) and 1 µm in the magnified montage (right). (C) Representative CLSM image of U2OS cells expressing VAMP7-pHluorin stained with LAMP1. Bar, 10 µm in original image (left) and 2 µm in magnified images (right). The Pearson correlation coefficient between LAMP1 and VAMP7-pHluorin is 0.753 in the magnified image. (D) Lysosomal exocytosis detected by TIRF microscopy in WT and MYO18B-KO U2OS cells. Lysosome-plasma membrane fusion events are represented as magenta dots. Bar, 5 µm. (E) Quantification results of lysosome-plasma membrane fusion events during 30 s live imaging in WT and MYO18B-KO U2OS cells (mean ± SD; n = 31 cells; N = 6 biological replicates; unpaired two-tailed t test; ****P ≤ 0.0001). See also Video 1.
Representative live cell imaging of WT and MYO18B-KO U2OS cell transiently transfected with VAMP7-pHluorin (TIRF microscopy). Lysosome–plasma membrane fusion events are labeled in red circles. Bar, 5 µm. Time-lapse images were captured at 0.2-s intervals for 30 s. Time code is in minute: second format (15 fps). Related to Fig. 3. The playback speed relative to real time is 1:10.
Representative live cell imaging of WT and MYO18B-KO U2OS cell transiently transfected with VAMP7-pHluorin (TIRF microscopy). Lysosome–plasma membrane fusion events are labeled in red circles. Bar, 5 µm. Time-lapse images were captured at 0.2-s intervals for 30 s. Time code is in minute: second format (15 fps). Related to Fig. 3. The playback speed relative to real time is 1:10.
MYO18B is required for stress fiber assembly and FA maturation
In concordance with a previous study which highlighted that MYO18B-deficient U2OS cells exhibited impaired stress fiber assembly and reduced contractility (Jiu et al., 2019), this study observed a clearly visible accumulation of thin actin filaments in the cytosol of MYO18B-KO HeLa cells but not in WT cells (Fig. 4 A). Migration ability was attenuated in MYO18B-KO cells, as revealed by live cell imaging of wound healing assay (Fig. S2 A and Video 2). FAs play a critical role in cell migration by acting as dynamic linkages between the ECM and the actin cytoskeleton within the cell (Kanchanawong and Calderwood, 2023). FAs enable the cell to exert force on the ECM through actomyosin contractility, which is crucial for the pulling motion of the cell body. The observed abnormalities in the actin cytoskeleton and migration suggest potential alterations in FAs in MYO18B-KO HeLa cells. To investigate this possibility, FAs in both WT and MYO18B-KO cells were assessed by immunofluorescence microscopy. In MYO18B-KO cells, vinculin (FA adaptor protein) puncta were smaller, and quantification revealed a reduction in the number of large FAs (size >0.5 µm2), indicating an impairment in FA maturation (Fig. 4, B and C, additional representative images in Fig. S2 C). This defect in FA maturation was similarly observed in MYO18B-KO U2OS cells (Fig. S2 B).

MYO18B is required for stress fiber assembly and FA maturation. (A) Representative wide-field epifluorescent images of HeLa cells stained with rhodamine-conjugated phalloidin. Accumulation of actin filaments in the cytosol was observed in MYO18B-KO cells. Bar, 10 µm in the original image and 2 µm in the magnified image. See also Fig. S2 A and Video 2. (B) Representative CLSM images of WT and MYO18B-KO HeLa cells stained with vinculin. Bar, 10 µm. (C) Quantitative results of vinculin puncta >0.5 µm2 in WT and MYO18B-KO HeLa cells (mean ± SD; n = 15 images; N = 3 biological replicates; unpaired two-tailed t test; **P ≤ 0.01). See also Fig. S2, B and C. (D) Representative live imaging of WT and MYO18B-KO U2OS cells transiently expressing paxillin-mCherry (CLSM). An example frame of a 9 h time-lapse image session is shown on the left, and the lifetime of one FA (black arrow) is shown in a time series on the right. Images are inverted for a better contrast. Bar, 10 µm in original images (left) and 2 µm in magnified montage (right). See also Video 3. (E) Fitted RFI curve of FAs, as indicated in Fig. 4 D. The maximum intensity is set as unity. The black arrow indicates focal adhesion lifetime which is the duration between half maximum of the fitted curve. See STAR methods for the method details of curve fitting. (F) Quantitative results of the FA lifetime in WT and MYO18B-KO U2OS cells (n = 5 FAs; mean ± SD; unpaired two-tailed t test; ***P ≤ 0.001).
MYO18B is required for stress fiber assembly and FA maturation. (A) Representative wide-field epifluorescent images of HeLa cells stained with rhodamine-conjugated phalloidin. Accumulation of actin filaments in the cytosol was observed in MYO18B-KO cells. Bar, 10 µm in the original image and 2 µm in the magnified image. See also Fig. S2 A and Video 2. (B) Representative CLSM images of WT and MYO18B-KO HeLa cells stained with vinculin. Bar, 10 µm. (C) Quantitative results of vinculin puncta >0.5 µm2 in WT and MYO18B-KO HeLa cells (mean ± SD; n = 15 images; N = 3 biological replicates; unpaired two-tailed t test; **P ≤ 0.01). See also Fig. S2, B and C. (D) Representative live imaging of WT and MYO18B-KO U2OS cells transiently expressing paxillin-mCherry (CLSM). An example frame of a 9 h time-lapse image session is shown on the left, and the lifetime of one FA (black arrow) is shown in a time series on the right. Images are inverted for a better contrast. Bar, 10 µm in original images (left) and 2 µm in magnified montage (right). See also Video 3. (E) Fitted RFI curve of FAs, as indicated in Fig. 4 D. The maximum intensity is set as unity. The black arrow indicates focal adhesion lifetime which is the duration between half maximum of the fitted curve. See STAR methods for the method details of curve fitting. (F) Quantitative results of the FA lifetime in WT and MYO18B-KO U2OS cells (n = 5 FAs; mean ± SD; unpaired two-tailed t test; ***P ≤ 0.001).

MYO18B promotes focal adhesion maturation. (A) Left: Representative results of wound healing in WT and MYO18B-KO HeLa cells. DIC images were acquired immediately and 24 h after cells were scratched. Bars, 200 µm. Right: Quantitative result of wound healing assay in WT and MYO18B-KO HeLa cells. Data was acquired at 0, 4, 8, 12, and 24 h after scratching (n = 3 images, mean ± SD, Two-way ANOVA, **P ≤ 0.01). Related to Fig. 4. (B) Left: Representative images of WT and MYO18B-KO U2OS cells stained with vinculin. Bars, 10 µm. Right: Quantitative result of vinculin puncta >0.5 µm2 in WT and MYO18B-KO U2OS cells (mean ± SD; n = 15 images; N = 3 biological replicates; unpaired two-tailed t test; ***P ≤ 0.001). Related to Fig. 4. (C) Representative CLSM images of WT and MYO18B-KO HeLa cells stained with vinculin. Bar, 10 µm. Related to Fig. 4. (D) Raw fluorescent intensity detected in HEX activity assessment of MYO18B-KO HeLa cells expressing different EGFP-tagged MYO18B truncates. The fluorescent intensity of intracellular fraction was normalized with protein amount (mean ± SD; n = 3, independently analyzed samples; One-way ANOVA with Dunnett correction; ns, P > 0.05; *P ≤ 0.05; **P ≤ 0.01; ***P ≤ 0.001; ****P ≤ 0.0001). Related to Fig. 5. (E) Representative CLSM images of MYO18B-KO HeLa cells expressing different EGFP tagged MYO18B truncates stained with vinculin. Bars, 10 µm. Related to Fig. 5.

MYO18B promotes focal adhesion maturation. (A) Left: Representative results of wound healing in WT and MYO18B-KO HeLa cells. DIC images were acquired immediately and 24 h after cells were scratched. Bars, 200 µm. Right: Quantitative result of wound healing assay in WT and MYO18B-KO HeLa cells. Data was acquired at 0, 4, 8, 12, and 24 h after scratching (n = 3 images, mean ± SD, Two-way ANOVA, **P ≤ 0.01). Related to Fig. 4. (B) Left: Representative images of WT and MYO18B-KO U2OS cells stained with vinculin. Bars, 10 µm. Right: Quantitative result of vinculin puncta >0.5 µm2 in WT and MYO18B-KO U2OS cells (mean ± SD; n = 15 images; N = 3 biological replicates; unpaired two-tailed t test; ***P ≤ 0.001). Related to Fig. 4. (C) Representative CLSM images of WT and MYO18B-KO HeLa cells stained with vinculin. Bar, 10 µm. Related to Fig. 4. (D) Raw fluorescent intensity detected in HEX activity assessment of MYO18B-KO HeLa cells expressing different EGFP-tagged MYO18B truncates. The fluorescent intensity of intracellular fraction was normalized with protein amount (mean ± SD; n = 3, independently analyzed samples; One-way ANOVA with Dunnett correction; ns, P > 0.05; *P ≤ 0.05; **P ≤ 0.01; ***P ≤ 0.001; ****P ≤ 0.0001). Related to Fig. 5. (E) Representative CLSM images of MYO18B-KO HeLa cells expressing different EGFP tagged MYO18B truncates stained with vinculin. Bars, 10 µm. Related to Fig. 5.
Representative live cell imaging of WT and MYO18B-KO HeLa cells migrating in 24-well tissue culture plate (DIC). Bar, 20 µm. Time-lapse images were captured at 1-min intervals for 12 h. Time code is in hour: minute: second format (15 fps). Related to Fig. 4. The playback speed relative to real time is 1:10,800.
Representative live cell imaging of WT and MYO18B-KO HeLa cells migrating in 24-well tissue culture plate (DIC). Bar, 20 µm. Time-lapse images were captured at 1-min intervals for 12 h. Time code is in hour: minute: second format (15 fps). Related to Fig. 4. The playback speed relative to real time is 1:10,800.
FAs are dynamic structures that undergo continuous cycles of assembly and disassembly during cell migration (Mavrakis and Juanes, 2023). To examine the dynamics of FAs, live imaging was conducted in U2OS cells expressing paxillin–mCherry. Paxillin–mCherry mainly showed a disk-like punctate pattern, indicating the correct localization at FAs (Fig. 4 D and Video 3). There were also vesicle-like fluorescent signals, likely attributable to the degradation of overexpressed paxillin–mCherry in lysosomes. In both WT and MYO18B-KO cells, nascent FAs gradually grew, and fluorescent intensity peaked before rapidly declining and eventually disappearing. FA turnover was analyzed using a previously described method, which models the FA assembly as a logistic function and FA disassembly as an exponential function of time (Stehbens and Wittmann, 2014). The analysis revealed that the assembly and disassembly of FAs occurred more rapidly in MYO18B-KO cells (Fig. 4 E). The average lifetime of FAs was 66.4 ± 11.1 min in WT cells and reduced to 23.0 ± 3.9 min in MYO18B-KO cells (Fig. 4 F). Furthermore, MYO18B-KO cells exhibited difficulty maintaining stable attachment to the coverslip during imaging (Video 3), suggesting that the instability of FAs underlies this observation.
Representative live cell imaging of WT and MYO18B-KO U2OS cells transiently transfected with paxillin-mcherry (laser scan confocal microscopy). Bar, 10 µm. Time-lapse images were captured at 1-min intervals for 9 h. Time code is in hour: minute format (15 fps). Related to Fig. 4. The playback speed relative to real time is 1:2,700.
Representative live cell imaging of WT and MYO18B-KO U2OS cells transiently transfected with paxillin-mcherry (laser scan confocal microscopy). Bar, 10 µm. Time-lapse images were captured at 1-min intervals for 9 h. Time code is in hour: minute format (15 fps). Related to Fig. 4. The playback speed relative to real time is 1:2,700.
The N-terminal extension of MYO18B is critical for its role in lysosomal exocytosis
MYO18B is an unconventional myosin consisting of 2567 amino acid residues. The central region, spanning amino acid residues 555–2089, exhibits the characteristic architecture of myosin II, including a motor domain functionally inactive due to amino acid substitutions, two IQ motifs facilitating interaction with myosin light chains, and a coiled-coil domain essential for homodimerization. The N- and C-terminal regions of MYO18B are unique domains that share no similarity with any known amino acid sequences. To determine the minimal functional configuration of MYO18B required for lysosomal exocytosis, a series of MYO18B truncations were generated and stably transfected into MYO18B-depleted HeLa cells (Fig. 5 A). The expression levels of these truncated versions were verified by Western blotting (Fig. 5 B). Lysosomal exocytosis in these cells was evaluated using the above-mentioned plasma membrane repair assay and by HEX secretion. To our surprise, the N-terminus of MYO18B alone (1–555) could compensate for lysosomal exocytosis defects observed in MYO18B-KO cells. Specifically, all constructs that possessed the N-terminus of MYO18B (the fragments spanning the amino acid residues 1–555) including the 1–555, 1–1,398, 1–2,089, and the full-length protein variants successfully restored plasma membrane repair capabilities and HEX secretion in MYO18B-KO cells (Fig. 5, C and D; and Fig. S2 D). The impact of MYO18B N-terminus on FAs was also examined. Immunofluorescence staining revealed that FAs in MYO18B-KO cells expressing constructs containing the N-terminus (1–555, 1–1,398, 1–2,089, and full-length MYO18B) were larger than those in MYO18B-KO cells and even exceeded the size of FAs in WT cells. This enlargement is likely attributable to the overexpression of the MYO18B constructs. Conversely, the size of FAs in cells expressing truncated constructs without the N-terminus i.e., 554–1356 and 556–2089 was relatively small, similar to those in MYO18B-KO cells (Fig. 5, E and F). We noticed that MYO18B protein variants containing the N-terminus exhibited a weak filamentous pattern detected by laser scan confocal microscopy, whereas those lacking this region showed completely homogeneous fluorescence (Fig. S2 E). This suggests that the N-terminus of MYO18B may be responsible for interacting with stress fiber. Moreover, cells expressing the MYO18B N-terminus containing truncates spread much better on coverslips than MYO18B-KO and even WT HeLa cells, further emphasizing the importance of the N-terminus to the function of MYO18B.

The N-terminal extension of MYO18B is critical for its role in lysosomal exocytosis. (A) Schematic representation of different MYO18B truncated constructs. (B) Western blot of all MYO18B truncates. (C) Representative plasma membrane repairing assay results of WT, MYO18B-KO, and MYO18B-KO cells stably transfected with different MYO18B truncates. (D) HEX secretion of WT, MYO18B-KO, and MYO18B-KO cells stably transfected with different MYO18B truncates. Data are the mean ± SD from three independent experiments (One-way ANOVA with Dunnett correction; **P ≤ 0.01; ***P ≤ 0.001; ****P ≤ 0.0001; ns, P ≥ 0.05). See also Fig. S2 D. (E) Representative CLSM images of WT, MYO18B-KO, and MYO18B-KO cells stably transfected with different MYO18B truncates stained with vinculin. Bar, 10 µm. See also Fig. S2 E. (F) Quantitative results of number of FAs > 0.5 µm2 (mean ± SD; n = 10 images; N = 2 biological replicates; One-way ANOVA with Dunnett correction; **P ≤ 0.01; ***P ≤ 0.001; ****P ≤ 0.0001; ns, P ≥ 0.05). Source data are available for this figure: SourceData F5.
The N-terminal extension of MYO18B is critical for its role in lysosomal exocytosis. (A) Schematic representation of different MYO18B truncated constructs. (B) Western blot of all MYO18B truncates. (C) Representative plasma membrane repairing assay results of WT, MYO18B-KO, and MYO18B-KO cells stably transfected with different MYO18B truncates. (D) HEX secretion of WT, MYO18B-KO, and MYO18B-KO cells stably transfected with different MYO18B truncates. Data are the mean ± SD from three independent experiments (One-way ANOVA with Dunnett correction; **P ≤ 0.01; ***P ≤ 0.001; ****P ≤ 0.0001; ns, P ≥ 0.05). See also Fig. S2 D. (E) Representative CLSM images of WT, MYO18B-KO, and MYO18B-KO cells stably transfected with different MYO18B truncates stained with vinculin. Bar, 10 µm. See also Fig. S2 E. (F) Quantitative results of number of FAs > 0.5 µm2 (mean ± SD; n = 10 images; N = 2 biological replicates; One-way ANOVA with Dunnett correction; **P ≤ 0.01; ***P ≤ 0.001; ****P ≤ 0.0001; ns, P ≥ 0.05). Source data are available for this figure: SourceData F5.
MYO18A and MYO18B are members of the myosin XVIII family, sharing a similar central region but distinct N- and C-termini. MYO18A has three isoforms: MYO18Aα, which is ubiquitously expressed; MYO18Aβ, which is expressed in hematopoietic cells; and MYO18Aγ, which is found in heart and skeletal muscle (Taft and Latham, 2020). To investigate whether MYO18A has similar functions to MYO18B, we knocked out the ubiquitously expressed MYO18Aα in HeLa and U2OS cells. Unexpectedly, unlike MYO18B-KO cells, MYO18Aα-KO cells exhibited comparable cell-surface LAMP1 levels to WT cells (Fig. S3 A). Additionally, HEX secretion in MYO18Aα-KO cells was even higher than that in WT cells (Fig. S3 B). Correspondingly, immunofluorescence experiments revealed that MYO18Aα-KO U2OS cells had more mature FAs compared not only to MYO18B-KO cells but also to WT cells (Fig. S3 C), which is consistent with a previous report (Hsu et al., 2010). These observations led us to conclude that knocking out MYO18Aα actually enhances lysosomal exocytosis rather than inhibiting it. The similar levels of cell-surface LAMP1 between MYO18Aα-KO and WT cells may be due to the recycling of secreted LAMP1 through endocytosis mechanisms. To confirm this, we blocked endocytosis with pitstop2. As expected, pitstop2 treatment increased cell-surface LAMP1 levels in all cell lines, and, more importantly, MYO18Aα-KO cells exhibited even higher LAMP1 staining compared with WT cells (Fig. S3 D). This result further supports that lysosomal exocytosis is enhanced in MYO18Aα-KO cells. In MYO18B-KO U2OS cells, the MYO18A mRNA level was comparable with WT cells, further ruling out the possibility of an unknown correlation or compensatory relationship between MYO18A and MYO18B (Fig. S3 E). On the other hand, overexpression of α-actinin, a conventional actin crosslinker, compensated the lysosomal exocytosis defects in MYO18B-KO cells (Fig. S3 F).

Functional differences between MYO18B and MYO18A. (A) Representative flow cytometry results of cell-surface LAMP1 level in WT, MYO18Aα-KO HeLa, and MYO18B-KO U2OS cells. Related to Fig. 5. (B) Representative result of HEX activity assay in WT, MYO18Aα-KO HeLa, and MYO18B-KO U2OS cells (n = 3, independently analyzed samples; mean ± SD; One-way ANOVA with Dunnett correction; **P ≤ 0.01; ***P ≤ 0.001; ****P ≤ 0.0001). Related to Fig. 5. (C) Left: Representative CLSM images of WT, MYO18Aα-KO, and MYO18B-KO U2OS cells stained with vinculin. Bars, 10 µm. Right: Quantitative results of vinculin puncta >0.5 µm2 in WT MYO18Aα-KO and MYO18B-KO U2OS cells (mean ± SD; n = 15 images; N = 3 biological replicates; unpaired two-tailed t test; **P ≤ 0.01, ****P ≤ 0.0001). Related to Fig. 5. (D) Representative flow cytometry results of cell-surface LAMP1 level in WT, MYO18Aα-KO HeLa and MYO18B-KO U2OS cells treated by Pistop2. Related to Fig. 5. (E) RT-qPCR assessment of MYO18A mRNA level in MYO18B-KO U2OS cells. Expression of MYO18A was normalized with HPRT (n = 3 technical replicates; One-way ANOVA with Dunnett correction; ns, P > 0.05). (F) Representative result of plasma membrane repairing assay in MYO18B-depleted cells expressing EGFP-ACTN1. Related to Fig. 5.

Functional differences between MYO18B and MYO18A. (A) Representative flow cytometry results of cell-surface LAMP1 level in WT, MYO18Aα-KO HeLa, and MYO18B-KO U2OS cells. Related to Fig. 5. (B) Representative result of HEX activity assay in WT, MYO18Aα-KO HeLa, and MYO18B-KO U2OS cells (n = 3, independently analyzed samples; mean ± SD; One-way ANOVA with Dunnett correction; **P ≤ 0.01; ***P ≤ 0.001; ****P ≤ 0.0001). Related to Fig. 5. (C) Left: Representative CLSM images of WT, MYO18Aα-KO, and MYO18B-KO U2OS cells stained with vinculin. Bars, 10 µm. Right: Quantitative results of vinculin puncta >0.5 µm2 in WT MYO18Aα-KO and MYO18B-KO U2OS cells (mean ± SD; n = 15 images; N = 3 biological replicates; unpaired two-tailed t test; **P ≤ 0.01, ****P ≤ 0.0001). Related to Fig. 5. (D) Representative flow cytometry results of cell-surface LAMP1 level in WT, MYO18Aα-KO HeLa and MYO18B-KO U2OS cells treated by Pistop2. Related to Fig. 5. (E) RT-qPCR assessment of MYO18A mRNA level in MYO18B-KO U2OS cells. Expression of MYO18A was normalized with HPRT (n = 3 technical replicates; One-way ANOVA with Dunnett correction; ns, P > 0.05). (F) Representative result of plasma membrane repairing assay in MYO18B-depleted cells expressing EGFP-ACTN1. Related to Fig. 5.
Lysosomal exocytosis occurs in the vicinity of FAs
To elucidate the mechanism by which MYO18B regulates lysosomal exocytosis, the three-dimensional (3D) distribution of lysosomes within cells was analyzed. HeLa cells were co-stained with LAMP1 and CD44, a plasma membrane marker. The spatial arrangement of these components was captured using the z-sectioning capability of confocal microscopy. The collected image stacks were reconstructed into a 3D image utilizing the 3D viewer plugin of ImageJ. Using a color-coded representation and quantification of the z-position, most lysosomes in WT cells appeared to be localized near the bottom of the cell, closer to the substrate to which the cells adhered (Fig. 6 A). In contrast, lysosomes in MYO18B-KO cells were dispersed throughout the z-axis, suggesting that the localization of lysosomes is dysregulated due to the loss of MYO18B. To monitor lysosomal trafficking dynamics, live imaging was conducted in HeLa cells, with lysosomes labeled by Lysotracker. Under a wide-field epifluorescence microscope, a dense accumulation of perinuclear lysosomes created a cloud-like smear area. To better visualize individual vesicles, the focal plane was adjusted to a lower position in the cell. Subsequent kymograph analysis highlighted a notable difference in lysosomal behavior between WT and MYO18B-KO cells. In WT cells, some lysosomes were stably localized near the plasma membrane. In contrast, in MYO18B-KO cells, lysosomes rapidly underwent retrograde movement away from the cell periphery once approaching the plasma membrane (Video 4 and Fig. S4 A). Lysosomes move along microtubules, which are associated with FAs (Stehbens et al., 2014). Therefore, we next confirmed the localization of lysosomes, microtubules, and FAs at the same time. Immunofluorescence microscopy revealed that peripheral lysosomes are distributed along the microtubule plus-end protein EB1, partially colocalizing with vinculin at the cell periphery, highlighting the role of microtubules in directing lysosomal positioning toward FAs (Fig. 6 B).

Lysosomal exocytosis occurs in the vicinity of FAs. (A) Left: Color-coded representation of the 3D distribution of lysosomes in HeLa cells. Images are acquired by CLSM at 0.5 µm intervals on the z-axis. The depth information was encoded in the color scheme indicated at the bottom of the images. Bar, 10 µm. Right: Quantitative results of the lysosome z-position in WT and MYO18B-KO HeLa cells (mean ± SD; n = 4 image stacks; N = 2 biological replicates; unpaired two-tailed t test; **P ≤ 0.01). (B) Representative CLSM image of U2OS cells expressing EB1-EGFP stained with vinculin and LAMP1. Bar, 10 µm in the original image and 3 µm in the magnified image. Mander’s coefficient is 0.993 (vinculin to EB1-EGFP) and 0.863 (EB1-EGFP to vinculin). (C) Colocalization of LAMP1 (lysosomes) and vinculin (FA) in U2OS cells. Left: Representative CLSM images of U2OS cells co-stained with vinculin and LAMP1. Bar, 10 µm. Right: Quantification of the distance between every lysosome and its nearest FA, measured by DiAna (mean ± SD; n = 10 images; N = 2 biological replicates; unpaired two-tailed t test; **P ≤ 0.01). See also Fig. S4 B. (D) Distance between lysosomal exocytosis and FA. Left: Dual-color live imaging with paxillin-mCherry and VAMP7-pHluorin acquired using TIRF microscopy. The grayscale image is the paxillin-mCherry channel, magenta dots are lysosome–plasma membrane fusion events, and green dots result from randomly simulated coordinates. Right: Distance between every experimental fusion event and its nearest FA, measured by DiAna and plotted in a cumulative frequency plot (magenta curve). Simulated coordinates were generated by the shuffling function in DiAna, and the distance was also measured and plotted in the same plot. A total of 100 rounds simulations were performed, and two extremes are represented in the green curve, whereas the average is represented in the black curve. See also Video 5.
Lysosomal exocytosis occurs in the vicinity of FAs. (A) Left: Color-coded representation of the 3D distribution of lysosomes in HeLa cells. Images are acquired by CLSM at 0.5 µm intervals on the z-axis. The depth information was encoded in the color scheme indicated at the bottom of the images. Bar, 10 µm. Right: Quantitative results of the lysosome z-position in WT and MYO18B-KO HeLa cells (mean ± SD; n = 4 image stacks; N = 2 biological replicates; unpaired two-tailed t test; **P ≤ 0.01). (B) Representative CLSM image of U2OS cells expressing EB1-EGFP stained with vinculin and LAMP1. Bar, 10 µm in the original image and 3 µm in the magnified image. Mander’s coefficient is 0.993 (vinculin to EB1-EGFP) and 0.863 (EB1-EGFP to vinculin). (C) Colocalization of LAMP1 (lysosomes) and vinculin (FA) in U2OS cells. Left: Representative CLSM images of U2OS cells co-stained with vinculin and LAMP1. Bar, 10 µm. Right: Quantification of the distance between every lysosome and its nearest FA, measured by DiAna (mean ± SD; n = 10 images; N = 2 biological replicates; unpaired two-tailed t test; **P ≤ 0.01). See also Fig. S4 B. (D) Distance between lysosomal exocytosis and FA. Left: Dual-color live imaging with paxillin-mCherry and VAMP7-pHluorin acquired using TIRF microscopy. The grayscale image is the paxillin-mCherry channel, magenta dots are lysosome–plasma membrane fusion events, and green dots result from randomly simulated coordinates. Right: Distance between every experimental fusion event and its nearest FA, measured by DiAna and plotted in a cumulative frequency plot (magenta curve). Simulated coordinates were generated by the shuffling function in DiAna, and the distance was also measured and plotted in the same plot. A total of 100 rounds simulations were performed, and two extremes are represented in the green curve, whereas the average is represented in the black curve. See also Video 5.
Representative live cell imaging of WT and MYO18B-KO HeLa cells stained with lysotracker-red (Epi fluorescence). Images are deconvolved with a generated point spread function. Bar, 10 µm. Time-lapse images were captured at 3-s intervals for 3 min. Time code is in hour: minute format (15 fps). Time code is in minute: second format (15 fps). Related to Fig. 6. The playback speed relative to real time is 1:45.
Representative live cell imaging of WT and MYO18B-KO HeLa cells stained with lysotracker-red (Epi fluorescence). Images are deconvolved with a generated point spread function. Bar, 10 µm. Time-lapse images were captured at 3-s intervals for 3 min. Time code is in hour: minute format (15 fps). Time code is in minute: second format (15 fps). Related to Fig. 6. The playback speed relative to real time is 1:45.

Relationship between lysosome movement and focal adhesions. (A) Representative results of live cell imaging with Lysotracker recorded using wide-field epifluorescent microscopy. Top: z-projection of 3-min time series (maximum intensity). Images are inverted to get a better contrast. Bottom: Kymographs represent the lysosome traffic along the magenta segmented line indicated on the top panel. The direction of lysosome traffic was color-coded. Lysosomes that underwent anterograde movement were coded in yellow, retrograde movement in cyan, and static lysosomes in magenta. White arrows indicate stable lysosomes near the WT cell surface, which are not found in MYO18B-KO cells. Related to Fig. 6. (B) Left: Representative confocal microscopic images of WT and MYO18B-KO HeLa cells stained with LAMP1 and vinculin. Bars, 10 µm in original images and 3 µm in magnified images. Right: fluorescent intensity of LAMP1 and vinculin along the white line in the magnified images on the left. Related to Fig. 6. (C) Top: Representative CLSM images of WT and MYO18B-KO U2OS cells co-stained with vinculin and LAMP1. Bars, 10 µm. Bottom: Quantitative analysis of lysosome size in WT and MYO18B-KO U2OS cells (mean ± SD; n = 10 images; N = 2 biological replicates; unpaired two-tailed t test; ***P ≤ 0.001). Related to Fig. 6. (D) Top: Representative CLSM images of U2OS cells grown on non-coated or poly-L-lysine coated cover glass stained with vinculin and LAMP1 (x-y view) Bars, 10 µm. Bottom: The x-z view at the dotted line in the x-y view. The white arrows indicate the lysosomes distributed at the top of nuclei in cells grown on poly-L-lysine coated cover glass. A total of 13 z-series were captured at 0.365 intervals and the x-z view was reconstituted using re-slice tool of ImageJ. The spatial ratio of x-z view was kept unchanged during processing. Related to Fig. 6. (E) Top: Representative CLSM images of U2OS cells grown on non-coated or poly-L-lysine coated cover glass stained with LAMP1 under unpermeabilized conditions. Bars, 10 µm. Bottom: Quantitative analysis of cell-surface LAMP1 level in U2OS cells grown on non-coated or poly-L-lysine coated cover glass. The mean ± SD fluorescent intensity of non-coated group was set to unity (n = 20 images; N = 4 biological replicates; unpaired two-tailed t test; ***P ≤ 0.001). Related to Fig. 6. (F) Representative result of plasma membrane repairing assay in HeLa cells under FAK inhibited or deleted condition. Related to Fig. 6.

Relationship between lysosome movement and focal adhesions. (A) Representative results of live cell imaging with Lysotracker recorded using wide-field epifluorescent microscopy. Top: z-projection of 3-min time series (maximum intensity). Images are inverted to get a better contrast. Bottom: Kymographs represent the lysosome traffic along the magenta segmented line indicated on the top panel. The direction of lysosome traffic was color-coded. Lysosomes that underwent anterograde movement were coded in yellow, retrograde movement in cyan, and static lysosomes in magenta. White arrows indicate stable lysosomes near the WT cell surface, which are not found in MYO18B-KO cells. Related to Fig. 6. (B) Left: Representative confocal microscopic images of WT and MYO18B-KO HeLa cells stained with LAMP1 and vinculin. Bars, 10 µm in original images and 3 µm in magnified images. Right: fluorescent intensity of LAMP1 and vinculin along the white line in the magnified images on the left. Related to Fig. 6. (C) Top: Representative CLSM images of WT and MYO18B-KO U2OS cells co-stained with vinculin and LAMP1. Bars, 10 µm. Bottom: Quantitative analysis of lysosome size in WT and MYO18B-KO U2OS cells (mean ± SD; n = 10 images; N = 2 biological replicates; unpaired two-tailed t test; ***P ≤ 0.001). Related to Fig. 6. (D) Top: Representative CLSM images of U2OS cells grown on non-coated or poly-L-lysine coated cover glass stained with vinculin and LAMP1 (x-y view) Bars, 10 µm. Bottom: The x-z view at the dotted line in the x-y view. The white arrows indicate the lysosomes distributed at the top of nuclei in cells grown on poly-L-lysine coated cover glass. A total of 13 z-series were captured at 0.365 intervals and the x-z view was reconstituted using re-slice tool of ImageJ. The spatial ratio of x-z view was kept unchanged during processing. Related to Fig. 6. (E) Top: Representative CLSM images of U2OS cells grown on non-coated or poly-L-lysine coated cover glass stained with LAMP1 under unpermeabilized conditions. Bars, 10 µm. Bottom: Quantitative analysis of cell-surface LAMP1 level in U2OS cells grown on non-coated or poly-L-lysine coated cover glass. The mean ± SD fluorescent intensity of non-coated group was set to unity (n = 20 images; N = 4 biological replicates; unpaired two-tailed t test; ***P ≤ 0.001). Related to Fig. 6. (F) Representative result of plasma membrane repairing assay in HeLa cells under FAK inhibited or deleted condition. Related to Fig. 6.
To verify the close spatial relationship between lysosomes and FAs, the localization of these cellular components was analyzed. In HeLa cells, the distance between lysosomes and their nearest FA was greater in MYO18B-KO cells than in WT cells (Fig. S4 B). For a more detailed analysis, U2OS cells, which exhibit better-defined morphology facilitating accurate segmentation of lysosomes and FAs, were utilized. By employing DiAna to measure the distances between all lysosomes and their closest FAs, in MYO18B-KO cells, lysosomes were situated further from FAs in MYO18B-KO cells relative to their positioning in WT cells (Fig. 6 C). Meanwhile, lysosomes in MYO18B-KO U2OS cells were larger in size than those in WT cells, possibly indicating enhanced homotypic fusion between lysosomes when lysosome–plasma membrane fusion was impaired (Fig. S4 C). To further validate the relationship between lysosomal exocytosis and FAs, dual-color live imaging was performed in U2OS cells co-expressing VAMP7-pHluorin and paxillin-mCherry using TIRF microscopy. The locations of lysosome–plasma membrane fusion events were recorded during 60 s of live imaging and marked as magenta dots on the paxillin-mCherry channel (black) (Fig. 6 D and Video 5). For comparison, an equal number of coordinates were randomly generated within the cell mask and marked as green dots (Fig. 6 D, left). The distance between the actual fusion events or the randomly generated coordinates and their nearest FA point was measured. Results were displayed in a cumulative frequency plot (Fig. 6 D, right). In WT cells, the distribution of experimental fusion events (magenta segmented line) showed significantly closer proximity to FAs than their random distance as assessed using simulated (in silico) data (green and black segmented lines). This proximity indicates a preferential association of lysosomal exocytosis with FAs in WT cells. In contrast, in MYO18B-KO cells, this spatial arrangement was lost, indicating a disruption in the coordinated relationship between lysosomal exocytosis and FAs due to the depletion of MYO18B. These results strongly indicate that sites of lysosome fusion with the plasma membrane are tightly regulated, and lysosomal exocytosis occurs in the vicinity of mature FAs.
Representative live cell imaging of WT and MYO18B-KO U2OS cells transiently transfected with paxillin-mcherry (black) and VAMP7-pHluorin (magenta) (TIRF microscopy). Bar, 5 µm. Time-lapse images were captured at 0.2-s intervals for 1 min. Time code is in minute: second format (15 fps). Related to Fig. 6. The playback speed relative to real time is 1:7.5.
Representative live cell imaging of WT and MYO18B-KO U2OS cells transiently transfected with paxillin-mcherry (black) and VAMP7-pHluorin (magenta) (TIRF microscopy). Bar, 5 µm. Time-lapse images were captured at 0.2-s intervals for 1 min. Time code is in minute: second format (15 fps). Related to Fig. 6. The playback speed relative to real time is 1:7.5.
The necessity of mature FAs for lysosomal exocytosis was confirmed by examining lysosomal distribution in cells inhibited for FA formation. To test this, cells were cultured on poly-L-lysine (PLL)-coated cover glasses, a surface that prevents FA formation according to a previous report (Lachuer et al., 2023). In addition to the dramatic morphological changes observed in cells cultured on PLL-coated surfaces, lysosomes were found to be at higher position, with some even located atop the nuclei—an arrangement that was rarely observed in cells grown on non-coated surfaces (Fig. S4 D). Immunofluorescence detection of cell-surface LAMP1 under unpermeabilized conditions revealed a noticeable decrease in fluorescence intensity in cells cultured on PLL-coated cover glasses, further supporting that FAs are required for lysosomal exocytosis (Fig. S4 E). On the other hand, inhibiting focal adhesion kinase (FAK) activity in HeLa cells either through the use of the specific inhibitor PF573228 or via gene ablation led to an increase in plasma membrane repairing capability which suggested increased lysosomal exocytosis (Fig. S4 F). FAK plays a pivotal role in regulating FA turnover, with cells deficient in FAK activity exhibiting increased number and size of FAs (Ilić et al., 1995). The enhanced lysosomal exocytosis in FAK-deficient cells reinforces the importance of mature FA to lysosomal exocytosis.
MSC PIEZO1 imports Ca2+ to trigger the fusion between lysosomes and the plasma membrane
Since Ca2+ signal is vitally important for lysosome-plasma membrane fusion, a fusion protein comprising the Ca2+ sensor RCaMP6 and the FAT domain of FAK was employed to determine the local Ca2+ levels at FAs, according to a previous study (Giannone et al., 2004). Epifluorescence live imaging revealed that the probe formed a disk-like punctate pattern, indicating successful recruitment to FAs (Fig. 7 A). In MYO18B-KO HeLa cells, RCaMP6-FAT puncta were reduced in size and a reduction in fluorescent intensity compared with WT cells (Fig. 7, B and C), suggesting a diminished local Ca2+ concentration at FAs in the absence of MYO18B.

MSC PIEZO1 imports Ca 2+ to trigger the fusion between lysosomes and the plasma membrane. (A) Representative wide-field epifluorescent images of the local Ca2+ level at FAs detected by RCaMP6-FAT. Bar, 10 µm. Images are inverted to get a better contrast. (B) Quantification results of RCaMP6-FAT punctate size in HeLa cells (mean ± SD; n = 10 images; N = 2 biological replicates; unpaired two-tailed t test; *P ≤ 0.05). (C) Quantification results of RCaMP6-FAT punctate fluorescent intensity in HeLa cells (mean ± SD; n = 10 images; N = 2 biological replicates; unpaired two-tailed t test; **P ≤ 0.01). (D) Representative plasma membrane repair assay results in TRPML1-KO and PIEZO1-KO HeLa cells. (E) Representative results of HEX secretion in TRPML1-KO and PIEZO1-KO HeLa cells. Data are the mean ± SD from three independent experiments (One-way ANOVA with Dunnett correction; ***P ≤ 0.001; ns, P ≥ 0.05). See also Fig. S5 A. (F) Representative CLSM images of WT, TRPML1-KO, and PIEZO1-KO HeLa cells stained with vinculin. Bar, 10 µm. (G) Quantification results of FAs >0.5 µm2 (mean ± SD; n = 10 images; N = 2 biological replicates; One-way ANOVA with Dunnett correction; **P ≤ 0.01; ns, P ≥ 0.05). (H) Representative results of WT U2OS cells transiently transfected with VAMP7-pHluorin before and after treatment with GsMTx4 (5 µM, 5 min). Summary of 30 s TIRF microscopic live imaging. Lysosome-plasma membrane fusion events are represented as magenta dots. Bar, 5 µm. See also Video 7. (I) Representative results of WT U2OS cells transiently transfected with VAMP7-pHluorin before and after treatment with Yoda1 (1.5 µM, 5 min). Summary of 30 s TIRF microscopic live imaging. Lysosome-plasma membrane fusion events are represented as magenta dots. Bar, 5 µm. See also Video 8. (J) Representative results of WT U2OS cells transiently transfected with VAMP7-pHluorin before and after treatment with ML-SI3 (5 µM, 5 min). Summary of 30 s TIRF microscopic live imaging. Lysosome–plasma membrane fusion events are represented as magenta dots. Bar, 5 µm. See also Video 9. (K) Representative results of WT U2OS cells transiently transfected with VAMP7-pHluorin before and after treatment with ML-SA1 (20 µM, 5 min). Summary of 30 s TIRF microscopic live imaging. Lysosome–plasma membrane fusion events are represented as magenta dots. Bar, 5 µm. See also Video 10. (L) Quantification results of Fig. 7, H–K. Note the number of lysosomal exocytosis events varies in untreated cells in different groups, mainly due to the different VAMP7-pHluorin expression level. (n = 15 cells, N = 5 biological replicates for GsMTx4, 13 cells, 4 biological replicates for Yoda1, 10 cells, 4 biological replicates for ML-SI3, and 15 cells, 5 biological replicates for ML-SA1; mean ± SD; paired t test; *P ≤ 0.05; ***P ≤ 0.001; ****P ≤ 0.0001).
MSC PIEZO1 imports Ca 2+ to trigger the fusion between lysosomes and the plasma membrane. (A) Representative wide-field epifluorescent images of the local Ca2+ level at FAs detected by RCaMP6-FAT. Bar, 10 µm. Images are inverted to get a better contrast. (B) Quantification results of RCaMP6-FAT punctate size in HeLa cells (mean ± SD; n = 10 images; N = 2 biological replicates; unpaired two-tailed t test; *P ≤ 0.05). (C) Quantification results of RCaMP6-FAT punctate fluorescent intensity in HeLa cells (mean ± SD; n = 10 images; N = 2 biological replicates; unpaired two-tailed t test; **P ≤ 0.01). (D) Representative plasma membrane repair assay results in TRPML1-KO and PIEZO1-KO HeLa cells. (E) Representative results of HEX secretion in TRPML1-KO and PIEZO1-KO HeLa cells. Data are the mean ± SD from three independent experiments (One-way ANOVA with Dunnett correction; ***P ≤ 0.001; ns, P ≥ 0.05). See also Fig. S5 A. (F) Representative CLSM images of WT, TRPML1-KO, and PIEZO1-KO HeLa cells stained with vinculin. Bar, 10 µm. (G) Quantification results of FAs >0.5 µm2 (mean ± SD; n = 10 images; N = 2 biological replicates; One-way ANOVA with Dunnett correction; **P ≤ 0.01; ns, P ≥ 0.05). (H) Representative results of WT U2OS cells transiently transfected with VAMP7-pHluorin before and after treatment with GsMTx4 (5 µM, 5 min). Summary of 30 s TIRF microscopic live imaging. Lysosome-plasma membrane fusion events are represented as magenta dots. Bar, 5 µm. See also Video 7. (I) Representative results of WT U2OS cells transiently transfected with VAMP7-pHluorin before and after treatment with Yoda1 (1.5 µM, 5 min). Summary of 30 s TIRF microscopic live imaging. Lysosome-plasma membrane fusion events are represented as magenta dots. Bar, 5 µm. See also Video 8. (J) Representative results of WT U2OS cells transiently transfected with VAMP7-pHluorin before and after treatment with ML-SI3 (5 µM, 5 min). Summary of 30 s TIRF microscopic live imaging. Lysosome–plasma membrane fusion events are represented as magenta dots. Bar, 5 µm. See also Video 9. (K) Representative results of WT U2OS cells transiently transfected with VAMP7-pHluorin before and after treatment with ML-SA1 (20 µM, 5 min). Summary of 30 s TIRF microscopic live imaging. Lysosome–plasma membrane fusion events are represented as magenta dots. Bar, 5 µm. See also Video 10. (L) Quantification results of Fig. 7, H–K. Note the number of lysosomal exocytosis events varies in untreated cells in different groups, mainly due to the different VAMP7-pHluorin expression level. (n = 15 cells, N = 5 biological replicates for GsMTx4, 13 cells, 4 biological replicates for Yoda1, 10 cells, 4 biological replicates for ML-SI3, and 15 cells, 5 biological replicates for ML-SA1; mean ± SD; paired t test; *P ≤ 0.05; ***P ≤ 0.001; ****P ≤ 0.0001).
As for the source of Ca2+ for lysosome-plasma membrane fusion events near FAs, the role of the nonselective cation channel TRPML1, localized on the lysosomal membrane and implicated in lysosomal exocytosis, was considered. Besides, given the observations that lysosome-plasma membrane fusion events clustered near FAs, it was hypothesized that MSCs (e.g., PIEZO1), which are activated locally at FAs by the contraction of stress fibers, could also play a crucial role in facilitating lysosome-plasma membrane fusion. To test these hypotheses, TRPML1 and PIEZO1 were knocked out in HeLa cells (genotype of KO cells in Data S1). Unexpectedly, cells depleted of PIEZO1, but not TRPML1, exhibited compromised plasma membrane repairing capabilities and decreased extracellular HEX activity (Fig. 7, D and E). Knocking down PIEZO1 using siRNA also resulted in decreased cell-surface LAMP1 levels (Fig. S5 A). Meanwhile, the size of FAs in PIEZO1-KO cells was smaller than in WT cells, whereas the size of FAs in TRPML1-KO cells was similar to that observed in WT cells (Fig. 7, F and G). Furthermore, local Ca2+ levels at FAs decreased in PIEZO1-KO cells detected by RCaMP6-FAT (Fig. S5 B). A Ca2+ sensor (jGCaMP7b) was fused to the C-terminus of LAMP1 to monitor Ca2+ levels near the lysosomal surface in TRPML1-KO cells. Dual-color live imaging of LAMP1-GCaMP7b and Lysotracker indicated partial colocalization, suggesting that Ca2+ could be detected in the vicinity of lysosomes even in the absence of TRPML1 activity, explaining the unaltered lysosomal exocytosis in TRPML1-KO cells (Fig. S5 C and Video 6).

PIEZO1 regulates Ca2+ levels near focal adhesions. (A) Left: Representative flow cytometry results of cell-surface LAMP1 level in PIEZO1 knock-down U2OS cells. Right: Corresponding RT-qPCR assessment of PIEZO1 mRNA level in PIEZO1 knock-down U2OS cells. The expression of PIEZO1 was normalized with HPRT (n = 3 technical replicates; One-way ANOVA with Dunnett correction; ****P ≤ 0.0001). Related to Fig. 7. (B) Top: Representative CLSM images of the local Ca2+ level at FAs in WT and PIEZO1-KO HeLa cells detected by RCaMP6-FAT. Bar, 10 µm. Images are inverted to get a better contrast. Bottom: Quantification results of RCaMP6-FAT punctate size and fluorescent intensity in WT and PIEZO1-KO HeLa cells (mean ± SD; n = 10 images; N = 2 biological replicates; unpaired two-tailed t test; **P ≤ 0.01; ***P ≤ 0.001). Related to Fig. 7. (C) Dual color live image of lysotracker and LAMP1-jGCaMP7b in TRPML1-depleted HeLa cells. Kymographs are generated along the dotted line in the original cell image on the left by multi-kymograph plugin from ImageJ. Related to Fig. 7.

PIEZO1 regulates Ca2+ levels near focal adhesions. (A) Left: Representative flow cytometry results of cell-surface LAMP1 level in PIEZO1 knock-down U2OS cells. Right: Corresponding RT-qPCR assessment of PIEZO1 mRNA level in PIEZO1 knock-down U2OS cells. The expression of PIEZO1 was normalized with HPRT (n = 3 technical replicates; One-way ANOVA with Dunnett correction; ****P ≤ 0.0001). Related to Fig. 7. (B) Top: Representative CLSM images of the local Ca2+ level at FAs in WT and PIEZO1-KO HeLa cells detected by RCaMP6-FAT. Bar, 10 µm. Images are inverted to get a better contrast. Bottom: Quantification results of RCaMP6-FAT punctate size and fluorescent intensity in WT and PIEZO1-KO HeLa cells (mean ± SD; n = 10 images; N = 2 biological replicates; unpaired two-tailed t test; **P ≤ 0.01; ***P ≤ 0.001). Related to Fig. 7. (C) Dual color live image of lysotracker and LAMP1-jGCaMP7b in TRPML1-depleted HeLa cells. Kymographs are generated along the dotted line in the original cell image on the left by multi-kymograph plugin from ImageJ. Related to Fig. 7.
Representative live cell imaging of TRPML1-KO HeLa cells transiently expressing LAMP1-jGCaMP7b (green) stained with lysotracker-far red (magenta) (TIRF microscopy). Bar, 5 µm. Time-lapse images were captured at 0.2-s intervals for 30 s. Time code is in minute: second format (15 fps). Related to Fig. 7. The playback speed relative to real time is 1:10.
Representative live cell imaging of TRPML1-KO HeLa cells transiently expressing LAMP1-jGCaMP7b (green) stained with lysotracker-far red (magenta) (TIRF microscopy). Bar, 5 µm. Time-lapse images were captured at 0.2-s intervals for 30 s. Time code is in minute: second format (15 fps). Related to Fig. 7. The playback speed relative to real time is 1:10.
To validate that the observed impairment in lysosomal exocytosis in PIEZO1-KO cells was a direct consequence of inhibited Ca2+ flux, GsMTx4, a peptide known to block MSCs including PIEZO1, was utilized. After treatment with GsMTx4, a decrease in lysosome–plasma membrane fusion events, as detected by VAMP7-pHluorin, was noted within 5 min in most cells (Fig. 7 H and Video 7). In contrast, the activation of PIEZO1 with Yoda1 significantly increased in lysosome–plasma membrane fusion events (Fig. 7 I and Video 8). ML-SI3, an inhibitor of TRPML1, caused a mild reduction in lysosomal exocytosis (Fig. 7 J and Video 9), whereas ML-SA1, an activator of TRPML1, exhibited less noticeable effects on lysosomal exocytosis (Fig. 7 K and Video 10), suggesting that Ca2+ released by TRPML1 partly contributes to lysosomal exocytosis. Collectively, these data emphasized that MSCs, particularly PIEZO1, play critical roles in facilitating lysosomal exocytosis in at least some cancer cells.
Representative live cell imaging of WT U2OS cell transiently transfected with VAMP7-pHluorin before and after PIEZO1 inhibitor GsMTX4 treatment (TIRF microscopy). Lysosome-plasma membrane fusion events are labeled in red circles. Bar, 5 µm. Time-lapse images were captured at 0.2-s intervals for 30 s. Time code is in minute: second format (15 fps). Related to Fig. 7. The playback speed relative to real time is 1:6.
Representative live cell imaging of WT U2OS cell transiently transfected with VAMP7-pHluorin before and after PIEZO1 inhibitor GsMTX4 treatment (TIRF microscopy). Lysosome-plasma membrane fusion events are labeled in red circles. Bar, 5 µm. Time-lapse images were captured at 0.2-s intervals for 30 s. Time code is in minute: second format (15 fps). Related to Fig. 7. The playback speed relative to real time is 1:6.
Representative live cell imaging of WT U2OS cell transiently transfected with VAMP7-pHluorin before and after PIEZO1 activator Yoda1 treatment (TIRF microscopy). Lysosome-plasma membrane fusion events are labeled in red circles. Bar, 5 µm. Time-lapse images were captured at 0.2-s intervals for 30 s. Time code is in minute: second format (15 fps). Related to Fig. 7. The playback speed relative to real time is 1:6.
Representative live cell imaging of WT U2OS cell transiently transfected with VAMP7-pHluorin before and after PIEZO1 activator Yoda1 treatment (TIRF microscopy). Lysosome-plasma membrane fusion events are labeled in red circles. Bar, 5 µm. Time-lapse images were captured at 0.2-s intervals for 30 s. Time code is in minute: second format (15 fps). Related to Fig. 7. The playback speed relative to real time is 1:6.
Representative live cell imaging of WT U2OS cell transiently transfected with VAMP7-pHluorin before and after TRPML1 inhibitor ML-SI3 treatment (TIRF microscopy). Lysosome–plasma membrane fusion events are labeled in red circles. Bar, 5 µm. Time-lapse images were captured at 0.2-s intervals for 30 s. Time code is in minute: second format (15 fps). Related to Fig. 7. The playback speed relative to real time is 1:6.
Representative live cell imaging of WT U2OS cell transiently transfected with VAMP7-pHluorin before and after TRPML1 inhibitor ML-SI3 treatment (TIRF microscopy). Lysosome–plasma membrane fusion events are labeled in red circles. Bar, 5 µm. Time-lapse images were captured at 0.2-s intervals for 30 s. Time code is in minute: second format (15 fps). Related to Fig. 7. The playback speed relative to real time is 1:6.
Representative live cell imaging of WT U2OS cell transiently transfected with VAMP7-pHluorin before and after TRPML1activator ML-SA3 treatment (TIRF microscopy). Lysosome-plasma membrane fusion events are labeled in red circles. Bar, 5 µm. Time-lapse images were captured at 0.2-s intervals for 30 s. Time code is in minute: second format (15 fps). Related to Fig. 7. The playback speed relative to real time is 1:6.
Representative live cell imaging of WT U2OS cell transiently transfected with VAMP7-pHluorin before and after TRPML1activator ML-SA3 treatment (TIRF microscopy). Lysosome-plasma membrane fusion events are labeled in red circles. Bar, 5 µm. Time-lapse images were captured at 0.2-s intervals for 30 s. Time code is in minute: second format (15 fps). Related to Fig. 7. The playback speed relative to real time is 1:6.
Discussion
In this study, we showed that proteins modified by paucimannose, an understudied class of truncated N-glycans, are generated by lysosomal glycoside hydrolases, including HEXA and HEXB, and are exposed on the cell surface via lysosomal exocytosis. A comprehensive genome-wide knockout gene screening pinpointed MYO18B as a crucial regulator of this process. Moreover, it was discovered that lysosomal exocytosis predominantly occurs in the vicinity of FAs rather than being randomly distributed across the plasma membrane. As an actin crosslinker, MYO18B inherently promotes the assembly of stress fibers essential for FA maturation. The precise spatial confinement of lysosomal exocytosis near FAs is attributed to two main factors: the targeted transport of lysosomes to FAs facilitated by the interaction between microtubules and FAs and the activation of MSCs such as PIEZO1 at FAs, which import extracellular Ca2+ essential for lysosome fusion with the plasma membrane (Fig. 8).

The mechanism of MYO18B promoting lysosomal exocytosis. MYO18B, as an actin crosslinker, promotes the assembly of stress fibers, which in turn facilitates FA maturation. Lysosomes moving along microtubules are transported to FAs, as a result of the intimate interaction between microtubule and FA mediated by CLASPs and other adaptor proteins. The contractile force generated by stress fiber is conveyed to the plasma membrane at around FAs which causes an increased membrane tension and activates mechanosensitive cation channel PIEZO1. The Ca2+ imported into the cell by PIEZO1 triggers lysosome-plasma membrane fusion. Paucimannose, a series of truncated N-glycan mainly generated in lysosomes, is secreted through this pathway.
The mechanism of MYO18B promoting lysosomal exocytosis. MYO18B, as an actin crosslinker, promotes the assembly of stress fibers, which in turn facilitates FA maturation. Lysosomes moving along microtubules are transported to FAs, as a result of the intimate interaction between microtubule and FA mediated by CLASPs and other adaptor proteins. The contractile force generated by stress fiber is conveyed to the plasma membrane at around FAs which causes an increased membrane tension and activates mechanosensitive cation channel PIEZO1. The Ca2+ imported into the cell by PIEZO1 triggers lysosome-plasma membrane fusion. Paucimannose, a series of truncated N-glycan mainly generated in lysosomes, is secreted through this pathway.
MYO18B, a recently discovered myosin II family member, is predominantly abundant in cardiac and skeletal striated muscles but is also expressed at low levels in other tissues (Salamon et al., 2003). MYO18B was initially identified as a tumor suppressor in lung cancer and subsequently implicated in several cancers, including ovarian and colorectal cancer (Nakano et al., 2005; Nishioka. et al., 2002; Yanaihara et al., 2004). In contrast, a recent study has suggested a potential role for MYO18B in facilitating tumor progression in hepatocellular carcinoma (Zhang et al., 2018). Consistent with this, knocking out MYO18B reduced the migration of U2OS cells cultured on a 3D Matrigel matrix (Jiu et al., 2019). MYO18B differs from other myosin IIs because it lacks ATPase activity due to several amino acid substitutions in its catalytic pocket. These mutations abolished the protein’s capacity to move along actin filaments, restricting its function solely to actin crosslinking (Latham et al., 2020). Actin crosslinkers are crucial for the assembly of stress fibers and their integration with FAs. The KO of α-actinin, another actin crosslinker, led to compromised FA maturation, highlighting the importance of actin crosslinkers to FA maturation (Choi et al., 2008). MYO18B may function similarly to α-actinin, as indicated by the ability of α-actinin to compensate for lysosomal exocytosis deficiency in MYO18B-KO cells. Generally, the coiled-coil domain is considered responsible for homodimerization for myosin IIs (Heissler and Sellers, 2016). Intriguingly, our data suggest that the N-terminus of MYO18B alone was sufficient to restore the impaired lysosomal exocytosis and FA maturation in MYO18B-depleted HeLa cells. Meanwhile, EGFP-tagged N-terminus of MYO18B displayed a filamentous pattern under microscope, consistent with previous report, which suggested that this region may possess actin chelator ability independent of the coiled-coil domain (Ajima et al., 2008). The ability of MYO18B’s N-terminus to bind actin filaments has also been demonstrated in in vitro experiments (Latham et al., 2020). Structural predictions from AlphaFold2 suggest that this domain forms a disordered loop, which adds confusion to its activity. However, AlphaFold2 has been known to struggle with proteins lacking close sequence-based homologs, which makes this prediction less reliable. To gain deeper insight into the specific role of this unique domain, experimental structural biology data is needed.
The opposite effects of MYO18B and its homolog MYO18A on focal adhesion formation and lysosomal exocytosis present an intriguing yet reasonable phenomenon since, though MYO18B shares a similar central region with MYO18A, its functionally important N-termini is unique. Meanwhile, MYO18B has been identified primarily as an actin crosslinker, whereas MYO18A exhibits more complex functions including indirectly activating myosin II motors and connecting Golgi apparatus to actin cytoskeleton (Dippold et al., 2009; Tan et al., 2008). This functional complexity of MYO18A may contribute to the different phenotypes observed in MYO18B- and MYO18A-KO cells. Additionally, in our study, we knocked out only the MYO18Aα isoform. Therefore, we cannot exclude the possibility that the β and γ isoforms of MYO18A may have roles distinct from those of the α isoform. Given our limited understanding of both MYO18A and MYO18B, further studies are required to elucidate their specific roles in the actin cytoskeleton.
Efficient lysosomal exocytosis relies on two fundamental elements: targeted lysosome trafficking and Ca2+ signaling, both of which are satisfied at FAs. Microtubules are major tracks for vesicular trafficking, including lysosomes, and the interaction between FAs and microtubules has been studied for decades. Earlier studies showed that nocodazole-induced microtubule disassembly increases the number and size of FAs, which disassemble once nocodazole is removed (Bershadsky. et al., 1996; Ezratty et al., 2005). More recently, microtubule plus-end tracking protein CLASPs were found to be recruited to FAs by LL5β, effectively tethering microtubules to FA (Stehbens et al., 2014). Given that microtubules serve as primary tracks for vesicle transport, the transportation and secretion of vesicles in the vicinity of FAs are expected. Indeed, integrin-containing vesicles and Rab6-positive secretory vesicles fused with plasma membrane around FAs, consistent with the observation of lysosomal exocytosis (Fourriere et al., 2019; Huet-Calderwood et al., 2017).
MSCs such as PIEZO1 are potential Ca2+ sources for FA-localized lysosomal exocytosis. PIEZO1 could be recruited to FA in a myosin II contraction-dependent manner (Chen et al., 2018; Yao et al., 2022). The stress fiber connected to FAs can produce contractile force exceeding 100 pN, which could be conveyed to FA through mechanosensitive proteins like talin, adequate for PIEZO1 activation (∼55 pN) (Cheng et al., 2020; Goult et al., 2018; Lin et al., 2019). Moreover, a report similar to our study observed lysosomal exocytosis occurring near FAs and found that the positioning of these was favored at sites with high membrane tension (Lachuer et al., 2023). Although the authors did not delve into the mechanism behind this correlation, we suggest that the increased membrane tension facilitates the opening of PIEZO1 channel, which could enhance lysosomal exocytosis by increasing the local Ca2+ influx. In this study, knocking out PIEZO1 or inhibiting its channel activity with GsMTx4 effectively blocked lysosomal exocytosis, whereas activating PIEZO1 with Yoda1 prompted lysosomal exocytosis. The potential role of PIEZO1-mediated Ca2+ influx in lysosomal exocytosis suggested a finely tuned interplay between cellular mechanosensing, Ca2+ signaling, and lysosomal function. In contrast, knocking out or inhibiting TRPML1, the nonselective cation channel on the lysosomal membrane previously considered the major source of Ca2+ for lysosomal exocytosis, only mildly altered lysosome–plasma membrane fusion, suggesting that at least PIEZO1 plays major roles in lysosomal exocytosis in HeLa and U2OS cancer cells. Several studies demonstrated that diminished TRPML1 activity correlates with reduced lysosomal exocytosis, whereas enhancing TRPML1 expression or activity augments this process (Cui et al., 2021; Funato et al., 2020; Zhong et al., 2023). Nonetheless, an electrophysiological study indicated a substantial decline in TRPML1 channel activity as pH shifts from 4.6 to 7.4, which is relevant because peripheral lysosomes typically exhibit a near-neutral luminal pH, potentially inhibiting the function of TRPML1 (Johnson et al., 2016; Li et al., 2017). Moreover, Ca2+ release through TRPML1 facilitated the dephosphorylation and nuclear translocation of TFEB, a crucial transcription factor for lysosome biogenesis (Medina and Ballabio, 2015). Therefore, determining whether alterations in lysosomal exocytosis in cells with modified TRPML1 activity are a direct consequence of its channel activity or mediated through long-term effects involving TFEB requires further exploration.
The targeted localization of lysosomal exocytosis near FAs provides clues to a potential biological role for lysosomes in these areas. One plausible hypothesis is that lysosomal exocytosis releases hydrolases that can degrade integrin and ECM proteins or trim the glycans on them, which are crucial for cell–ECM interactions and cancer cell migration. This process could be particularly relevant in the tumor microenvironment, where the acidic pH favors the activity of lysosomal hydrolases. Particularly, the remodeling of glycans on proteins on the cell surface by glycoside hydrolases triggers the turnover of the surface proteins via lectin-dependent endocytosis (Yang et al., 2015). Recently, it has been reported that an epidermal growth factor (EGF) signaling induces desialyation of cell surface glycoproteins, including integrins, followed by galectin-driven endocytosis (MacDonald et al., 2023, Preprint). Endocytosed integrins are reglycosylated at the Golgi apparatus and repurposed to regulate EGF-dependent invasive cell migration. Further research is necessary to ascertain whether lysosomal exocytosis plays a role in cell migration or tumor metastasis. FAs are predominantly observed in 2D cell culture environments. In contrast, in 3D hydrogel cultures, although integrin-based adhesive sites persist, they do not form extensive clusters like FAs (Long et al., 2022; Stowers et al., 2019). Similarly, suspension cells, including THP-1 cells, in which screening was performed, only possess transient adhesion sites. The capacity of small adhesive sites in 3D cultured cells and transient adhesive sites in suspension cells to recruit lysosomal exocytosis warrants further investigation.
Materials and methods
Reagents and antibodies
The following chemicals were used in this research: 4-Methylumbelliferyl 2-Acetamido-2-deoxy-β-D-glucopyranoside (Cat#M3030; TCI), Rhodamine Phalloidin Reagent (Cat#ab235138; Abcam), PF-573228 (Cat#HY-10461; MedChemExpress), Pitstop2 (Cat#SML1169; Merck), Ionomycin (Cat#10004974; Cayman Chemical), Vacuolin-1 (Cat#20425; Cayman Chemical), Brefeldin A Solution (1000X) (Cat#00-4506-51; Thermo Fisher Scientific), Lyso-Tracker Red (Cat#C1046; Beyotime,), Yoda1 (Cat#21904; Cayman Chemical), GsMTx-4 (Cat#4393-s; Peptide Institute. Inc.), ML-SI3 (Cat#SML3678; Merck), and ML-SA1 (Cat#131-18531; Wako). The antibodies used in this research are listed in Table S3.
Cell culture
THP-1, HEK293, and HeLa cells were routinely maintained in the laboratory. HEK293 and HeLa cells were authenticated by short tandem repeat profiling. U2OS cells were obtained from the American Type Culture Collection (HTB-96). THP-1 cells were maintained in Roswell Park Memorial Institute (RPMI) 1640 medium supplemented with 10% fetal bovine serum (FBS). HEK293, HeLa, and U2OS cells were maintained in high-glucose Dulbecco’s modified Eagle’s medium (DMEM) supplemented with 10% FBS. All cells were cultured at 37°C in humidified air containing 5% CO2.
Recombinant DNA construction
To construct KO plasmids, oligonucleotides corresponding to sgRNA targeting genes HEXA, HEXB, MYO18B, PTK2, PIEZO1, and TRPML1 were designed by the E-CRISP website (Heigwer et al., 2014). Paired oligonucleotides were annealed and inserted into the pX330-EGFP backbone linearized by the restriction nuclease BpiI.
The plasmid containing full-length MYO18B cDNA with an N-terminal EGFP tag was a gift from Pekka Lappalainen (University of Helsinki, Helsinki, Finland). To construct MYO18B truncates having 1–555; 1–1,398; 1–2,089, and full-length MYO18B, DNA fragments were amplified by PCR. The pLenti-BSD vector was linearized by BamHI and XbaI, and the DNA fragment was inserted between cutting sites. To construct MYO18B truncates having 554–1356 and 556–2089 MYO18B, pLenti-EGFP-BSD was linearized by PCR and fused with DNA fragments by infusion cloning.
cDNAs of ACTN1, VAMP7, FAT domain of FAK, and LAMP1 were amplified from the human cDNA library (Ultimate ORF LITE Clones; Thermo Fisher Scientific). The WT SLO gene was synthesized chemically. pMOS005: superecliptic pHluorin (cytosolic; plasmid #163049; Addgene) (Werley et al., 2020) and pCAG-cyto-RCaMP1h (plasmid #105014; Addgene) (Hirabayashi et al., 2017) were obtained from Addgene. pEGFP-N1-jGCaMP7b-XC (plasmid #178361; Addgene) (Geng et al., 2022) was kindly provided by Xiaodong Liu (Beihang University, Beijing, China). SLO was inserted into the pET28A vector linearized by restriction nucleases EcoRI and XhoI. Ecliptic pHluorin was amplified from pMOS005: superecliptic pHluorin (cytosolic) by PCR and inserted into the pME18 vector linearized by restriction nucleases XhoI and NotI. The resulting construct was linearized by PCR and fused with VAMP7 by infusion cloning. To construct pLenti-paxillin-mCherry, mCherry was first inserted into pLenti-BSD vector linearized by XbaI and BamHI. The resulting pLenti-mCherry-BSD was linearized by PCR and fused with paxillin amplified from pEGFP-paxillin-mEos4b (Kenichi Suzuki) by infusion cloning. To construct pLenti-RCaMP1h-FAT, the FAT domain of FAK was fused to the pCAG-cyto-RCaMP1h vector by infusion cloning. The RCaMP1h-FAT fragment was amplified by PCR and inserted into the pLenti-BSD vector linearized by XbaI and BamHI. To construct pLenti-ACTN1-EGFP-BSD, ACTN1 was first inserted into the pME-EGFP vector between restriction nucleases EcoRI and MluI. The ACTN1-EGFP fragment was amplified and fused with the pLenti-BSD vector by infusion cloning. To construct pLenti-LAMP1-jGCaMP7b, LAMP1 was first inserted into the pME-EGFP vector between EcoRI and MluI. The LAMP1-EGFP fragment was amplified by PCR and inserted into pLenti-BSD linearized by XbaI and BamHI. EGFP was replaced with jGCaMP7b by infusion cloning. All plasmids were verified by sequencing. The details of the plasmid sequences are available upon request. Primers used to construct the plasmids above are listed in Table S4.
Transfection and KO cell line generation
Transfection based on Lipofectamine 3000 was performed according to the manufacturer’s instructions. Briefly, cells were seeded in a six-well tissue culture plate 24 h before transfection and allowed to reach ∼80% confluence. 2 h before transfection, the culture medium was refreshed. For transfection, 5 µl Lipofectamine 3000 and 2.5 µg DNA with 5 µl P3000 reagent were added to 125 µl Opti-MEM reduced serum medium, respectively. The mixture was gently vortexed and combined after incubation at room temperature for 10 min. The transfection mixture was added to cells. The cell culture medium was refreshed 12 h after transfection. Analysis of transfected cells was conducted 48–72 h after transfection.
To knockdown MYO18B and PIEZO1, siRNAs were transfected into cells according to the manufacturer’s instructions (Lipofectamine RNAi MAX; Thermo Fisher Scientific). Briefly, 400 µl Opti-MEM and 60 pmol siRNA (Thermo Fisher Scientific) were added to a 6-well-plates and mixed well. 4 µl Lipofectamine RNAi MAX was added to the mixture and kept at room temperature for 10 min. 4 × 10⁵ cells suspended in 2 ml DMEM were added to the mixture and mixed thoroughly. The cells were replaced with two 6-well plates 24 h after transfection and further cultured 48 h before experiments. Real-time PCR was performed to assess the effect of gene silencing. Primers used are listed in Table S4.
To construct KO cell lines, cells transfected with pX330-sgRNA-EGFP KO constructs were sorted using a cell sorter, and EGFP-positive cells were collected. Limiting dilution was performed to obtain clonal cells. The genomic DNA of obtained clones was extracted, and the sgRNA targeting region was amplified by PCR and confirmed by Sanger sequencing. Clones with frameshift deletion were selected for further phenotypic verification.
Lentivirus production and infection
To produce lentivirus-based vectors, pLenti-BSD with the gene of interest inserted was co-transfected with psPAX and pMD2.G into LentiX 293T cells. The culture medium containing lentivirus was collected 36 and 60 h after transfection. The virus-containing medium was filtered through a 0.45-µm polyvinylidene fluoride membrane and used for infection in the presence of polybrene (10 µg/ml; Nacalai). For stable line generation, the medium was replaced with fresh DMEM 24 h after infection. The culture medium was replaced with DMEM containing blasticidin (10 µg/ml; Invivogen) after 24 h. Cells were always kept in a blasticidin-containing medium. When subjected to analysis, cells were replated in a blasticidin-free medium and cultured for 24 h before assay.
Biotinylation of plasma membrane protein
Cell surface protein biotinylation was performed according to the manufacturer’s instructions (Pierce Cell Surface Biotinylation and Isolation Kit; Thermo Fisher Scientific) with minor modifications. Briefly, THP-1 cells were harvested, washed thrice with warm HBSS with Ca2+ and Mg2+, and treated with 1 µM ionomycin for 5 min in HBSS with Ca2+ and Mg2+ at 37°C. Ionomycin was removed by centrifugation, and cells were washed thrice with cold phosphate-buffered saline (PBS). Biotinylation was performed at 4°C for 3 h on an end-to-end rotator. The labeling reagent (Sulfo-NHS-SS-Biotin) was removed by centrifugation, and cells were further washed thrice by cold TBS. Cells were lysed by lysis buffer containing a 1% protease inhibitor cocktail. Biotinylated protein was trapped with NeutrAvidin-agarose and eluted by an elution buffer containing 10 mM dithiothreitol (DTT). The eluted protein was analyzed by immunoblotting.
Glycomic analysis
Protein lysates of HeLa cells (WT, HEXA-KO, and HEXB-KO) were obtained by using a RIPA cell lysis buffer supplemented with protease inhibitors. Protein extracts (20 µg/sample) were reduced by 10 mM dithiothreitol (DTT) for 30 min, 37°C, and then alkylated using 40 mM iodoacetamide (IAA) for 30 min in dark. The alkylation reaction was stopped using excess DTT. N-glycans were released from the protein extracts and then desalted. In brief, protein extracts were blotted in technical triplicates (n = 3) on a primed 0.45 mm polyvinylidene difluoride membrane, left overnight to dry, stained with direct blue, excised, and transferred to separate wells in a flat bottom polypropylene 96-well plate. Blots were blocked with 1% (wt/vol) polyvinylpyrrolidone in 50% aqueous methanol and washed with water. The N-glycans were released enzymatically using N-glycosidase F (PNGase F) in 20 µl water for 16 h at 37°C. The released N-glycans were hydroxylated using 100 mM aqueous ammonium bicarbonate, pH 5, 1 h at room temperature and reduced using 1 M NaBH4 in 50 mM KOH at 50°C for 3 h. The reduction was quenched using glacial acetic acid. The liberated glycans were then desalted using self-packed 10 μl tips containing carbon resin (Supelclean, ENVI-Carb) (∼2 mm packing height) on a C18 stage tip. Prior to use, the microcolumns were washed with 50 μl 0.1% trifluoroacetic acid (TFA) in 90% acetonitrile (ACN) and equilibrated twice using 50 μl aqueous 0.1% TFA. The glycan samples were then loaded onto the conditioned microcolumns, washed with water, eluted by using 50 µl 0.1% TFA in 50% ACN and 49.9% H2O (vol/vol/vol), dried, reconstituted in H2O, and transferred to high recovery glass vials for LC-MS/MS. Bovine fetuin was included as a reference glycoprotein to confirm efficient N-glycan release and sample handling.
The N-glycans were resuspended in deionized water, and all technical triplicates (n = 3) from all cell lines were injected onto a heated (50°C) HyperCarb porous graphitized carbon (PGC) LC capillary column (1 × 30 mm, 3 μm particle size; Thermo Fisher Scientific) operated by an Agilent 1260 HPLC system coupled with a Thermo LTQ Velos Pro linear ion-trap mass spectrometer. The N-glycans were separated over a multistep 60-min gradient of solvent A (10 mM aqueous ammonium bicarbonate) and solvent B (10 mM ammonium bicarbonate in 70% [vol/vol] ACN): 0–3 min—0% B, 4 min – 14% B, 40 min – 40% B, 48 min – 56% B, 50–54 min – 100% B, 56–60 min – 0% B at a constant flow rate of 4 µl/min. The mass spectrometer was operated in negative polarity mode with a HESI source temperature of 55°C, spray voltage of 2.75 kV, sheath gas flow 13, auxiliary gas flow 7, and capillary temperature of 275°C. The full zoom scan was performed with a scan range m/z 500–2,000, automatic gain control (AGC) of 3 × 10⁴, three micro scans, and maximum 100-ms accumulation time. The top five precursors were selected for MS/MS (scan range m/z 200–2,000, AGC of 1 × 10⁴, maximum 100 ms accumulation time, isolation window m/z 1.4, and normalized collision energy 33).
The raw LC-MS/MS data were browsed using Xcalibur v2.2. Glycans were manually identified based on monoisotopic molecular mass, MS/MS fragmentation pattern, and PGC-LC retention time. EIC-based, area-under-the-curve glycan quantification was performed using Skyline v.23.1 (Ashwood et al., 2019). The relative N-glycan abundance was determined as a proportion of all the N-glycans in each sample, and ratiometric analyses of relevant glycan structures were performed in WT versus KO cells with subsequent statistical comparison utilizing one-tailed (hypothesis-driven) Student’s t tests. Glycans were depicted using GlycoWorkBench v2.1 according to the latest SNFG nomenclature.
Glycoproteomic analysis
HeLa and HEK293 cells were lysed on a plate, whereas THP-1 cells were collected and lysed in a 15 ml Falcon tube with 8 M urea and 1 M ammonium bicarbonate buffer for 30 min on ice. Cell lysates were sonicated for 5 min and centrifuged at 15,000 ×g for 20 min at 4°C. The supernatant was collected, and the protein concentration was determined by the BCA assay. Proteins (500 µg) were reduced by 10 mM DTT at 56°C for 45 min and alkylated with 20 mM iodoacetamide in the dark for 30 min at room temperature. The solutions were diluted eightfold in 40 mM ammonium bicarbonate, and sequencing grade trypsin was added to the solution at 1:40 (wt/wt), followed by incubation overnight at 37°C. Glycopeptides were enriched from the incubated mixture using Oasis MAX extraction cartridges (Waters), lyophilized by speed vac, and resuspended in 2% ACN/0.1% formic acid buffer. The LC MS/MS-based glycoproteomic analysis was performed as previously reported (Wen et al., 2022). Briefly, 2 µg glycopeptides were applied to an EASY-nLC 1200 system (Thermo Fisher Scientific) equipped with an internal RSLC C18 column (75 µm × 25 cm). The mobile phase consisted of mobile phase A (0.1% formic acid) and mobile phase B (90% ACN/0.1% formic acid). The flow rate was maintained at 550 nl/min. The gradient elution was 2–6% B, 1 min; 6–30% B, 90 min; 30–38% B, 22 min; 38–80% B, 5 min; and 80% B, 5 min. The mass detector was a high-resolution Orbitrap Fusion Lumos MS (Thermo Fisher Scientific). Spectra were collected from 350 to 2,000 m/z at a resolution of 60,000 using an AGC target of 4 × 10⁵ and a maximum injection time of 250 ms. Tandem mass spectrometry analysis was performed using the data-dependent HCD fragmentation. The parameters were as follows: resolution of 60,000, collision energy of 35% for HCD, 5% for stepped collision, AGC target 5 × 10⁴, maximum injection time 150 ms, and microscan 1. Raw mass spectrum data were converted to an mzML file and annotated by GPQuest 2.0 and a database containing 45,491 glycopeptides and 252 N-glycans (Toghi Eshghi et al., 2015). The mass tolerance parameters for MS1 and MS2 were 10 and 20 ppm, respectively. The mapped results were further filtered based on the following criteria: (1) FDR <1% for glycopeptides and (2) at least one N-glycan for one peptide spectra match.
CRISPR/Cas9-based KO gene screening
To perform genome-wide CRISPR/Cas9 KO gene screening, LentiX 293T cells were transfected with GeCKO v2 pooled library together with psPAX and pMD2.G by lipofectamine (Sanjana et al., 2014). Lentivirus production was conducted as described above.
THP-1 cells (1.6 × 10⁸) were infected with viruses at a multiplicity of infection of 0.3 in the presence of polybrene for 24 h. Cells were collected by centrifugation and resuspended in a fresh medium. After 24 h, the medium was changed to a medium containing puromycin (1 µg/ml). Cells were allowed to grow in an antibiotic-containing medium for 10 days. The survived cells were harvested and stained for LAMP1. LAMP1-negative cells (lowest 1%) were enriched by a cell sorter and further expanded and cultured for a second round of enrichment. Three rounds of enrichment were performed to obtain a population of cells with low surface LAMP1 levels.
Genomic DNA of low cell surface LAMP1 cells and control unsorted cells was harvested using the Wizard Genomic DNA Purification Kit (Promega). DNA fragments containing sgRNAs were amplified with the corresponding primer and subjected to next-generation sequencing. Raw sequence data were analyzed using the MAGeCKFlute workflow (Wang et al., 2019). The MLE algorithm was used to evaluate the beta score of sgRNAs.
Flow cytometry
Cells (∼5 × 10⁶) were replated into a 6-well tissue culture plate 24 h before the experiment. HeLa and U2OS cells were harvested by a cell sorting solution. THP-1 cells were directly collected and washed with cold PBS. Cells were resuspended in a FACS solution (PBS containing 2.5 mM EDTA, 1% bovine serum albumin [BSA], and 0.1% NaN3) containing mouse anti-human LAMP1 (H4A3) antibody (1:100) and incubated on ice for 20 min. Cells were washed twice with cold FACS solution and stained in FACS solution containing phycoerythrin-conjugated goat anti-mouse IgG (minimal x-reactivity) antibody (1:100) for 20 min on ice. Cells were washed once, resuspended in 200 µl cold FACS solution, and analyzed by flow cytometry.
HEX secretion assay
Cells (∼5 × 10⁶) were replated into a six-well tissue culture plate and cultured for 24 h. The culture medium was collected and centrifuged at 3,000 ×g to remove cell debris. The cell pellet was harvested by trypsin, washed with cold PBS, and lysed in radioimmunoprecipitation assay (RIPA) buffer containing a 1% protease inhibitor cocktail. The cell lysate was centrifugated at 15,000 ×g for 10 min, followed by the collection of the supernatant. The lysate of the HeLa cell was diluted 10 times with H2O before performing the assay, and that of U2OS cell was undiluted. HEX activity was determined by incubating the culture medium or cell lysate in a 96-well plate with 2 mM 4-methylumbelliferyl-2-acetamido-2-deoxy-β-D-glucopyranoside resuspended in sodium citrate buffer (10 mM sodium citrate in H2O, pH 4.2) for 30 min at 37°C. The reaction was quenched by 0.2 M glycine/0.2 M Na2CO3 buffer. Fluorescence was measured by a plate spectrometer at excitation 365 nm/emission 440 nm. Secreted HEX was calculated by the florescent ratio of the culture medium and cell lysate. The protein amount of intracellular fraction used to normalize the fluorescent intensity was measured by BCA assay.
Plasma membrane repairing assay
The plasma membrane repairing assay based on SLO was performed according to a previous study (Tam et al., 2010). The WT SLO gene was synthesized and cloned into the pET28A vector. Histidine-tagged SLO was recombinantly expressed in Rosetta Escherichia coli cells and purified by an affinity column (His Trap High Performance; GE Healthcare) with 1 mM DTT to avoid oxidation.
Cells were replated in a 6-well tissue culture plate for 24 h before the assay. Cells at ∼80% confluence were harvested by cell sorting solution and washed thrice with cold HBSS without Mg2+ and Ca2+. Cells were resuspended in 200 µl HBSS with Ca2+ and Mg2+ containing SLO (the activity of SLO differed from batch to batch, so a pre-experiment was needed to determine the dilution of the particular batch) and incubated on ice for 5 min to allow the binding of SLO. Cells were incubated at 37°C for 10 min to allow lysosomal exocytosis-mediated plasma membrane repair and shifted on the ice again. PI (final concentration 50 µg/ml) was added to cells before flow cytometry analysis. At least 1 × 10⁵ cells were analyzed for each sample.
TIRF microscopy
The pH-sensitive fluorescent protein ecliptic pHluorin was fused to the C-terminus of VAMP7, a lysosome-specific v-SNARE. The fusion protein VAMP7-pHluorin was transiently transfected into WT or MYO18B-KO U2OS cells by Lipofectamine. In dual-color imaging, paxillin-mCherry was co-transfected. 12 h after transfection, cells were replated on 35-mm glass-bottomed dishes (Iwaki) and cultured for another 48 h. During live imaging, the culture medium was replaced with warm HBSS with Ca2+ and Mg2+. Live images were acquired with a custom-built objective lens-type TIRF microscope based on a Nikon Eclipse Ti2 scaffold equipped with a 100× oil immersive objective lens (N.A. = 1.49), and 488 nm (EXCSR-488C-100-CDRHG-W; Spectra-Physics) and 561 nm (Jive 300; Cobolt) lasers were used to illuminate the sample whose intensity was adjusted by a set of neutral density filters. For dual-color imaging, the emitted fluorescent was split by a 560-nm dichroic mirror (T560LPXR; Chroma), passed through band-pass filters for green channel (ET525/50 m; Chroma) or red channel (ET600; Chroma), and collected by a cooled scientific CMOS camera (Hamamatsu Orca-Quest). Time-lapse images were captured at 0.2-s intervals for 30 s or 1 min as indicated in specific video legends. The exposure was controlled by a mechanical shutter system (Model SR474; Stanford Research Systems). The hardware was controlled by HCImage Acquisition software (Hamamatsu). The temperature of the whole imaging system was kept at 37°C by a homemade ambient system. The following drugs were used to treat cells: GsMTx-4 (5 µM), Yoda1 (1.5 µM), ML-SI3 (5 µM), and ML-SA1 (20 µM). Data were acquired before and 5 min after the addition of the drug.
Wound healing assay
WT and MYO18B-KO HeLa cells were seeded in a 24-well tissue culture plate and cultured for 24 h. The cell monolayer was scratched with a 200 µl pipette tip. Cells were cultured in FBS-free DMEM for 24 h. Images were taken after 4, 8, 12, and 24 h scratching. Cell migration was evaluated by dividing the scratched area at different time points by the original scratched area. For live imaging, after scratching, cells were observed with a Nikon Eclipse Ti2 microscope equipped with 20× PLAN APO objective lens (N.A. = 0.45) under a transmitted light source (NI-LH Precentered Lamphouse; Nikon). Images were taken every minute for 12 h. Autofocus was performed every five images to avoid focus drift.
Lysosome traffic monitoring
WT and MYO18B-KO HeLa cells were seeded in a 35-mm glass-bottomed Petri dish and cultured for 2 days before imaging. Cells were stained with Lysotracker in HBSS with Mg2+ and Ca2+ for 20 min at 37°C and washed with warm HBSS thrice. Wide-field Epi-fluorescent live imaging was performed on a Nikon Eclipse Ti2 microscope equipped with an oil immersive 60× PLAN APO objective lens (N.A. = 1.40). Cells were illuminated by a mercury lamp (Intensilight; Nikon) with neutral density filters to adjust their intensity. Images were taken every 3 s for a total of 3 min. Exposure time was set to 500 ms. The Perfect Focus System provided by Nikon NIS-Elements was used to fix the imaging plane. Cells were always kept in HBSS with Mg2+ and Ca2+ warmed to 37°C during image acquisition.
FA turnover measurement
Immunofluorescence microscopy
For immunofluorescence microscopy, cells were cultured on glass coverslips coated with gelatin or collagen I for ∼2 days before the experiment. For cell surface paucimannose detection, the experiment was conducted in an unpermeabilized condition. Cells were treated with the following drugs: pitstop2 (20 µM, 25 min), ionomycin (1 µM, 5 min), vacuolin-1 (1 µM, 1.5 h), and brefeldin A (5 µg/ml, 3 h). Ionomycin treatment was in HBSS with Mg2+ and Ca2+; the other was in FBS-free DMEM. After treatment, cells were immediately placed on ice to stop membrane traffic. Cells were fixed in PBS containing 4% paraformaldehyde for 20 min at room temperature. The fixation was quenched with PBS containing 40 mM NH4Cl for 5 min at room temperature after washing with PBS thrice. Cells were blocked in a blocking solution (PBS containing 10% FBS) for 1 h. Cells were incubated in a blocking solution containing Mannitou Ab (1:5, hybridoma cell culture) for 1 h at room temperature. After washing with a blocking solution five times, cells were incubated in a blocking solution containing goat anti-mouse IgM (μ-chain) Alexa Fluor 488 (1:1,000). Cells were counterstained with Hoechst 33258, washed five times with blocking solution, and mounted in ProLong Diamond Antifade Mountant.
Other immunostaining experiments were conducted in a permeabilized condition. All steps were the same as the permeabilized condition, except that the blocking solution used in all steps was further supplemented with 0.1% saponin to permeabilize the plasma membrane. The primary antibodies used were mouse anti-human CD107a/LAMP1 (H4A3; 1:500), rabbit anti-vinculin (1:500), and CD44 polyclonal antibody (pAb; 1:500). The secondary antibodies used were goat anti-mouse IgG (H + L) Alexa Fluor 405 (1:1,000), goat anti-mouse IgG (H + L) Alexa Fluor 488 (1:1,000), goat anti-mouse IgG (H + L) Alexa Fluor 594 (1:1,000), goat anti-rabbit IgG (H + L) Alexa Fluor 488 (1:1,000), and goat anti-rabbit IgG (H + L) Alexa Fluor 594 (1:1,000).
Immunofluorescence data were acquired using wide-field epifluorescence or CLSM. Wide-field microscopy was carried out on a Nikon inverted microscope (Eclipse Ti2) with an oil immersive 60× PLAN APO objective lens (N.A. = 1.40). The samples were illuminated by a mercury arc lamp, and images were acquired by a monochrome CMOS camera (Nikon DS-Qi2). CLSM was performed on a Zeiss LSM710 microscope with a 60× oil immersive objective (N.A. = 1.40). The lasers used were HeNe 405, 488, and 516 nm. Images were acquired with a photomultiplier detector. The scanning area was adjusted to fulfill Nyquist sampling criteria (∼0.11 µm/pixel). For z-stacking, images were acquired at 0.5-µm intervals on the z-axis.
Immunoblotting
Cells were lysed in RIPA buffer (50 mM Tris-HCl [pH 7.5], 150 mM NaCl, 1% NP-40, 0.5% sodium deoxycholate, and 0.1% SDS) supplemented with a protease inhibitor cocktail (Merck). For plasma membrane protein, the samples were obtained as described above. Protein samples were analyzed using sodium dodecyl sulfate-polyacrylamide gel electrophoresis and transferred to a polyvinylidene fluoride membrane. The membrane was blocked in 5% silk milk (all samples, except Mannitou Ab) or 3% BSA (for Mannitou Ab). Primary antibody incubation was performed at 4°C overnight, and secondary antibody incubation was performed for 1 h at room temperature. The primary antibodies used were as follows: Mannitou Ab (1:10), mouse anti-human CD107a/LAMP1 (H4A3; 1:2,500), CD44 pAb (1:2,500), and GFP monoclonal antibody (1:2,500). The secondary antibodies used were as follows: goat anti-mouse IgG (H + L chain) pAb-HRP (1:5,000) and goat anti-rabbit IgG (H + L chain) pAb-HRP (1:5,000). The signals were detected by Chemi-Lumi One HRP substrate (Nacalai). Images were obtained with iBright 1,500 (Thermo Fisher Scientific).
Image processing and analysis
To quantify the FA size, raw immunofluorescence images were passed through a low-pass filter (up to three pixels) to reduce pixel noise. Exponential mathematics was applied to the image to further minimize the background. The image was autostretched and applied with Log3D (Laplacian of Gaussian or Mexican Hat) filter (sigma X, Y = 5). FAs were selected by thresholding (Otsu) and measured with analyze particle function (objects <50 pixels are neglected).
For lysosome traffic analysis, raw images were corrected for photobleaching with an exponential decay. The images were deconvolved with DeconvolutionLab2. The point spread function (PSF) required for deconvolution was generated by the PSF generator. The kymograph was generated with KymographClear, which automatically color codes traffic in different directions (Mangeol et al., 2016).
The distance between FAs and lysosomes in U2OS cells was analyzed with DiAna, an object-based colocalization and distance analysis software (Gilles. et al., 2016). Briefly, FAs and lysosomes were split into individual channels and segmented by global intensity threshold, respectively. The edge-to-edge distance between every lysosome and its nearest FA was measured by classical Euclidean distance computation.
Lysosome–plasma membrane fusion events were counted by ExoJ. Although automatic detection provided by ExoJ was powerful, not all exocytosis events could be detected automatically, and some kiss-and-run events were recognized as exocytosis. To avoid such misdetection, a manual check was performed based on automatically detected results. To calculate the distance between lysosomal exocytosis and FAs, the coordinates of fusion events were recorded. The center-to-edge distance was measured as the distance between lysosomal exocytosis and FAs. The random simulation and cumulative frequency plotting were performed with the shuffle function of DiAna.
Quantification and statistical analysis
Statistical significance was assessed with parametric tests. An unpaired, two-tailed t test was used to analyze two groups with a single variable unless indicated otherwise. One-way analysis of variance ANOVA with Dunnett correction was used to analyze three or more groups with a single variable. Adjusted P values were calculated with GraphPad Prism 8.0 (*P ≤ 0.05; **P ≤ 0.01; ***P ≤ 0.001; ****P ≤ 0.0001). Data in the bar plot were representative of at least three independent experiments. Data with error bars are the mean ± SD. In microscopic experiments, n is the number of images and N is the number of biological replicates. Statistical analysis was performed using biological replicates. In enzymatic assay and flow cytometry, n is the number of independently analyzed samples.
Online supplemental material
Fig. S1 shows that MYO18B positively regulates lysosomal exocytosis. Fig. S2 shows that MYO18B is necessary for focal adhesion maturation. Fig. S3 shows that MYO18A and MYO18B play different roles in focal adhesion maturation and lysosomal exocytosis. Fig. S4 shows focal adhesion maturation is essential for lysosomal exocytosis. Fig. S5 shows that PIEZO1 supports Ca2+ necessary for lysosome–plasma membrane fusion. Table S1 shows intact glycopeptide detected in HeLa, THP-1, and HEK293 cells. Table S2 shows paucimannosidic peptides and proteins in HeLa, THP-1, and HEK293 cells. Table S3 lists antibodies used in this study. Table S4 list oligonucleotides used in this study. Video 1 shows representative live cell imaging of WT and MYO18B-KO U2OS cell transiently transfected with VAMP7-pHluorin (TIRF microscopy). Video 2 shows representative live cell imaging of WT and MYO18B-KO HeLa cells migrating in 24-well tissue culture plate (DIC). Video 3 shows representative live cell imaging of WT and MYO18B-KO U2OS cells transiently transfected with paxillin-mcherry (laser scan confocal microscopy). Video 4 shows representative live cell imaging of WT and MYO18B-KO HeLa cells stained with lysotracker-red (Epi fluorescence). Video 5 shows representative live cell imaging of WT and MYO18B-KO U2OS cells transiently transfected with paxillin-mcherry (black) and VAMP7-pHluorin (magenta) (TIRF microscopy). Video 6 shows representative live cell imaging of TRPML1-KO HeLa cells transiently expressing LAMP1-jGCaMP7b (green) stained with lysotracker-far red (magenta) (TIRF microscopy). Video 7 shows representative live cell imaging of WT U2OS cell transiently transfected with VAMP7-pHluorin before and after PIEZO1 inhibitor GsMTX4 treatment (TIRF microscopy). Video 8 shows representative live cell imaging of WT U2OS cell transiently transfected with VAMP7-pHluorin before and after PIEZO1 activator Yoda1 treatment (TIRF microscopy). Video 9 shows representative live cell imaging of WT U2OS cell transiently transfected with VAMP7-pHluorin before and after TRPML1 inhibitor ML-SI3 treatment (TIRF microscopy). Video 10 shows representative live cell imaging of WT U2OS cell transiently transfected with VAMP7-pHluorin before and after TRPML1activator ML-SA3 treatment (TIRF microscopy). Data S1 shows genotypes of all knock-out cell lines generated in this study.
Data availability
The glycoproteomics and glycomics LC-MS/MS raw data underlying Fig. 1, A–C have been deposited to PRIDE (identifier PXD051592) and GlycoPost (accession number: GPST000417), respectively, and are freely available. Any additional information required to reanalyze the data reported in this paper is available from the lead contact upon request.
Acknowledgments
We thank Prof. Pekka Lappalainen (University of Helsinki, Helsinki, Finland) and Prof. Xiaodong Liu (Beihang University, Beijing, China) for kindly providing plasmids. We also thank Ms. Piaopiao Wen (Jiangnan University, Wuxi, China) for mass spectrometry and Mr. Tatsuki Isogai (Gifu University, Gifu, Japan) for TIRF microscopy.
This work was supported by the Japan Society for the Promotion of Science (JSPS) KAKENHI Grant (21K21346), the National Natural Science Foundation of China (32071278), the joint research program of the J-GlycoNet cooperative network, the JSPS Core-to-Core Program (JPJSCCA202000007), the Human Glycome Atlas Project (HGA) from the Ministry of Education, Culture, Sports, Science and Technology (MEXT), and a grant from the Takeda Science Foundation.
Author contributions: W.-W. Ren: Conceptualization, Investigation, Methodology, Writing - original draft, R. Kawahara: Formal analysis, Methodology, K.G.N. Suzuki: Methodology, Writing - review & editing, P. Dipta: Conceptualization, Formal analysis, Investigation, G. Yang: Data curation, Methodology, Supervision, Writing - review & editing, M. Thaysen-Andersen: Investigation, Supervision, Validation, Writing - original draft, Writing - review & editing, M. Fujita: Conceptualization, Funding acquisition, Project administration, Supervision, Writing - original draft, Writing - review & editing.

