
Skip Nav Destination
Close Modal


1-20 of 99
Follow your search
Access your saved searches in your account
Would you like to receive an alert when new items match your search?
1
Journal Articles
In Special Collection:
Ligand-gated ion channels
Journal:
Journal of General Physiology
J Gen Physiol (2019) 151 (4): 452–464.
Published: 11 January 2019
in A single molecular distance predicts agonist binding energy in nicotinic receptors
> Journal of General Physiology
Published: 11 January 2019
Figure 1. Sites, agonists, and cycle. (a) Ligand binding sites. Side view of an acetylcholine binding protein, homologous to the AChR extracellular domain (PDB ID: 3WIP ; Olsen et al., 2014 ). Sites are at subunit interfaces. The agonist (ACh, More about this image found in Sites, agonists, and cycle. (a) Ligand binding sites. Side view of an acet...
in A single molecular distance predicts agonist binding energy in nicotinic receptors
> Journal of General Physiology
Published: 11 January 2019
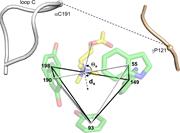
Figure 2. Binding site structures (x-ray) . (a) AChBP with ACh (top; PDB ID: 3WIP ; Olsen et al., 2014 ) or nicotine (bottom; PDB ID: 1UW6 ; Celie et al., 2004 ). Dashed lines are H-bonds; red dot is a structural water. (b) α4β2 AChR with More about this image found in Binding site structures (x-ray) . (a) AChBP with ACh (top; PDB ID: 3WIP ...
in A single molecular distance predicts agonist binding energy in nicotinic receptors
> Journal of General Physiology
Published: 11 January 2019
Figure 3. Binding site structural parameters. Pocket volume was calculated as that of the pyramid formed by joining the centers of the five aromatic rings (front face, white). Distances are between the agonist’s principal nitrogen ( Fig. 1 b ) More about this image found in Binding site structural parameters. Pocket volume was calculated as that o...
in A single molecular distance predicts agonist binding energy in nicotinic receptors
> Journal of General Physiology
Published: 11 January 2019
Figure 4. RMSD of the protein backbone. The backbone equilibrates within ∼10 ns. Most of the residual fluctuations are from loop F. Figure 4. RMSD of the protein backbone. The backbone equilibrates within ∼10 ns. Most of the residual More about this image found in RMSD of the protein backbone. The backbone equilibrates within ∼10 ns. Mos...
in A single molecular distance predicts agonist binding energy in nicotinic receptors
> Journal of General Physiology
Published: 11 January 2019
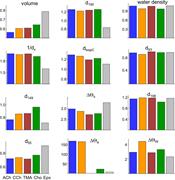
Figure 5. Pocket volume and dx . Resting, brown and active, green. (a) Top: Pocket volume. With all agonists, α−γ is the smallest (AR and AR*). At all sites, AR* is smaller than AR (all agonists) and pocket volume is smallest with TMA. Bottom: More about this image found in Pocket volume and dx . Resting, brown and active, green. (a) T...
in A single molecular distance predicts agonist binding energy in nicotinic receptors
> Journal of General Physiology
Published: 11 January 2019
Figure 6. Water density. The number of water molecules was counted in spheres of radii 5, 10, and 20 Å, with the origin at the pocket center (α−γ). There is no significant difference between AR and AR* conformations or between agonists. The 20 Å More about this image found in Water density. The number of water molecules was counted in spheres of rad...
in A single molecular distance predicts agonist binding energy in nicotinic receptors
> Journal of General Physiology
Published: 11 January 2019
Figure 7. Resting versus active α−γ pocket metrics . Distances are AR*/AR ratios and angles are AR* – AR differences. Left and center columns: Metrics that differ significantly between AR* and AR. For ACh-class agonists (colored bars), in R* More about this image found in Resting versus active α−γ pocket metrics . Distances are AR*/...
in A single molecular distance predicts agonist binding energy in nicotinic receptors
> Journal of General Physiology
Published: 11 January 2019
Figure 8. Energy–structure correlations. (a) Linear correlations between experimental binding energy and binding site metrics (ACh, CCh, TMA, and Cho; all sites; AR and AR*). The highest correlation is with dx. (b) Pearson’s correlation More about this image found in Energy–structure correlations. (a) Linear correlations between experimenta...
in A single molecular distance predicts agonist binding energy in nicotinic receptors
> Journal of General Physiology
Published: 11 January 2019
Figure 9. Resting versus active α−γ neurotransmitter binding site. (a) For all agonists, the active pocket (AR*, green) is smaller than the resting pocket (AR, brown; Fig. 3 ). (b) AR* versus AR with ACh. In the active state, the agonist’s More about this image found in Resting versus active α−γ neurotransmitter binding site. (a) For all agoni...
in A single molecular distance predicts agonist binding energy in nicotinic receptors
> Journal of General Physiology
Published: 11 January 2019
Figure 10. Affinity, efficacy, and efficiency . In each plot, y-axis values are free energies from electrophysiology experiments and x-axis values are distances from equilibrated structures. Open symbols, AR; closed symbols, AR*. (a) Distance More about this image found in Affinity, efficacy, and efficiency . In each plot, y-axis values are free e...
in A single molecular distance predicts agonist binding energy in nicotinic receptors
> Journal of General Physiology
Published: 11 January 2019
Figure 11. CRCs. Symbols are from electrophysiology experiments, and solid lines are calculated from dx values. Inset: CRCs for two agonists that were not used in the energy–dx correlation ( Fig. 10 a ). See Fig. 1 b for agonist structures. More about this image found in CRCs. Symbols are from electrophysiology experiments, and solid lines are ...
Journal Articles
In Special Collection:
Ion channel modulation
, Ligand-gated ion channels
, Ion Channels & Transporters in Immunity
, Structure, Function, and Pharmacology of Ion Channels
Journal:
Journal of General Physiology
J Gen Physiol (2019) 151 (2): 146–155.
Published: 09 January 2019
Includes: Supplementary data
in Organization of ATP-gated P2X1 receptor intracellular termini in apo and desensitized states
> Journal of General Physiology
Published: 09 January 2019
Figure 1. Cysteine reactive cross-linkers dimerize subunits. (A) Model of the hP2X1R showing the location of the G30C mutation (black spheres). The three subunits are shown in gray, light blue, and light pink. (B) Chemical structures of BMB More about this image found in Cysteine reactive cross-linkers dimerize subunits. (A) Model of the hP2X1R...
in Organization of ATP-gated P2X1 receptor intracellular termini in apo and desensitized states
> Journal of General Physiology
Published: 09 January 2019
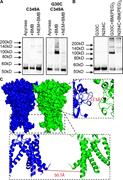
Figure 2. Cross-linking can be prevented by cysteine residue blockade. (A) Representative blots from HEK293F cells transfected with hP2X1 C349A and G30C C349A, treated with 3.2 U/ml apyrase only, apyrase then BMB, or apyrase then NEM followed by More about this image found in Cross-linking can be prevented by cysteine residue blockade. (A) Represent...
in Organization of ATP-gated P2X1 receptor intracellular termini in apo and desensitized states
> Journal of General Physiology
Published: 09 January 2019
Figure 3. Specific amino-terminal cysteine residues form cross-links. (A) Representative blots from HEK293F cells transfected with hP2X1 C349A, R25C, N26C, K27C, K28C, V29C, or G30C treated with 3.2 U/ml apyrase, then BMB or DMSO (apyrase only). More about this image found in Specific amino-terminal cysteine residues form cross-links. (A) Representa...
in Organization of ATP-gated P2X1 receptor intracellular termini in apo and desensitized states
> Journal of General Physiology
Published: 09 January 2019
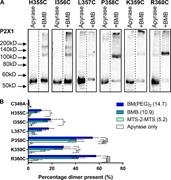
Figure 4. Specific carboxyl-terminal cysteine residues form cross-links. (A) Representative blots from HEK293F cells transfected with hP2X1 C349A H355C, I356C, L357C, P358C, K359C, or R360C treated with 3.2 U/ml apyrase, then BMB or DMSO More about this image found in Specific carboxyl-terminal cysteine residues form cross-links. (A) Represe...
in Organization of ATP-gated P2X1 receptor intracellular termini in apo and desensitized states
> Journal of General Physiology
Published: 09 January 2019
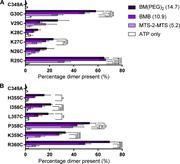
Figure 5. Specific amino and carboxyl-terminal cysteine residues form cross-links with ATP pretreatment. (A) Histogram showing the average percentage dimer present for R25C to G30C tested with all three cross-linkers in the presence of 300 µM More about this image found in Specific amino and carboxyl-terminal cysteine residues form cross-links wit...
in Organization of ATP-gated P2X1 receptor intracellular termini in apo and desensitized states
> Journal of General Physiology
Published: 09 January 2019
Figure 6. Visualization of cross-links on structural models. (A) TM1 of the hP2X1R in the closed state and residues 25–29 mutated to cysteines with BMB (10.9 Å) as cross-linker. (B) Cartoon representation of TM1 and N-terminal region (one More about this image found in Visualization of cross-links on structural models. (A) TM1 of the hP2X1R i...
1

