NMDA-type ionotropic glutamate receptors mediate excitatory neurotransmission and synaptic plasticity, but aberrant signaling by these receptors is also implicated in brain disorders. Here, we present the binding site and the mechanism of action for UCM-101, a novel negative NMDA receptor modulator that produces full inhibition of NMDA receptor–mediated excitatory postsynaptic currents in hippocampal CA pyramidal neurons from juvenile mouse brain slices. UCM-101 has a 59-fold higher binding affinity at GluN1/2A compared with GluN1/2B receptors and inhibits diheteromeric GluN1/2A and triheteromeric GluN1/2A/2B receptors with IC50 values of 110 and 240 nM, respectively, in the presence of 1 µM glycine. The novel binding mode for UCM-101 is revealed in a high-resolution crystal structure of the GluN1/2A agonist binding domain heterodimer. UCM-101 and its analog TCN-213 inhibit NMDA receptors by negatively modulating co-agonist binding to the GluN1 subunit via an allosteric mechanism that is conserved with previously described GluN2A-selective antagonists, TCN-201 and MPX-004. Despite the shared mechanism of action, the structural determinants that mediate subunit selectivity for UCM-101 are distinct from those of TCN-201 and MPX-004. These findings provide detailed insights into the binding site and mechanism of action of a novel NMDA receptor modulator and open new avenues for the development of NMDA receptor ligands with therapeutic potential.
Introduction
N-methyl-D-aspartate (NMDA) receptors are ionotropic glutamate receptors that are widely expressed in the central nervous system (CNS) and play critical roles in excitatory neurotransmission and normal brain function, including processes related to neuronal development and synaptic plasticity (Nabavi et al., 2014; Hansen et al., 2021; Nicoll and Schulman, 2023). Aberrant NMDA receptor signaling is also implicated in a wide range of CNS disorders, and NMDA receptors have therefore garnered considerable interest as therapeutic targets (Hansen et al., 2017; Hansen et al., 2021; Dupuis et al., 2023; Egunlusi and Joubert, 2024; Hanson et al., 2024). The majority of neuronal NMDA receptors are composed of two glycine/D-serine binding GluN1 subunits and two glutamate binding GluN2 subunits that assemble as a heterotetrameric complex to form a central ligand-gated ion channel (Karakas and Furukawa, 2014; Lee et al., 2014; Glasgow et al., 2015; Hansen et al., 2018; Wang and Furukawa, 2019). These GluN1/2 receptors require simultaneous binding of both glycine/D-serine and glutamate for channel gating (i.e., activation) (Benveniste and Mayer, 1991; Clements and Westbrook, 1991). The four GluN2A-D subunits have distinct temporal and spatial expression patterns and equip NMDA receptor subtypes with distinct functional properties (Monyer et al., 1992, 1994; Akazawa et al., 1994; Vicini et al., 1998; Erreger et al., 2007; Yuan et al., 2009). Consequently, the GluN2 subunits dictate the physiological roles of NMDA receptor subtypes and there is considerable interest in the development of subunit-selective allosteric modulators that may enable brain region–specific or cell type–specific pharmacological intervention through NMDA receptor subtype specificity (Hansen et al., 2017; Hansen et al., 2021; Egunlusi and Joubert, 2024; Hanson et al., 2024).
TCN-201, MPX-004, and MPX-007 (Fig. 1 A) are GluN2A-selective negative allosteric modulators (NAMs) (Bettini et al., 2010; Edman et al., 2012; Hansen et al., 2012; Volkmann et al., 2016; Yi et al., 2016; Lotti et al., 2025) that have proven useful as pharmacological tool compounds in a number of studies (Hildebrand et al., 2014; Izumi and Zorumski, 2015; Swanger et al., 2015; Yi et al., 2019; Chan et al., 2020; Li et al., 2020; Troyner and Bertoglio, 2021). These modulators bind the subunit interface between GluN1 and GluN2A agonist binding domains (ABDs), and their selectivity is primarily mediated by interactions with the nonconserved residue GluN2A V783, since larger residues at this position, such as phenylalanine in GluN2B and leucine in GluN2C/D, sterically occlude NAM binding (Hansen et al., 2012; Yi et al., 2016). Binding of TCN-201 and MPX compounds at the ABD dimer interface stabilizes the GluN1 ABD in an open conformation, akin to the apo state, resulting in negative allosteric modulation of glycine binding (Yi et al., 2016). Glycine binding therefore reciprocally prevents NAM binding by stabilizing a closed GluN1 ABD conformation, which is the initial conformational change required for channel gating.

Evaluation of NAMs at NMDA receptor subtypes. (A) Chemical structures of NAMs, UCM-101, TCN-213, TCN-201, MPX-004, and MPX-007. (B) Representative two-electrode voltage-clamp recordings from recombinant GluN1/2A or GluN1/2B receptors activated by the indicated concentration of glycine in the continuous presence of 100 µM glutamate and inhibited by increasing concentrations of TCN-213 or UCM-101. (C) Concentration–response data for TCN-213, UCM-101, and TCN-201 at NMDA receptor subtypes activated by 1 µM glycine in the continuous presence of 100 µM glutamate. (D) Concentration–response data for TCN-213, UCM-101, and TCN-201 at NMDA receptor subtypes activated by a glycine concentration close to the glycine EC50 in the continuous presence of 100 µM glutamate (1 µM glycine for GluN1/2A, 0.3 µM for GluN1/2B and GluN1/2C, and 0.1 µM for GluN1/2D). A dashed line indicates data for GluN1/2A from (C). See Tables 1 and 2 for NAM IC50 and glycine EC50 values.
Evaluation of NAMs at NMDA receptor subtypes. (A) Chemical structures of NAMs, UCM-101, TCN-213, TCN-201, MPX-004, and MPX-007. (B) Representative two-electrode voltage-clamp recordings from recombinant GluN1/2A or GluN1/2B receptors activated by the indicated concentration of glycine in the continuous presence of 100 µM glutamate and inhibited by increasing concentrations of TCN-213 or UCM-101. (C) Concentration–response data for TCN-213, UCM-101, and TCN-201 at NMDA receptor subtypes activated by 1 µM glycine in the continuous presence of 100 µM glutamate. (D) Concentration–response data for TCN-213, UCM-101, and TCN-201 at NMDA receptor subtypes activated by a glycine concentration close to the glycine EC50 in the continuous presence of 100 µM glutamate (1 µM glycine for GluN1/2A, 0.3 µM for GluN1/2B and GluN1/2C, and 0.1 µM for GluN1/2D). A dashed line indicates data for GluN1/2A from (C). See Tables 1 and 2 for NAM IC50 and glycine EC50 values.
Selective inhibition of GluN2A-containing NMDA receptors may be beneficial in a range of CNS diseases (Zhou and Sheng, 2013; Soto et al., 2014; Moretto et al., 2018), including depression (Su et al., 2023), Rett syndrome (Durand et al., 2012; Mierau et al., 2016), L-DOPA–induced dyskinesia (Hallett et al., 2005; Gardoni et al., 2006; Gardoni et al., 2012; Mellone et al., 2015), and de novo GluN2A mutations identified in pediatric patients with neurological disorders (Yuan et al., 2015; Myers et al., 2019). However, TCN-201 and MPX ligands lack blood–brain barrier penetration, hampering their therapeutic potential and in vivo research utility (Volkmann et al., 2016). While past medicinal chemistry efforts to design new compounds based on TCN-201 were not able to generate highly active GluN2A-selective NAMs (Bettini et al., 2010; Volkmann et al., 2016; Müller et al., 2017; Schreiber et al., 2018; Summer et al., 2019; Rajan et al., 2021), recent studies optimized the MPX ligand scaffold to develop potent GluN2A-selective NAMs with drug-like properties and in vivo utility (Bischoff et al., 2025; Lord et al., 2025). Although TCN-213 (Fig. 1 A) displays markedly lower inhibitory potency, this compound is a GluN2A-selective NAM with a chemical scaffold that is different from those of TCN-201 and MPX ligands (Bettini et al., 2010; McKay et al., 2012).
Here, we report a novel, potent GluN2A-preferring NAM, UCM-101 (Fig. 1 A), which is an analog of TCN-213, and we reveal that UCM-101 assumes a previously unexplored binding mode in the modulatory site at the subunit interface between GluN1 and GluN2A ABDs. Furthermore, we demonstrate that the mechanism of allosteric inhibition by TCN-213 and UCM-101 is conserved with the mechanism previously described for TCN-201 and MPX ligands (Hansen et al., 2012; Yi et al., 2016), despite the different chemical scaffolds and distinct binding modes in the allosteric site. The new chemical scaffold adopted by UCM-101 and the unexplored binding mode afford new opportunities to design novel classes of NMDA receptor modulators.
Materials and methods
DNA constructs and ligands
The cDNAs encoding rat NMDA receptor subunits, GluN1-1a (GenBank accession numbers U11418 and U08261), GluN2A (D13211), GluN2B (U11419), GluN2C (M91563), and GluN2D (L31611), were used for in vitro cRNA transcription (Hansen et al., 2013). To enable the synthesis of GluN2B cRNA, a T7 RNA polymerase termination site was removed from the open reading frame without altering the amino acid sequence as previously described (Hansen et al., 2014). The DNA construct for GluN1-N499C+Q686C (GluN1-CC) was provided by Dr. Gabriella K. Popescu (Kussius and Popescu, 2010). For selective expression of triheteromeric GluN1/2A/2B receptors, previously described DNA constructs were used (Hansen et al., 2014; Yi et al., 2024), in which the C-terminal domain for GluN2A was swapped into GluN2B (GluN2B2A), and peptide tags composed of a rigid α-helical linker followed by GABAB receptor heterodimeric coiled-coil motifs (C1 or C2) and a endoplasmic reticulum retention signal were spliced onto the C terminus of GluN2A and GluN2B2A (hereafter denoted as GluN2AC1 and GluN2BC2) (Fig. S1). Site-directed mutagenesis was performed using standard QuikChange protocols, and amino acids are numbered according to the full-length protein, including the signal peptide.

Selective expression of triheteromeric GluN1/2A/2B receptors. (A) Representation of the polypeptide chain for GluN2A and GluN2B subunits with the NTD, the ABD formed by S1 and S2, the transmembrane domain formed by M1, M2, M3, and M4, and the intracellular CTD. GluN2AC1 and GluN2BC2 were generated by replacing the GluN2B CTD with the GluN2A CTD and fusing engineered C1 and C2 peptide tags to the CTD as previously described (Hansen et al., 2014; Yi et al., 2024). (B) Co-expression of GluN1 with GluN2AC1 and GluN2BC2 can produce three populations of functional NMDA receptors. Diheteromeric GluN1/2AC1/2AC1 and GluN1/2BC2/2BC2 receptors are prevented from trafficking to the cell surface by unmasked dilysine (KKXX) ER retention signals in the CTD, whereas heterodimeric coiled-coil formation between C1 and C2 tags in triheteromeric GluN1/2AC1/2BC2 receptors masks the ER retention signals and enables trafficking to the cell surface. (C) Representative two-electrode voltage-clamp recordings of responses from recombinant NMDA receptors expressed in Xenopus oocytes activated by 100 µM glutamate + 100 µM glycine. Some GluN1/2AC1/2AC1 and GluN1/2BC2/2BC2 receptors may escape ER retention, and therefore contribute to the total NMDA receptor–mediated currents. GluN2AC1 and GluN2BC2 subunits with mutations in the agonist binding pocket that abolish glutamate binding (indicated as RKTI) render any receptor containing these subunits nonfunctional (Hansen et al., 2014; Yi et al., 2024). Co-expression of GluN1, GluN2AC1, and GluN2BC2-RKTI therefore generates functional receptors that are escaped GluN1/2AC1/2AC1, while co-expression of GluN1, GluN2AC1-RKTI, and GluN2BC2 generates functional receptors that are escaped GluN1/2BC2/2BC2 receptors. (D) Co-expression of GluN1, GluN2AC1, and GluN2BC2 produces robust current responses on days 3–4 after cRNA injection, whereas current responses from GluN1/2AC1/2AC1 and GluN1/2BC2/2BC2 receptors that may have escaped ER retention remained small compared with the total currents. Data are shown as the mean ± SEM, and each bar is from six oocytes. The efficiency of selective GluN1/2A/2B expression can be assessed by determining the functional contribution of escaped receptors using the RKTI mutations. The fractional escape currents, calculated as the sum of escape currents divided by the total current, were 4.1 and 8.3% in the two batches of oocytes used in the experiments. NTD, N-terminal domain; CTD, C-terminal domain.
Selective expression of triheteromeric GluN1/2A/2B receptors. (A) Representation of the polypeptide chain for GluN2A and GluN2B subunits with the NTD, the ABD formed by S1 and S2, the transmembrane domain formed by M1, M2, M3, and M4, and the intracellular CTD. GluN2AC1 and GluN2BC2 were generated by replacing the GluN2B CTD with the GluN2A CTD and fusing engineered C1 and C2 peptide tags to the CTD as previously described (Hansen et al., 2014; Yi et al., 2024). (B) Co-expression of GluN1 with GluN2AC1 and GluN2BC2 can produce three populations of functional NMDA receptors. Diheteromeric GluN1/2AC1/2AC1 and GluN1/2BC2/2BC2 receptors are prevented from trafficking to the cell surface by unmasked dilysine (KKXX) ER retention signals in the CTD, whereas heterodimeric coiled-coil formation between C1 and C2 tags in triheteromeric GluN1/2AC1/2BC2 receptors masks the ER retention signals and enables trafficking to the cell surface. (C) Representative two-electrode voltage-clamp recordings of responses from recombinant NMDA receptors expressed in Xenopus oocytes activated by 100 µM glutamate + 100 µM glycine. Some GluN1/2AC1/2AC1 and GluN1/2BC2/2BC2 receptors may escape ER retention, and therefore contribute to the total NMDA receptor–mediated currents. GluN2AC1 and GluN2BC2 subunits with mutations in the agonist binding pocket that abolish glutamate binding (indicated as RKTI) render any receptor containing these subunits nonfunctional (Hansen et al., 2014; Yi et al., 2024). Co-expression of GluN1, GluN2AC1, and GluN2BC2-RKTI therefore generates functional receptors that are escaped GluN1/2AC1/2AC1, while co-expression of GluN1, GluN2AC1-RKTI, and GluN2BC2 generates functional receptors that are escaped GluN1/2BC2/2BC2 receptors. (D) Co-expression of GluN1, GluN2AC1, and GluN2BC2 produces robust current responses on days 3–4 after cRNA injection, whereas current responses from GluN1/2AC1/2AC1 and GluN1/2BC2/2BC2 receptors that may have escaped ER retention remained small compared with the total currents. Data are shown as the mean ± SEM, and each bar is from six oocytes. The efficiency of selective GluN1/2A/2B expression can be assessed by determining the functional contribution of escaped receptors using the RKTI mutations. The fractional escape currents, calculated as the sum of escape currents divided by the total current, were 4.1 and 8.3% in the two batches of oocytes used in the experiments. NTD, N-terminal domain; CTD, C-terminal domain.
See Supplementary text at the end of the PDF for details on the synthesis of UCM-101. TCN-201, DCKA, 7CKA, NBQX, gabazine, and DL-AP5 were purchased from Hello Bio. TCN-213 and MPX-004 were obtained from Alomone Labs. Glutamate and glycine stock solutions were prepared at 10 and 100 mM, respectively, in recording solution. Stock solutions of all other ligands were prepared at 10–100 mM in DMSO, and the concentration of DMSO was kept constant throughout recordings and never exceeded a concentration of 0.3%.
Two-electrode voltage-clamp electrophysiology
Maintenance of Xenopus oocytes, purchased from Rob Weymouth (Xenopus 1), was performed as previously described (Hansen et al., 2013). Oocytes were kept in a modified Barth’s solution containing (in mM) 88 NaCl, 2.4 NaHCO3, 1 KCl, 0.33 Ca(NO3)2, 0.41 CaCl2, 0.82 MgSO4, and 10 HEPES (pH 7.5 with NaOH) with 1 IU/ml penicillin, 1 µg/ml streptomycin, and 50 µg/ml gentamycin. To achieve optimal levels of NMDA receptor expression, cRNAs encoding GluN1 and GluN2 subunits were combined at varying ratios, diluted with nuclease-free water, and each oocyte was injected with 50 nl of total cRNA. Recordings were performed at ambient temperatures 2–4 days after cRNA injection in an extracellular recording solution containing (in mM) 90 NaCl, 1 KCl, 0.5 BaCl2, 0.01 EDTA, and 10 HEPES (pH 7.4 with NaOH). Voltage and current electrodes were both filled with 3.0 M KCl and pulled using a Narishige PC-10 vertical puller. Current responses were measured using a two-electrode voltage-clamp amplifier (OC-725C; Warner Instruments) at a holding potential of −40 mV, and filtered with a 20-Hz low-pass filter (Alligator Technologies) before data acquisition (PCIe-6321, National Instruments). On the recording day, GluN1/2A- and GluN1/2B-expressing oocytes were injected with 30–50 nl of 50 mM BAPTA to prevent activity-dependent increases in response amplitude (Williams, 1993). All recordings were performed using a uniform protocol that represents a reasonable compromise between experimental feasibility and pharmacological accuracy, given the constraints of maintaining stable recordings over extended periods. This approach ensured consistency across experimental conditions, but the measured NAM potencies may, in a few cases, be slightly underestimated, as a slow approach to steady-state responses could mask the full extent of inhibition. For experiments with triheteromeric GluN1/2A/2B receptors, the current response from “escaped” receptors was always compared with the total current response on the day of the experiment as previously described (Hansen et al., 2014; Yi et al., 2024), and experiments were only performed if the “escape” current response was <10% of the total current response (see Fig. S1 for additional details).
Brain slice electrophysiology
Experimental procedures were performed in accordance with state and federal Animal Welfare Acts and were approved by the University of Montana Institutional Animal Care and Use Committee. Mice were group-housed on a 12:12-h light/dark cycle and had ad libitum access to food and water. Male and female juvenile (3–5 wk old) C57BL/6J mice were anesthetized with isoflurane and rapidly decapitated. After decapitation, the brain was removed and immediately submerged in an oxygenated ice-cold NMDG-based cutting/incubation solution containing (in mM) 92 NMDG, 2.5 KCl, 30 NaHCO3, 1.25 NaH2PO4, 20 HEPES, 25 glucose, 2 thiourea, 5 Na-ascorbate, 3 Na-pyruvate, 3 CaCl2, and 10 MgSO4 (pH 7.3). Coronal brain slices (300 µm) containing the dorsal hippocampus were cut on a vibrating microtome (VT1200S; Leica Microsystems) and transferred to oxygenated room-temperature NMDG solution for 30 min. After 30 min, slices were transferred to an artificial cerebral spinal fluid (aCSF) solution containing (in mM) 126 NaCl, 2.5 KCl, 21.4 NaHCO3, 1.2 NaH2PO4, 11.1 glucose, 2.4 CaCl2, and 1.2 MgSO4 and incubated for at least 30 min at room temperature before recordings.
Hippocampal slices were transferred to a slice recording chamber and perfused with aCSF at a flow rate of 2–3 ml/min with temperature maintained at 32°C. Recording electrodes were fabricated with a horizontal pipette puller (P-1000, Sutter Instruments) and filled with internal solution containing (in mM) 120 Cs-methanesulfonate, 15 CsCl, 10 tetraethylammonium chloride, 10 HEPES, 8 NaCl, 3 Mg-ATP, 1.5 MgCl2, 10 QX-314, 0.3 Na-GTP, and 0.2 EGTA, pH 7.3, osmolarity 295–305 mOsm. Pipettes had a tip resistance of 1.8–3.0 MΩ when filled with this solution. Slices were visualized using infrared video microscopy on SliceScope Pro 2000 (Scientifica). Whole-cell patch-clamp recordings were made using a MultiClamp 700B amplifier filtered at 4 kHz (Bessel) and digitized at 10 kHz using Digidata 1440A with pClamp10 software (Molecular Devices). Series resistance was continuously monitored throughout all electrophysiological experiments, and recordings were excluded from analysis if series resistance exceeded 20 MΩ or changed by 20% over the course of the experiment.
Evoked NMDA receptor–mediated excitatory postsynaptic currents (EPSCs) were recorded from CA1 pyramidal cells at a holding potential of +40 mV. Electrical stimulation was delivered via a bipolar electrode positioned along the Schaffer collaterals at an interstimulus interval of 30 sec. NBQX (10 µM) and gabazine (10 µM) were used to block non-NMDA glutamate receptors and GABAA receptors, respectively. Following a period of at least 10 min in the whole-cell configuration, a 5-min baseline recording of EPSCs was collected, before select compounds (3 µM) were bath-applied. Finally, the NMDA receptor antagonist DL-AP5 (100 µM) was applied at the end of the recording.
Crystallography of GluN1 and GluN2A ABDs
DNA constructs for the GluN1 ABD, containing an amino-terminal 6×His-tag, a thrombin cleavage site, and residues 394–544 and 663–800 from rat GluN1 joined by a Gly–Thr dipeptide linker, and the GluN2A ABD, containing an amino-terminal 6×His-tag, the small ubiquitin-like modifier (SUMO), and residues 402–539 and 661–802 from rat GluN2A joined by a Gly–Thr dipeptide linker, were provided by Dr. Hiro Furukawa. The ABDs were expressed essentially as described previously (Furukawa and Gouaux, 2003; Jespersen et al., 2014), except SHuffle T7 Express Escherichia coli cells (New England Biolabs), and BB media were used for protein production (Bosco et al., 2025). See Supplemental text at the end of the PDF for details on ABD protein purification and crystallization. Diffraction data were collected at the 17-ID-2 beamline of the National Synchrotron Light Source II at Brookhaven National Laboratory, and images were processed using the autoPROC suite (Vonrhein et al., 2011) including XDS (Kabsch, 2010), POINTLESS (Evans, 2006), AIMLESS (Evans and Murshudov, 2013), CCP4 (Winn et al., 2011), and STARANISO (Tickle et al., 2018). The structure was determined by molecular replacement using PHASER (McCoy et al., 2007) with the published DCKA/glutamate-bound GluN1/2A ABD structure (PDB ID: 4NF4) (Jespersen et al., 2014) as a search model. Structural refinement and model building were performed using PHENIX (Adams et al., 2010) and Coot (Emsley et al., 2010). Ligand CIF files were prepared using eLBOW (Moriarty et al., 2009). Data collection and refinement statistics are shown in Table S3. The coordinates and structure factors for the GluN1/2A ABD heterodimer structure with DCKA/glutamate/UCM-101 have been deposited to the Protein Data Bank under the accession code 9NYZ. The ligand–protein interaction diagram was created using LigPlot+ (Laskowski and Swindells, 2011), and structural figures were prepared using the PyMOL Molecular Graphics System, Version 2.4, Schrödinger, LLC.
Statistical analysis and data presentation
Agonist and modulator concentration–response data were analyzed with GraphPad Prism (GraphPad Software) by fitting the Hill equation to data for individual oocytes as previously described (Hansen et al., 2012). The binding dissociation constant KB and the allosteric binding interaction constant (α) were evaluated for UCM-101 and TCN-213 using the Schild analysis as previously described (Hansen et al., 2012; Yi et al., 2016; Lotti et al., 2025). Glycine concentration–response data acquired in the presence and absence of modulator were analyzed using global nonlinear regression fitting the agonist EC50 (i.e., in the absence of modulator) and modulator KB and α as shared values that best describe all the data, and EC50’ (i.e., in the presence of modulator) and Hill slope (nH) as variables between each concentration–response curve. For graphical representation, the dose ratio (DR = EC50’/EC50) is calculated for each concentration of modulator and log (DR-1) is plotted against log [B], where [B] is the modulator concentration that corresponds to EC50’. NMDA receptor-mediated EPSC amplitudes were measured from the average of 3–5 consecutive sweeps, and weighted decay time (τW) values were calculated from values obtained from a double exponential to the deactivation time course as previously described (Yi et al., 2020). Experimenters were not blinded to compound treatment or NMDA receptor subtype expression used for the experiments. Experimental data were repeated on at least two different days as independent experiments (i.e., using new recording solutions) with multiple mice for recordings from brain slices and multiple batches of oocytes for two-electrode voltage-clamp recordings. All sample sizes (N values) represent independent biological replicates. Data are expressed as the mean ± SEM unless otherwise stated, and statistical analyses were performed as described in the figure and table legends. Statistical tests for differences in EC50 and IC50 values were performed using logEC50 and logIC50 values from individual oocytes.
Online supplemental material
Fig. S1 shows control experiments to assess the selective expression of triheteromeric GluN1/2A/2B receptors and provide additional details on the method. Fig. S2 shows glycine concentration–response data at wild-type and mutant GluN1/2A receptors. Fig. S3 shows electron densities for UCM-101 and residues in the allosteric binding site. Fig. S4 shows inhibition of wild-type and mutant GluN1/2A receptors by TCN-213. Table S1 provides logIC50 values for inhibition of wild-type and mutant NMDA receptor subtypes by GluN2A-selective NAMs. Table S2 provides glycine logEC50 values for activation of wild-type and mutant NMDA receptor subtypes. Table S3 provides data collection and refinement statistics for the crystal structure of the GluN1/2A ABD. Supplemental text at the end of the PDF provides the synthesis route for UCM-101.
Results
Evaluation of negative modulators at NMDA receptor subtypes
We generated concentration–inhibition data at NMDA receptor subtypes activated by 1 µM glycine in the presence of saturating 100 µM glutamate. The IC50 values for inhibition of GluN1/2A by TCN-213, UCM-101, and TCN-201 were 0.83, 0.11, and 0.10 µM, respectively (Fig. 1 and Table 1). Thus, the potency of UCM-101 increased 7.5-fold compared with the parent compound TCN-213 and is comparable to the potency of TCN-201. Estimation of subtype selectivity in 1 µM glycine suggested that UCM-101 was 17-, 35-, and 118-fold selective for GluN1/2A over GluN1/2B, GluN1/2C, and GluN1/2D receptors, respectively, whereas TCN-213 and TCN-201 were >50-fold selective for GluN1/2A over GluN1/2B-D receptors (Table 1). While assessment of subunit selectivity at a physiologically relevant glycine concentrations, which are estimated to be 0.5–10 µM (Bergeron et al., 1998; Billups and Attwell, 2003; Bae et al., 2021), enables predictions of NMDA receptor inhibition in vivo or ex vivo, the observed selectivity can be misleading given the variation in glycine potency among GluN1/2A-D receptor subtypes (Fig. S2 and Table 2) and the negative allosteric interaction between glycine and NAM binding. To account for this variation, we determined NAM IC50 values at GluN1/2A-D receptors activated by a glycine concentration close to their respective EC50 values. Under these conditions, TCN-213 exhibited intermediate GluN2A selectivity (22-, 16-, and 29-fold), UCM-101 displayed lower GluN2A selectivity (7.4-, 9.1-, and 12-fold), while TCN-201 was most selective for GluN1/2A over GluN1/2B-D (30-, >50-, and 39-fold) (Fig. 1 and Table 1). Thus, UCM-101 and, to a lesser extent, TCN-213 have modestly reduced GluN2A selectivity compared with TCN-201.
Inhibition of NMDA receptors by GluN2A-selective NAMs
| | | UCM-101 | TCN-213 | TCN-201 | ||||||
|---|---|---|---|---|---|---|---|---|---|---|
| [Glycine] (µM) | IC50 (µM) (95% CI) | nH | N | IC50 (µM) (95% CI) | nH | N | IC50 (µM) (95% CI) | nH | N | |
| GluN1/2Aa | 1 | 0.11 (0.09–0.13) | 1.6 | 7 | 0.83 (0.67–1.03) | 1.1 | 12 | 0.10 (0.07–0.13) | 1.2 | 12 |
| GluN1/2Ab | 1 | 0.16 (0.13–0.21) | 1.4 | 12 | 0.96 (0.74–1.24) | 1.1 | 12 | - | | |
| GluN1/2Ac | 30 | 0.66d (0.56–0.78) | 1.4 | 14 | 10d (7–16) | 1.3 | 10 | - | | |
| GluN1/2A/2Ba | 1 | 0.24d (0.22–0.28) | 1.3 | 14 | 4.0d (3.6–4.5) | 0.9 | 14 | 0.28d (0.25–0.31) | 1.2 | 15 |
| GluN1/2Ba | 0.3 | 0.81d (0.68–0.97) | 1.5 | 9 | 18d (17–20) | 1.3 | 9 | 3.0d (2.8–3.3) | 1.6 | 10 |
| GluN1/2Ba | 1 | 1.9d (1.5–2.4) | 1.1 | 12 | ND | | 7 | ND | | 8 |
| GluN1/2Ca | 0.3 | 1.0d (0.8–1.3) | 1.3 | 9 | 13d (7–27) | 1.1 | 11 | ND | | 7 |
| GluN1/2Ca | 1 | 3.8d (2.9–4.9) | 1.2 | 12 | ND | | 7 | ND | | 8 |
| GluN1/2Da | 0.1 | 1.3d (1.1–1.5) | 1.5 | 11 | 24d (19–30) | 1.5 | 10 | 3.9d (3.6–4.1) | 1.9 | 10 |
| GluN1/2Da | 1 | 13d (11–15) | 1.3 | 10 | ND | | 8 | ND | | 8 |
| GluN1-Y535A/2Ac | 3 | 2.9d (2.4–3.7) | 1.2 | 9 | ND | | 8 | - | | |
| GluN1-R755A/2Ac | 3 | 19d (12–29) | 1.2 | 8 | ND | | 7 | - | | |
| GluN1/2A-V529Ic | 1 | 0.22d (0.16–0.32) | 1.3 | 9 | - | | | 0.16d (0.13–0.21) | 1.5 | 6 |
| GluN1/2A-Y754Kc | 1 | 0.18 (0.14–0.23) | 1.4 | 6 | 1.2 (1.0–1.5) | 1.1 | 10 | - | | |
| GluN1/2A-I755Fc | 1 | 0.32d (0.30–0.33) | 1.2 | 9 | 1.1 (0.9–1.3) | 1.0 | 8 | - | | |
| GluN1/2A-I755Vc | 1 | 0.15 (0.12–0.18) | 1.5 | 10 | 1.2 (0.9–1.8) | 1.1 | 9 | - | | |
| GluN1/2A -I755V+Y754Kc | 1 | 0.15 (0.13–0.18) | 1.3 | 12 | 0.68 (0.44–1.04) | 1.0 | 7 | - | | |
| GluN1/2A-V783Fc | 0.5 | 0.21d (0.17–0.26) | 1.5 | 12 | 2.1d (1.6–2.7) | 1.1 | 8 | 0.19d (0.15–0.24) | 1.1 | 8 |
| GluN1/2A-V783Lc | 0.5 | 0.27d (0.22–0.32) | 1.4 | 12 | 3.8d (3.5–4.1) | 1.1 | 10 | 0.74d (0.54–1.02) | 1.1 | 12 |
| GluN1/2A-M788Ic | 1 | 0.55d (0.41–0.74) | 1.4 | 10 | - | | | 0.12 (0.09–0.16) | 1.3 | 8 |
| GluN1/2A-M788Tc | 0.3 | 0.47d (0.34–0.65) | 1.6 | 13 | - | | | 0.14 (0.12–0.17) | 1.4 | 6 |
| GluN1/2A-E789Qc | 1 | 0.19 (0.13–0.28) | 1.2 | 8 | - | | | 0.078 (0.066–0.093) | 1.3 | 8 |
| GluN1/2A-T797Sc | 1 | 0.27d (0.23–0.32) | 1.7 | 8 | - | | | 0.068 (0.054–0.085) | 1.4 | 8 |
IC50 and Hill slope (nH) values for inhibition of wild-type and mutant NMDA receptor subtypes by GluN2A-selective NAMs were determined using two-electrode voltage-clamp recordings. Responses were activated by the indicated glycine and glutamate concentrations. Data are shown with 95% CIs, and N is the number of oocytes. See Table S1 for logarithmic mean ± SD values used to calculate 95% CIs. - indicates not measured, and ND indicates some activity, but potency not determined. 95% CIs, 95% confidence intervals.
indicates responses were measured in the presence of 100 µM glutamate.
indicates responses were measured in the presence of 10 µM glutamate.
indicates responses were measured in the presence of 300 µM glutamate.
indicates that the IC50 value for the indicated NAM is significantly different from the corresponding IC50 value at GluN1/2A (P < 0.05, one-way ANOVA with Tukey’s posttest).

Determination of glycine potencies at wild-type and mutant GluN1/2A receptors. (A) Representative recordings of glycine concentration–response data at wild-type GluN1/2A and mutant GluN1-R755A/2A in the continuous presence of 300 µM glutamate. (B–E) Concentration–response data for wild-type and mutant GluN1/2A receptors. Responses are normalized to the fitted maximum response to glycine. A dashed line indicates data for wild-type GluN1/2A from B. See Table 2 for glycine EC50 values.
Determination of glycine potencies at wild-type and mutant GluN1/2A receptors. (A) Representative recordings of glycine concentration–response data at wild-type GluN1/2A and mutant GluN1-R755A/2A in the continuous presence of 300 µM glutamate. (B–E) Concentration–response data for wild-type and mutant GluN1/2A receptors. Responses are normalized to the fitted maximum response to glycine. A dashed line indicates data for wild-type GluN1/2A from B. See Table 2 for glycine EC50 values.
Activation of NMDA receptors by glycine
| | Glycine EC50 (µM) (95% CI) | nH | N |
|---|---|---|---|
| GluN1/2Aa | 1.0 (0.9–1.1) | 1.6 | 28 |
| GluN1/2Bb | 0.24c (0.22–0.25) | 1.8 | 13 |
| GluN1/2Cb | 0.21c (0.19–0.22) | 1.6 | 10 |
| GluN1/2Db | 0.091c (0.084–0.096) | 1.3 | 14 |
| GluN1-Y535A/2A | 4.6c (3.8–5.4) | 1.5 | 10 |
| GluN1-R755A/2A | 2.6c (2.3–3.0) | 1.9 | 12 |
| GluN1/2A-V529I | 1.2 (1.0–1.4) | 1.5 | 8 |
| GluN1/2A-Y754K | 1.0 (0.9–1.2) | 1.6 | 8 |
| GluN1/2A-I755F | 1.1 (0.9–1.2) | 1.9 | 12 |
| GluN1/2A-I755V | 0.97 (0.9–1.04) | 1.6 | 12 |
| GluN1/2A-I755V+Y754K | 1.2 (1.0–1.5) | 1.7 | 10 |
| GluN1/2A-V783F | 0.47c (0.41–0.53) | 1.8 | 12 |
| GluN1/2A-V783L | 0.61c (0.53–0.69) | 1.7 | 17 |
| GluN1/2A-M788I | 0.74c (0.66–0.83) | 1.7 | 6 |
| GluN1/2A-M788T | 0.32c (0.3–0.34) | 1.7 | 12 |
| GluN1/2A-E789Q | 4.7c (4.1–5.4) | 1.6 | 8 |
| GluN1/2A-T797S | 1.2 (1.1–1.3) | 1.5 | 12 |
Glycine EC50 and Hill slope (nH) values at wild-type and mutant NMDA receptor subtypes were determined using two-electrode voltage-clamp recordings in the continuous presence of 300 µM glutamate. Data are shown with 95% CIs, and N is the number of oocytes. See Table S2 for logarithmic mean ± SD values used to calculate 95% CIs. 95% CIs, 95% confidence intervals.
denotes values taken from Lotti et al. (2025).
denotes values taken from Zhao et al. (2022).
indicates values significantly different from GluN1/2A (P < 0.05, one-way ANOVA with Tukey’s posttest).
To determine whether UCM-101 produces stronger inhibition of triheteromeric GluN1/2A/2B receptors compared with TCN-201, we utilized a previously described approach to control the subunit composition of NMDA receptors (see Fig. S1 for details) (Hansen et al., 2014; Yi et al., 2024). We determined IC50 values at GluN1/2A/2B receptors activated by 1 µM glycine, consistent with the previously reported EC50 value of 0.99 µM (Lotti et al., 2025). The IC50 values for inhibition of GluN1/2A/2B receptors by TCN-213, UCM-101, and TCN-201 were 4.0, 0.24, and 0.28 µM, respectively (Fig. 2 and Table 1). Thus, UCM-101 and TCN-201 exhibit similar potencies at triheteromeric GluN1/2A/2B receptors, despite the increased potency of UCM-101 at GluN1/2B receptors compared with TCN-201. These results are consistent with previous studies suggesting the GluN2A subunit exerts a dominant allosteric influence in triheteromeric GluN1/2A/2B receptors (Hansen et al., 2014; Lu et al., 2017; Sun et al., 2017; Lotti et al., 2025).

Negative allosteric modulation of triheteromeric GluN1/2A/2B receptors. Concentration–response data for TCN-213, UCM-101, and TCN-201 were determined using two-electrode voltage-clamp recordings of responses from recombinant GluN1/2A/2B receptors activated by 1 µM glycine in the continuous presence of 100 µM glutamate. Dashed lines indicate data for diheteromeric GluN1/2A and GluN1/2B from Fig. 1 D. See Table 1 for NAM IC50 values. See Fig. S1 for control experiments and details on the approach to selectively express triheteromeric GluN1/2A/2B receptors without confounding co-expression of diheteromeric GluN1/2A and GluN1/2B receptors.
Negative allosteric modulation of triheteromeric GluN1/2A/2B receptors. Concentration–response data for TCN-213, UCM-101, and TCN-201 were determined using two-electrode voltage-clamp recordings of responses from recombinant GluN1/2A/2B receptors activated by 1 µM glycine in the continuous presence of 100 µM glutamate. Dashed lines indicate data for diheteromeric GluN1/2A and GluN1/2B from Fig. 1 D. See Table 1 for NAM IC50 values. See Fig. S1 for control experiments and details on the approach to selectively express triheteromeric GluN1/2A/2B receptors without confounding co-expression of diheteromeric GluN1/2A and GluN1/2B receptors.
Inhibition of NMDA receptor–mediated EPSCs in CA1 pyramidal neurons
While UCM-101 and TCN-201 display similar potencies at GluN1/2A and GluN1/2A/2B receptors, the increased activity of UCM-101 at GluN1/2B receptors would be expected to limit its utility as a pharmacological tool for selective inhibition of neuronal GluN2A-containing NMDA receptors. We therefore directly compared inhibition of NMDA receptor–mediated EPSCs from CA1 pyramidal neurons in juvenile (3–5 wk old) mouse hippocampal brain slices using TCN-213, UCM-101, TCN-201, and MPX-004. These juvenile CA1 pyramidal neurons express GluN1 and both GluN2A and GluN2B subunits, and a large component of their NMDA receptor–mediated EPSCs is mediated by triheteromeric GluN1/2A/2B receptors (Gray et al., 2011; Rauner and Kohr, 2011; Yi et al., 2019; Sicard et al., 2025). While it is firmly established that GluN2A subunit expression gradually increases during development (Sheng et al., 1994; Bellone and Nicoll, 2007; Gray et al., 2011), it remains less clear how GluN2B subunits partition between diheteromeric GluN1/2B and triheteromeric GluN1/2A/2B receptors, with studies suggesting a sizable fraction assemble into diheteromeric GluN1/2B receptors in the hippocampus (Al-Hallaq et al., 2007; Kellermayer et al., 2018; Anderson et al., 2025; Sicard et al., 2025; Zhang et al., 2025). In this experiment, MPX-004 was included due to its higher binding affinity (KB = 9.3 nM) and stronger negative allosteric interaction (α = 0.0018) compared with TCN-201 (KB = 42 nM, α = 0.0032) (Lotti et al., 2025). TCN-213 (3 µM) produced a modest 16 ± 3% inhibition of NMDA receptor–mediated EPSCs relative to baseline EPSC amplitudes measured before NAM application (Fig. 3). In stark contrast, the application of UCM-101 (3 µM) resulted in 89 ± 3% inhibition, whereas TCN-201 (3 µM) and MPX-004 (3 µM) resulted in similar 35 ± 6% and 34 ± 4% inhibition, respectively (Fig. 3). These results not only demonstrate the stronger inhibition by UCM-101 compared with TCN-213, but also illustrate the limited GluN2A selectivity of UCM-101 compared with TCN-201 and MPX-004. With the caveat that glycine and D-serine concentrations are unknown, TCN-201 and MPX-004 would be expected to primarily inhibit GluN1/2A and GluN1/2A/2B receptors based on results shown in Figs. 1 and 2. The difference in inhibition by UCM-101 compared with TCN-201, which have similar activity at GluN1/2A and GluN1/2A/2B receptors, suggests that a component of the EPSCs is mediated by diheteromeric GluN1/2B receptors. Further evaluation of the EPSCs at baseline and following NAM application shows that MPX-004, but not TCN-201, increases EPSC decay times (Fig. 3 D), consistent with an enrichment of diheteromeric GluN1/2B receptors with slower deactivation times over GluN1/2A and GluN1/2A/2B receptors that display faster deactivation times (Hansen et al., 2014; Sun et al., 2017; Yi et al., 2019). These results highlight the variation in potency and subunit selectivity among TCN-213, UCM-101, TCN-201, and MPX-004, and emphasize the utility of MPX-004 as a useful pharmacological tool for inhibition of neuronal GluN2A-containing NMDA receptors as previously suggested (Volkmann et al., 2016; Yi et al., 2016; Lotti et al., 2025).

Negative allosteric modulation of NMDA receptor–mediated EPSCs. (A) Representative recordings of evoked NMDA receptor–mediated EPSCs from CA1 pyramidal neurons in juvenile (3–5 weeks old) mouse brain slices. The EPSCs were recorded at baseline (black) before the addition of 3 µM NAM (colored), followed by 100 μM AP5 (gray) at the end of the recordings to inhibit NMDA receptor–mediated currents. (B) Averaged data from multiple neuronal recordings show the time course of NMDA receptor–mediated EPSC peak amplitudes normalized to baseline. The bars indicate application of TCN-213 (N = 8), UCM-101 (N = 6), TCN-201 (N = 5), or MPX-004 (N = 6) (N is the number of neurons). Data are shown as the mean ± SEM. (C) Summary of EPSC peak amplitudes following NAM application normalized to baseline peak amplitudes. *denotes a significant difference (P < 0.05, one-way ANOVA with Tukey’s posttest). (D) Summary of the EPSC decay times (weighted deactivation time constant, τW) at baseline and following NAM treatment. ND indicates not determined. *denotes a significant difference (P < 0.05, ratio paired t test).
Negative allosteric modulation of NMDA receptor–mediated EPSCs. (A) Representative recordings of evoked NMDA receptor–mediated EPSCs from CA1 pyramidal neurons in juvenile (3–5 weeks old) mouse brain slices. The EPSCs were recorded at baseline (black) before the addition of 3 µM NAM (colored), followed by 100 μM AP5 (gray) at the end of the recordings to inhibit NMDA receptor–mediated currents. (B) Averaged data from multiple neuronal recordings show the time course of NMDA receptor–mediated EPSC peak amplitudes normalized to baseline. The bars indicate application of TCN-213 (N = 8), UCM-101 (N = 6), TCN-201 (N = 5), or MPX-004 (N = 6) (N is the number of neurons). Data are shown as the mean ± SEM. (C) Summary of EPSC peak amplitudes following NAM application normalized to baseline peak amplitudes. *denotes a significant difference (P < 0.05, one-way ANOVA with Tukey’s posttest). (D) Summary of the EPSC decay times (weighted deactivation time constant, τW) at baseline and following NAM treatment. ND indicates not determined. *denotes a significant difference (P < 0.05, ratio paired t test).
Crystal structure of the GluN1/2A ABD heterodimer in complex with UCM-101
The variation in subunit selectivity between UCM-101 and TCN-201 suggests that these distinct classes of NAMs engage differently with nonconserved GluN2 residues in their modulatory binding site. To define the binding site and the structural mechanisms that mediate subunit selectivity for UCM-101, we determined a crystal structure of the isolated GluN1/2A ABD heterodimer in complex with DCKA, glutamate, and UCM-101 at 1.7 Å resolution (Fig. 4 and Table S3). The competitive glycine site antagonist DCKA stabilizes the open GluN1 ABD conformation, and glutamate stabilizes the closed GluN2A ABD conformation. As previously demonstrated for TCN-201 and MPX ligands (Hansen et al., 2012; Yi et al., 2016; Lotti et al., 2025), stabilization of this GluN1/2A ABD heterodimer conformation should enable high-affinity binding of UCM-101 if the allosteric mechanism is conserved between UCM-101/TCN-213 and TCN-201/MPX ligands. In the structure, UCM-101 occupies the modulatory binding site at the ABD dimer interface with a strikingly different binding mode compared with MPX-007 (Yi et al., 2016) (Fig. 4 E). MPX-007 adopts a U-shaped conformation in the binding site, whereas UCM-101 binds the modulatory site in a more extended conformation. Consequently, the binding pockets occupied by UCM-101 and MPX-007 are overlapping, but notably distinct. Here, we define a UCM subsite by the residues uniquely engaged by UCM-101, and we define a TCN/MPX subsite by residues only engaged by TCN-201, MPX-004, and MPX-007 (Fig. 4 E). The higher potency of UCM-101 compared with TCN-213 is presumably mediated by additional hydrophobic ligand–receptor interactions in the UCM subsite afforded by the ethyl group of UCM-101. Compared with MPX-007, UCM-101 interacts differently, or, to a much lesser extent, with the nonconserved GluN2A V783 residue, which is the primary determinant of GluN2A selectivity for TCN-201 and MPX ligands (Hansen et al., 2012; Yi et al., 2016). Binding of UCM-101 is mediated by extensive hydrophobic interactions, as well as three hydrogen bonds between the exocyclic nitrogen of UCM-101 and the backbone carbonyl of GluN2A E530, the cyclic nitrogen of UCM-101 and the backbone nitrogen of GluN2A E530, and the amide nitrogen of UCM-101 and the backbone carbonyl of GluN2A F528 (Fig. 4, C and D). Furthermore, two water molecules bridge the carbonyl oxygen of UCM-101 and the backbone of GluN1 R755 through hydrogen bonding (Fig. 4, C and D; and Fig. S3). While UCM-101 primarily interacts with residues in the GluN2A subunit, three GluN1 residues, namely, Y535, R755, and S756, also contribute to the binding site (Fig. 4, C and D).
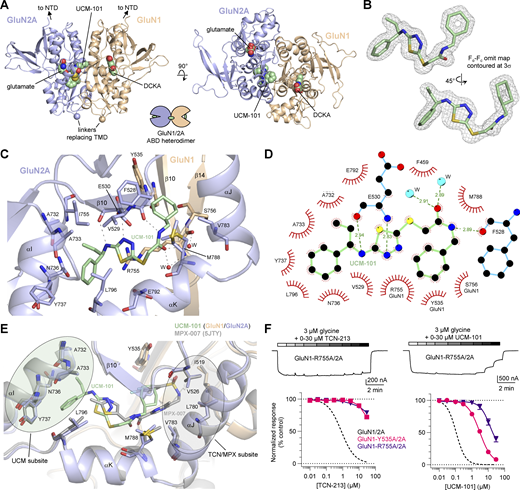
Crystal structure of the GluN1/2A ABD heterodimer with DCKA, glutamate, and UCM-101. (A) Views of the GluN1/2A ABD heterodimer structure with ligands shown in spheres. The competitive GluN1 antagonist DCKA stabilizes the ABD in an open cleft conformation, while the GluN2 agonist glutamate stabilizes the ABD in a closed cleft conformation. UCM-101 binds an allosteric site at the heterodimer interface between the orthosteric sites in GluN1 and GluN2 subunits. See Table S3 for data collection and refinement statistics. (B) Views of UCM-101 with the electron density shown as a mesh. (C) Allosteric binding site for UCM-101. Dashed lines indicate hydrogen bonding interactions between residues and two water molecules. (D) Ligand–protein interactions for UCM-101 in the allosteric binding site. Hydrogen bonding interactions are shown as dashed lines with distances in angstrom (Å). (E) Structural alignment of DCKA/glutamate-bound GluN1/2A ABD heterodimer structures with UCM-101 (green) or MPX-007 (gray; PDB ID: 5JTY). UCM-101 occupies the allosteric site in a more extended binding mode compared with MPX-007 that adopts a U-shaped conformation. The binding sites for UCM-101 and MPX-007 are overlapping, but distinct, with a UCM subsite uniquely engaged by UCM-101 and a TCN/MPX subsite only engaged by MPX-007. (F) Representative two-electrode voltage-clamp recordings from mutant GluN1-R755A/2A receptors activated by glycine in the continuous presence of 300 µM glutamate, and concentration–response data for TCN-213 and UCM-101 at wild-type and mutant GluN1/2A receptors activated by glycine close to the EC50 value (GluN1/2A, 1 µM; GluN1-Y535A/2A and GluN1-R755A/2A, 3 µM). A dashed line indicates data for wild-type GluN1/2A from Fig. 1 C. See Tables 1 and 2 for NAM IC50 and glycine EC50 values.
Crystal structure of the GluN1/2A ABD heterodimer with DCKA, glutamate, and UCM-101. (A) Views of the GluN1/2A ABD heterodimer structure with ligands shown in spheres. The competitive GluN1 antagonist DCKA stabilizes the ABD in an open cleft conformation, while the GluN2 agonist glutamate stabilizes the ABD in a closed cleft conformation. UCM-101 binds an allosteric site at the heterodimer interface between the orthosteric sites in GluN1 and GluN2 subunits. See Table S3 for data collection and refinement statistics. (B) Views of UCM-101 with the electron density shown as a mesh. (C) Allosteric binding site for UCM-101. Dashed lines indicate hydrogen bonding interactions between residues and two water molecules. (D) Ligand–protein interactions for UCM-101 in the allosteric binding site. Hydrogen bonding interactions are shown as dashed lines with distances in angstrom (Å). (E) Structural alignment of DCKA/glutamate-bound GluN1/2A ABD heterodimer structures with UCM-101 (green) or MPX-007 (gray; PDB ID: 5JTY). UCM-101 occupies the allosteric site in a more extended binding mode compared with MPX-007 that adopts a U-shaped conformation. The binding sites for UCM-101 and MPX-007 are overlapping, but distinct, with a UCM subsite uniquely engaged by UCM-101 and a TCN/MPX subsite only engaged by MPX-007. (F) Representative two-electrode voltage-clamp recordings from mutant GluN1-R755A/2A receptors activated by glycine in the continuous presence of 300 µM glutamate, and concentration–response data for TCN-213 and UCM-101 at wild-type and mutant GluN1/2A receptors activated by glycine close to the EC50 value (GluN1/2A, 1 µM; GluN1-Y535A/2A and GluN1-R755A/2A, 3 µM). A dashed line indicates data for wild-type GluN1/2A from Fig. 1 C. See Tables 1 and 2 for NAM IC50 and glycine EC50 values.

Electron densities for UCM-101 and residues in the allosteric binding site. (A and B) Different views of the binding pocket for UCM-101 with electron densities shown as mesh (2Fo-Fc map contoured at 1σ). Dashed lines indicate hydrogen bonding interactions.
Electron densities for UCM-101 and residues in the allosteric binding site. (A and B) Different views of the binding pocket for UCM-101 with electron densities shown as mesh (2Fo-Fc map contoured at 1σ). Dashed lines indicate hydrogen bonding interactions.
Identification of GluN1 residues critical for UCM-101 activity
In the crystal structure, GluN1 Y535 caps one end of the modulator binding site and interacts with the nonaromatic cyclohexyl ring of UCM-101, while GluN1 R755 extends parallel to UCM-101 to form another boundary of the modulator binding site (Fig. 4 C). These two GluN1 residues are required for negative allosteric modulation by TCN-201 and MPX-004 (Hansen et al., 2012; Yi et al., 2016). To investigate the roles of GluN1 Y535 and R755 in modulation by UCM-101, we mutated these residues and determined NAM IC50 values at GluN1-Y535A/2A and GluN1-R755A/2A in the presence of saturating glutamate and 3 µM glycine, which are close to the respective EC50 values at the two mutant receptors (Fig. 4 F; Fig. S2; and Tables 1 and 2). GluN1-Y535A and GluN1-R755A mutations significantly reduced the potency of UCM-101 by 25- and 170-fold, respectively, compared with wild-type GluN1/2A. Similarly, GluN1-Y535A and GluN1-R755A strongly decreased TCN-213 potency (IC50 values could not be determined) (Fig. 4 F and Table 1). Thus, GluN1 Y535 and R755 are important for allosteric modulation by both UCM-101/TCN-213 and TCN-201/MPX ligands, despite the distinct binding modes adopted by the two classes of allosteric modulators.
Mechanism of increased UCM-101 potency compared with TCN-213
To identify residues that may interact with UCM-101, but not TCN-213, we investigated two nonconserved residues, GluN2A Y754 and I755, that are close to UCM-101 in the UCM subsite, without making direct van der Waals contacts (Fig. 4 D and Fig. 5 A). We initially determined glycine potencies at mutant GluN1/2A-Y754K, GluN1/2A-I755V, and GluN1/2A-Y754K+I755V receptors (Fig. S2 and Table 2), which are mutated to the corresponding residues in GluN1/2B-D (Fig. 5 B), and then determined NAM IC50 values in the presence of saturating glutamate and glycine concentrations close to the respective EC50 values (Fig. 5, C and D; and Tables 1 and 2). The GluN2A-Y754K, GluN2A-I755V, and GluN2A-Y754K+I755V mutations resulted in UCM-101 IC50 values of 0.15, 0.18, and 0.15 µM, respectively, which are not significantly different from 0.11 μM at wild-type GluN1/2A. Similarly, TCN-213 IC50 values at GluN2A-Y754K (1.2 µM), GluN2A-I755V (1.2 µM), and GluN2A-Y754K+I755V (0.7 µM) were not significantly different from the IC50 at wild-type GluN1/2A (0.83 µM). Thus, the nonconserved GluN2A Y754 and I755 residues are not mediating subunit selectivity for UCM-101 and TCN-213.

Mutagenesis of residues in the UCM subsite . (A) Ligand and residues in the vicinity of the ethyl group on UCM-101 with the electron density shown as a mesh (2Fo-Fc map contoured at 1σ). The GluN2A I755F mutation is modeled and shown with the predicted distance to the ethyl group. (B) Alignment of key GluN2 residues in the UCM subsite of the allosteric binding site with nonconserved residues in red. Amino acid numbering is according to the full-length GluN2A subunit. (C) Representative two-electrode voltage-clamp recording from mutant GluN1/2A-I755F receptors activated by glycine in the continuous presence of 300 µM glutamate and inhibited by increasing TCN-213 concentrations. (D) Concentration–response data for TCN-213 and UCM-101 at wild-type and mutant GluN1/2A receptors activated by glycine close to the EC50 value (1 µM). A dashed line indicates data for wild-type GluN1/2A from Fig. 1 C. (E) Fold change in IC50 relative to wild-type GluN1/2A. * denotes values significantly different from wild type; # denotes significantly different IC50 shifts between TCN-213 and UCM-101 (P < 0.05, two-way ANOVA with Tukey’s posttest). See Tables 1 and 2 for NAM IC50 and glycine EC50 values.
Mutagenesis of residues in the UCM subsite . (A) Ligand and residues in the vicinity of the ethyl group on UCM-101 with the electron density shown as a mesh (2Fo-Fc map contoured at 1σ). The GluN2A I755F mutation is modeled and shown with the predicted distance to the ethyl group. (B) Alignment of key GluN2 residues in the UCM subsite of the allosteric binding site with nonconserved residues in red. Amino acid numbering is according to the full-length GluN2A subunit. (C) Representative two-electrode voltage-clamp recording from mutant GluN1/2A-I755F receptors activated by glycine in the continuous presence of 300 µM glutamate and inhibited by increasing TCN-213 concentrations. (D) Concentration–response data for TCN-213 and UCM-101 at wild-type and mutant GluN1/2A receptors activated by glycine close to the EC50 value (1 µM). A dashed line indicates data for wild-type GluN1/2A from Fig. 1 C. (E) Fold change in IC50 relative to wild-type GluN1/2A. * denotes values significantly different from wild type; # denotes significantly different IC50 shifts between TCN-213 and UCM-101 (P < 0.05, two-way ANOVA with Tukey’s posttest). See Tables 1 and 2 for NAM IC50 and glycine EC50 values.
The ethyl group of UCM-101 is in proximity to GluN2A I755, albeit without making direct van der Waals contact (Fig. 4 D and Fig. 5 A), suggesting that a transient favorable hydrophobic interaction may mediate some of the increased potency of UCM-101 compared with TCN-213, which lacks the ethyl group (Fig. 1 A). To explore this possibility, we determined NAM IC50 values in the presence of saturating glutamate and the glycine EC50 concentration at GluN1/2A-I755F, which was mutated to sterically disrupt the putative ligand–receptor interaction (Fig. 5; and Tables 1 and 2). TCN-213 potency at GluN1/2A-I755F was not significantly different from wild-type GluN1/2A, whereas a significant 2.9-fold reduction was observed for UCM-101 potency.
These results confirm the close proximity between GluN2A I755 and the ethyl group of UCM-101, which is absent in TCN-213. However, the results do not indicate a transient interaction between the side chain of GluN2A I755 and the ethyl group of UCM-101, and are therefore consistent with the absence of a direct ligand–receptor interaction in the crystal structure (Fig. 4 and Fig. 5 A). The ethyl group presumably reduces conformational flexibility of UCM-101 in the modulatory binding site, thereby enabling the formation of more stable interactions compared with TCN-213. These more stable interactions formed by UCM-101 are conserved between GluN2A-D subunits (i.e., GluN2A-I755V did not affect UCM-101 potency), thereby resulting in less subunit selectivity for UCM-101 compared with TCN-213.
Influence of nonconserved GluN2A V783 on subunit selectivity
To investigate the role of GluN2A V783, which is positioned in the TCN/MPX subsite (Fig. 4 and Fig. S3), in mediating subunit selectivity for TCN-213 and UCM-101, we mutated this residue to the corresponding residues in GluN2B (Phe) and GluN2C/D (Leu). NAM concentration–inhibition data at these mutant receptors were measured for responses activated by 0.5 µM glycine (i.e., approximately EC50 values; Table 2 and Fig. S2) and saturating glutamate. Compared with wild-type GluN1/2A, the potency of TCN-213 decreased 2.6- and 4.8-fold at GluN1/2A-V783F and GluN1/2A-V783L, respectively, the potency of UCM-101 decreased 1.9- and 2.5-fold, and the potency of TCN-201 decreased 1.9- and 8.1-fold (Fig. 6, B and E; and Table 1; see Fig. S4 for TCN-213). Thus, GluN2A-V783F is reasonably tolerated, resulting in minor decreases in potency of GluN2A-selective NAMs, irrespective of the chemical scaffold and binding mode. GluN2A-V783L is less tolerated, resulting in more pronounced decreases in NAM potencies, with the largest effect observed for TCN-201. Although the effects are relatively modest, the results suggest that GluN2A V783 promotes subunit selectivity for UCM-101 and TCN-213. However, the reduced GluN2A selectivity for UCM-101 and TCN-213 compared with TCN-201 is mediated, in part, by a greater tolerance for bulkier side chains at this position, as is the case in GluN2B-D.

Structural determinants of subunit selectivity . (A) Alignment of GluN2 residues in the allosteric binding site with nonconserved residues in red. Amino acid numbering is according to the full-length GluN2A subunit. (B–D) Concentration–response data for UCM-101 and TCN-201 at wild-type and mutant GluN1/2A receptors activated by glycine close to the EC50 value (GluN1/2A, GluN1/2A-V529I, and GluN1/2A-T797S, 1 µM; GluN1/2A-V783F, GluN1/2A-V783L, GluN1/2A-M788I, and GluN1/2A-M788T, 0.5 µM; GluN1/2A-E789Q, 3 µM). A dashed line indicates data for wild-type GluN1/2A from Fig. 1 C. (E) Fold change in IC50 relative to wild-type GluN1/2A. * denotes values significantly different from wild type; # denotes significantly different IC50 shifts between UCM-101 and TCN-201 (P < 0.05, two-way ANOVA with Tukey’s posttest). See Tables 1 and 2 for NAM IC50 and glycine EC50 values.
Structural determinants of subunit selectivity . (A) Alignment of GluN2 residues in the allosteric binding site with nonconserved residues in red. Amino acid numbering is according to the full-length GluN2A subunit. (B–D) Concentration–response data for UCM-101 and TCN-201 at wild-type and mutant GluN1/2A receptors activated by glycine close to the EC50 value (GluN1/2A, GluN1/2A-V529I, and GluN1/2A-T797S, 1 µM; GluN1/2A-V783F, GluN1/2A-V783L, GluN1/2A-M788I, and GluN1/2A-M788T, 0.5 µM; GluN1/2A-E789Q, 3 µM). A dashed line indicates data for wild-type GluN1/2A from Fig. 1 C. (E) Fold change in IC50 relative to wild-type GluN1/2A. * denotes values significantly different from wild type; # denotes significantly different IC50 shifts between UCM-101 and TCN-201 (P < 0.05, two-way ANOVA with Tukey’s posttest). See Tables 1 and 2 for NAM IC50 and glycine EC50 values.

Inhibition of wild-type and mutant GluN1/2A receptors by TCN-213. (A) Concentration–response data for TCN-213 at wild-type and mutant GluN1/2A receptors activated by glycine close to the EC50 value (GluN1/2A, 1 µM; GluN1-2A-V783F and GluN1/2A-V783L, 0.5 µM). A dashed line indicates data for wild-type GluN1/2A from Fig. 1 C. (B) Fold change in IC50 relative to wild-type GluN1/2A. * denotes values significantly different from wild type; # denotes significantly different IC50 shifts between UCM-101, TCN-201, and TCN-213 (P < 0.05, two-way ANOVA with Tukey’s posttest). See Tables 1 and 2 for NAM IC50 and glycine EC50 values.
Inhibition of wild-type and mutant GluN1/2A receptors by TCN-213. (A) Concentration–response data for TCN-213 at wild-type and mutant GluN1/2A receptors activated by glycine close to the EC50 value (GluN1/2A, 1 µM; GluN1-2A-V783F and GluN1/2A-V783L, 0.5 µM). A dashed line indicates data for wild-type GluN1/2A from Fig. 1 C. (B) Fold change in IC50 relative to wild-type GluN1/2A. * denotes values significantly different from wild type; # denotes significantly different IC50 shifts between UCM-101, TCN-201, and TCN-213 (P < 0.05, two-way ANOVA with Tukey’s posttest). See Tables 1 and 2 for NAM IC50 and glycine EC50 values.
Structural determinants that mediate subunit selectivity of UCM-101
As demonstrated by GluN2A V783 and as a result of the distinct binding modes, UCM-101 and TCN-201 engage differently with nonconserved GluN2 residues. To identify additional residues that mediate subunit selectivity, we mutated nonconserved GluN2A residues located within 5 Å of UCM-101 to the corresponding residues in GluN2B-D and determined concentration–inhibition data for responses activated by saturating glutamate and a glycine concentration near the EC50 value of the respective mutant receptor (Table 2). The potency of UCM-101 significantly decreased by 2.0-, 5.0-, 4.5-, and 2.5-fold at GluN1/2A-V529I, GluN1/2A-M788I, GluN1/2A-M788T, and GluN1/2A-T797S, respectively, compared with wild-type GluN1/2A (Fig. 6 and Table 1). The mutations produced strikingly different effects for TCN-201 compared with UCM-101. The potency of TCN-201 was significantly decreased by 1.5-fold at GluN1/2A-V529I with no significant effects at GluN1/2A-M788I, GluN1/2A-M788T, GluN1/2A-E789Q, and GluN1/2A-T797S (Fig. 6 and Table 1). The GluN1/2A-E789Q mutation did not significantly change the potency of UCM-101 or TCN-201.
In summary, these results suggest that GluN2A V529, V783, M788, and T797 contribute to the subunit selectivity of UCM-101, while GluN2A V783 is the key determinant of subunit selectivity for TCN-201 with a smaller contribution from GluN2A V529. Thus, subunit selectivity of UCM-101 and TCN-201 is mediated by different structural determinants, consistent with distinct binding modes at the modulatory binding site.
Mechanism of allosteric modulation by UCM-101 and TCN-213
The unique binding mode of UCM-101 in the modulatory site raises the possibility that inhibition may be mediated by a mechanism that is distinct from the previously established allosteric mechanism of TCN-201 and MPX ligands (Hansen et al., 2012; Yi et al., 2016; Lotti et al., 2025). To evaluate this question, we determined IC50 values at GluN1/2A in the presence of varying combinations of subsaturating and saturating glycine and glutamate concentrations (Fig. 7, A and B; and Table 1). These concentration–inhibition data demonstrated that glutamate concentrations did not significantly influence IC50 values for UCM-101 and TCN-213. In contrast, both UCM-101 and TCN-213 displayed significantly increased potency in the presence of low (1 µM) compared with high (30 µM) glycine concentrations. Thus, negative allosteric modulation by UCM-101 can be surmounted by glycine, but not glutamate, consistent with previous results for TCN-213 (McKay et al., 2012) and similar to allosteric inhibition by TCN-201 and MPX ligands (Edman et al., 2012; Hansen et al., 2012; Yi et al., 2016).

Mechanism of negative allosteric modulation by UCM-101 and TCN-213. (A) Representative two-electrode voltage-clamp recordings of UCM-101 inhibition of GluN1/2A responses activated by low glutamate (10 µM) and glycine (1 µM) or high glutamate (100 µM) and glycine (30 µM). (B) Concentration–response data for TCN-213 and UCM-101 at GluN1/2A receptors activated by different combinations of glutamate and glycine concentrations. A dashed line indicates data for wild-type GluN1/2A from Fig. 1 C. (C) Cartoon representation of the GluN1-CC/2A heterodimer with an engineered disulfide bond in the GluN1 ABD. The engineered disulfide bond stabilizes the closed cleft, active GluN1 ABD conformation, and receptors with formed disulfide bonds do not require glycine binding and can be activated by glutamate alone. (D) Representative recordings of GluN1-CC/2A receptors in the continuous presence of 4 mM DTT. Glutamate (300 µM) alone is sufficient to activate these receptors since the disulfide bonds continuously break and reform, even in the continuous presence of DTT. However, UCM-101 and TCN-213 inhibit the glutamate response by stabilizing the open cleft, inactive GluN1 ABD conformation and preventing disulfide bonds from reforming. (E) Bar graph summarizing responses without (control) and with DTT application (+DTT) and with vehicle (0.1% DMSO), the competitive GluN1 antagonist 7CKA (10 µM), or the NAMs, UCM-101 (10 µM) or TCN-213 (10 µM). The responses are normalized to the response to glutamate alone applied at the beginning of the recording. The functional effect of stabilizing the GluN1 ABD in an open cleft, inactive conformation with 7CKA is mimicked by the allosteric modulators, UCM-101 and TCN-201. * denotes values significantly different from control (P < 0.05, two-way ANOVA with Tukey’s posttest).
Mechanism of negative allosteric modulation by UCM-101 and TCN-213. (A) Representative two-electrode voltage-clamp recordings of UCM-101 inhibition of GluN1/2A responses activated by low glutamate (10 µM) and glycine (1 µM) or high glutamate (100 µM) and glycine (30 µM). (B) Concentration–response data for TCN-213 and UCM-101 at GluN1/2A receptors activated by different combinations of glutamate and glycine concentrations. A dashed line indicates data for wild-type GluN1/2A from Fig. 1 C. (C) Cartoon representation of the GluN1-CC/2A heterodimer with an engineered disulfide bond in the GluN1 ABD. The engineered disulfide bond stabilizes the closed cleft, active GluN1 ABD conformation, and receptors with formed disulfide bonds do not require glycine binding and can be activated by glutamate alone. (D) Representative recordings of GluN1-CC/2A receptors in the continuous presence of 4 mM DTT. Glutamate (300 µM) alone is sufficient to activate these receptors since the disulfide bonds continuously break and reform, even in the continuous presence of DTT. However, UCM-101 and TCN-213 inhibit the glutamate response by stabilizing the open cleft, inactive GluN1 ABD conformation and preventing disulfide bonds from reforming. (E) Bar graph summarizing responses without (control) and with DTT application (+DTT) and with vehicle (0.1% DMSO), the competitive GluN1 antagonist 7CKA (10 µM), or the NAMs, UCM-101 (10 µM) or TCN-213 (10 µM). The responses are normalized to the response to glutamate alone applied at the beginning of the recording. The functional effect of stabilizing the GluN1 ABD in an open cleft, inactive conformation with 7CKA is mimicked by the allosteric modulators, UCM-101 and TCN-201. * denotes values significantly different from control (P < 0.05, two-way ANOVA with Tukey’s posttest).
It has been previously demonstrated that binding of TCN-201 and MPX ligands stabilizes the GluN1 ABD in an open conformation, akin to the apo state or a conformation stabilized by competitive antagonists, such as DCKA or 7CKA (Jespersen et al., 2014; Yi et al., 2016; Bosco et al., 2025). To determine whether UCM-101 and TCN-213 also allosterically inhibit glycine binding by stabilizing the open GluN1 ABD conformation, we took advantage of an engineered disulfide bond (GluN1-N499C+Q686C, hereafter GluN1-CC) that traps the GluN1 ABD in the closed conformation, mimicking the glycine-bound conformation (Kussius and Popescu, 2010; Yi et al., 2016). Thus, GluN1-CC/2A receptors can be activated by glutamate alone without the requirement for glycine co-agonist binding. Continuous incubation of the disulfide reducing agent DTT did not prevent glutamate-activated responses from GluN1-CC/2A receptors, suggesting that the disulfide bond rapidly reforms following DTT-mediated reduction (Fig. 7, C–E). However, application of the competitive GluN1 glycine site antagonist 7CKA or the GluN2A-selective NAMs UCM-101 and TCN-213 significantly reduced glutamate-activated response amplitudes in the presence, but not in the absence, of DTT compared with vehicle (0.1% DMSO) (Fig. 7 E). The disulfide bond is therefore prevented from reforming when the open GluN1 ABD conformation is stabilized either by 7CKA binding in the glycine pocket or by binding of NAMs at the ABD dimer interface. Allosteric inhibition by UCM-101 and TCN-213 is therefore mediated by the same overall mechanism as inhibition by TCN-201 and MPX ligands. In this mechanism, the GluN2A-selective NAMs stabilize the open GluN1 ABD conformation, thereby inhibiting glycine binding and subsequent GluN1 ABD closure, which is the initial conformational change required for NMDA receptor activation.
UCM-101 binding affinity and strength of allosteric interaction
UCM-101 is more potent and less sensitive to increased glycine compared with TCN-213, suggesting that binding affinity and allosteric interaction are improved for UCM-101. We employed an allosteric model and modified Schild analysis to quantify modulator binding affinity and the strength of allosteric interaction (Ehlert, 1988; Hansen et al., 2012; Yi et al., 2016). Glycine concentration–response data were generated in the presence and absence of increasing NAM concentrations, and the glycine EC50, NAM binding dissociation constant KB, and allosteric constant α that best describe all data were determined using global nonlinear regression fitting to the Hill equation and the equation derived from the allosteric model (Fig. 8). This evaluation suggested that TCN-213 (KB = 780 nM, α = 0.043) has a lower binding affinity and weaker allosteric interaction compared with UCM-101 (KB = 10 nM, α = 0.0057) (Fig. 8, C–E). The binding affinity for UCM-101 was also increased, but the allosteric constant was in a similar range, compared with TCN-201 (KB = 27–45 nM, α = 0.0025–0.0070), evaluated using the same model (Hansen et al., 2012; Yi et al., 2016). Although the shift in glycine potency did not saturate (i.e., α was fixed to 0.0057), the binding dissociation constant KB was determined to be 590 nM at GluN1/2B receptors (Fig. 8, C and F). Thus, the binding affinity of UCM-101 is increased by 78-fold and the strength of negative allosteric interaction is increased by 7.5-fold compared with TCN-213, and the binding affinity of UCM-101 is 59-fold higher at GluN1/2A compared with GluN1/2B.

NAM binding affinity and strength of allosteric modulation. (A) Representative recordings of glycine concentration–response data in the presence and absence of UCM-101. (B) Equilibrium model describing agonist binding affinity (i.e., the inverse of agonist binding dissociation constant, KA), agonist efficacy (equilibrium constant, E), modulator binding affinity (i.e., inverse of modulator binding dissociation constant, KB), and strength of allosteric interaction (i.e., the allosteric binding interaction constant, α). The equation describes the DR, where agonist EC50 is measured in the absence of modulator and agonist EC50’ is measured in the presence of a modulator concentration [B]. (C) Schild plot for UCM-101 (red) and TCN-213 (blue) at GluN1/2A and UCM-101 at GluN1/2B (black). The calculated values for log(DR-1) are plotted over data simulated using the best-fit KB and α values from global nonlinear regression of the data shown in (D–F) (i.e., the calculated log(DR-1) data are not used for model fitting of the equation). (D–F) Glycine concentration–response data in the absence and presence of increasing concentrations of TCN-213 or UCM-101 at GluN1/2A or UCM-101 at GluN1/2B. The best-fit KB and α values are stated above the graphs. * indicate that the α value for UCM-101 at GluN1/2B was fixed during global nonlinear regression fitting. See Materials and Methods for details on data analysis.
NAM binding affinity and strength of allosteric modulation. (A) Representative recordings of glycine concentration–response data in the presence and absence of UCM-101. (B) Equilibrium model describing agonist binding affinity (i.e., the inverse of agonist binding dissociation constant, KA), agonist efficacy (equilibrium constant, E), modulator binding affinity (i.e., inverse of modulator binding dissociation constant, KB), and strength of allosteric interaction (i.e., the allosteric binding interaction constant, α). The equation describes the DR, where agonist EC50 is measured in the absence of modulator and agonist EC50’ is measured in the presence of a modulator concentration [B]. (C) Schild plot for UCM-101 (red) and TCN-213 (blue) at GluN1/2A and UCM-101 at GluN1/2B (black). The calculated values for log(DR-1) are plotted over data simulated using the best-fit KB and α values from global nonlinear regression of the data shown in (D–F) (i.e., the calculated log(DR-1) data are not used for model fitting of the equation). (D–F) Glycine concentration–response data in the absence and presence of increasing concentrations of TCN-213 or UCM-101 at GluN1/2A or UCM-101 at GluN1/2B. The best-fit KB and α values are stated above the graphs. * indicate that the α value for UCM-101 at GluN1/2B was fixed during global nonlinear regression fitting. See Materials and Methods for details on data analysis.
Discussion
We report UCM-101 as a novel, potent GluN2A-preferring NAM that binds the GluN1-GluN2A ABD heterodimer interface with a distinct binding mode compared with previously reported GluN2A-selective NAMs, TCN-201, MPX-004, and MPX-007 (Yi et al., 2016). Despite the distinct binding mode of UCM-101 compared with TCN-201/MPX ligands, we show that allosteric inhibition by UCM-101 is mediated by the same general mechanism. That is, the GluN2A-selective NAMs stabilize the open GluN1 ABD conformation to prevent glycine binding, and glycine binding stabilizes the closed GluN1 ABD conformation to prevent NAM binding. In addition to the binding site for NAMs (Hackos et al., 2016; Yi et al., 2016; Bischoff et al., 2025), the GluN1-GluN2A ABD heterodimer interface also harbors a binding site for GluN2A-selective positive allosteric modulators that increase glutamate potency with minimal to no effects on glycine potency (Hackos et al., 2016; Volgraf et al., 2016; Villemure et al., 2017). Thus, the NMDA receptor ABD interface appears to be more promiscuous for binding allosteric modulators than expected just a decade ago (Ogden and Traynelis, 2011; Paoletti et al., 2013).
UCM-101 displays reduced GluN2A selectivity compared with TCN-201, consistent with the engagement of different ligand–receptor interactions by the two distinct chemical scaffolds. Based on structural and functional data in combination with site-directed mutagenesis, we suggest two mechanisms that act in concert to limit GluN2A selectivity for UCM-101. First, UCM-101 interacts to a lesser extent and/or differently with the nonconserved GluN2A V783 residue, which is the primary determinant of GluN2A selectivity for TCN-201/MPX ligands (Hansen et al., 2012; Yi et al., 2016). Second, the high potency of UCM-101 compared with the parent compound TCN-213 is facilitated by additional hydrophobic interactions in a subsite of the modulatory binding site that is not engaged by TCN-201/MPX ligands. These hydrophobic interactions with the ethyl group of UCM-101 in proximity to GluN2A I755, which is a valine residue in GluN2B-D subunits, are presumably conserved in the GluN2 subunits. Thus, the lower GluN2A selectivity of UCM-101 compared with TCN-201/MPX ligands is mediated by a combination of increased nonselective and decreased GluN2A-selective interactions.
Subunit selectivity of UCM-101 and TCN-201/MPX ligands may, in part, be mediated by subtype-dependent structural dynamics at the ABD dimer interface. This potential mechanism, which is not explored in this study, could explain the relatively modest effects of mutations at nonconserved residues in the NAM binding pockets. Studies have identified NMDA receptor subtype-specific conformational changes in the N-terminal domain and ABD structural layers during agonist binding and channel gating (Tajima et al., 2016; Zhu et al., 2016; Jalali-Yazdi et al., 2018; Esmenjaud et al., 2019; Chou et al., 2020; Wang et al., 2021; Chou et al., 2022; Zhang et al., 2023; Chou et al., 2024). These subtype-specific motions influence allosteric modulation in GluN1/2A versus GluN1/2B receptors and could determine the relative orientation of subunits at the ABD dimer interface (Gielen et al., 2008; Esmenjaud et al., 2019; Tian et al., 2021; Bender et al., 2024; Bleier et al., 2024). Thus, additional receptor domains, such as the N-terminal domain, could influence binding at the ABD dimer interface in a subtype-dependent manner. Since UCM-101 and TCN-201/MPX ligands bind with distinct binding modes at the ABD dimer interface, these subtype-specific motions may impact binding of these two distinct classes of allosteric modulators differently.
Similar to competitive antagonists, the potency of inhibition by TCN-213, UCM-101, and TCN-201/MPX ligands is influenced by the glycine concentration used to activate responses and the potency of glycine at the receptor subtype (Hansen et al., 2012; Yi et al., 2016; Lotti et al., 2025). We show that the binding affinity of UCM-101 is 59-fold higher at GluN1/2A compared with GluN1/2B in the absence of glycine (Fig. 6). However, unlike competitive antagonists, the inhibition by GluN2A-selective NAMs is also influenced by the strength of negative allosteric interaction (Hansen et al., 2012; Yi et al., 2016; Lotti et al., 2025). To better account for this parameter, we evaluated inhibition of responses activated by the glycine EC50 at the respective NMDA receptor subtypes, demonstrating that UCM-101 is 7.4- to 12-fold selective for GluN1/2A over GluN1/2B-D receptors (Fig. 1 and Table 1). Of more practical relevance, we show that UCM-101 is 17- to 118-fold selective for GluN1/2A over GluN1/2B-D receptors in the presence of 1 µM glycine (Fig. 1 and Table 1), which is in the physiological concentration range of glycine (Bergeron et al., 1998; Billups and Attwell, 2003; Bae et al., 2021). While the modest preference of UCM-101 for GluN2A-containing NMDA receptors limits its usefulness as a pharmacological tool compound, the new chemical scaffold adopted by UCM-101 and the unexplored binding mode in the modulatory site provide new opportunities for structure-based design of NMDA receptor modulators with therapeutic potential and improved in vivo utility in animal models.
Data availability
The data described in this study are available in the published article and its online supplemental material. DNA constructs are available from the corresponding author upon request. The coordinates and structure factors for the GluN1/2A ABD heterodimer structure with DCKA/glutamate/UCM-101 have been deposited to the Protein Data Bank under the accession code 9NYZ.
Acknowledgments
Christopher J. Lingle served as an editor.
We thank the staff at the 17-ID-2 beamline of the National Synchrotron Light Source II at Brookhaven National Laboratory for assistance during data collection. We thank Dr. Hiro Furukawa for providing DNA constructs for the expression of GluN1 and GluN2A ABD proteins, and Dr. Gabriella K. Popescu for providing the DNA construct for GluN1-N499C+Q686C.
This work was supported by funding from the National Institutes of Health, National Institute of Neurological Disorders and Stroke (R01NS097536), and National Institute of General Medical Sciences (P30GM140963, P20GM103474). This research used the 17-ID-2 beamline of the National Synchrotron Light Source II, a U.S. Department of Energy (DOE) Office of Science User Facility operated for the DOE Office of Science by Brookhaven National Laboratory under Contract No. DE-SC0012704. The Center for BioMolecular Structure is primarily supported by the National Institutes of Health, the National Institute of General Medical Sciences through a Center Core P30 Grant (P30GM133893), and the DOE Office of Biological and Environmental Research (KP1607011). James Bosco is the founder of Arktos Life Sciences.
Author contributions: James S. Lotti: conceptualization, data curation, formal analysis, investigation, methodology, and writing—original draft, review, and editing. Jed T. Syrenne: data curation, formal analysis, investigation, methodology, and writing—review and editing. Avery J. Benton: formal analysis and investigation. Ahmad Al-Mousawi: conceptualization, data curation, formal analysis, investigation, resources, validation, visualization, and writing—review and editing. Lauren E. Cornelison: formal analysis and investigation. Christopher J. Trolinder: formal analysis, investigation, and writing—review and editing. Feng Yi: formal analysis, investigation, validation, and writing—review and editing. Zhucheng Zhang: investigation and writing—review and editing. Cindee K. Yates-Hansen: data curation, investigation, methodology, project administration, and writing—review and editing. Levi J. McClelland: investigation, resources, and writing—original draft, review, and editing. James Bosco: conceptualization, data curation, investigation, methodology, project administration, validation, and visualization. Andrew R. Rau: formal analysis and investigation. Rasmus P. Clausen: conceptualization, supervision, and writing—original draft, review, and editing. Kasper B. Hansen: conceptualization, data curation, formal analysis, funding acquisition, investigation, methodology, project administration, resources, software, supervision, validation, visualization, and writing—original draft, review, and editing.