
Skip Nav Destination
Close Modal

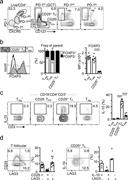


![Figure 4. Human CD25+ TF cells’ transcriptome resembles that of murine TFR cells. (a) Flow cytometric plots showing the gating strategy used to FACS-purify each of the indicated cell subsets. (b) Heatmap analysis of RNA-seq data showing differentially expressed genes in CD25+ TF cells compared with the indicated T cell populations (log2 value of counts per million) extracted from the tonsils of three individuals. (c) Selected transcripts from panel b in the indicated subsets (RNA counts per million [CPM]). (d) Flow cytometric plots and quantification (n = 8) of the indicated proteins. Data are representative of at least three independent experiments. In all graphs, bars represent medians; each dot represents a single tonsil donor. ***, P ≤ 0.001, nonparametric Mann–Whitney U test.](https://cdn.rupress.org/rup/content_public/journal/jem/216/8/10.1084_jem.20190493/8/s_jem_20190493_fig4.jpeg?Expires=2147483647&Signature=saoE7z66zH~eJtksP3gmwLf-1miWzGzuBxvr7h6GdfYDeiD2Dy9-EvxGLTjehIUK8iJ3vmuzwqeGCn~mlNWQ7df1FC1iaE2LL04y8ffh-yL0Sh7FsnykfsMB4s5K4ic923eXAQVeNetfO5Yotu1Oc-m0dI8hvpBb2ZBwC8zWhIdCsHTBSzy4X3vUzf2AJ7z1btc18I8oWn8mAaxZaDeYal0C~HTRzhTWW26BRtDacQUn1oeb0s7iLBT-RtiDq~ROprBmzJSlMGKN6i0KHIQ8ea-48M6aPif33J41NMEUQEHfuNFLI5GTGvQnDMdFT9~kBitASunbMwoCx-Vobc-WHw__&Key-Pair-Id=APKAIE5G5CRDK6RD3PGA)


1-20 of 62
Follow your search
Access your saved searches in your account
Would you like to receive an alert when new items match your search?
1
in A pathogenic role of plasmacytoid dendritic cells in autoimmunity and chronic viral infection
> Journal of Experimental Medicine
Published: 16 August 2019
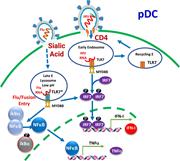
Figure 1. The central role of pDCs and the produced IFN-I in promoting inflammatory and autoimmune diseases. IFN-I and IFN-III are produced by pDCs in response to signals delivered by TLR7 and/or TLR9 in response to the sensing of self–nucleic More about this image found in The central role of pDCs and the produced IFN-I in promoting inflammatory a...
in A pathogenic role of plasmacytoid dendritic cells in autoimmunity and chronic viral infection
> Journal of Experimental Medicine
Published: 16 August 2019
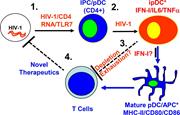
Figure 2. CD4-mediated endocytosis of HIV-1 leads to persistent/repeated IFN-I induction in pDCs. HIV-1/CD4 traffics predominantly to early and recycling endosomes, where HIV-1 genomic RNA interacts with TLR7 to activate MYD88, NFκB, IRF7, and More about this image found in CD4-mediated endocytosis of HIV-1 leads to persistent/repeated IFN-I induct...
in A pathogenic role of plasmacytoid dendritic cells in autoimmunity and chronic viral infection
> Journal of Experimental Medicine
Published: 16 August 2019
Figure 3. Induction of inflammatory or immature pDCs (ipDCs) during chronic HIV-1 infection. HIV-1 activates pDCs via CD4-dependent endocytosis and HIV-1 RNA-mediated TLR7 activation (1). Persistent activation of pDCs by HIV-1 leads to More about this image found in Induction of inflammatory or immature pDCs (ipDCs) during chronic HIV-1 inf...
Journal Articles
In Special Collection:
Autoimmunity: Mechanisms and Novel Treatments
Journal:
Journal of Experimental Medicine
J Exp Med (2019) 216 (9): 1974–1985.
Published: 16 August 2019
Journal Articles
In Special Collection:
2019: The Year in Experimental Medicine
, 2020 Germinal Centers and Immune Niches
, Antibodies at the Forefront of Disease Treatment
, Autoimmunity: Mechanisms and Novel Treatments
Journal:
Journal of Experimental Medicine
J Exp Med (2019) 216 (8): 1843–1856.
Published: 17 June 2019
Includes: Supplementary data
Published: 17 June 2019
Figure 1. Identification of IL-10–producing CD25+ FOXP3− human TF cells in human tonsils. (a) Flow cytometric plots showing gating strategy to identify the indicated populations. (b) Flow cytometric plots and quantification (n = 8) showing More about this image found in Identification of IL-10–producing CD25+ FOXP3− human ...
Published: 17 June 2019
Figure 2. Human CD25+ TF cells repress T cell proliferation. (a) Volcano plot showing Affymetrix RNA microarrays comparing gene expression between IL-10–producing and nonproducing TF cells (n = 3). (b) Flow cytometric plots showing More about this image found in Human CD25+ TF cells repress T cell proliferation. (a...
Published: 17 June 2019
Figure 3. Human CD25+ TF cells may be peripherally induced and express high CTLA4 but low IL-2 production. (a) Bisulfite sequencing of the 11 CpG islands of the FOXP3 CNS2 locus with 12 representative clones per population and per donor (filled More about this image found in Human CD25+ TF cells may be peripherally induced and ...
Published: 17 June 2019
Figure 4. Human CD25+ TF cells’ transcriptome resembles that of murine TFR cells. (a) Flow cytometric plots showing the gating strategy used to FACS-purify each of the indicated cell subsets. (b) Heatmap analysis of RNA-seq data showing More about this image found in Human CD25+ TF cells’ transcriptome resembles that of...
Published: 17 June 2019
Figure 5. Human CD25+ TF cells repress TFH cells and induction of IgE switching. (a and b) Flow cytometric plots (a) and quantification (n = 8; b) of CTV-labeled-TFH cells, cocultured with memory B cells with or without CD25+ TF cells, showing More about this image found in Human CD25+ TF cells repress TFH cells and...
Published: 17 June 2019
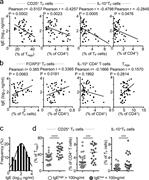
Figure 6. Tonsillar CD25+ TF cells inversely correlate to total IgE in the serum. (a and b) Pearson correlation analyses between serum total IgE and the frequency of the indicated cell subset in tonsil (n = 49). Data are representative of two More about this image found in Tonsillar CD25+ TF cells inversely correlate to total...
Journal Articles
In Special Collection:
Autoimmunity: Mechanisms and Novel Treatments
, From Tolerance to Autoimmunity
Journal:
Journal of Experimental Medicine
J Exp Med (2019) 216 (2): 317–336.
Published: 17 January 2019
Includes: Supplementary data
in P2X7 receptor restrains pathogenic Tfh cell generation in systemic lupus erythematosus
> Journal of Experimental Medicine
Published: 17 January 2019
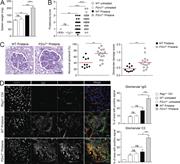
Figure 1. Increased lupus nephritis severity in P2rx7−/− mice. (A) Spleen weight of untreated WT (n = 7), P2rx7−/− (n = 6), pristane-treated WT (n = 19), and P2rx7−/− (n = 18) mice. (B) Proteinuria score of pristane-treated WT and P2rx7−/− More about this image found in Increased lupus nephritis severity in P2rx7−/− ...
in P2X7 receptor restrains pathogenic Tfh cell generation in systemic lupus erythematosus
> Journal of Experimental Medicine
Published: 17 January 2019
Figure 2. Increased serum autoantibodies and splenic plasma cells in P2rx7−/− mice. (A) Serum Ig isotype concentrations in untreated (n = 6 for IgM and IgA, n = 16 for total IgG, n = 12 for IgG subclasses) and pristane-treated (n = 15 for IgM More about this image found in Increased serum autoantibodies and splenic plasma cells in P2rx7...
in P2X7 receptor restrains pathogenic Tfh cell generation in systemic lupus erythematosus
> Journal of Experimental Medicine
Published: 17 January 2019
Figure 3. Increased GC reaction and Tfh cells in P2rx7−/− mice. (A) Representative contour plots for PNA and Fas staining on gated CD19+B220+ splenocytes, and frequency and absolute number in untreated (n = 12) and treated (n = 37) WT as well as More about this image found in Increased GC reaction and Tfh cells in P2rx7−/−...
in P2X7 receptor restrains pathogenic Tfh cell generation in systemic lupus erythematosus
> Journal of Experimental Medicine
Published: 17 January 2019
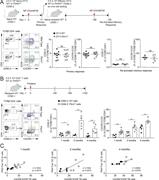
Figure 4. Impaired primary, secondary, and memory responses to NP-OVA in P2rx7−/− mice. (A) Scheme of the immunization protocol and time points of analysis. (B) Frequency and absolute number of CXCR5+ICOS+ Tfh cells in the draining lymph nodes More about this image found in Impaired primary, secondary, and memory responses to NP-OVA in P2rx...
in P2X7 receptor restrains pathogenic Tfh cell generation in systemic lupus erythematosus
> Journal of Experimental Medicine
Published: 17 January 2019
Figure 5. Selective expansion of P2rx7−/− Tfh cells upon pristane injection but not conventional immunization . (A) Scheme of the adoptive transfer and immunization experiment; representative plots of donor CD4+ and CXCR5+ICOS+ T cells within More about this image found in Selective expansion of P2rx7−/− Tfh cells upon ...
in P2X7 receptor restrains pathogenic Tfh cell generation in systemic lupus erythematosus
> Journal of Experimental Medicine
Published: 17 January 2019
Figure 6. P2X7-mediated control of PSGL-1 down-regulation and IFN-γ secretion in pristane-treated mice . (A) Frequency of PNA+Fas+ GC splenic B cells (untreated WT, n = 3; P2rx7−/−, n = 3; and Icos−/−P2rx7−/−, n = 3; pristane-treated WT, n = 9; More about this image found in P2X7-mediated control of PSGL-1 down-regulation and IFN-γ secretion in pris...
in P2X7 receptor restrains pathogenic Tfh cell generation in systemic lupus erythematosus
> Journal of Experimental Medicine
Published: 17 January 2019
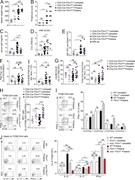
Figure 7. Increased PIL severity and IFN-γ secretion by ICOS+PSGL-1lo/− CD4 T cells in mice with conditional deletion of P2rx7 in T cells. (A) Spleen weight of untreated CD4-Cre P2rx7WT/WT (n = 5), CD4-Cre P2rx7fl/fl (n = 12), pristane-treated More about this image found in Increased PIL severity and IFN-γ secretion by ICOS+PSGL-1lo...
in P2X7 receptor restrains pathogenic Tfh cell generation in systemic lupus erythematosus
> Journal of Experimental Medicine
Published: 17 January 2019
Figure 8. P2X7-mediated caspase activation and Gsdmd cleavage in Tfh cells. (A) Time monitoring of YO-PRO-1 uptake after stimulation with BzATP in ICOS−PD-1− and ICOS+PD-1+ cells within CXCR5+ CD4+ T cells from spleen of WT and P2rx7−/− mice at More about this image found in P2X7-mediated caspase activation and Gsdmd cleavage in Tfh cells. (A) Time...
1

