


Macrophages play a central role in tissue homeostasis and host defense. However, the properties of human macrophages in non-diseased tissues remain poorly understood. Here, we characterized human tonsil macrophages and identified three subsets with distinct phenotype, transcriptome, life cycle, and function. CD36hi macrophages were related to monocytes, while CD36lo macrophages showed features of embryonic origin and CD36int macrophages had a mixed profile. scRNA-seq on non-human primate tonsils showed that monocyte recruitment did not pre-exist an immune challenge. Functionally, CD36hi macrophages were specialized for stimulating T follicular helper cells, by producing Activin A. Combining reconstruction of ligand–receptor interactions and functional assays, we identified stromal cell–derived TNF-α as an inducer of Activin A secretion. However, only CD36hi macrophages were primed for Activin A expression, via the activity of IRF1. Our results provide insight into the heterogeneity of human lymphoid organ macrophages and show that tonsil CD36hi macrophage specialization is the result of both intrinsic features and interaction with stromal cells.
Introduction
Macrophages play a central role in tissue homeostasis and host defense. Numerous studies in mouse have shown that macrophages are heterogeneous and highly adapted to their tissue of residence (Blériot et al., 2020; Guilliams et al., 2020). Whether the same principles apply to macrophages in human healthy tissues remains poorly understood.
Fate-mapping studies in mouse have indicated that macrophages derive either from embryonic precursors or from adult monocytes (Blériot et al., 2020; Guilliams et al., 2020). Tissue-resident macrophages are long-lived and can self-renew by proliferating in situ and are generally composed of a majority of embryo-derived macrophages that are replenished by monocyte-derived macrophages with time or after acute depletion (Blériot et al., 2020; Guilliams et al., 2020). In addition, a population of short-lived monocyte-derived macrophages is present in steady-state mucosal tissues, such as intestine and skin, or serous cavities (Guilliams et al., 2018). In human, transplant studies have evidenced macrophage populations with distinct life cycles in heart (Bajpai et al., 2018), intestine (Bujko et al., 2018), lung (Eguíluz-Gracia et al., 2016; Byrne et al., 2020), and skin (Haniffa et al., 2009; Kanitakis et al., 2011; McGovern et al., 2014). A better characterization of human macrophage populations in non-diseased tissues is needed, as mouse and human differ considerably in their exposure to environmental insults.
Regardless of their origin, the identity and function of tissue-resident macrophages are imprinted by cues from their anatomical niche, which control the expression of specific transcription factors and the establishment of distinct epigenetic and transcriptomic profiles (Blériot et al., 2020; Guilliams et al., 2020; Lavin et al., 2014; Gosselin et al., 2014). By contrast, the physiological role of short-lived monocyte-derived macrophages in non-diseased tissues and the factors programming their functional properties are largely unexplored. In addition, how the cross-talk with their micro-environment shapes macrophage properties in human tissues remains poorly characterized.
In this work, we addressed these questions in non-inflamed human tonsils, a secondary lymphoid organ of the oral cavity. We identified three populations of macrophages, displaying distinct transcriptomic profiles and life cycles. We found that short-lived CD36hi macrophages were specialized for the stimulation of T follicular helper (Tfh) cells via the selective ability to secrete Activin A. This property was dependent on the combined action of TNF-α produced by tonsil stromal cells and of the cell-intrinsic activity of IRF1 specifically in monocyte-derived macrophages. Our results indicate that the functional specialization of tonsil macrophages is controlled by both tissue-derived signals and origin-dependent intrinsic features.
Results
Human tonsils contain three populations of macrophages
To characterize macrophage populations in human tonsils, we first assessed macrophage heterogeneity using single-cell RNA sequencing (scRNA-seq) of purified macrophages (gated as CD11c+HLA-DR+CD14+; Fig. S1 A). Unsupervised clustering identified five clusters (Fig. S1 B). Upon analysis of the top differentially expressed genes (Fig. S1 C and Table S1), we manually grouped these clusters into three populations (Fig. 1 A): S100A9+ macrophages (corresponding to cluster 1), C1QC+ macrophages (corresponding to clusters 0 and 4), and “intermediate” macrophages (corresponding to clusters 2 and 3). Of note, cluster 4 showed high expression of cell cycle genes such as MKI67, STMN1, KIAA0101, and TUBB (Fig. S1 C). S100A9+ macrophages displayed higher expression of monocyte-related genes such as S100A8, S100A9, SOD2, and VCAN, while C1QC+ macrophages had higher expression of C1QC, C1QA, MMP9, and APOE, and intermediate macrophages showed a mixed profile and high expression of MHC II genes (Fig. 1, B and C; and Table S1). All populations expressed the macrophage marker CD68 (Fig. 1 C), consistent with their macrophage identity. To validate the presence of these three subsets of macrophages in tonsils, we sought to identify surface markers for use in flow cytometry. We selected CD36 and CD81 based on mRNA expression (Fig. 1 C) and found that their combined analysis could discriminate three populations within CD11c+HLA-DR+CD14+ cells (Fig. 1 D). To validate that these phenotypically defined populations corresponded to the transcriptionally defined macrophage subsets, we analyzed the expression of C1QC and S100A8/9 by intracellular flow cytometry (Fig. 1 D). We found that CD36hi macrophages were all C1QC-S100A8/9+, while CD36lo macrophages were all C1QC+S100A8/9−. CD36int macrophages showed mixed expression of C1QC and S100A8/9, consistent with the scRNA-seq profile. Overall, CD36hi cells were the most abundant across donors (Fig. 1 E). Morphological analysis showed that all three populations displayed a typical macrophage morphology, with a large cytoplasm and numerous phagocytic vacuoles (Fig. 1 F; cDC2 are shown for comparison). To further characterize their phenotypic differences, we performed flow cytometry for selected surface markers (Fig. 1 G). CD36hi macrophages had higher expression of CX3CR1, LILRB2, and CD86, while CD36lo macrophages showed higher expression of CD40, CD163, MERTK, and HLA-DR molecules. CD36int macrophages had an intermediate profile. Collectively, these results show that human tonsil macrophages contain three subsets of macrophages with distinct transcriptomic and phenotypic profiles.

Characterization of macrophage subsets in human tonsils. (A) Gating strategy used for characterizing macrophage populations. Macrophages were gated as CD11c+HLA-DR+CD14+. cDC were identified as CD11c+HLA-DR+CD14−. (B and C) Purified HLA-DR+CD11c+CD14+ cells from human tonsils were analyzed by scRNA-seq (n = 1). (B) UMAP visualization. Unsupervised analysis identified five clusters. (C) Scaled expression (in log value) of the top 15 differentially expressed genes between macrophage clusters.
Characterization of macrophage subsets in human tonsils. (A) Gating strategy used for characterizing macrophage populations. Macrophages were gated as CD11c+HLA-DR+CD14+. cDC were identified as CD11c+HLA-DR+CD14−. (B and C) Purified HLA-DR+CD11c+CD14+ cells from human tonsils were analyzed by scRNA-seq (n = 1). (B) UMAP visualization. Unsupervised analysis identified five clusters. (C) Scaled expression (in log value) of the top 15 differentially expressed genes between macrophage clusters.

Human tonsils contain three populations of macrophages. (A–C) Purified HLA-DR+CD11c+CD14+ cells from human tonsils were analyzed by scRNA-seq (n = 1). (A) UMAP visualization. Macrophages were grouped into three clusters. (B) Scaled expression (in log value) of the top 25 differentially expressed genes between S100A9+, C1QC+, and intermediate macrophages. (C) Average expression of selected genes for S100A9+, C1QC+, and intermediate macrophages. Genes of special interest are highlighted by asterisks. (D–G) Macrophage populations were identified by the surface expression of CD36 and CD81. (D) Intracellular staining for C1QC and S100A8/9. Proportion of C1QC+ or S100A8/9+ populations among CD36lo, CD36int, and CD36hi macrophages (n = 8 in three independent experiments). (E) Proportion of each population among HLA-DR+CD11c+CD14+ cells. Each dot represents an individual donor (n = 20 in 12 independent experiments, one-way ANOVA; **, P < 0.01; ***, P < 0.001). (F) Representative Giemsa/May-Grünwald staining for purified macrophage populations and cDC2 (n = 4 in three independent experiments; scale bars = 10 μm). (G) Surface expression of selected markers. Open histograms represent isotype control staining. Colored histograms represent each macrophage population (red for CD36lo, green for CD36int, and blue for CD36hi). Expression was quantified using Ratio MFI. Each symbol represents an individual donor (n = 6 in four independent experiments, one-way ANOVA; *, P < 0.05; **, P < 0.01; ***, P < 0.001; ****, P < 0.0001).
Human tonsils contain three populations of macrophages. (A–C) Purified HLA-DR+CD11c+CD14+ cells from human tonsils were analyzed by scRNA-seq (n = 1). (A) UMAP visualization. Macrophages were grouped into three clusters. (B) Scaled expression (in log value) of the top 25 differentially expressed genes between S100A9+, C1QC+, and intermediate macrophages. (C) Average expression of selected genes for S100A9+, C1QC+, and intermediate macrophages. Genes of special interest are highlighted by asterisks. (D–G) Macrophage populations were identified by the surface expression of CD36 and CD81. (D) Intracellular staining for C1QC and S100A8/9. Proportion of C1QC+ or S100A8/9+ populations among CD36lo, CD36int, and CD36hi macrophages (n = 8 in three independent experiments). (E) Proportion of each population among HLA-DR+CD11c+CD14+ cells. Each dot represents an individual donor (n = 20 in 12 independent experiments, one-way ANOVA; **, P < 0.01; ***, P < 0.001). (F) Representative Giemsa/May-Grünwald staining for purified macrophage populations and cDC2 (n = 4 in three independent experiments; scale bars = 10 μm). (G) Surface expression of selected markers. Open histograms represent isotype control staining. Colored histograms represent each macrophage population (red for CD36lo, green for CD36int, and blue for CD36hi). Expression was quantified using Ratio MFI. Each symbol represents an individual donor (n = 6 in four independent experiments, one-way ANOVA; *, P < 0.05; **, P < 0.01; ***, P < 0.001; ****, P < 0.0001).
Tonsil macrophage populations have distinct proliferative capacity and relationship to progenitors
To better characterize the transcriptomic profiles of the three macrophage populations, we performed bulk RNA-seq on isolated CD36hi, CD36int, and CD36lo macrophages (Fig. 2 A and Table S2). We found that CD36hi and CD36lo macrophages had the most distinct transcriptional profiles. By contrast, CD36int macrophages displayed only a few genes with selective enrichment. Consistent with the scRNA-seq profile, CD36hi macrophages had the highest expression of CD36 and of monocytes genes such as VCAN and CCR2. CD36lo macrophages displayed high expression of integrins ITGB3 and ITGB5 (the latest shared with CD36int macrophages), two phagocytic receptors for apoptotic cells (Savill et al., 1990; Kumawat et al., 2018). To further characterize the properties of these macrophage subsets, we performed enrichment analysis for Gene Ontology biological processes (Fig. 2 B). CD36hi macrophages were enriched for pathways related to inflammation and neutrophil activation. Of note, neutrophils were depleted during macrophage enrichment, excluding the possibility that CD36hi macrophages were contaminated by neutrophils in our transcriptomic analysis (Fig. S2 A). CD36lo macrophages were enriched for cell cycle genes (Fig. 2 B). To confirm this observation, we analyzed cell cycle phases in tonsil macrophages using flow cytometry (Fig. 2, C and D). We found that virtually all CD36hi macrophages were quiescent (G0 phase), while a proportion of CD36lo macrophages and CD36int macrophages was actively cycling (Fig. 2, C and D). These results suggest that CD36hi macrophages are short-lived, while CD36int and CD36lo macrophages could have the capacity to self-renew. To address whether these populations may have different origins, we tested their transcriptional similarity to potential progenitors using gene set enrichment analysis (GSEA). We used published gene signatures for human yolk sac macrophages, human yolk sac myeloid progenitors and human CD14+ blood monocytes, as well as cell cycle (Table S3). We found that CD36lo macrophages were enriched for the signatures of yolk sac macrophages and yolk sac myeloid progenitors, compared to CD36hi macrophages and CD36int macrophages (Fig. 2 E and Fig. S2 B). CD36lo macrophages were also enriched for the cell cycle signature compared to CD36hi macrophages. CD36hi macrophages were enriched for the blood monocytes signature, compared to CD36lo macrophages and CD36int macrophages. Finally, CD36int macrophages were also enriched for the blood monocytes signature compared to CD36lo macrophages. In addition, we detected the expression of FOLR2, a proposed marker gene across species for macrophages of embryo origin (Dick et al., 2022; Mulder et al., 2021; Nalio Ramos et al., 2022), in CD36lo and CD36int macrophages, but not in CD36hi macrophages (Fig. S2 C).

Tonsil macrophage populations have distinct proliferative capacity and relationship to progenitors. (A) Purified CD36hi, CD36lo, and CD36int macrophages were analyzed by bulk RNA-seq (n = 6). Differentially expressed genes are depicted in a Triwise plot. The direction of a point represents up-regulation in one or two subsets, whereas the distance from the origin represents the magnitude (Log2 FoldChange). Selected genes specific to each population are shown. (B) Gene Ontology enrichment analysis of differentially expressed genes. (C and D) Macrophage populations were analyzed by flow cytometry. Cell cycle analysis on live cells using Ki-67 expression and DNA content (DAPI staining). (C) Representative results (n = 7 in three independent experiments), percentage of cells in each cycle phase are shown. (D) Proportions of cells in G0, G1, S, and G2/M phase (n = 7 in three independent experiments, one-way ANOVA; *, P < 0.05; **, P < 0.01; ***, P < 0.001; ****, P < 0.0001). (E) GSEA analysis for gene signatures of yolk sac macrophages, yolk sac myeloid progenitors, cell cycle, and blood CD14+ monocytes. NES, normalized enrichment score; FDR, false discovery rate; ns, not significant.
Tonsil macrophage populations have distinct proliferative capacity and relationship to progenitors. (A) Purified CD36hi, CD36lo, and CD36int macrophages were analyzed by bulk RNA-seq (n = 6). Differentially expressed genes are depicted in a Triwise plot. The direction of a point represents up-regulation in one or two subsets, whereas the distance from the origin represents the magnitude (Log2 FoldChange). Selected genes specific to each population are shown. (B) Gene Ontology enrichment analysis of differentially expressed genes. (C and D) Macrophage populations were analyzed by flow cytometry. Cell cycle analysis on live cells using Ki-67 expression and DNA content (DAPI staining). (C) Representative results (n = 7 in three independent experiments), percentage of cells in each cycle phase are shown. (D) Proportions of cells in G0, G1, S, and G2/M phase (n = 7 in three independent experiments, one-way ANOVA; *, P < 0.05; **, P < 0.01; ***, P < 0.001; ****, P < 0.0001). (E) GSEA analysis for gene signatures of yolk sac macrophages, yolk sac myeloid progenitors, cell cycle, and blood CD14+ monocytes. NES, normalized enrichment score; FDR, false discovery rate; ns, not significant.

Tonsil macrophage populations display distinct origin. (A) The presence of neutrophils in tonsil cell suspensions was analyzed by flow cytometry, before and after enrichment for mononuclear phagocytes (representative images, n = 6 in three independent experiments). Neutrophils were identified as CD45+CD15+. (B) GSEA analysis of CD36hi, CD36lo, and CD36int macrophages for gene signatures of yolk sac macrophages, yolk sac myeloid progenitors, cell cycle, and blood CD14+ monocytes. NES, normalized enrichment score; FDR, false discovery rate; ns, not significant. Statistically significant results are highlighted in red. (C) Normalized expression of FOLR2 from bulk RNA-seq data (n = 6).
Tonsil macrophage populations display distinct origin. (A) The presence of neutrophils in tonsil cell suspensions was analyzed by flow cytometry, before and after enrichment for mononuclear phagocytes (representative images, n = 6 in three independent experiments). Neutrophils were identified as CD45+CD15+. (B) GSEA analysis of CD36hi, CD36lo, and CD36int macrophages for gene signatures of yolk sac macrophages, yolk sac myeloid progenitors, cell cycle, and blood CD14+ monocytes. NES, normalized enrichment score; FDR, false discovery rate; ns, not significant. Statistically significant results are highlighted in red. (C) Normalized expression of FOLR2 from bulk RNA-seq data (n = 6).
Collectively, these results suggest that tonsil macrophage subsets display distinct life cycle and origin. Our data support the idea that CD36hi macrophages are short-lived and derive from monocytes, while CD36lo macrophages are long-lived and originate from embryonic precursors. CD36int macrophages could represent a population transitioning between CD36hi and CD36lo macrophages, or a population of tissue-resident macrophages that is replenished by monocytes.
Monocyte recruitment in tonsils is not constitutive and correlates with immune responses
In mouse, short-lived monocyte-derived macrophages are recruited either continuously in specific tissues such as mucosa, or in response to local inflammation after injury (Guilliams et al., 2020). We hypothesized that monocyte recruitment in non-pathological tonsils could be due to low-grade inflammation from either exposure to oral microbiota or on-going immune responses against inhaled particles. To address this, we sought to compare mononuclear phagocyte populations from tonsils in a naive state or upon an immune challenge. Because human subjects are constantly exposed to environmental airborne antigens, it is impossible to obtain truly naive tonsils. Therefore, we turned to a model of non-human primates and compared a naive animal with macaques infected intra-nasally with influenza A virus (H3N2 strain). Tonsils were sampled on day 5 or 14 after infection. We profiled tonsil mononuclear phagocytes using scRNA-seq after cell enrichment (Fig. 3 A and Fig. S3 A). Unsupervised clustering of the integrated dataset identified 11 clusters (Fig. 3 B and Fig. S3 B) that we annotated as monocytes (expressing VCAN, S100A8, and CLEC4A), S100A8+ macrophages (VCAN, S100A8, CD163, FCN1, CTSD, CD68), C1QC+ macrophages (C1QC, CTSD, CD68, LGMN, DNASE2), macrophages (CTSD, CD68, LGMN, DNASE2), cDC1 (CPVL, FLT3, CLEC9A, C1orf54), three clusters of cDC2 (CPVL, CSF1R, FLT3, CD1C, FCER1A), transitional dendritic cells (DC; CPVL, LTB), and two clusters of activated DC (LAMP3, FSCN1, CCR7; Fig. 3 C and Table S4). Cells from the different samples (naive, day 5 after infection and day 14 after infection) had a significantly different expression of IFN-stimulated genes (CXCL10, ISG15, IFIT2, IFIT3, IFI44L, OAS2, MX1; Fig. S3 C), with virtually undetectable expression in the naïve condition, high expression at day 5 after infection, and reduced to undetectable expression at day 14 depending on clusters. These results confirm the naive state of the uninfected macaque and suggest that inflammatory responses are in a resolving phase 14 d after influenza A infection.

Monocyte recruitment in tonsils is not constitutive and correlates with immune responses. Mononuclear phagocytes isolated from the tonsils of naive and influenza virus (H3N2)–infected macaques were analyzed by scRNA-seq (n = 1 per condition). For macaques infected with influenza, tonsils were sampled on day 5 and day 14 after infection. (A) Experimental strategy. Cells were enriched by cell sorting. (B) UMAP representation of annotated cell clusters from integrated scRNA-seq profiles. (C) Average expression of selected genes in each cluster. (D) Reference mapping between macaque and human macrophage clusters. Macaque cells with high correspondence were projected onto human clusters (left). Original cluster labels (NHP labels) are shown (right). (E and F) Macrophage and monocyte clusters were analyzed for RNA velocity. (E) Pseudo-time in each individual cell. (F) Connectivity graph. (G) UMAP representation of annotated cell clusters by sample origin. (H) Proportion of cells belonging to each cluster in each sample.
Monocyte recruitment in tonsils is not constitutive and correlates with immune responses. Mononuclear phagocytes isolated from the tonsils of naive and influenza virus (H3N2)–infected macaques were analyzed by scRNA-seq (n = 1 per condition). For macaques infected with influenza, tonsils were sampled on day 5 and day 14 after infection. (A) Experimental strategy. Cells were enriched by cell sorting. (B) UMAP representation of annotated cell clusters from integrated scRNA-seq profiles. (C) Average expression of selected genes in each cluster. (D) Reference mapping between macaque and human macrophage clusters. Macaque cells with high correspondence were projected onto human clusters (left). Original cluster labels (NHP labels) are shown (right). (E and F) Macrophage and monocyte clusters were analyzed for RNA velocity. (E) Pseudo-time in each individual cell. (F) Connectivity graph. (G) UMAP representation of annotated cell clusters by sample origin. (H) Proportion of cells belonging to each cluster in each sample.

Characterization of tonsil mononuclear phagocytes of macaques. Mononuclear phagocytes isolated from the tonsils of naive and influenza virus (H3N2)–infected macaques (day 5 and day 14 after infection) were analyzed by scRNA-seq (n = 1 per condition). (A) Gating strategy used for enriching mononuclear phagocytes populations from macaque tonsils. Live single cells were gated as positive for HLA-DR and negative for CD3, CD8, CD20, and CD123. (B) Scaled expression (in log value) of the top 15 differentially expressed genes between clusters in the integrated dataset. (C) Average expression of IFN-stimulated genes in each cluster of each sample. (D) Macrophage clusters identified in human tonsils by scRNA-seq were queried for gene signatures of macaque macrophage populations. (E) UMAP representation of annotated cell clusters from each macaque sample.
Characterization of tonsil mononuclear phagocytes of macaques. Mononuclear phagocytes isolated from the tonsils of naive and influenza virus (H3N2)–infected macaques (day 5 and day 14 after infection) were analyzed by scRNA-seq (n = 1 per condition). (A) Gating strategy used for enriching mononuclear phagocytes populations from macaque tonsils. Live single cells were gated as positive for HLA-DR and negative for CD3, CD8, CD20, and CD123. (B) Scaled expression (in log value) of the top 15 differentially expressed genes between clusters in the integrated dataset. (C) Average expression of IFN-stimulated genes in each cluster of each sample. (D) Macrophage clusters identified in human tonsils by scRNA-seq were queried for gene signatures of macaque macrophage populations. (E) UMAP representation of annotated cell clusters from each macaque sample.
To examine the homology between macaque macrophage clusters and clusters from human tonsils, we generated gene signatures of the macaque macrophages and converted to human homologue genes (Table S5). We calculated enrichment scores for these signatures in the human scRNA-seq dataset (Fig. S3 D). We found that the C1QC+ macaque macrophages signature was enriched in the C1QC+ human macrophages, while the S100A8+ macaque macrophages signature was enriched in S100A9+ human macrophages, and the signature for the third cluster of macaque macrophages was slightly enriched in S100A9+ human macrophages (Fig. S3 D). Of note, FOLR2 expression was detected only in C1QC+ macaque macrophages (Fig. 3 C). To further explore the correspondence between macaque and human macrophage clusters, we used a reference-mapping approach using the two scRNA-seq datasets. Macaque cells displaying high-scoring correspondence were projected onto the human macrophage clusters (Fig. 3 D). Cells projecting onto the S100A9+ human macrophages belonged mainly to the macaque monocytes and S100A8+ macrophages clusters. Cells projecting onto the C1QC+ human macrophages were exclusively from the C1QC+ macaque macrophage cluster. Finally, some cells from the third macaque macrophage cluster projected onto both the human “intermediate macrophages” and S100A9+ macrophages clusters. To address the potential developmental relationship between monocyte and macrophage populations in macaque tonsils, we performed RNA velocity analysis using scVelo (Bergen et al., 2020; Fig. 3, E and F). Monocytes were identified as the starting point of the pseudo-time inferred from RNA velocity (Fig. 3 E), and connectivity graph showed that monocytes and S100A8+ macrophages had the highest probability of transitions (Fig. 3 F). Collectively, these results suggest that C1QC+ macaque macrophages are equivalent to human tonsil C1QC+ macrophages, and that S100A8+ macaque macrophages are monocyte derived and equivalent to human tonsil S100A9+ macrophages. The third cluster of macaque macrophages showed mixed features and could represent the equivalent of human “intermediate” macrophages.
Finally, to address the dynamics of these populations during immune responses, we examined the sample origin of cells in each cluster (naive or influenza-infected animals). We found that the cluster of monocytes was virtually absent from naive tonsils, and the proportion of cells belonging to the S100A8+ macrophages cluster was minimal in naive tonsils (Fig. 3, G and H; and Fig. S3 E). We conclude that recruitment into the tonsils of short-lived monocyte-derived macrophages is not constitutive and correlates with on-going immune responses.
Tonsil CD36hi macrophages are specialized for the stimulation of Tfh cells
To gain more insight into the function of human tonsil macrophage subsets, we performed enrichment analysis for biological pathways of human cells (BioPlanet database; Huang et al., 2019) using the RNA-seq data from human tonsils (Fig. 4 A). We found that CD36hi macrophages were enriched for cytokine activity (TNF-α, leptin, IL-5) and receptor signaling pathways (phagosome, extracellular matrix-receptor, G-protein coupled receptor). CD36lo macrophages were enriched for the control of mitosis and microtubules dynamics (phosphorylation of Emi1, Stathmin), biochemical pathways (heme biosynthesis, prothrombin activation, alpha-hemoglobin–stabilizing protein pathway), and cell–cell interactions (semaphoring interactions, axon guidance). These analyses suggest different roles for CD36hi macrophages and CD36lo macrophages, the former being more involved in immune responses and the later more involved in trophic non-immune functions.

Tonsil CD36 hi macrophages are specialized for the stimulation of Tfh cells. (A) Pathway enrichment analysis (BioPlanet database) of differentially expressed genes for CD36hi and CD36int macrophages. (B) Scaled expression of selected molecules in the bulk RNA-seq data (n = 6). (C) Purified macrophage subsets were cultured overnight. Cytokine secretion was measured by ELISA (Activin A) or CBA (IL10, IL6, and IL8) in the supernatant. Each symbol represents an individual donor (n = 8 in eight independent experiments for Activin A and n = 6 in six independent experiments for others). Friedman test, *, P < 0.05; **, P < 0.01. (D) Surface expression of OX40-ligand. Open histograms represent isotype control staining. Colored histograms represent each macrophage population (red for CD36lo, green for CD36int, blue for CD36hi). Expression was quantified using Ratio MFI. Each symbol represents an individual donor (n = 6 in five independent experiments, one-way ANOVA; *, P < 0.05; **, P < 0.01). (E) Tonsil Tfh cells were co-cultured with autologous macrophage subsets. CXCL13 and lymphotoxin-α secretion was measured by ELISA in the supernatant. Each symbol represents an individual donor (n = 8 in eight independent experiments). Friedman test; *, P < 0.05; **, P < 0.01. (F) Linear regression between the number of germinal center Tfh cells and of macrophage subsets in tonsils (n = 13 in 10 independent experiments). (G) GSEA for gene signatures of CD36hi and CD36lo macrophages, and Tfh cells in human lymph nodes from control donors or patients with sarcoidosis or tuberculosis (GSE157671). NES, normalized enrichment score; FDR, false discovery rate; ns, not significant.
Tonsil CD36 hi macrophages are specialized for the stimulation of Tfh cells. (A) Pathway enrichment analysis (BioPlanet database) of differentially expressed genes for CD36hi and CD36int macrophages. (B) Scaled expression of selected molecules in the bulk RNA-seq data (n = 6). (C) Purified macrophage subsets were cultured overnight. Cytokine secretion was measured by ELISA (Activin A) or CBA (IL10, IL6, and IL8) in the supernatant. Each symbol represents an individual donor (n = 8 in eight independent experiments for Activin A and n = 6 in six independent experiments for others). Friedman test, *, P < 0.05; **, P < 0.01. (D) Surface expression of OX40-ligand. Open histograms represent isotype control staining. Colored histograms represent each macrophage population (red for CD36lo, green for CD36int, blue for CD36hi). Expression was quantified using Ratio MFI. Each symbol represents an individual donor (n = 6 in five independent experiments, one-way ANOVA; *, P < 0.05; **, P < 0.01). (E) Tonsil Tfh cells were co-cultured with autologous macrophage subsets. CXCL13 and lymphotoxin-α secretion was measured by ELISA in the supernatant. Each symbol represents an individual donor (n = 8 in eight independent experiments). Friedman test; *, P < 0.05; **, P < 0.01. (F) Linear regression between the number of germinal center Tfh cells and of macrophage subsets in tonsils (n = 13 in 10 independent experiments). (G) GSEA for gene signatures of CD36hi and CD36lo macrophages, and Tfh cells in human lymph nodes from control donors or patients with sarcoidosis or tuberculosis (GSE157671). NES, normalized enrichment score; FDR, false discovery rate; ns, not significant.
Consistent with this, we observed higher expression in CD36hi macrophages of cytokines involved in T and B cell activation (IL7, TNFSF13B encoding BAFF, INHBA encoding Activin A, IL10, TNFSF8 encoding CD30-ligand) and of the chemokine CCL7 (Fig. 4 B). To validate this finding at the protein level, we isolated macrophage subsets and measured spontaneous cytokine secretion after ex vivo culture. CD36hi macrophages were the most efficient for the secretion of Activin A, IL-6, and IL-10, while CD36lo and CD36int macrophages secreted more IL-8 (Fig. 4 C). OX40-ligand, a co-stimulatory molecule involved in Tfh stimulation (Pattarini et al., 2017), was also more expressed by CD36hi macrophages (Fig. 4 D). Activin A is essential for instructing the differentiation of human Tfh cells (Locci et al., 2016). In particular, Activin A is required for inducing the production of effector cytokines CXCL13 and lymphotoxin-α (Locci et al., 2016). Moreover, we have previously shown that tonsil macrophages can stimulate Tfh cells and confirmed that Activin A plays a major part in this process (Durand et al., 2019). To directly address which macrophage subsets can stimulate Tfh cells, we co-cultured purified tonsil Tfh cells with each macrophage subset, in an autologous setting. Only CD36hi macrophages could induce the secretion by Tfh cells of the effector molecules CXCL13 and lymphotoxin-α (Fig. 4 E). Furthermore, there was a correlation between the numbers of Tfh cells and of CD36hi macrophages in the same tonsils, but not of CD36lo macrophages (Fig. 4 F). Finally, to validate these findings in a pathophysiological situation, we performed GSEA on transcriptomic data of human lymph nodes from control donors or patients with sarcoidosis or tuberculosis (Fig. 4 G and Fig. S4). We found that the signatures of CD36hi macrophages and of Tfh cells were both enriched in the lymph nodes of sarcoidosis and tuberculosis patients compared to controls. Collectively, these results indicate that tonsil CD36hi macrophages are specialized for the stimulation of Tfh cells and show a correlation in the abundance of CD36hi macrophages and Tfh cells in secondary lymphoid organs.

Abundance of CD36 hi macrophages and Tfh cells correlate in human lymph nodes. GSEA for gene signatures of CD36hi and CD36lo macrophages, and Tfh cells in human lymph nodes from control donors or patients with sarcoidosis or tuberculosis (GSE157671). NES, normalized enrichment score; FDR, false discovery rate; ns, not significant. Statistically significant results are highlighted in red.
Abundance of CD36 hi macrophages and Tfh cells correlate in human lymph nodes. GSEA for gene signatures of CD36hi and CD36lo macrophages, and Tfh cells in human lymph nodes from control donors or patients with sarcoidosis or tuberculosis (GSE157671). NES, normalized enrichment score; FDR, false discovery rate; ns, not significant. Statistically significant results are highlighted in red.
Tonsil macrophages subsets are localized in different anatomical locations
To validate the relevance of our findings in tonsil physiology, we analyzed the in situ localization of macrophage populations within the human tonsils. We first used imaging mass cytometry and we segmented tonsil sections into T cell–rich “extra-follicular zone” (based on CD3) and follicular zone (based on CD19; Fig. 5 A). B cell follicles were further separated into “light zone,” “dark zone,” and “mantle zone” based on Ki67 staining. Macrophages were identified by CD68 staining, and populations were further analyzed using CD36, S100A9, and CD163 markers (Fig. 5 B). Macrophages were located preferentially in the B cell follicular zone (Fig. 5 C), consistent with our previous findings (Durand et al., 2019). Unsupervised analysis of the images using FlowSom (Van Gassen et al., 2015) showed that CD36+S100A9+ macrophages were mostly localized in the extra-follicular and light zones, while CD163+HLA-DRhigh macrophages (which could correspond to CD36int or CD36lo macrophages) were preferentially found in the dark zone (Fig. 5 D). CD163+HLA-DRlow macrophages were also identified in the extra-follicular zone. To better characterize the localization of CD36lo macrophages, we sought to use an additional marker for this population and searched our bulk RNA-seq data for differentially expressed molecules that would be suitable for microscopy. We chose CLIC6, which is highly expressed in CD36lo macrophages (Fig. 2 A and Fig. 5 E). We then employed multispectral immunofluorescence microscopy. We identified macrophages with CD68 staining and segmented B cell follicles into light zone (based on CD20 for B cells and CD35 for follicular DC [FDC]), dark zone (identified with CD20 and Ki67 for proliferating cells), and mantle zone (CD20dimCD35−Ki67−; Fig. 5 F). We also found in this series that macrophages were predominantly found in the B cell follicle zone (Fig. 5 G). CLIC6+ macrophages were preferentially localized in the extra-follicular zone (Fig. 5 H). Collectively, these results indicate that the three macrophage subsets are found in different anatomical locations: CD36lo macrophages in the extra-follicular zone, CD36int macrophages in the dark zone, and CD36hi macrophages both in the extra-follicular zone and light zone where Tfh cells are also located (Durand et al., 2019).

Tonsil macrophage subsets are localized in different anatomical locations. (A–D) Tonsil sections were imaged by imaging mass cytometry. (A) T cell–rich extra-follicular zone (EZ), light zone (LZ), dark zone (DZ), and mantle zone (MZ) of the B cell follicle were segmented based on CD3, CD19, and Ki67 staining. Scale bar = 150 μm. (B) Macrophages were stained for indicated markers. Insets of two regions of interest are shown. Representative images (n = 4, scale bar = 50 μm). (C) Density of CD68+ cells in the different zones. Paired t test. (D) Unsupervised spatial analysis of CD68+ cells (n = 4). Intensity of staining for each marker is depicted. (E) Normalized expression of CLIC6 from bulk RNA-seq data. (F–H) Tonsil sections were imaged by multispectral immunofluorescence microscopy. (F) Zones were segmented based on CD20, CD35, and Ki67 staining. Macrophages were stained for CD68. Nuclei are stained with DAPI. Representative image (n = 11; scale bar = 100 μm). (G) Percentage of CD68+ cells in the different zones. (H) Insets showing CLIC6+ macrophages. Representative images (n = 11; scale bar = 100 μm for the main image and 500 μm for insets). Percentage of CLIC6+ macrophages in the different zones. One-way ANOVA. For all panels, each symbol represents an individual donor (*, P < 0.05; **, P < 0.01; ***, P < 0.001).
Tonsil macrophage subsets are localized in different anatomical locations. (A–D) Tonsil sections were imaged by imaging mass cytometry. (A) T cell–rich extra-follicular zone (EZ), light zone (LZ), dark zone (DZ), and mantle zone (MZ) of the B cell follicle were segmented based on CD3, CD19, and Ki67 staining. Scale bar = 150 μm. (B) Macrophages were stained for indicated markers. Insets of two regions of interest are shown. Representative images (n = 4, scale bar = 50 μm). (C) Density of CD68+ cells in the different zones. Paired t test. (D) Unsupervised spatial analysis of CD68+ cells (n = 4). Intensity of staining for each marker is depicted. (E) Normalized expression of CLIC6 from bulk RNA-seq data. (F–H) Tonsil sections were imaged by multispectral immunofluorescence microscopy. (F) Zones were segmented based on CD20, CD35, and Ki67 staining. Macrophages were stained for CD68. Nuclei are stained with DAPI. Representative image (n = 11; scale bar = 100 μm). (G) Percentage of CD68+ cells in the different zones. (H) Insets showing CLIC6+ macrophages. Representative images (n = 11; scale bar = 100 μm for the main image and 500 μm for insets). Percentage of CLIC6+ macrophages in the different zones. One-way ANOVA. For all panels, each symbol represents an individual donor (*, P < 0.05; **, P < 0.01; ***, P < 0.001).
TNF-α produced by stromal cells induces Activin A secretion selectively in CD36hi macrophages
Numerous studies in mouse have shown that macrophage identity and maintenance rely on cues from surrounding stromal cells (Guilliams et al., 2020). To better understand the ecology of macrophages in tonsils, we first assessed the production by stromal cells of CSF1/M-CSF, a major survival and differentiation factor for macrophages (Lavin et al., 2015). We analyzed by intracellular flow cytometry the three main populations of lymphoid stromal cells (LSC), namely, CD21−gp38+CD49a+ fibroblastic reticular cells (CD49a+ FRC), perivascular CD21−gp38−CD49a+ FRC (double negative [DN]), and CD21+ FDC (Mourcin et al., 2021; Fig. S5, A and B). FDC and CD49a+ FRC produced CSF1, with FDC being the most potent (Fig. 6 A). The production of CSF1 by endothelial cells (EC) and DN FRC was modest. We then sought to address whether the tonsil micro-environment could impact the functional program of CD36hi macrophages, focusing on their ability to produce Activin A. To directly assess the impact of LSC on Activin A production by macrophages, we generated “environment-naive” macrophages by differentiating blood monocytes into macrophages using CSF1. We co-cultured tonsil LSC and in vitro–generated monocyte-derived macrophages and measured Activin A secretion (Fig. 6 B). We found that LSC significantly increased Activin A secretion by monocyte-derived macrophages. To identify candidate signals from the LSC involved in this phenomenon, we used a computational approach to identify potential ligand-receptor interactions with NicheNet (Browaeys et al., 2020). We used RNA-seq data from human tonsil stromal cells (Mourcin et al., 2021) for the sender cells, and genes differentially expressed in CD36hi macrophages for the receiver cells. Among putatively active ligand–target connections, we identified two stroma ligands potentially inducing the expression of INHBA (the gene encoding Activin A): IL1-β and TNF-α (Fig. 6 C). To directly assess whether IL1-β or TNF-α could induce Activin A secretion by macrophages, we exposed in vitro–generated monocyte-derived macrophages to recombinant IL1-β or TNF-α. We found that TNF-α, but not IL1-β, significantly increased Activin A secretion (Fig. 6 D). To confirm the production of TNF-α by stromal cell populations, we performed intra-cellular flow cytometry (Fig. S5 C). We detected TNF-α in all LSC subpopulations (Fig. 6 E). To confirm the role of stromal TNF-α, we co-cultured tonsil LSC and in vitro–generated monocyte-derived macrophages in the presence of an anti–TNF-α blocking antibody (Fig. 5 F), which significantly reduced Activin A secretion. Finally, to address whether exposure to TNF-α was sufficient for inducing Activin A secretion by any population of macrophage, we purified tonsil macrophage subsets and exposed them to TNF-α ex vivo (Fig. 6 G). We found that only CD36hi macrophages secreted Activin A, at a similar concentration as in the absence of ex vivo TNF-α stimulation (Fig. 5 C). This result suggests that CD36lo and CD36int macrophages lacked the intrinsic ability to produce Activin A. Collectively, these results indicate that TNF-α produced by tonsil stromal cells induces Activin A secretion selectively in monocyte-derived macrophages.

Analysis of cytokine production in tonsil LSC. (A) Gating strategy used for characterizing tonsil LSC populations. (B and C) M-CSF/CSF1 (B) or TNF-α (C) production by LSC was assessed by intracellular flow cytometry. Gates identifying positive cells are based on isotype staining controls. Representative results (n = 8 in six independent experiments).
Analysis of cytokine production in tonsil LSC. (A) Gating strategy used for characterizing tonsil LSC populations. (B and C) M-CSF/CSF1 (B) or TNF-α (C) production by LSC was assessed by intracellular flow cytometry. Gates identifying positive cells are based on isotype staining controls. Representative results (n = 8 in six independent experiments).

TNF-α produced by stromal cells induces Activin A secretion selectively in CD36 hi macrophages. (A) M-CSF production by LSC was assessed by intracellular flow cytometry (n = 8 in six independent experiments, one-way ANOVA; *, P < 0.05; **, P < 0.01; ***, P < 0.001; ****, P < 0.0001). (B) Blood monocytes were cultured with M-CSF for 5 d to generate monocyte-derived macrophages (MDM). Monocyte-derived macrophages were cultured overnight in presence or absence of purified tonsil LSC (n = 8 in six independent experiments, one-way ANOVA; *, P < 0.05; **, P < 0.01; ****, P < 0.0001). (C) Potential ligand–receptor interactions between LSC and CD36hi macrophages were inferred using NicheNet. Heatmap shows predicted regulatory potential between ligands expressed by LSC and receptors or downstream target genes expressed by CD36hi macrophages. Genes of special interest are highlighted. (D) Monocyte-derived macrophages were exposed to recombinant human (rh) TNF-α or IL1-β. After overnight co-culture, Activin A secretion was measured in the supernatant (n = 7 in three independent experiments, one-way ANOVA; *, P < 0.05; **, P < 0.01; ***, P < 0.001). (E) TNF-α production by LSC was assessed by intracellular flow cytometry (n = 8 in six independent experiments). (F) Monocyte-derived macrophages were cultured overnight with purified tonsil LSC in presence of anti-TNFα blocking antibody or control isotype. Activin A secretion was measured in the supernatant. (n = 8 in six independent experiments, paired Student’s t test; *, P < 0.05; **, P < 0.01; ***, P < 0.001). (G) Purified tonsil CD36hi, CD36lo, and CD36int macrophages were cultured overnight in the presence of rhTNF-α. Activin A secretion was measured in the supernatant (n = 5 in three independent experiments; Friedman test with *, P < 0.05). For all panels, each symbol represents an individual donor.
TNF-α produced by stromal cells induces Activin A secretion selectively in CD36 hi macrophages. (A) M-CSF production by LSC was assessed by intracellular flow cytometry (n = 8 in six independent experiments, one-way ANOVA; *, P < 0.05; **, P < 0.01; ***, P < 0.001; ****, P < 0.0001). (B) Blood monocytes were cultured with M-CSF for 5 d to generate monocyte-derived macrophages (MDM). Monocyte-derived macrophages were cultured overnight in presence or absence of purified tonsil LSC (n = 8 in six independent experiments, one-way ANOVA; *, P < 0.05; **, P < 0.01; ****, P < 0.0001). (C) Potential ligand–receptor interactions between LSC and CD36hi macrophages were inferred using NicheNet. Heatmap shows predicted regulatory potential between ligands expressed by LSC and receptors or downstream target genes expressed by CD36hi macrophages. Genes of special interest are highlighted. (D) Monocyte-derived macrophages were exposed to recombinant human (rh) TNF-α or IL1-β. After overnight co-culture, Activin A secretion was measured in the supernatant (n = 7 in three independent experiments, one-way ANOVA; *, P < 0.05; **, P < 0.01; ***, P < 0.001). (E) TNF-α production by LSC was assessed by intracellular flow cytometry (n = 8 in six independent experiments). (F) Monocyte-derived macrophages were cultured overnight with purified tonsil LSC in presence of anti-TNFα blocking antibody or control isotype. Activin A secretion was measured in the supernatant. (n = 8 in six independent experiments, paired Student’s t test; *, P < 0.05; **, P < 0.01; ***, P < 0.001). (G) Purified tonsil CD36hi, CD36lo, and CD36int macrophages were cultured overnight in the presence of rhTNF-α. Activin A secretion was measured in the supernatant (n = 5 in three independent experiments; Friedman test with *, P < 0.05). For all panels, each symbol represents an individual donor.
IRF1 activity is required for Activin A production in monocyte-derived macrophages
The above results suggest that cell-intrinsic factors control the production of Activin A upon TNF-α exposure. We hypothesized that transcription factors may be involved. To assess differential transcription factor activity in tonsil macrophage subsets, we inferred transcriptional networks using DoRoTHea (Garcia-Alonso et al., 2019; Fig. 7 A). We identified several transcription factors whose activity was enriched in CD36hi macrophages compared to both CD36lo macrophages and CD36int macrophages, including IKZF1, HIF1A, IRF1, and EPAS1 as the top ones. Among these, we selected IRF1 as a candidate because its expression has been reported to be upregulated by TNF-α in human macrophages (Yarilina et al., 2008). To assess IRF1 expression at the protein level, we performed intracellular flow cytometry (Fig. 7 B). We found that CD36hi macrophages had the highest expression of IRF1. IRF1 has been shown in human macrophages to control gene expression upon stimulation by acting on chromatin remodeling (Song et al., 2021). To address whether IRF1 was required for accessibility of the INHBA locus (encoding for Activin A), we re-analyzed assay for transposase-accessible chromatin with high throughput sequencing (ATAC-seq) data from in vitro–generated THP1-derived macrophages deficient for IRF1 (Song et al., 2021). We found that the promoter region of the INHBA locus became accessible upon stimulation in WT but not in IRF1-deficient macrophages (Fig, 7, C and D). To validate the role of IRF1 in Activin production, we silenced its expression in in vitro–generated monocyte-derived macrophages, using a lentivirus containing an IRF1-specific shRNA or a control sequence. We confirmed that IRF1 expression was significantly decreased in macrophages at the protein level (Fig. 7 E). We exposed silenced or control macrophages to TNF-α and measured cytokine secretion (Fig. 7 F). Activin A secretion was significantly decreased in silenced macrophages, while the secretion of other cytokines such as IL-10 and IL-8 was increased in silenced macrophages. These results show that IRF1 is required in macrophages for the specific production of Activin A. We conclude that Activin A secretion in macrophages is controlled by a two-stage mechanism: TNF-α receptor signaling induces Activin A expression only in macrophage populations in which IRF1 activity allows chromatin accessibility at the locus.
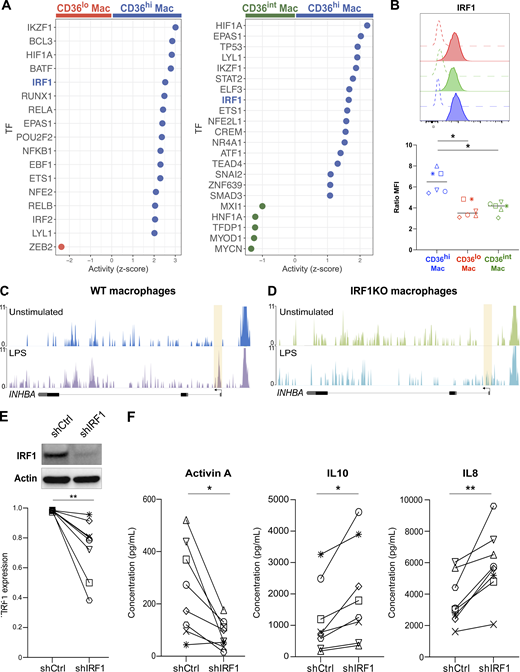
IRF1 activity is required for Activin A production in monocyte-derived macrophages. (A) Inference of transcription factor (TF) activity. Activity (z-score) in CD36hi macrophages compared to CD36lo macrophages and of CD36hi macrophages compared to CD36int macrophages. TF of special interest is highlighted. (B) Expression of IRF1 in tonsil macrophages assessed by intracellular flow cytometry. Open histograms represent isotype control staining. Colored histograms represent each macrophage population (red for CD36lo, green for CD36int, blue for CD36hi). Expression was quantified using Ratio MFI. Each symbol represents an individual donor (n = 6 in three independent experiments). One-way ANOVA; *, P < 0.05. (C and D) Genome tracks showing chromatin accessibility at the locus of INHBA in THP1-derived WT macrophages (C) or IRF1 KO macrophages (D) stimulated or not with LPS for 1 h. Shaded areas indicate changes in ATAC-seq peaks. (E and F) Blood monocytes were cultured with M-CSF for 5 d to generate monocyte-derived macrophages. IRF1 expression was silenced using a lentivirus containing shRNA (shIRF1) or a control sequence (shCtrl). (E) Protein quantification by Western blot after 5 d. Actin was used as loading control. Representative results are shown (n = 8 in three independent experiments). Quantification was performed by densitometry. Each symbol represents an individual donor. Wilcoxon matched-paired test, **, P < 0.01. (F) Control or IRF1-silenced macrophages were exposed to recombinant TNF-α. After overnight co-culture, Activin A, IL10, and IL8 secretion was measured in the supernatant. Each symbol represents an individual donor (n = 8 in three independent experiments). Paired t test; *, P < 0.05; **, P < 0.01. Source data are available for this figure: SourceData F7.
IRF1 activity is required for Activin A production in monocyte-derived macrophages. (A) Inference of transcription factor (TF) activity. Activity (z-score) in CD36hi macrophages compared to CD36lo macrophages and of CD36hi macrophages compared to CD36int macrophages. TF of special interest is highlighted. (B) Expression of IRF1 in tonsil macrophages assessed by intracellular flow cytometry. Open histograms represent isotype control staining. Colored histograms represent each macrophage population (red for CD36lo, green for CD36int, blue for CD36hi). Expression was quantified using Ratio MFI. Each symbol represents an individual donor (n = 6 in three independent experiments). One-way ANOVA; *, P < 0.05. (C and D) Genome tracks showing chromatin accessibility at the locus of INHBA in THP1-derived WT macrophages (C) or IRF1 KO macrophages (D) stimulated or not with LPS for 1 h. Shaded areas indicate changes in ATAC-seq peaks. (E and F) Blood monocytes were cultured with M-CSF for 5 d to generate monocyte-derived macrophages. IRF1 expression was silenced using a lentivirus containing shRNA (shIRF1) or a control sequence (shCtrl). (E) Protein quantification by Western blot after 5 d. Actin was used as loading control. Representative results are shown (n = 8 in three independent experiments). Quantification was performed by densitometry. Each symbol represents an individual donor. Wilcoxon matched-paired test, **, P < 0.01. (F) Control or IRF1-silenced macrophages were exposed to recombinant TNF-α. After overnight co-culture, Activin A, IL10, and IL8 secretion was measured in the supernatant. Each symbol represents an individual donor (n = 8 in three independent experiments). Paired t test; *, P < 0.05; **, P < 0.01. Source data are available for this figure: SourceData F7.
Discussion
In this work, we identified in human tonsils three populations of macrophages displaying distinct transcriptome, phenotype, localization, life cycle, and function. We showed that tonsil CD36hi macrophages are specialized for Activin A secretion and Tfh cells stimulation. In addition, we demonstrated that this functional program is the result of both the exposure to TNF-α produced by stromal cells and the activity of the transcription factor IRF1.
Macrophage identity is shaped by their micro-environment. However, high-dimensional comparison of macrophages from multiple tissues has revealed parallel populations conserved across tissues, expressing a core gene set (Chakarov et al., 2019; Dick et al., 2022; Mulder et al., 2021). It was proposed that most interstitial macrophages can be classified into three populations with different life cycles: yolk sac–derived macrophages expressing TIMD4, LYVE1, and FOLR2; monocyte-derived macrophages expressing CCR2; and embryo-derived macrophages showing a high degree of replacement by monocytes and expressing high levels of MHC II genes (Dick et al., 2022). Our results support this idea and extend this classification to lymphoid tissues. We identified in human tonsils three subsets of macrophages equivalents to the ones previously evidenced in human heart, liver, lung, and kidney (Dick et al., 2022). Of note, we had previously shown that CD14+ cells in tonsils do not contain any dendritic cell population (Durand et al., 2019), including the recently described DC3 subset (Villani et al., 2017). CD36lo macrophages display self-renewing capacity and selective expression of FOLR2; however, we could not detect the expression of TIMD4 or LYVE1 in our datasets. CD36hi macrophages express high levels of CCR2 and show no sign of proliferation. Similar to mouse Lyve1lo macrophages (Chakarov et al., 2019), CD36hi macrophages also express high levels of surface CX3CR1. Finally, CD36int macrophages have a mixed profile with both proliferating capacity and relative enrichment for monocyte genes, and express high levels of MHC II genes.
Macrophages found in germinal centers have been historically referred to as “tingible body macrophages,” as they contain tingible bodies, i.e., fragments of apoptotic cells. These macrophages play an essential role in the non-immunogenic clearance of apoptotic B cells and the maintenance of peripheral B cell tolerance (Rahman, 2011). Whether macrophage populations other than tingible body macrophages populate germinal centers has been unclear. Here, we found in human tonsils that CD36hi macrophages, which are present in germinal centers, are involved in the activation of immune responses rather than their down-modulation, and in particular are specialized for the stimulation of Tfh cells. Moreover, CD36hi macrophages express low levels of MERTK, a major phagocytic receptor for apoptotic cells (Scott et al., 2001). Therefore, we propose that CD36hi macrophages do not correspond to tingible body macrophages. Instead, we speculate that CD36int macrophages and CD36lo macrophages, which express higher levels of the apoptotic cell receptors MERTK (Fig. 1 G), integrin-β3 and integrin-β5 (Fig. 2 A; Finnemann and Rodriguez-Boulan, 1999; Kumawat et al., 2018; Savill et al., 1990), could be specialized for apoptotic cell clearance. Based on their anatomical location in the T cell–rich zone, CD36lo macrophages could represent the equivalent of “T cell zone–resident” macrophages identified in mouse lymph nodes (Baratin et al., 2017), while CD36int macrophages would play the role of tingible body macrophages in the dark zone. Our results suggest that several populations of macrophages may co-exist in germinal centers, playing complementary roles in supporting humoral responses.
There is ample evidence in mouse for mutual benefits through paracrine signals between macrophages and cells from their niche of residence (Blériot et al., 2020; Guilliams et al., 2020; Zhou et al., 2018). Our findings are consistent with this paradigm and extend it to short-lived macrophages, considering the germinal center as a niche. We found that FDC, stromal cells located in the germinal center, were potent producers of CSF1, a major trophic factor for macrophages. We also show that TNF-α produced by stromal cells shapes the functional program of CD36hi macrophages, by inducing Activin A secretion. On the other hand, CD36hi macrophages provide signals to other essential components of germinal centers: B cells and Tfh cells. Besides Tfh-stimulating Activin A, CD36hi macrophages express BAFF, an essential survival and maturation factor for B cells (Smulski and Eibel, 2018), and IL7, a cytokine critical for germinal center reactions (Hikida et al., 1998).
We identified a major role for the transcription factor IRF1 in controlling locus accessibility and expression of Activin A. IRF1 is known to regulate in macrophages the transcriptional response to IFN-γ (Kamijo et al., 1994; Langlais et al., 2016) and to type I IFN (Song et al., 2021). In macrophages, IRF1 expression was found to be increased by TNF-α, and IRF1 was also shown to cooperate for transcriptional activity with NF-κB, downstream of the TNF-α receptor (Yarilina et al., 2008). Therefore, there might be an autoactivation loop between IRF1 and TNF-α signaling for controlling CD36hi macrophage functions, which warrants further investigation.
In mouse, monocyte-derived macrophages are found constitutively in steady-state mucosal tissues such as skin (Tamoutounour et al., 2013), intestine (Bain et al., 2014), and Peyer’s patches (Bonnardel et al., 2015). Monocyte infiltration in the intestine is dependent on microbiota as shown in antibiotics-treated and germ-free mice (Bain et al., 2014; Shaw et al., 2018). Because tonsils are mucosal-associated lymphoid organs, it would be plausible that exposure to oral microbiota induces continuous monocyte recruitment into the tonsils. We addressed this question using a model of non-human primates. We show that monocytes are absent from the tonsils of naïve macaques, uninfected but exposed to normal microbiota. These results argue against the constitutive recruitment of monocytes by low-grade mucosa-associated inflammation and suggest that our findings would also apply to non-mucosal lymphoid organs.
In conclusion, we propose a model whereby monocytes are recruited into lymphoid organs in an “on demand” fashion upon initiation of an immune response and adapt to cues from the micro-environment to generate a specialized population of short-lived macrophages supporting humoral responses.
Material and methods
Human samples
Palatin tonsils from healthy pediatric patients undergoing tonsillectomy for obstructive sleep apnea were obtained in accordance with hospital ethical guidelines from Assistance Publique–Hôpitaux de Paris: Hôpital Necker Enfants Malades (Pr. Françoise Denoyelle, Service ORL et chirurgie cervico-faciale) or Hôpital Robert-Debré (Pr. Natacha Teissier, Service d’ORL de l’Hôpital Robert-Debré). Only non-inflamed tonsils, as determined by macroscopic examination by anatomo-pathologists, were included in the study. Whole tonsils were collected in saline buffer and processed within 4 h of surgery. Buffy coats from healthy donors (both male and female donors) were obtained from Etablissement Français du Sang (Paris) in accordance with Institut National de la Santé et de la Recherche Médicale ethical guidelines. Blood was processed within 6 h of collection. According to French Public Health Law (art L 1121-1-1, art L 1121-1-2), written consent and IRB approval are not required for human non-interventional studies.
Non-human primate samples
Adult cynomolgus macaques (Macaca fascicularis), aged 36 mo and originating from Mauritian Association for Assessment and Accreditation of Laboratory Animal Care–certified breeding centers, were used in this study. All macaques were housed in the Department of Infectious Disease Models and Innovative Therapies (IDMIT) infrastructure facilities (Commissariat à l'énergie atomique et aux énergies alternatives, Fontenay-aux-Roses), under BSL-2 and BSL-3 containment when necessary (animal facility authorization D92-032-02, Prefecture des Hauts de Seine, France) and in compliance with European Directive 2010/63/EU, the French regulations and the Standards for Human Care and Use of Laboratory Animals of the Office for Laboratory Animal Welfare (assurance number A5826-01). The protocols were approved by the institutional ethical committee “Comité d’Ethique en Expérimentation Animale du Commissariat à l’Energie Atomique et aux Energies Alternatives” (CEtEA 44) under statement number A19_031. The study was authorized by the Research, Innovation and Education Ministry under registration number APAFIS#21359-2019070510474423 v1.
Macaque infection
Cynomolgus macaques were infected on day 0 with a total dose of 7 × 10⁶ PFU of H3N2 influenza virus (A/Texas/50/2012) by intranasal, pharyngeal, and intratracheal routes simultaneously using atropine (0.04 mg/kg) for pre-medication and sedated with ketamine (1,000, 10 mg/kg; IMALGENE) associated with medetomidine (0.03 mg/kg). At the end of the intervention, macaques received atipamezole (0.2 mg/kg). Euthanasia was performed by anesthetic overdosage of dolethal containing pentobarbital at 180 mg/kg by intravenous route into saphenous vein.
Flow cytometry
Cells were stained in FACS buffer: PBS containing 0.5% human AB serum and 2 mM EDTA. Unspecific staining was prevented using TruStain blocking solution (BioLegend). Unless otherwise indicated, DAPI (100 ng/ml; Thermo Fisher Scientific) was added immediately prior to acquisition. For intracellular flow cytometry, cells were first stained for surface markers, then washed and stained with Live/dead eFluor450 (Thermo Fisher Scientific) for 10 min at 4°C. Cells were fixed and permeabilized (Intracellular Fixation & Permeabilization Buffer Set, eBioscience) and stained for intracellular molecules at room temperature for 60 min in a buffer containing 2% of normal mouse serum and 10 µg/ml human Fc block (BD). Samples were acquired on a ZE5 Cell Analyzer (Bio-Rad). Data were analyzed with FlowJo (FlowJo LLC).
Tonsil antigen-presenting cell isolation
Tonsil samples were digested as described previously (Durand and Segura, 2016). In brief, macrophages were selected by density gradient, enriched by negative selection by depleting cells expressing CD19, CD3, CD235a, CD56, or CD15, and isolated by cell sorting on a FACS Aria instrument (BD Biosciences) after staining in FACS buffer. Antibodies used for sorting human tonsil samples were PE-Cy7-anti CD11c (clone Bu15, BioLegend), FITC-anti HLA-DR (clone REA805, Miltenyi Biotec), AlexaFluor700-anti CD14 (clone 61D3, eBioscience), PercP-Cy5.5-anti CD1c (clone L161, BioLegend), APC-Vio770-anti CD141 (clone AD5-14H12, Miltenyi Biotec), PE-anti CD36 (clone 5-271, BioLegend), BV510- anti CD81 (clone JS-81, BD Biosciences), and AlexaFluor647-anti CD206 (clone 15-2, BioLegend). For macaque tonsil samples, antibodies used for cell sorting were APC-anti CD3 (clone SP34-2, BioLegend), FITC-anti HLA-DR (clone REA805, Miltenyi Biotec), APC-anti CD8 (clone RPA-T8, BioLegend), APC-anti CD20 (clone L27, BioLegend), and APC-anti CD123 (clone 7G3, BioLegend).
Tonsil stromal cell subsets isolation and characterization
Tonsil samples were disrupted with a scalpel into small pieces that were incubated during 20 min at 37°C in dissociation buffer containing alphaMEM supplemented with 10 U/ml DNase (Roche), 200 U/ml Collagenase IV (Worthington), 1.6 U/ml Dispase (Worthington), and 5 mM MgCl2. Mechanical dissociation was achieved using a GentleMACS Dissociator (Miltenyi Biotec). A second round of 40-min dissociation at 37°C was performed in fresh dissociation buffer under 350 rpm agitation. The cell suspension was then filtered on a 100-μm cell strainer (Fisherbrand). Red blood cells were lysed using EasyLyse solution (Dako). Leukocytes were depleted using EasySep Human CD45 Depletion Kit II (Stemcell) following the manufacturer’s protocol. For culture experiments, the final CD45− fraction was used as total stromal cells. For flow cytometry, LSC were stained with antibodies APC-anti CD45 (clone HI30; BioLegend), BV605-anti CD31 (clone WM59; BioLegend), PercP-Cy5.5-anti Gp38 (clone NC-08; BioLegend), PE-Cy7-anti CD49a (cloneTS2/7; BioLegend), and PE-anti CD35 (clone E11; BioLegend).
Generation of monocyte-derived macrophages
Peripheral blood mononuclear cells were prepared by centrifugation on a Ficoll gradient (Lymphoprep, StemCell). Blood CD14+ monocytes were isolated from healthy donors’ peripheral blood mononuclear cells by positive selection using magnetic beads (Miltenyi). Monocytes (2 × 10⁶ cells/ml) were cultured for 5 d in RPMI-Glutamax medium (GIBCO) supplemented with antibiotics (penicillin and streptomicin) and 10% FCS in the presence of 100 ng/ml M-CSF (Miltenyi). Where indicated, monocyte-derived macrophages were stimulated with 20 ng/ml TNF-α (Miltenyi Biotec) or 20 ng/ml IL1-β (AbCys SA).
Tonsil antigen-presenting cells characterization
After enrichment for antigen-presenting cells, tonsil cell suspensions were stained with antibodies AlexaFluor700-anti CD11c (clone Bu15; BioLegend), BUV805-anti HLA-DR (clone REA805; Miltenyi Biotec), PercP-Cy5.5-anti CD14 (clone 61D3; eBioscience), BV785-anti CD1c (clone L161; BioLegend), APC-Vio770-anti CD141 (clone AD5-14H12; Miltenyi Biotec), APC-anti CD36 (clone 5-271; BioLegend), BUV395-anti CD81 (clone JS-81; BD Biosciences), BV605-anti CD86 (clone FUN-1; BD Biosciences), BV711-anti CD40 (clone 5C3; BD Biosciences) BV510-anti CD163 (clone GHI/61; BioLegend), PE-Dazzle594-anti CX3CR1 (clone 2A9-1; BD Biosciences), BV711-anti MERTK (clone 590H11G1E3; BioLegend), PE-Cy7-anti LILRB2 (clone 42D1; BioLegend), BV421-anti CD115 (CSF1R; clone 9-4D2-1E4; BioLegend), PE-anti OX40L (clone ANC10G1; Ancell), and PE-anti IRF1 (clone 20/IRF-1; BD Biosciences). Ratio of mean fluorescence intensity (MFI) was calculated to quantify the level of expression as follows: Ratio MFI = MFI sample/MFI isotype.
Tonsil antigen-presenting cell intracellular staining
After enrichment for antigen-presenting cells, tonsil cell suspensions were stained with Live/dead Blue Dye (Thermo Fisher Scientific) and 10 μg/ml human of Fc block (BD Biosciences) for 10 min on ice. Cells were washed with FACS buffer before staining for surface PE-Cy7-anti CD11c (clone Bu15; BioLegend), APC eFluor 780-anti HLA-DR (clone LN3; eBiosciences), AlexaFluor700-anti CD14 (clone M5E2; BioLegend), PercP-Cy5.5-anti CD1c (clone L161; BioLegend), PercP-Cy5.5-anti CD141 (clone M80; BioLegend), APC-anti CD36 (clone 5-271; BioLegend), and BUV395-anti CD81 (clone JS-81; BD Biosciences) for 30 min at 4°C. Cells were fixed and permeabilized with Foxp3 Fixation & Permeabilization Buffer Set (eBioscience), and stained for intracellular C1Q and S100A8/9 proteins at room temperature for 60 min in a PBS containing 2% of normal mouse serum (Sigma-Aldrich) and 10 μg/ml human Fc block (BD Biosciences). Antibodies used were PE-anti S100A8/9 (clone MAC387, Bio-Rad) FITC-anti C1Q (Agilent). Cells were washed before acquisition.
Cell cycle analysis
After enrichment for antigen-presenting cells, tonsil cell suspensions were stained with Live/dead Blue Dye (Thermo Fisher Scientific) and 10 μg/ml human Fc block (BD Biosciences) for 10 min on ice. Cells were washed before fixation and permeabilization using Foxp3 Fixation & Permeabilization Buffer Set (eBioscience) and stained with AlexaFluor700-anti Ki-67 (clone B56, BD Biosciences). After 60 min of incubation at room temperature, cells were washed before acquisition.
Stromal cell intracellular staining
After enrichment for stromal cells, tonsil cell suspensions were resuspended in alphaMEM supplemented with BrefeldinA (5 μg/ml; Sigma-Aldrich) for 4 h. After washing, cells were stained with Live/dead Blue Dye (Thermo Fisher Scientific) and 10 μg/ml human of Fc block (BD Biosciences) for 10 min on ice. Cells were washed with FACS buffer before staining for surface AlexaFluor700-anti CD45 (clone HI30; BioLegend), BV605-anti CD31 (clone WM59; BioLegend), PercP-Cy5.5-anti Gp38 (clone NC-08; BioLegend), PE-Cy7-anti CD49a (cloneTS2/7; BioLegend), and PE-anti CD35 (clone E11; BioLegend) for 30 min at 4°C. Cells were fixed and permeabilized with Foxp3 Fixation & Permeabilization Buffer Set (eBioscience), and stained for intracellular cytokines at room temperature for 60 min in a PBS containing 2% of normal mouse serum (Sigma-Aldrich) and 10 μg/ml human Fc block (BD Biosciences). Antibodies used were APC-anti CSF1 (clone 26786; R&D Systems) and APC-Cy7-anti TNF-α (clone Mab11; BioLegend). Cells were washed before acquisition.
Co-culture of antigen-presenting cells and Tfh cells
Tonsil samples were processed as described previously (Alaoui et al., 2022). In brief, three quarters of tonsils were digested for isolation of antigen-presenting cells as described above. One quarter of tonsils was mechanically disrupted with a scalpel into small pieces and then dissociated into single cells by forcing through a 40-μm cell strainer. Single cell suspensions were then enriched for light density cells by a Ficoll gradient centrifugation (Lymphoprep). Tonsil CD4+ T cells were enriched using CD4+ T cell isolation kit (Miltenyi Biotec). Germinal center Tfh cells were sorted on a FACS Aria instrument (BD Biosciences) using antibodies against APC-anti CD4 (clone RPA-T4; BioLegend), PE-Cy7-anti CD19 (clone HIB19; eBioscience), AlexaFluor488-anti CD45RO (clone UCHL1; BD Biosciences), AlexaFluor700-anti CD45RA (clone 5H9; BD Biosciences), PercP-Cy5.5-anti CXCR5 (clone RF8B2; BD Biosciences), and BV711-anti PD-1 (clone EH12.2H7; BD Biosciences). Purified Tfh cells (50,000 cells) from each donor were cultured for 24 h alone or with purified antigen-presenting cells (20,000 cells) from the same donor, in Yssel medium supplemented with 10% FCS. CXCL13 and lymphotoxin-α secretion in the culture supernatant was assessed by ELISA (R&D Bio-techne).
Co-culture of tonsil stromal cells and macrophages
Monocyte-derived macrophages were cultured with tonsil LSC at a ratio of 1:1 for 24 h in RPMI-Glutamax (Gibco) supplemented with 10% FCS. For the neutralization of TNF-α, cells were cultured in the presence of 20 μg/ml anti-TNF-α neutralizing antibody (R&D Biotechne) or mouse IgG1 isotype control (R&D Biotechne).
Cytokine secretion by antigen-presenting cells
Cells were cultured for 24 h in Yssel medium alone or with recombinant human TNF-α (20 ng/ml; Miltenyi Biotec). Supernatants were collected, and cytokine secretion was assessed by Cytometric Bead Array for IL-10 (BD Biosciences) or ELISA for Activin A (R&D Bio-techne).
Morphological analysis
Cells were placed on slides using a cytospin centrifuge and were stained with May-Grünwald (Sigma-Aldrich) and Giemsa (Merck) solutions. Pictures were acquired using a Leica DM 4000 B microscope with a ProgRes SpeedXTcore 5 camera.
Multispectral immunofluorescence on paraffin-embedded tissues
Formalin-fixed paraffin-embedded tonsil blocks were cut into 5 μm sections. Immunostaining was processed in a Bond RX automated (Leica) with Opal 7-Color IHC Kits (NEL821001KT; Akoya Biosciences) according to the manufacturer’s instructions using the antibodies anti-Clic6 (PA5-64209, dilution 1/300; Invitrogen), anti-CD20 (DAKO, M075501, 1/1,500), anti-THBS1 (14-9756-80, 1/200; Invitrogen), anti-CD68 (M0814, 1/1,000; DAKO), anti Ki67 (M7240, 1/1,500; DAKO), and anti-CD35 (ab126737, 1/500; Abcam). Tissue sections were cover-slipped with Prolong Diamond Antifade Mountant (Thermo Fisher Scientific) and stored at 4°C. Slides were scanned using the Vectra 3 automated quantitative pathology imaging system (Vectra 3.0.7; Akoya Biosciences). Multispectral images were unmixed using the inForm Advanced Image Analysis Software (inForm 2.6.0; Akoya Biosciences) and analyzed with the HALO software (HALO 3.3; IndicaLabs).
Imaging mass cytometry
Tonsil tissue sections were pre-treated with heat using a target retrieval solution for 30 min at 95°C (K8000, EnVision flex target retrieval solution, pH 9; Agilent Technologies). Slides were cooled down for 20 min at room temperature before rinsing with water and PBS, and then incubated for 45 min with SuperBlock blocking buffer (Thermo Fisher Scientific). Tissue sections were then incubated overnight with the antibody cocktail in PBS BSA 0.4% in a humidified chamber. The next day, slides were rinsed with PBS Triton X-100 0.2% (Thermo Fisher Scientific) then with PBS alone, before incubating with Iridium DNA intercalator for 30 min (Standard BioTools). Regions of interest were acquired on a Hyperion Imaging Mass Cytometer (Standard BioTools) according to the manufacturer’s instructions. Tissues were ablated at 200 Hz. The following antibodies were used: anti-CD19 142Nd (clone 6OMP31; Standard BioTools), anti-CD163 147Sm (clone EDHu-1; Standard BioTools), anti-CD68 (clone KP1; BioLegend), anti-Ki-67 168Er (clone B56; Standard BioTools), anti-S100A9 (clone EPR3555; Abcam), anti-CD36 (clone EPR22509-40; Abcam), anti-HLA-DR 174Yb (Standard BioTools), and anti-CD3 (clone UCHT1; BioLegend). Purified antibodies were conjugated to lanthanide metals using the MaxPar antibody conjugation kit (Standard BioTools) according to the manufacturer’s recommendations.
For analysis, MCD files were converted to ome.tiff format with MCDViewer (Standard BioTools). Cell segmentation was performed using QuPath with Stardist extension v0.3.0. Deep learning Stardist model was trained with TissueNet data. Macrophages were identified using the cell detection command in QuPath based on expression of CD68. CSV files were exported to OMIQ software (Dotmatics) for further analysis. Unsupervised analysis on phenotype and location was performed with FlowSom (Van Gassen et al., 2015).
scRNA-seq library preparation
Cellular suspension (3,000 cells) was loaded on a 10X Chromium instrument (10X Genomics) according to manufacturer’s protocol. scRNA-seq libraries were prepared using Chromium Single Cell 3′ v3.1 Reagent Kit (10X Genomics) according to the manufacturer’s protocol. Library quantification and quality assessment were performed using Qubit fluorometric assay (Invitrogen) with dsDNA High Sensitivity Assay Kit and Bioanalyzer Agilent 2100 using a High Sensitivity DNA chip (Agilent Genomics). Indexed libraries were equimolarly pooled and sequenced on an Illumina NovaSeq 6000 using paired-end 26 × 91 bp as sequencing mode.
scRNA-seq data analysis
For analysis of human tonsil CD14+ cells (n = 1), we reanalyzed our published dataset (GSE119506). Single-cell expression was analyzed using the Cell Ranger Single Cell Software Suite (v6.0) to perform quality control, sample de-multiplexing, barcode processing, and single-cell 3′ gene counting. For macaque samples (n = 1 per condition), sequencing reads were aligned to the UCSC M. fascicularis (v1.0) transcriptome using the Cell Ranger suite with default parameters. Further analysis was performed in R (v4.1.0) using the Seurat package (v4.0.3). The gene-cell-barcode matrix of the samples was log-transformed and filtered based on the number of genes detected per cell (any cell with <200 genes or >2,500 genes per cell was filtered out). Regression in gene expression was performed based on the number of unique molecular identifiers and the percentage of mitochondrial genes. Only genes detected in at least three cells were included. Cells were then scaled to a total of 1e4 molecules. Any cell with >5% of mitochondrial unique molecular identifier counts was filtered out. PCA was run on the normalized gene-barcode matrix. The first 15 principal components were used for the UMAP projection and clustering analysis using the Elbow Plot approach. Clusters were identified using the FindClusters function in Seurat with a resolution parameter of 0.4 for the human macrophage dataset. Unique cluster-specific genes were identified by running the Seurat FindAllMarkers function. Differentially expressed genes were identified based on adjusted P value < 0.05 and Log2 FoldChange > 0.25. The number of differentially expressed genes was 568 for C1QC+ macrophages, 145 for S100A9+ macrophages, and 136 for intermediate macrophages. Enrichment for gene signatures was computed with the AddModuleScore function. For the macaque tonsils dataset, each sample was first analyzed separately. Clusters showing expression of either FLT3, CSF1R, or CD68 were selected for further analysis and integrated for the three samples using the Integration function of Seurat. Clusters containing cells other than mononuclear phagocytes were removed from the analysis. These clusters were plasmacytoid DCs (top genes SLC23A1, DERL3, JCHAIN), B cells (top genes PAX5, MS4A1, CD79B or RGS13, SYNE2, AICDA), EC (top genes CPE, ACKR1, CLEC14A), and stromal cells (top genes COL1A1, COL1A2, MFAP4 or KRT19, S100P, KRT4). In the integrated dataset, clusters were identified with a resolution parameter of 1.6. For label transfer analysis, aligned and integrated macaque scRNA-seq data were subsetted to retain monocytes and macrophages clusters. Then, we used a reference-mapping approach to annotate cell labels of the macaque dataset (query) by projecting each query cell onto the previously computed UMAP visualization of the human tonsil dataset using the MapQuery function of Seurat v4. For RNA velocity analysis, the three macrophage clusters and the monocyte cluster were subsetted and re-projected in UMAP, maintaining the original annotations. Annotations of unspliced/spliced reads were obtained using velocyto CLI with default parameters. Next, unspliced counts were merged with the preprocessed, normalized, integrated, annotated, and subset spliced count matrix (Seurat), and RNA velocity analysis was performed using the scVelo (v0.2.4) workflow (Bergen et al., 2020). Connectivity graph was used to visualize all velocity-inferred cell-to-cell connections/transitions using a threshold of 0.9. Heatmaps and plots were plotted using Seurat. Data from macaque tonsils are available at GEO (GSE207261).
RNA-seq library preparation
Macrophage subsets were isolated from six individual donors. Total RNA was extracted using the Total RNA purification kit (Norgen) according to the manufacturer’s protocol. cDNA was generated using the SMART-Seq v4 kit (Takara) according to the manufacturer’s protocol. The integrity of the DNA was confirmed in BioAnalyzer using High Sensitivity DNA kit (Agilent Technologies; 7 < RIN). Libraries were prepared according to Illumina’s instructions accompanying the Nextera XT DNA Library Prep Kit (Illumina). 10 ng of DNA was used for each sample. Sequencing was performed in one sequencing unit of NovaSeq 6000 (Illumina; 100-nt-length reads, paired end).
RNA-seq data analysis
Genome assembly was based on the Genome Reference Consortium (hg38). Quality of RNA-seq data was assessed using FastQC. Reads were aligned to the transcriptome using Salmon (Patro et al., 2017). Differential gene expression analysis was performed using DESeq2 (v1.22.2; Love et al., 2014). Genes with low number of counts (<10) were filtered out. Differentially expressed genes between populations were calculated using the design “donor + group.” Differentially expressed genes were identified based on adjusted P value < 0.01 and Log2 FoldChange > 0.5. Heatmaps of log2-scaled expression were generated with ComplexHeatmap. Pathway enrichment was analyzed using EnrichR (Kuleshov et al., 2016). Potential ligand–receptor interactions between tonsil macrophages and stromal cells were computed using NicheNetR (Browaeys et al., 2020) using RNA-seq data from tonsil stromal cells generated previously (GSE148656; Mourcin et al., 2021). Transcription factor activity was calculated using DoRothea regulons and VIPER (Garcia-Alonso et al., 2019). Data from human tonsil macrophages are available at GEO (GSE207260).
Visualization of ATAC-seq peaks
ATAC-seq data (big wig files) were retrieved from GEO (GSE147314; Song et al., 2021). Specific data sets used were GSM4425562 (WT THP1-derived macrophages, unstimulated), GSM4425563 (WT THP1-derived macrophages, stimulated with LPS for 1 h), GSM4425566 (IRF1 KO THP1-derived macrophages, unstimulated), and GSM4425567 (IRF1 KO THP1-derived macrophages, stimulated with LPS for 1 h). Gene tracks were visualized using pyGenomeTracks (Lopez-Delisle et al., 2021).
GSEA
GSEA (Subramanian et al., 2005) was performed using the GSEA software (version 4.0.3) with the default parameters, except for the number of permutations that we fixed at n = 1,000. Gene signatures were obtained from published studies for human blood CD14+ monocytes (Goudot et al., 2017), human yolk sac macrophages, and yolk sac progenitors (Bian et al., 2020) and cell cycle (1640170; Reactome; Gillespie et al., 2022). For analysis of human lymph nodes, the count matrix was downloaded from GEO (GSE157671; Casanova et al., 2020) and normalized using DESeq2.
shRNA interference
shRNA (all from Sigma-Aldrich) against IRF1 (NM_002198-TRCN0000014669) or nontargeting control shRNA (MISSION shRNA SHC002) were in the LKO.1-puro vector (MISSION, Sigma-Aldrich). Viral particles were produced by transfection of 293FT cells in 6-well plates with 3 mg DNA and 8 μl TransIT-293 (Mirus Bio) per well: for VSV-G pseudotyped SIVmac VLPs, 0.4 mg CMV-VSVG and 2.6 mg pSIV3+; for shRNA vectors, 0.4 mg CMV-VSV-G, 1 mg psPAX2, and 1.6 mg LKO1puro-derived shRNA vector. 1 d after 293FT cell transfection, medium was replaced by fresh culture medium. Viral supernatants were harvested 1 d later and filtered through 0.45 μm filters. Freshly isolated CD14+ monocytes were infected with viral particles containing the control vector or individual shRNA vectors and cultured as above. Puromycin (InvivoGen) was added 2 d later (2 mg/ml). At day 5, cells were harvested for analysis.
Immunoblot
Cells were lysed in radioimmunoprecipitation assay buffer (Thermo Fisher Scientific) supplemented with complete Mini EDTA-free protease inhibitor cocktail (Roche), at 1 × 10⁶ cells in 100 μl of lysis buffer. Post-nuclear lysates were resolved by SDS-PAGE using 4–15% BisTris NuPAGE gels (Invitrogen), and proteins were transferred to membranes (Immunoblot PVDF membranes, Bio-Rad). Membranes were stained with primary antibodies against IRF1 (Cell Signaling, clone D5E4) or actin (Millipore, clone C4), followed by HRP-conjugated secondary antibodies (Jackson ImmunoResearch).
Statistical analysis
Statistical tests were performed using Prism v9 (GraphPad Software). Paired t test was applied to compare two groups, and one-way ANOVA with Tukey’s multiple comparisons test was performed when comparing more than two groups. Statistical details for each experiment can be found in the corresponding figure legend. N corresponds to the number of individual donors analyzed.
Data availability
Acknowledgments
The authors wish to thank C. Hérate and members of the “Sciences de l’animal et bien-être animal” team at IDMIT (Fontenay-aux-Roses, France) for technical assistance with the macaque experiments, V. Enouf (Institut Pasteur, Paris, France) for providing the H3N2 influenza virus strain, N. Bonnefoy and Y. Glasson (Institut de Recherche en Cancérologie de Montpellier) for providing access to Hyperion, the Next Generation Sequencing platform, the Flow Cytometry Core, and the Experimental Pathology platform of Institut Curie.
This work was funded by Institut National de la Santé et de la Recherche Médicale, Institut Curie (CIC IGR-Curie 1428), the Agence Nationale de la Recherche (ANR-10-LABX-0043, ANR-10-IDEX-0001-02 PSL), Institut National du Cancer (2018-1-PL BIO-01-1), and Fondation ARC pour la Recherche sur le Cancer (PJA 20171206249) and TRANSVAC2 H2020 (grant #730964). Department of IDMIT (Fontenay-aux-Roses, France) infrastructure is supported by fundings of the “Programme Investissements d’Avenir” managed by the ANR under reference ANR-11-INBS-0008. J. Villar is a fellow of the IC-3i PhD program supported by the ERC Horizon 2020-Marie Sklodowska-Curie Actions (grant #666003) and a fellow of the Fondation pour la Recherche Médicale (FDT202106013025).
Author contributions: Investigation: L. Alaoui, J. Villar, F. Relouzat, and H.-A. Michaud. Conceptualization: L. Alaoui, M. Roussel, K. Tarte, and E. Segura. Methodology and formal analysis: L. Alaoui, J. Villar, R. Leclere, S.L. Gallou, M. Roussel, and E. Segura. Provision of essential material: F. Relouzat, N. Teissier, K. Tarte, and B. Favier. Supervision: B. Favier, M. Roussel, and E. Segura. Writing—original draft: L. Alaoui and E. Segura. Writing—review and editing: all authors.

