


During affinity maturation, germinal center (GC) B cells alternate between proliferation and somatic hypermutation in the dark zone (DZ) and affinity-dependent selection in the light zone (LZ). This anatomical segregation imposes that the vigorous proliferation that allows clonal expansion of positively selected GC B cells takes place ostensibly in the absence of the signals that triggered selection in the LZ, as if by “inertia.” We find that such inertial cycles specifically require the cell cycle regulator cyclin D3. Cyclin D3 dose-dependently controls the extent to which B cells proliferate in the DZ and is essential for effective clonal expansion of GC B cells in response to strong T follicular helper (Tfh) cell help. Introduction into the Ccnd3 gene of a Burkitt lymphoma–associated gain-of-function mutation (T283A) leads to larger GCs with increased DZ proliferation and, in older mice, clonal B cell lymphoproliferation, suggesting that the DZ inertial cell cycle program can be coopted by B cells undergoing malignant transformation.

Introduction
Germinal centers (GCs) are the sites of affinity maturation, the process by which antibodies improve their affinity for antigen over time (Cyster and Allen, 2019; De Silva and Klein, 2015; Eisen, 2014; Mesin et al., 2016; Rajewsky, 1996; Shlomchik et al., 2019; Victora and Nussenzweig, 2012). For efficient affinity maturation, GC B cells must cycle between two major transcriptional states, associated with localization of B cells to each of the two microanatomical “zones” of the GC. When in the dark zone (DZ), B cells proliferate vigorously and mutate their immunoglobulin genes by somatic hypermutation (SHM). After transition to the light zone (LZ), B cells bearing advantageous mutations are selectively driven to clonally expand, based at least in part on their ability to bind and present antigen to GC-resident T follicular helper (Tfh) cells (Victora et al., 2010). Successive cycles of SHM and affinity-based selection ultimately enrich for higher-affinity cells among the GC B cell population in a process known as cyclic reentry (MacLennan, 1994; Victora and Nussenzweig, 2012).
A unique consequence of the anatomical compartmentalization of the GC is that mitogenic signals are segregated from the proliferation they induce. Upon positive selection, B cells typically transition from G1 to S phase of the cell cycle in the LZ, migrate from LZ to DZ while in S phase, and undergo G2 and M phases in the DZ (Gitlin et al., 2014; Victora et al., 2010). After this first division, cell cycling continues in the DZ, with most B cells undergoing on average two additional cell cycles before returning to the LZ for further selection (Gitlin et al., 2014). GC B cells that receive stronger signals from Tfh cells in the LZ, however, can undergo a much greater number of proliferative cycles in the DZ, resulting in exponential clonal expansion (Gitlin et al., 2014; Meyer-Hermann et al., 2012; Victora et al., 2010). At its extreme, this regulated expansion can lead to “clonal bursts,” in which a single B cell can take over a 2,000-cell GC in the course of a few days (Tas et al., 2016). These bursts are associated with massive diversification of generally higher-affinity SHM variants and as such are likely to play an important role in the generation of high-affinity B cell clones (Amitai et al., 2017; Bannard and Cyster, 2017; Mesin et al., 2016).
Despite the importance of DZ proliferation for GC B cell selection and affinity maturation, our understanding of GC B cell selection has historically focused on events that take place in the LZ (Mesin et al., 2016; Shlomchik et al., 2019). Consequently, the precise mechanisms that allow DZ proliferation to take place in the apparent absence of direct mitogenic signals are still incompletely understood. For instance, upon interaction with Tfh cells, positively selected LZ B cells express the transcription factor c-Myc (Calado et al., 2012; Dominguez-Sola et al., 2012; Finkin et al., 2019), as well as the mechanistic target of rapamycin (mTOR)–mediated anabolic program (Ersching et al., 2017). While both c-Myc and mTOR are required for LZ B cells to migrate to the DZ and enter the proliferative phase, the induction of these pathways appear to be mostly restricted to the LZ (Dominguez-Sola et al., 2012; Ersching et al., 2017; Finkin et al., 2019). This suggests that DZ B cells retain a memory of the intensity of the c-Myc and mTOR complex 1 (mTORC1)–dependent “charge” they received previously in the LZ and that they subsequently translate this memory into the number of cell cycles they will undergo in the DZ using a cell-intrinsic “timer” or “counter” (Bannard et al., 2013; Gitlin et al., 2014). The molecular pathways that directly control the number of cycles a GC B cell undergoes in the DZ remain uncharacterized.
Here, we used a combination of unbiased whole-transcriptome single-cell mRNA sequencing (scRNA-seq) analysis and targeted genetic and pharmacological manipulation of cell cycle regulators to investigate the molecular nature of DZ cell cycles. We find that DZ B cells adopt a distinct E2Fhigh/c-Myclow mode of cell cycling that allows rapid and continuous proliferation in the absence of external mitogenic signals. We show that the cell cycle regulator cyclin D3, previously shown to be required for GC formation and maintenance (Cato et al., 2011; Peled et al., 2010), is a specific, dose-dependent controller of this phenotype and DZ cell cycling and that loss of cyclin D3 cannot be overcome by LZ cycling induced by strongly increased Tfh cell help. Introduction into mice of a gain-of-function mutation in cyclin D3 derived from human Burkitt lymphoma (Schmitz et al., 2012, 2014) leads to exacerbated B cell proliferation specifically in the GC DZ and development of clonal post-GC B cell expansions, linking the inertial proliferative program to malignant transformation.
Results
B cell proliferation in the DZ is Tfh cell independent
To better understand GC B cell cycling in the DZ, we first sought to formally determine whether S phase entry by DZ B cells requires acute signals from Tfh cells in addition to those delivered in the LZ. To this end, we used a synchronized selection model (Ersching et al., 2017; Victora et al., 2010) to allow kinetically precise blocking of Tfh cell help to GC B cells at set time points after induced positive selection (Fig. 1 A). In this model, we use adoptive transfer of 4-hydroxy-3-nitro-phenylacetyl (NP)–specific B1-8hi B cells followed by immunization with NP conjugated to chicken OVA (NP-OVA) to create GCs in which the majority of B cells lack the surface receptor DEC-205 (encoded by the gene Ly75). Treatment of mice with ongoing GCs with an antibody to DEC-205 fused to OVA (DEC-OVA) leads to presentation of OVA peptides by Ly75+/+ GC B cells only. This induces Ly75+/+ cells to preferentially interact with Tfh cells, triggering their positive selection (Pasqual et al., 2015; Victora et al., 2010). In this process, GC B cells also become synchronized: 12 h after DEC-OVA, most Ly75+/+ cells are located in the LZ, where they interact extensively with Tfh cells (Ersching et al., 2017; Shulman et al., 2014). By 36 h after DEC-OVA, most Ly75+/+ cells have transitioned to the DZ, where they begin their proliferative burst (Victora et al., 2010). Fig. 1, A–C; and Fig. S1 provide an overview of key time points in this kinetics. Entry into S phase of the cell cycle, revealed by double-pulsing mice with 5-ethynyl-2-deoxyuridine (EdU) and BrdU nucleotides (Gitlin et al., 2014), was greatly increased in DZ B cells at 36 h after DEC-OVA, indicating that, at this time point, GC B cells progress through the G1-S checkpoint while in the DZ compartment (Fig. 1, B and C; and Fig. S1, E and F). DZ S phase entry persisted above the steady-state level until at least 60 h after DEC-OVA treatment, when Ly75+/+ cells remained predominantly in the DZ and continued to expand (Fig. 1, B and C; and Fig. S1, B–D).

Cell cycle entry by DZ B cells does not require Tfh cell help. (A) Experimental setup for DEC-OVA–induced Ly75+/+ GC B cells followed by double labeling with EdU/BrdU to assay for S phase entry. (B) S phase entry of Ly75+/+ and Ly75−/− B1-8hi cells in the DZ, quantified in C. (D) Experimental setup for DEC-OVA–induced positive selection of Ly75+/+ GC B cells followed by inhibition of T-B interaction using anti-MHC class II or anti-CD40L before (early) or after (late) DZ reentry. (E and F) Effect on GC size (left) and expansion of Ly75+/+ cells over Ly75−/− (center, right) upon anti-MHC class II treatment (E) or anti-CD40L treatment (F). (G and H) S phase entry of Ly75+/+ B1-8hi cells in the DZ upon late treatment with anti-MHC class II (G) or anti-CD40L (H). *, P < 0.05; **, P < 0.01; ***, P < 0.001; n.s., nonsignificant, a paired t test comparison between Ly75+/+ and Ly75−/− cells in the same animal (C) or nonparametric Mann–Whitney test compared with the group treated with an isotype control (E–H). Bars indicate median. Each circle represents a mouse. Data are pooled from two (B and C), three (E and G), or two (F and H) independent experiments. Iso, isotope.
Cell cycle entry by DZ B cells does not require Tfh cell help. (A) Experimental setup for DEC-OVA–induced Ly75+/+ GC B cells followed by double labeling with EdU/BrdU to assay for S phase entry. (B) S phase entry of Ly75+/+ and Ly75−/− B1-8hi cells in the DZ, quantified in C. (D) Experimental setup for DEC-OVA–induced positive selection of Ly75+/+ GC B cells followed by inhibition of T-B interaction using anti-MHC class II or anti-CD40L before (early) or after (late) DZ reentry. (E and F) Effect on GC size (left) and expansion of Ly75+/+ cells over Ly75−/− (center, right) upon anti-MHC class II treatment (E) or anti-CD40L treatment (F). (G and H) S phase entry of Ly75+/+ B1-8hi cells in the DZ upon late treatment with anti-MHC class II (G) or anti-CD40L (H). *, P < 0.05; **, P < 0.01; ***, P < 0.001; n.s., nonsignificant, a paired t test comparison between Ly75+/+ and Ly75−/− cells in the same animal (C) or nonparametric Mann–Whitney test compared with the group treated with an isotype control (E–H). Bars indicate median. Each circle represents a mouse. Data are pooled from two (B and C), three (E and G), or two (F and H) independent experiments. Iso, isotope.

Synchronization and enrichment of Ly75+/+ cells with DEC-OVA immunization (related to Fig. 1 ). (A) Experimental setup for DEC-OVA–induced positive selection of Ly75+/+ GC B cells followed by double labeling with EdU/BrdU to assay for S phase entry. (B) Expansion of Ly75+/+ cells over Ly75−/− over the time course. (C and D) DZ and LZ staining of Ly75+/+ and Ly75−/−cells over the time course (C), quantified in D. (E and F) S phase entry of Ly75+/+ and Ly75−/− B1-8hi cells in the LZ (E), quantified in F. **, P < 0.01; ***, P < 0.001; n.s., not significant; paired t test comparison between Ly75+/+ and Ly75−/− cells in the same animal. Bars indicate median. Each circle represents a mouse. Data are pooled from two independent experiments. Untr., untreated.
Synchronization and enrichment of Ly75+/+ cells with DEC-OVA immunization (related to Fig. 1 ). (A) Experimental setup for DEC-OVA–induced positive selection of Ly75+/+ GC B cells followed by double labeling with EdU/BrdU to assay for S phase entry. (B) Expansion of Ly75+/+ cells over Ly75−/− over the time course. (C and D) DZ and LZ staining of Ly75+/+ and Ly75−/−cells over the time course (C), quantified in D. (E and F) S phase entry of Ly75+/+ and Ly75−/− B1-8hi cells in the LZ (E), quantified in F. **, P < 0.01; ***, P < 0.001; n.s., not significant; paired t test comparison between Ly75+/+ and Ly75−/− cells in the same animal. Bars indicate median. Each circle represents a mouse. Data are pooled from two independent experiments. Untr., untreated.
To determine whether T cell help is continually required for DZ proliferation, we acutely blocked Tfh cell–B cell interaction either at the time of the initial Tfh signal delivery in the LZ (6 h after DEC-OVA) or following the transition of positively selected B cells to the DZ but before the proliferative burst (30 h after DEC-OVA; Fig. 1 D). As expected from the role of Tfh cell–mediated signaling in this model (Victora et al., 2010), early blocking of T cell–B cell interactions in the LZ using antibodies to MHC class II or CD40 ligand (CD40L) effectively prevented clonal expansion of Ly75+/+ cells by 48 h after DEC-OVA treatment (Fig. 1, E and F). By contrast, blocking either pathway after B cells transitioned to the DZ had little, if any, effect on the expansion of Ly75+/+ cells over Ly75−/− cells (Fig. 1, E and F) or the ability of Ly75+/+ DZ B cells to enter S phase, as evidenced by EdU/BrdU incorporation (Fig. 1, G and H). We conclude that sustained proliferation of B cells in the GC DZ upon positive selection does not require continuous help from Tfh cells. We therefore refer to DZ cell cycles as “inertial,” since they proceed in a cell-intrinsic fashion according to the strength of the initial “push” from Tfh cells, in contrast to the “primary” cell cycles that B cells undergo immediately downstream of selective signals in the LZ.
Inertial cycling is sustained by prolonged E2F activation following a decay in c-Myc activity
To identify the transcriptional programs associated with inertial cycling, we performed scRNA-seq on GC B cells at different time points after forcing positive selection using DEC-OVA. We index-sorted single Ly75+/+ B cells using antibodies to LZ/DZ markers, and sorted cells were sequenced using the Smart-Seq2 protocol (Trombetta et al., 2014). We assayed GC B cells first at 12 h after DEC-OVA, when Ly75+/+ B cells are enriched in the LZ in the process of receiving cognate help from Tfh cells, and then at 30, 46, and 60 h after DEC-OVA, as DZ B cells transition from signal-dependent proliferation to predominantly inertial modes of cycling before returning to the LZ between 72 and 96 h after DEC-OVA (Fig. 1, A–D; and Fig. S1; Victora et al., 2010). For comparison, we also included a sample of Ly75−/− counterselected LZ cells from the 12-h time point (Table S1).
The 1,220 cells that passed our quality control thresholds fell into seven major clusters (Fig. 2 A). These were determined in large part by cell cycle phase as inferred from their transcriptional profile (Tirosh et al., 2016), with a lesser contribution of their LZ/DZ phenotype as defined by surface staining (Fig. 2 B). Clusters 0 and 4 contained primarily G1 cells; clusters 2, 3, and 6 were enriched in S phase cells; and clusters 1 and 5 were enriched in cells in the G2 and M phases (Fig. 2 C). To follow the evolution of positively selected B cells across these clusters as they transitioned from reactive to inertial cell cycles and then to quiescence, we compared Ly75+/+ and Ly75−/− cells in the LZ at 12 h after DEC-OVA to Ly75+/+ cells in the DZ at the 30-, 46-, and 60-h time points. This revealed a marked increase in representation of cells in cluster 2, as Ly75+/+ cells are positively selected in the LZ at 12 h (empty arrowheads in Fig. 2 D). Enrichment in cluster 2 continued as cells transitioned to the DZ at 30 h, after which the dominant S phase phenotype shifted to cluster 6 at 46 h and then cluster 3 at 60 h after DEC-OVA (filled arrowheads in Fig. 2 D). Pairwise comparisons of the three S phase clusters by gene set enrichment analysis (GSEA) using the “hallmark” signatures from the MSigDB database (Mootha et al., 2003; Subramanian et al., 2005) revealed expression of E2F and c-Myc target genes as the most consistent differences between the three clusters (Fig. S2 A). Cluster 2, enriched in LZ-phenotype cells from the 12- and 30-h time points, showed high expression of Myc and of c-Myc– and mTORC1-dependent transcriptional signatures (Fig. 2 E and Fig. S2 B; Peng et al., 2002; Schuhmacher et al., 2001). Given the strong association between these signatures and positive selection (Calado et al., 2012; Dominguez-Sola et al., 2012; Ersching et al., 2017; Finkin et al., 2019; Luo et al., 2018; Victora et al., 2010), this pattern suggests that cluster 2 consists primarily of recently selected B cells undergoing primary S phase, either on their way to or soon after DZ reentry. Cells in clusters 3 and 6, on the other hand, showed reduced levels of Myc and c-Myc– and mTORC1-dependent gene signatures while maintaining expression of E2F target genes (Fig. 2 E and Fig. S2 B), as expected if they were entering the cell cycle by inertia while being physically segregated from mitogenic signals located in the LZ. Kinetic analysis of Myc and c-Myc and E2F target gene signatures confirmed that E2F target gene expression levels remained unaltered between 30 and 46 h after DEC-OVA, while mRNA expression and activity of Myc decreased (Fig. 2, F and G; and Fig. S2 C). E2F signatures began to subside only at the 60-h time point, as inertial cycling defined by DZ S phase entry (Fig. 1, B and C) is already subsiding. Thus, unlike their LZ counterparts, DZ B cells appear to engage in a distinct mode of cell cycling that does not require continued expression of the Myc gene or its protein function to maintain E2F activity. This suggests that regulators of E2F that are downstream of c-Myc and other selection-dependent signals may be required to sustain proliferation after positively selected GC B cells transition to the DZ.
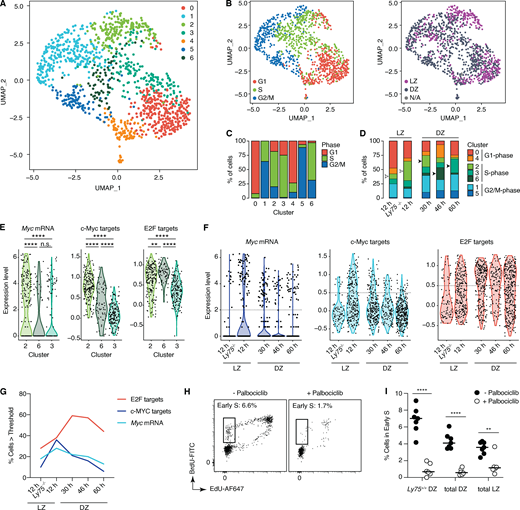
Single-cell transcriptomic analysis of GC B cells undergoing positive selection.(A) Uniform manifold approximation and projection (UMAP) plot displaying 1,220 cells colored by shared nearest neighbor clusters collected (default Wilcox test; see Materials and methods). Cells were collected from four independent experiments (see Table S1). (B) Distribution of cell cycle phase (left) and LZ/DZ phenotypes (right). (C) Distribution of cell cycle phase in clusters. (D) Changes in distribution of clusters grouped by cell cycle phase over the DEC-OVA–induced selection time course. (E and F) Expression of Myc mRNA, c-Myc, and E2F target gene signatures in clusters 2, 3, and 6 (E) or DEC-OVA time points with indicated zonal phenotypes (F). Dotted line indicates the threshold used for quantification in G. See Fig. S2 C for a complete list of P values. (H) S phase entry of Ly75+/+ B1-8hi cells in the DZ 12 h after treatment with palbociclib, a CDK4/6 inhibitor, or vehicle (PBS). (I) Quantification includes all LZ and DZ B1-8hi cells, in addition to positively selected Ly75+/+ B1-8hi cells in the DZ. **, P < 0.01; ****, P < 0.0001, nonparametric Mann–Whitney test, compared with the PBS-treated control group. Bars indicate median. Each circle represents a mouse (H and I) or a cell (all other figures). Data are pooled from two independent experiments (H and I).
Single-cell transcriptomic analysis of GC B cells undergoing positive selection.(A) Uniform manifold approximation and projection (UMAP) plot displaying 1,220 cells colored by shared nearest neighbor clusters collected (default Wilcox test; see Materials and methods). Cells were collected from four independent experiments (see Table S1). (B) Distribution of cell cycle phase (left) and LZ/DZ phenotypes (right). (C) Distribution of cell cycle phase in clusters. (D) Changes in distribution of clusters grouped by cell cycle phase over the DEC-OVA–induced selection time course. (E and F) Expression of Myc mRNA, c-Myc, and E2F target gene signatures in clusters 2, 3, and 6 (E) or DEC-OVA time points with indicated zonal phenotypes (F). Dotted line indicates the threshold used for quantification in G. See Fig. S2 C for a complete list of P values. (H) S phase entry of Ly75+/+ B1-8hi cells in the DZ 12 h after treatment with palbociclib, a CDK4/6 inhibitor, or vehicle (PBS). (I) Quantification includes all LZ and DZ B1-8hi cells, in addition to positively selected Ly75+/+ B1-8hi cells in the DZ. **, P < 0.01; ****, P < 0.0001, nonparametric Mann–Whitney test, compared with the PBS-treated control group. Bars indicate median. Each circle represents a mouse (H and I) or a cell (all other figures). Data are pooled from two independent experiments (H and I).

GSEA between the S phase clusters (related to Fig. 2 ). (A) Top 10 most significantly varied “hallmark” signatures from the MSigDB database using GSEA to compare clusters 2, 3, and 6 (C2, C3, and C6). Pathways that are common among three sets of comparisons are indicated in bold. (B) Expression of mTORC1 signature in clusters 2, 3, and 6 (left) or in DEC-OVA time points with indicated zonal phenotypes (right). (C) Summary of P values using Mann–Whitney U test. ***, P < 0.001; n.s., not significant; Padj, adjusted P value.
GSEA between the S phase clusters (related to Fig. 2 ). (A) Top 10 most significantly varied “hallmark” signatures from the MSigDB database using GSEA to compare clusters 2, 3, and 6 (C2, C3, and C6). Pathways that are common among three sets of comparisons are indicated in bold. (B) Expression of mTORC1 signature in clusters 2, 3, and 6 (left) or in DEC-OVA time points with indicated zonal phenotypes (right). (C) Summary of P values using Mann–Whitney U test. ***, P < 0.001; n.s., not significant; Padj, adjusted P value.
A major regulator of E2F activity are the D-type cyclins, which in partnership with cyclin-dependent kinases (CDKs) 4 and 6, activate E2F by phosphorylation of its negative regulator RB (Musgrove et al., 2011). To test whether D-type cyclins could be responsible for allowing the progression of inertial cell cycles, we treated mice with the inhibitor of CDK4/6 palbociclib 36 h after inducing positive selection of GC B cells with DEC-OVA and analyzed cell cycle progression 12 h later. Unlike blockade of MHC class II or CD40L (Fig. 1, D–H), palbociclib treatment strongly inhibited S phase entry in all GC B cells, including those undergoing inertial cycling in the DZ (Fig. 2, H and I). Thus, inertial S phase entry, while not dependent on Tfh-mediated signals, still requires activity of CDK4/6.
Ccnd3, but not Ccnd2, is required for DZ inertial cycling
Since B cells express exclusively cyclins D2 and D3 (encoded by Ccnd2 and Ccnd3, respectively) upon mitogenic stimulation (Reid and Snow, 1996; Solvason et al., 1996), we sought to determine the relative contribution of these two cyclins to the CDK4/6 dependency of inertial cycles. Ccnd2 mRNA was detectable primarily in the subset of cells undergoing S phase in the LZ in the c-Mychigh cluster 2 (Fig. S3 A). In agreement with our previous reports, Ccnd2 was higher in Ly75+/+ cells at 12 h after DEC-OVA as well as in the LZ in general (Dominguez-Sola et al., 2012; Victora et al., 2010; Fig. S3, B and C). To investigate the function of cyclin D2 in GC B cells, we generated Ccnd2 knockout mice using CRISPR-Cas9–mediated genome editing in zygotes to introduce a 4-bp deletion/frameshift in exon 1 of the gene (Fig. S3 D). Ccnd2−/− mice lacked peritoneal B-1a cells (Fig. S3, E and F), and females were unable to produce progeny (data not shown), as shown previously using an independently generated knockout strain (Sicinski et al., 1996; Solvason et al., 2000), confirming that ours is a null allele. We adoptively transferred a 1:1 mixture of Ccnd2+/+ and Ccnd2−/− B1-8hi cells into WT hosts, which we then immunized with NP-OVA to generate GCs (Fig. S3 G), and found that zonal distribution was preserved in Ccnd2−/− B1-8hi B cells (Fig. S3, H and I). However, rather than reducing the ability of GC B cells to cycle, loss of cyclin D2 led to a small but consistent increase in the proportion of B1-8hi cells entering S phase in both the LZ and DZ (Fig. S3, J–L). Despite this increase, absence of cyclin D2 showed no clear effect on the competitiveness of GC B cells over time when compared with Ccnd2-sufficient B cells within the same GC (Fig. S3, M and N). These experiments suggest that although cyclin D2 can affect the ability of GC B cells to enter cell cycle, it is not required for inertial cycling in the DZ.

Cyclin D2 is dispensable for inertial B cell cycling (related to Fig. 3 ). (A–C) Expression of Ccnd2 in UMAP dimension (A), over time after DEC-OVA immunization (B), and in LZ or DZ (C). P values in B are from a Kruskal–Wallis test with Dunn’s multiple comparisons test. Other significant P values are <0.001 (12 × 60 h), 0.0013 (12 vs. 30 h), and 0.037 (Ly75−/− vs. 12 h). (D) CRISPR/Cas9-mediated gene targeting strategy to introduce a 4-bp deletion and premature stop codon in Ccnd2. (E and F) Staining for B1 (left) and B1-a (right) cells isolated from peritoneal cavities of WT (Ccnd2+/+) or cyclin D2–deficient (Ccnd2−/−; E) mice, quantified in F. (G) Experimental setup for induction of GCs containing WT (Ccnd2+/+) or cyclin D2 mutant (Ccnd2−/−) B1-8hi cells. (H–L) DZ and LZ staining (H) and S phase entry (J) in WT (Ccnd2+/+) or cyclin D2–deficient (Ccnd2−/−) B1-8hi GC cells 12 d after NP-OVA immunization, quantified in I, K, and L. (M) Experimental setup for induction of GCs containing mixtures of WT (Ccnd2+/+) or cyclin D2 mutant (Ccnd2−/−) B1-8hi cells. (N) Clonal expansion of WT (Ccnd2+/+) or cyclin D2 mutant (Ccnd2−/−) B1-8hi cells over time, relative to day 7 (represented by a dotted line). *, P < 0.05; **, P < 0.01; n.s., nonsignificant, nonparametric Mann–Whitney test, compared with WT (Ccnd2+/+; G, I, and J) or day 7 (L). Bars indicate median. Each circle represents a mouse. Data are pooled from two independent experiments. Padj, adjusted P value.
Cyclin D2 is dispensable for inertial B cell cycling (related to Fig. 3 ). (A–C) Expression of Ccnd2 in UMAP dimension (A), over time after DEC-OVA immunization (B), and in LZ or DZ (C). P values in B are from a Kruskal–Wallis test with Dunn’s multiple comparisons test. Other significant P values are <0.001 (12 × 60 h), 0.0013 (12 vs. 30 h), and 0.037 (Ly75−/− vs. 12 h). (D) CRISPR/Cas9-mediated gene targeting strategy to introduce a 4-bp deletion and premature stop codon in Ccnd2. (E and F) Staining for B1 (left) and B1-a (right) cells isolated from peritoneal cavities of WT (Ccnd2+/+) or cyclin D2–deficient (Ccnd2−/−; E) mice, quantified in F. (G) Experimental setup for induction of GCs containing WT (Ccnd2+/+) or cyclin D2 mutant (Ccnd2−/−) B1-8hi cells. (H–L) DZ and LZ staining (H) and S phase entry (J) in WT (Ccnd2+/+) or cyclin D2–deficient (Ccnd2−/−) B1-8hi GC cells 12 d after NP-OVA immunization, quantified in I, K, and L. (M) Experimental setup for induction of GCs containing mixtures of WT (Ccnd2+/+) or cyclin D2 mutant (Ccnd2−/−) B1-8hi cells. (N) Clonal expansion of WT (Ccnd2+/+) or cyclin D2 mutant (Ccnd2−/−) B1-8hi cells over time, relative to day 7 (represented by a dotted line). *, P < 0.05; **, P < 0.01; n.s., nonsignificant, nonparametric Mann–Whitney test, compared with WT (Ccnd2+/+; G, I, and J) or day 7 (L). Bars indicate median. Each circle represents a mouse. Data are pooled from two independent experiments. Padj, adjusted P value.
In contrast to the dynamic behavior of Ccnd2, our scRNA-seq dataset showed that Ccnd3 mRNA amounts were stably high throughout the LZ/DZ cycle and over our time course of DEC-OVA–induced selection, with only slight increases at the 30-h time point and in the DZ in general (Fig. 3, A–C). Despite these modest changes in mRNA expression, cyclin D3 protein levels were substantially higher in the DZ (Fig. 3 D), in agreement with previous reports based on histology (Peled et al., 2010). Also consistent with prior reports (Cato et al., 2011; Peled et al., 2010), we found that loss of Ccnd3 led to dramatically reduced GC B cell frequency (Fig. 3, E and F). This is unlikely to be due to a general defect in proliferation, given that Ccnd3−/− B cells proliferate normally in vitro and at pre-GC stages in vivo (Cato et al., 2011; Peled et al., 2010). Closer examination of Ccnd3−/− GCs showed that decreased GC size was primarily caused by a marked reduction in the proportion of B cells with a DZ phenotype (Fig. 3, G and H), suggesting a strong block in the ability of Ccnd3−/− B cells to undergo inertial cycling. This phenotype was identical when GCs were generated by adoptive transfer of Ccnd3−/− B1-8hi cells into WT hosts (Fig. 3 I), resulting in a significantly decreased DZ/LZ ratio (Fig. 3, J and K) and an almost complete loss in S phase initiation in the DZ with only a minor decrease of fitness in the LZ (Fig. 3, J and L–N). The requirement for cyclin D3 is therefore GC B cell intrinsic and largely restricted to the DZ. Ccnd3−/− B1-8hi cells in the DZ also showed increased forward scatter, a surrogate measure of cell size (Fig. 3, O and P). Since cell size increases before the initiation of inertial cycles (Ersching et al., 2017; Finkin et al., 2019), this finding suggests that the inability of Ccnd3−/− B cells to undergo inertial cycling results in their failure to lose cellular mass by division. We conclude that cyclin D3 is cell-intrinsically required for GC B cells to enter S phase specifically in the DZ while being dispensable for S phase entry immediately downstream of T cell–mediated selection in the LZ. This pattern implicates cyclin D3 as a nonredundant mediator of inertial cell cycles.

Inertial B cell cycling requires cyclin D3. (A–C) Expression of Ccnd3 in UMAP dimension (A), over time after DEC-OVA immunization (B), and in LZ or DZ (C). P values in B are from a Kruskal–Wallis test with Dunn’s multiple comparisons test. Other significant P values are <0.001 (12 × 60 h), 0.013 (Ly75−/− vs. 30 h), and 0.015 (Ly75−/− vs. 60 h). (D) Immunoblots of whole-cell lysates of LZ or DZ cells sorted from popliteal or mesenteric LNs (pLN or mLN, respectively). Molecular weight is indicated in kilodaltons. (E–H) Staining for GC (E) and DZ/LZ (G) in WT (Ccnd3+/+) or cyclin D3 mutant (Ccnd3−/−) mice that were immunized s.c. in the hind footpad for pLNs, quantified in F. (I) Experimental setup for induction of GCs containing WT (Ccnd3+/+) or cyclin D3 mutant (Ccnd3−/−) B1-8hi cells. (J–P) DZ and LZ staining of all GC B cells (black) or cells entering S phase (red; J), S phase entry (L), forward scatter (O) of WT (Ccnd3+/+), or cyclin D3 mutant (Ccnd3−/−) B1-8hi cells, quantified in K, M, N, and P. **, P < 0.01; ***, P < 0.001; ****, P < 0.0001; nonparametric Mann–Whitney test. Bars indicate median. Each circle represents a cell (B and C) or a mouse (all other figures). Data are pooled from three (E–H) or two (I–P) independent experiments. Padj, adjusted P value; post-imm, post-immunization.
Inertial B cell cycling requires cyclin D3. (A–C) Expression of Ccnd3 in UMAP dimension (A), over time after DEC-OVA immunization (B), and in LZ or DZ (C). P values in B are from a Kruskal–Wallis test with Dunn’s multiple comparisons test. Other significant P values are <0.001 (12 × 60 h), 0.013 (Ly75−/− vs. 30 h), and 0.015 (Ly75−/− vs. 60 h). (D) Immunoblots of whole-cell lysates of LZ or DZ cells sorted from popliteal or mesenteric LNs (pLN or mLN, respectively). Molecular weight is indicated in kilodaltons. (E–H) Staining for GC (E) and DZ/LZ (G) in WT (Ccnd3+/+) or cyclin D3 mutant (Ccnd3−/−) mice that were immunized s.c. in the hind footpad for pLNs, quantified in F. (I) Experimental setup for induction of GCs containing WT (Ccnd3+/+) or cyclin D3 mutant (Ccnd3−/−) B1-8hi cells. (J–P) DZ and LZ staining of all GC B cells (black) or cells entering S phase (red; J), S phase entry (L), forward scatter (O) of WT (Ccnd3+/+), or cyclin D3 mutant (Ccnd3−/−) B1-8hi cells, quantified in K, M, N, and P. **, P < 0.01; ***, P < 0.001; ****, P < 0.0001; nonparametric Mann–Whitney test. Bars indicate median. Each circle represents a cell (B and C) or a mouse (all other figures). Data are pooled from three (E–H) or two (I–P) independent experiments. Padj, adjusted P value; post-imm, post-immunization.
Cyclin D3–mediated DZ inertial cycling links GC positive selection with clonal expansion
To determine the relative importance of LZ cycles vs. inertial DZ cycles for clonal expansion, we asked whether cell proliferation defects seen in Ccnd3−/− DZ B cells could be rescued by forcing strong interaction with Tfh cells using DEC-OVA (Fig. 4 A). Whereas Ccnd3+/+Ly75+/+ B1-8hi cells proliferated sufficiently to outnumber Ly75−/− cells by fivefold over a 60-h period, clonal expansion was much less efficient when Ly75+/+ B1-8hi cells lacked cyclin D3. With the exception of one outlier mouse, the ratio of Ly75+/+ to Ly75−/− cells increased only slightly, if at all, over input levels (Fig. 4, B and C). Failure of Ccnd3−/− B cells to clonally expand was also accompanied by failure to accumulate in the DZ (Fig. 4, D and E), although histology showed that Ccnd3−/− cells were able to at least access the DZ anatomically at 36 h after DEC-OVA (Fig. 4 F). Even so, the proportion of early S phase cells among the Ccnd3−/− population dropped precipitously upon transition from the LZ to DZ, as expected given the inability of cyclin D3–deficient B cells to sustain proliferation by inertia (Fig. 4, G–K). Thus, the residual expansion of Ccnd3−/−Ly75+/+ B1-8hi seen in some mice can be attributed primarily to cell cycling taking place in the LZ in response to continued signals delivered by Tfh cells. We conclude that strong signaling from Tfh cells in response to DEC-OVA cannot overcome the requirement for cyclin D3 in driving DZ proliferation and that in the absence of inertial cycling, LZ cell cycles triggered directly in reaction to Tfh cell–derived signals are not sufficient to sustain large proliferative bursts.

Increased Tfh cell help cannot compensate for loss of cyclin D3. (A) Experimental setup for DEC-OVA–induced positive selection of Ly75+/+ cells that are either WT (Ccnd3+/+) or cyclin D3 mutant (Ccnd3−/−). Note that due to of lack of competitiveness in early GC stages, Ccnd3−/− B1-8hi cells have to be transferred at a higher proportion than Ccnd3+/+ B1-8hi cells. (B–E) Clonal expansion (B) and DZ/LZ staining (D) of WT (Ccnd3+/+) or cyclin D3 mutant (Ccnd3−/−) Ly75+/+ cells over time after DEC-OVA immunization, quantified in C and E. (F) Immunofluorescence showing the migration of WT (Ccnd3+/+) or cyclin D3 mutant (Ccnd3−/−) Ly75+/+ cells 36 h after DEC-OVA immunization in pLN GCs. Dotted area indicates the DZ marked by the absence of IgD (Naive B cell marker) and CD35 (FDC marker). Percentage of Ly75+/+ cells within the DZ out of the entire GC is quantified. Scale bar = 100 μm. (G–K) S phase entry of positively selected Ly75+/+ B1-8hi cells that are either WT (Ccnd3+/+) or cyclin D3 mutant (Ccnd3−/−) in the LZ (G) or DZ (H), quantified in I–K. *, P < 0.05; **, P < 0.01; ***, P < 0.001; ****, P < 0.0001; ns, nonsignificant, nonparametric Mann–Whitney test, compared with WT (Ccnd3+/+). Bars indicate median. Each circle represents a mouse. Data pooled from four independent experiments.
Increased Tfh cell help cannot compensate for loss of cyclin D3. (A) Experimental setup for DEC-OVA–induced positive selection of Ly75+/+ cells that are either WT (Ccnd3+/+) or cyclin D3 mutant (Ccnd3−/−). Note that due to of lack of competitiveness in early GC stages, Ccnd3−/− B1-8hi cells have to be transferred at a higher proportion than Ccnd3+/+ B1-8hi cells. (B–E) Clonal expansion (B) and DZ/LZ staining (D) of WT (Ccnd3+/+) or cyclin D3 mutant (Ccnd3−/−) Ly75+/+ cells over time after DEC-OVA immunization, quantified in C and E. (F) Immunofluorescence showing the migration of WT (Ccnd3+/+) or cyclin D3 mutant (Ccnd3−/−) Ly75+/+ cells 36 h after DEC-OVA immunization in pLN GCs. Dotted area indicates the DZ marked by the absence of IgD (Naive B cell marker) and CD35 (FDC marker). Percentage of Ly75+/+ cells within the DZ out of the entire GC is quantified. Scale bar = 100 μm. (G–K) S phase entry of positively selected Ly75+/+ B1-8hi cells that are either WT (Ccnd3+/+) or cyclin D3 mutant (Ccnd3−/−) in the LZ (G) or DZ (H), quantified in I–K. *, P < 0.05; **, P < 0.01; ***, P < 0.001; ****, P < 0.0001; ns, nonsignificant, nonparametric Mann–Whitney test, compared with WT (Ccnd3+/+). Bars indicate median. Each circle represents a mouse. Data pooled from four independent experiments.
Cyclin D3 controls DZ inertial cycling in a dose-dependent manner
A potential mechanism for how the strength of the initial T cell–B cell interactions in the LZ determines the number of rounds of division that selected B cells undergo in the DZ (Gitlin et al., 2014) is that DZ B cells translate the memory of their interactions with Tfh cells into protein amounts of a cell cycle regulator. If cyclin D3 follows such a pattern, then it could be predicted that GC B cells with a higher capacity to produce cyclin D3 protein would be at a competitive advantage due to increased proliferation in the DZ. To test this, we directly competed B1-8hi B cells carrying either one or two intact alleles of Ccnd3 by adoptive transfer of a 1:1 mixture of Ccnd3+/− and Ccnd3+/+ B1-8hi B cells into the same recipient mice, which were then immunized with NP-OVA in alum and assayed for relative abundance of these two populations (Fig. 5 A). Whereas both Ccnd3+/+ and Ccnd3+/− B1-8hi cells were found at a similar ratio in early GCs at day 7 after immunization, the proportion of Ccnd3+/− B1-8hi cells decreased gradually over time, such that these cells were completely eliminated in three out of seven mice by day 14 after immunization (Fig. 5, B and C). Thus, the reduction in cyclin D3 dosage associated with heterozygosis is sufficient to impose a gradual but clear loss of this population from the GC. Lack of competitiveness of heterozygous B cells was associated with a slight reduction in the DZ/LZ ratio, which was already observable at day 7 after immunization (Fig. 5, D and E), and a decrease in the proportion of cells entering S phase in the DZ, but not in the LZ (Fig. 5, F–H). To extrapolate the loss of inertial proliferative capacity among Ccnd3+/− GC B cells from our direct competition data, we simulated this experiment in silico using a previously published agent-based model of GC selection that includes T cell control over the number of cell cycles carried a B cell undergoes upon positive selection (Meyer-Hermann, 2020,Preprint; Meyer-Hermann et al., 2012). We modeled loss of Ccnd3 expression as a reduction in the maximum number of divisions a Ccnd3+/− GC B cell can complete upon positive selection. We varied the relationship between the degree of T cell help (modeled as intensity of c-Myc activation) and the number of divisions as illustrated by the curves shown in Fig. 5 I. The experimentally measured kinetics of Ccnd3+/− GC B cells were best reproduced when the maximum number of divisions for Ccnd3+/− GC B cells in silico was reduced to 72% of WT, with a residual sum of squares (RSS) of 0.14 (Fig. 5 J). In silico, a reduction in responsiveness of this magnitude in Ccnd3+/− GC B cells was accompanied by a reduction in the number of cell cycles per cell to ∼84% of WT levels at day 8 after immunization, which is compatible with our EdU/BrdU incorporation data (Fig. 5 K). We conclude that cyclin D3 dose-dependently controls the number of inertial cycles a B cell will undergo in the DZ. The sensitivity of GC B cells to loss of even a single allele of Ccnd3 suggests that cyclin D3 protein abundance may serve as a molecular bridge linking the cumulative signal a B cell receives from T cells in the LZ and the number of cycles this cell can execute in the DZ.

Cyclin D3 controls inertial cell cycling in a dose-dependent manner. (A) Experimental setup for induction of GCs containing mixtures of B1-8hi cells with a full (Ccnd3+/+) or reduced (Ccnd3+/−) dose of cyclin D3. (B and C) Clonal expansion of B1-8hi cells with a full (Ccnd3+/+) or reduced (Ccnd3+/−) dose of cyclin D3 over time, quantified in C relative to day 7. (Dand E) DZ and LZ staining in GC B1-8hi cells 7 d after NP-OVA immunization, quantified in E. Dotted line indicates averaged DZ/LZ ratio of total GC B cells. (F–H) S phase entry of B1-8hi cells with a full (Ccnd3+/+) or reduced (Ccnd3+/−) dose of cyclin D3 in LZ or DZ 8 d after NP-OVA immunization, quantified in G and H. (I) Relationship between strength of T cell help (modeled as c-Myc signal intensity) and number of B cell divisions in the different models used to estimate loss of function in Ccnd3+/− GC B cells. The maximum number of divisions allowed to Ccnd3+/− cells corresponds to 50% (red) or 72% (blue), or 80% (green) of the maximum number of divisions of the WT. (J)Ccnd3+/− kinetics in silico. Loss of Ccnd3+/− cells as a fraction of the GC population over time in silico. The maximum number of divisions of Ccnd3+/− GC B cells was fixed to 50% (red line), 72% (blue line), or 80% (green line) of the WT value. Mean (solid lines) and SD (shaded area) over 60 GC simulations. Experimental mean ± SD is shown as white circles. (K)Ccnd3+/− divisions in silico. The mean number of divisions of Ccnd3+/− cells is shown as a percentage of WT at the indicated days. Reported data result from simulations with the maximum number of divisions of the Ccnd3+/− GC B cells fixed to 72% of the WT maximum number of divisions. Mean and SD over 60 GC simulations. White circle represents experimental data. *, P < 0.05; **, P < 0.01; n.s., not significant, paired t test. Bars indicate median (C). Each circle represents a mouse. Data are pooled from at two independent experiments.
Cyclin D3 controls inertial cell cycling in a dose-dependent manner. (A) Experimental setup for induction of GCs containing mixtures of B1-8hi cells with a full (Ccnd3+/+) or reduced (Ccnd3+/−) dose of cyclin D3. (B and C) Clonal expansion of B1-8hi cells with a full (Ccnd3+/+) or reduced (Ccnd3+/−) dose of cyclin D3 over time, quantified in C relative to day 7. (Dand E) DZ and LZ staining in GC B1-8hi cells 7 d after NP-OVA immunization, quantified in E. Dotted line indicates averaged DZ/LZ ratio of total GC B cells. (F–H) S phase entry of B1-8hi cells with a full (Ccnd3+/+) or reduced (Ccnd3+/−) dose of cyclin D3 in LZ or DZ 8 d after NP-OVA immunization, quantified in G and H. (I) Relationship between strength of T cell help (modeled as c-Myc signal intensity) and number of B cell divisions in the different models used to estimate loss of function in Ccnd3+/− GC B cells. The maximum number of divisions allowed to Ccnd3+/− cells corresponds to 50% (red) or 72% (blue), or 80% (green) of the maximum number of divisions of the WT. (J)Ccnd3+/− kinetics in silico. Loss of Ccnd3+/− cells as a fraction of the GC population over time in silico. The maximum number of divisions of Ccnd3+/− GC B cells was fixed to 50% (red line), 72% (blue line), or 80% (green line) of the WT value. Mean (solid lines) and SD (shaded area) over 60 GC simulations. Experimental mean ± SD is shown as white circles. (K)Ccnd3+/− divisions in silico. The mean number of divisions of Ccnd3+/− cells is shown as a percentage of WT at the indicated days. Reported data result from simulations with the maximum number of divisions of the Ccnd3+/− GC B cells fixed to 72% of the WT maximum number of divisions. Mean and SD over 60 GC simulations. White circle represents experimental data. *, P < 0.05; **, P < 0.01; n.s., not significant, paired t test. Bars indicate median (C). Each circle represents a mouse. Data are pooled from at two independent experiments.
A lymphoma-associated mutation that stabilizes cyclin D3 promotes DZ inertial cycling and drives clonal B cell lymphoproliferation
A parallel line of evidence pointing to the importance of cyclin D3 in GC proliferation is the presence of a series of Ccnd3 mutations that stabilize cyclin D3 protein in roughly 40% of cases of sporadic Burkitt lymphoma (Casanovas et al., 2004; Schmitz et al., 2012, 2014; Sonoki et al., 2001). Because Burkitt lymphoma cells closely resemble DZ B cells in gene expression (Caron et al., 2009; Victora and Mouquet, 2018), we hypothesized that stabilization of cyclin D3 by means of a lymphoma-associated mutation may increase the propensity of GC B cells to undergo inertial cycles in the DZ. To test this, we used CRISPR-Cas9–mediated genome editing to generate a Ccnd3 allele encoding a version of cyclin D3 protein that is stabilized by the replacement of a phosphorylatable threonine (T283A) in its C-terminal domain (Fig. 6 A). This mutation prevents phosphorylation of T283, which would otherwise promote nuclear export and proteasomal degradation of cyclin D3 (Casanovas et al., 2004; Cato et al., 2011). When introduced into the genome, the T283A mutation alone did not cause any overt anomaly in B cell development, with the possible exception of a slight increase in the percentage of pre/pro-B cells in the bone marrow (BM), nor did it lead to spontaneous GC formation in the spleens of young adult mice (Fig. S4, A and D). Nonetheless, we found that upon immunization with NP-OVA, Ccnd3T283A/+ mice generated GCs that were approximately twice as large as WT GCs and had a markedly higher DZ/LZ ratio, suggesting increased DZ proliferation (Fig. 6, B–E). Accordingly, flow cytometric measurement of EdU/BrdU incorporation showed a ∼50% increase in GC B cells entering S phase in the DZ but no increase in S phase entry in the LZ (Fig. 6, F–H). To confirm that the proliferative effect of cyclin D3 on the GC is B cell intrinsic, we generated mixed chimeras in which BM cells from either WT or Ccnd3T283A/+ mice were mixed with those from B cell–deficient JHT mice at a 20:80 ratio. Consistent with the analysis of Ccnd3T283A/+ mice, chimeras with Ccnd3T283A/+ B cells showed increased GC size, DZ expansion, and S phase entry in the DZ, but not in the LZ, upon immunization with NP-OVA in alum (Fig. 6, C, E, G, and H). This phenotype was recapitulated upon immunization with KLH, ruling out any potential effects on of the hypomorphic immunoglobulin λ light chain of the SJL strain in which Ccnd3T283A mice were originally generated on the normally Igλ-dominated response to NP-OVA (Fig. S4, E–G). Moreover, Ccnd3T283A/+ DZ B cells showed a decrease in size as measured by forward scatter, mirroring the phenotype found in Ccnd3−/− B cells (Fig. 6, I and J). This indicates that the increased proliferation of Ccnd3T283A/+ B cells in the DZ extends to the extreme of what these cells are metabolically programmed to support (Ersching et al., 2017). Accordingly, adoptive transfer of a 1:1 mixture of Ccnd3+/+ and Ccnd3T283A/+ B1-8hi B cells into the same recipient mice followed by immunization with NP-OVA in alum showed that the representation of Ccnd3T283A/+ B1-8hi cells in GCs increased gradually but only slightly over time, suggesting that the proliferative capacity endowed by the Ccnd3T283A mutation remains limited by metabolic capacity (Fig. 6, K–M). Together, these data indicate that T283A mutation in cyclin D3 specifically promotes inertial DZ cell cycle progression in a B cell–intrinsic manner, leading to increased competitiveness of mutant B cells in the GC.

A lymphoma-derived mutation in Ccnd3 exclusively promotes inertial cell cycle entry. (A) CRISPR/Cas9-mediated gene targeting strategy to introduce a single-nucleotide substitution resulting in a T283 to A mutation and a silent mutation to remove the protospacer adjacent motif (PAM) sequence to prevent Cas9 recutting. (B–H) Staining for GC (B), DZ/LZ (D), and S phase entry (F) of GC B cells in pLNs from WT (Ccnd3+/+) or Ccnd3T283A/+ mice, with quantification in C, E, G, and H. WT (Ccnd3+/+) or Ccnd3T283A/+ mice (left) or chimeras generated with BM cells isolated from WT (Ccnd3+/+) or Ccnd3T283A/+ and B cell-deficient JHT mice (right) at a 20:80 ratio. (I and J) Forward scatter of DZ B cells sorted from pLNs of WT (Ccnd3+/+) or Ccnd3T283A/+ mice (I), with quantification of median forward scatter of DZ B cells in J. (K) Experimental setup for induction of GCs containing mixtures of B1-8hi cells with a full (Ccnd3+/+) or increased (Ccnd3T283A/+) dose of cyclin D3. (L and M) Clonal expansion of B1-8hi cells with a full (Ccnd3+/+) or increased (Ccnd3T283A/+) dose of cyclin D3 over time (L), quantified in M relative to day 7. (N) UMAP plot colored by genotype (left) or cell cycle phase (right). (O) Distribution of cell cycle phase in each genotype. (P and Q) Quantification of c-Myc (P) or E2F (Q) target gene signatures in in each genotype. *, P < 0.05; **, P < 0.01; ***, P < 0.001; ****, P < 0.0001; n.s., nonsignificant, nonparametric Mann–Whitney test (C, E, G, H, J, P, and Q), or paired t test comparison between WT (Ccnd3+/+) or Ccnd3T283A/+ cells in the same animal (M). Bars indicate median. Each circle represents a cell (P and Q) or a mouse (all other figures). Data pooled from two (B–H), three (I and J), two (L–M), or one (N–Q) independent experiments.
A lymphoma-derived mutation in Ccnd3 exclusively promotes inertial cell cycle entry. (A) CRISPR/Cas9-mediated gene targeting strategy to introduce a single-nucleotide substitution resulting in a T283 to A mutation and a silent mutation to remove the protospacer adjacent motif (PAM) sequence to prevent Cas9 recutting. (B–H) Staining for GC (B), DZ/LZ (D), and S phase entry (F) of GC B cells in pLNs from WT (Ccnd3+/+) or Ccnd3T283A/+ mice, with quantification in C, E, G, and H. WT (Ccnd3+/+) or Ccnd3T283A/+ mice (left) or chimeras generated with BM cells isolated from WT (Ccnd3+/+) or Ccnd3T283A/+ and B cell-deficient JHT mice (right) at a 20:80 ratio. (I and J) Forward scatter of DZ B cells sorted from pLNs of WT (Ccnd3+/+) or Ccnd3T283A/+ mice (I), with quantification of median forward scatter of DZ B cells in J. (K) Experimental setup for induction of GCs containing mixtures of B1-8hi cells with a full (Ccnd3+/+) or increased (Ccnd3T283A/+) dose of cyclin D3. (L and M) Clonal expansion of B1-8hi cells with a full (Ccnd3+/+) or increased (Ccnd3T283A/+) dose of cyclin D3 over time (L), quantified in M relative to day 7. (N) UMAP plot colored by genotype (left) or cell cycle phase (right). (O) Distribution of cell cycle phase in each genotype. (P and Q) Quantification of c-Myc (P) or E2F (Q) target gene signatures in in each genotype. *, P < 0.05; **, P < 0.01; ***, P < 0.001; ****, P < 0.0001; n.s., nonsignificant, nonparametric Mann–Whitney test (C, E, G, H, J, P, and Q), or paired t test comparison between WT (Ccnd3+/+) or Ccnd3T283A/+ cells in the same animal (M). Bars indicate median. Each circle represents a cell (P and Q) or a mouse (all other figures). Data pooled from two (B–H), three (I and J), two (L–M), or one (N–Q) independent experiments.

Analysis of Ccnd3T283A/+ mice (related to Fig. 6 ). (A and B) Bone marrow (A) and splenic (B) B cells development in distribution WT (Ccnd3+/+) or Ccnd3T283A/+ mice (left) and quantification (right). FO, follicular; MZ, marginal zone. Bars indicate SD. (C and D) Staining (left) and quantification (right) of splenic B cells (C) and GC (D) in WT (Ccnd3+/+) or Ccnd3T283A/+ mice. Bars indicate median. SSC-A, side scatter area. For A–D, 6-wk-old mice (n = 4 for each genotype) were sacrificed. Ccnd3T283A/+ mice used are generation N8. (E–G) Staining (left) and quantification (right) for GC (E), DZ/LZ (F), and S phase entry (G) of GC B cells induced upon immunization with KLH in pLNs from WT (Ccnd3+/+) or Ccnd3T283A/+ mice. **, P < 0.01; n.s., nonsignificant, nonparametric Mann–Whitney test. Bars indicate median. Each circle represents a mouse. Data pooled from two independent experiments. Ccnd3T283A/+ mice used in this experiment are from generations N6 and N7.
Analysis of Ccnd3T283A/+ mice (related to Fig. 6 ). (A and B) Bone marrow (A) and splenic (B) B cells development in distribution WT (Ccnd3+/+) or Ccnd3T283A/+ mice (left) and quantification (right). FO, follicular; MZ, marginal zone. Bars indicate SD. (C and D) Staining (left) and quantification (right) of splenic B cells (C) and GC (D) in WT (Ccnd3+/+) or Ccnd3T283A/+ mice. Bars indicate median. SSC-A, side scatter area. For A–D, 6-wk-old mice (n = 4 for each genotype) were sacrificed. Ccnd3T283A/+ mice used are generation N8. (E–G) Staining (left) and quantification (right) for GC (E), DZ/LZ (F), and S phase entry (G) of GC B cells induced upon immunization with KLH in pLNs from WT (Ccnd3+/+) or Ccnd3T283A/+ mice. **, P < 0.01; n.s., nonsignificant, nonparametric Mann–Whitney test. Bars indicate median. Each circle represents a mouse. Data pooled from two independent experiments. Ccnd3T283A/+ mice used in this experiment are from generations N6 and N7.
To understand the effect of cyclin D3 dosage on GC B cell cycles at the transcriptional level, we performed scRNA-seq on individually sorted Ccnd3+/+, Ccnd3−/−, and Ccnd3T283A/+ GC B cells. Whereas these cells segregated primarily by cell cycle phase rather than genotype (Fig. 6 N), we found that an increase in cyclin D3 dosage resulted in a marked shift in the fraction of DZ B cells from G1 to S and G2/M phases (Fig. 6 O), suggesting that DZ B cells with high expression of cyclin D3 are poised to undergo inertial cycling and swiftly transit between S and M phases with only a brief or indiscernible G1 phase. Consistent with the inertial cell cycling phenotype revealed by DEC-OVA treatment, E2F target gene expression levels in single cells increased in a cyclin D3 dose-dependent manner in the DZ, despite comparable expression of c-Myc target genes across all genotypes (Fig. 6, P and Q). We conclude that whereas c-Myc can behave as a “charger” that prompts primary cycling in the LZ, sustained E2F target gene expression downstream of cyclin D3 dosage provides the mechanism enabling inertial cycling in the DZ.
The finding that a common lymphoma mutation (Schmitz et al., 2012) increases the ability of GC B cells to undergo inertial cell cycles suggests that lymphomas may specifically coopt the mitogen-independent proliferative program that characterizes the GC DZ to achieve sustained and rapid proliferation. To determine the long-term effects of the Ccnd3T283A mutation on B cell proliferation and lymphomagenesis, we aged cohorts of Ccnd3T283A/+ mice for up to ∼1.5 yr. The T283A mutation in cyclin D3 was not sufficient to cause overt morbidity or early mortality (Fig. 7 A). However, we found that B cells from Ccnd3T283A/+ mice, but not their WT littermate controls, developed a population of Fas+ CD38+ double-positive (DP) B cells whose frequency increased over time (Fig. 7, B and C). Sequencing of the Igh genes of DP B cells revealed that this population became largely monoclonal as its size increased (Fig. 7, D and E; and Data S2), implicating Ccnd3T283A as a driver of B cell lymphoproliferation and also suggesting that additional mutations are likely required to achieve this phenotype. In the two mice with the largest DP population, expanded clones were class switched, heavily mutated, and present within populations with a more typical GC phenotype (Fas+ CD38−), indicative of GC origin (Fig. 7, D and F). In the most extreme case, DP and GC B cells isolated from various tissue sources together comprised a phylogenetic tree that was both heavily expanded and highly branched, indicating continual proliferation and SHM (Fig. 7 F). In addition to the clonal DP lymphoproliferative phenotype, aged Ccnd3T283A mice displayed other key signs of hematopoietic malignancy that were not observed in any of their WT counterparts. These included expansion of abnormal lymphocyte populations, enlarged secondary lymphoid organs with disrupted morphology, and lymphocytic infiltration into nonlymphoid organs, such as the liver, lungs, and kidneys (Fig. S5). While the variable nature of the malignant phenotypes observed precluded us from carrying out a systematic characterization of these outgrowths, these data confirm the oncogenic potential of Ccnd3T283A in lymphoid cells. We conclude that the hyperactivation of cyclin D3 by the T283A mutation promotes the acquisition of a clonal lymphoproliferative phenotype by B cells and more generally favors malignant transformation of lymphocyte populations.

A lymphoma-derived mutation in Ccnd3 drives clonal B cell lymphoproliferation. (A) Survival curve of WT (Ccnd3+/+) or Ccnd3T283A/+ mice. (B and C) Staining for GC/DP in splenic B cells (B), quantified in C by the age of mice. Mice indicated by arrowheads/numbers were chosen for sequencing of the Igh genes. (D) Pie chart showing clonal distribution of DP cells from spleen and mesenteric LNs. Ccnd3T283A/+ #8 also includes DP cells from pancreatic and lumbar LNs. Each slice in inner rings represents one clone indicated by a distinct V(D)J rearrangement; outer rings are isotypes represented in each clone found in at least two cells. Numbers are (clones observed)/(cells sequenced). (E) Proportional relationship between percentage of DP cells among B220+ B cells and percentage of cells in the largest clone identified in each mouse. (F) Trees showing phylogenetic relationships between VH sequences of cells from selected clones and their unmutated VH ancestor (UA). Numbers inside cells indicate frequency of a particular sequence observed in combination with a GC/DP phenotype (top) or across various tissues (bottom) from the same mouse. Scale bar indicates five mutations.
A lymphoma-derived mutation in Ccnd3 drives clonal B cell lymphoproliferation. (A) Survival curve of WT (Ccnd3+/+) or Ccnd3T283A/+ mice. (B and C) Staining for GC/DP in splenic B cells (B), quantified in C by the age of mice. Mice indicated by arrowheads/numbers were chosen for sequencing of the Igh genes. (D) Pie chart showing clonal distribution of DP cells from spleen and mesenteric LNs. Ccnd3T283A/+ #8 also includes DP cells from pancreatic and lumbar LNs. Each slice in inner rings represents one clone indicated by a distinct V(D)J rearrangement; outer rings are isotypes represented in each clone found in at least two cells. Numbers are (clones observed)/(cells sequenced). (E) Proportional relationship between percentage of DP cells among B220+ B cells and percentage of cells in the largest clone identified in each mouse. (F) Trees showing phylogenetic relationships between VH sequences of cells from selected clones and their unmutated VH ancestor (UA). Numbers inside cells indicate frequency of a particular sequence observed in combination with a GC/DP phenotype (top) or across various tissues (bottom) from the same mouse. Scale bar indicates five mutations.

Analysis of Ccnd3T283A/+ mice (related to Fig. 7 ). (A) Spleens from WT (Ccnd3+/+) or Ccnd3T283A/+ animals (right) and quantification of spleen to body weight ratios (left). Bars indicate median. (B) B and T cell staining in WT (Ccnd3+/+) or Ccnd3T283A/+ mice revealed expansion of abnormal lymphocyte populations with diminished or no expression of TCRb/B220. (C) H&E and peanut agglutinin (PNA) staining of WT (Ccnd3+/+) or Ccnd3T283A/+ spleens revealed disrupted morphology. (D) H&E staining of nonlymphoid tissues from WT (Ccnd3+/+) or Ccnd3T283A/+ revealed lymphocytic infiltration.
Analysis of Ccnd3T283A/+ mice (related to Fig. 7 ). (A) Spleens from WT (Ccnd3+/+) or Ccnd3T283A/+ animals (right) and quantification of spleen to body weight ratios (left). Bars indicate median. (B) B and T cell staining in WT (Ccnd3+/+) or Ccnd3T283A/+ mice revealed expansion of abnormal lymphocyte populations with diminished or no expression of TCRb/B220. (C) H&E and peanut agglutinin (PNA) staining of WT (Ccnd3+/+) or Ccnd3T283A/+ spleens revealed disrupted morphology. (D) H&E staining of nonlymphoid tissues from WT (Ccnd3+/+) or Ccnd3T283A/+ revealed lymphocytic infiltration.
Discussion
A central question in GC biology is how antigen-dependent signals delivered to GC B cells lead to the rapid clonal expansion that characterizes positive selection of higher-affinity SHM variants. Within the framework of Tfh cell–driven B cell selection, this question can be translated into how Tfh cell help delivered in the LZ controls the number of cell cycles a B cell subsequently undergoes after transition to the DZ (Mesin et al., 2016). Because this number is proportional to the push a B cell receives from Tfh cells while in the LZ (Gitlin et al., 2014, 2015; Meyer-Hermann et al., 2012; Victora et al., 2010) and our antibody blocking experiments formally rule out that DZ-initiated cell cycles depend on continued presence of Tfh cell help, we refer to DZ cell cycles as inertial. According to such a model, GC B cells would alternate between primary cell cycles in which a single S phase entry occurs in the LZ in direct response to mitogenic signals delivered at least in part by Tfh cells and inertial cycles in which B cells reenter S phase in the DZ a number of times proportional to the Tfh cell help they received in the LZ but independently of continued Tfh cell help.
Our findings show that primary (LZ) and inertial (DZ) cell cycles differ with respect to their molecular requirements. A number of studies have pointed toward c-Myc as a critical regulator of the DZ proliferative burst (Calado et al., 2012; Dominguez-Sola et al., 2012; Ersching et al., 2017; Finkin et al., 2019). Previous work suggests that c-Myc partners with mTORC1 to fuel the cellular growth that precedes the proliferative burst and dose dependently controls burst magnitude (Ersching et al., 2017; Finkin et al., 2019). However, expression of Myc c-Myc itself is not a driver of the DZ cell cycle, since its expression is predominantly found in the LZ (Calado et al., 2012; Dominguez-Sola et al., 2012; Victora et al., 2010), suggesting that inertial cycles require additional molecular drivers. Our scRNA-seq experiments show that the expression of Myc and c-Myc–dependent genes in the DZ is enriched in cells in S phase at earlier time points after positive selection, whereas inertial cycling persists for longer, likely relying on signals that are still active during G2/M (Spencer et al., 2013). Previous studies have reported stabilized expression of E2F transcription factors during mitosis in association with shortening of G1 and faster S phase entry in the subsequent cell cycle (Clijsters et al., 2019; Sigl et al., 2009). Thus, we propose that these molecular signatures may characterize DZ B cells that are fated to undergo one or more subsequent rounds of cell cycling by inertia. On the other hand, DZ B with low levels of E2F would be expected to pause in G1 and migrate back to the LZ for another round of antigen-driven selection.
We find that B cell–intrinsic expression of cyclin D3 is specifically required for inertial DZ cycles, whereas it plays at best a partly redundant role in the cell cycles initiated in the LZ. Our experiments with a series of Ccnd3 alleles with varying degrees of mRNA and protein expression show that cyclin D3 controls the extent of DZ B cell proliferation and the size of the GC DZ in a dose-dependent manner, with fully deficient cells being almost completely unable to initiate S phase in the DZ and heterozygous B cells showing ∼70% of the proliferative ability of WT cells. This suggests an instructive role for cyclin D3 in controlling GC B cell burst size. A possible mechanism for this control is that the intensity of a B cell’s interaction with Tfh cells is converted to a proportionate amount of cyclin D3 protein by increased translation of mostly unchanging levels of Ccnd3 mRNA or by stabilization of cyclin D3 protein by preventing its degradation by the ubiquitin-proteasome system, potentially with an additional contribution of increased transcription of the Ccnd3 gene. Previous work has shown that cyclin D1 levels carry through mitosis to accelerate subsequent S phase entry (Min et al., 2020). Our data suggest that a similar mechanism, driven by cyclin D3, may be at play in DZ inertial cycles.
A clear indication of the importance of cyclin D3 to GC B cell proliferation, especially in the DZ, is the frequent presence of Ccnd3T283A or functionally equivalent mutations in Burkitt lymphoma (Schmitz et al., 2012, 2014), the most DZ-like of B cell malignancies (Caron et al., 2009; Victora et al., 2012). The strong selection for this mutation in Burkitt lymphoma suggests that these cells may take advantage of the GC inertial cycling program to amplify the number of divisions they can undergo in response to the Myc-Igh translocation that defines this malignancy. Whereas mice bearing the Ccnd3T283A mutation did not succumb to B cell lymphoma, they did develop large age-related expansions of B cell clones that spanned the typical GC (FAS+ CD38−) and an unusual FAS+ CD38+ DP phenotype, with isotype and somatic mutation patterns suggestive of GC origin. Similar DP B cells comprised four out of nine CD19+ lymphomas arising in mice with p53-deficient B cells upon Plasmodium falciparum infection (Robbiani et al., 2015). The finding that most cells in mice with large DP expansions derived from a single clone suggests that increased inertial proliferation downstream of the cyclin D3 T283A mutation may predispose B cells to acquire further somatic mutations or chromosomal rearrangements that lead to the lymphoproliferative phenotype, and may also more rapid proliferation downstream of the acquisition of secondary mutations. The oncogenic potential of this mutation is underscored by the development of various forms of hematopoietic abnormalities in Ccnd3T283A mice. Understanding the molecular drivers of inertial vs. signal-dependent cell cycling and how and why these are coopted by lymphoid malignancies may shed light on vulnerabilities that are specific to inertially cycling cells, providing an avenue that could be exploited therapeutically.
Finally, from the perspective of GC selection, the failure of Ccnd3−/− GC B cells to clonally expand even upon strong induction of selective signals by DEC-OVA suggests that inertial cell cycles are required for the “clonal busting” that leads to optimal expansion of higher-affinity B cell clones in physiological settings (Tas et al., 2016). GC B cells appear to balance clonal bursting with other, less exclusive forms of selection as a strategy to evolve high-affinity clones while maintaining some degree of clonal diversity (Amitai et al., 2017; Bannard and Cyster, 2017; Mesin et al., 2016; Tas et al., 2016). Control of inertial selection by cyclin D3 may play an important role in fine-tuning this balance.
Materials and methods
Mice
C57BL6/J and B6.SJL mice were purchased from Jackson Labs (strain numbers 000664, 002014, and 022486, respectively). PA-GFP (Victora et al., 2010), B1-8hi (Shih et al., 2002), Ly75−/− (Inaba et al., 1995), and Ccnd3−/− (Kozar et al., 2004) mice were bred and maintained in our laboratory. Some of the B1-8hiLy75−/− mice used in scRNA-seq analysis also carried a FUCCI-Green (fluorescent ubiquitination-based cell cycle indicator) allele (Sakaue-Sawano et al., 2008), which was not used in the analysis (see Table S1). Ccnd3T283A mice were generated in C57BL6 × SJL F1 zygotes and backcrossed onto a C57BL6 background throughout the duration of the study, and all experiments shown use backcross generations N1 to N8. Backcross generations used in this study is as follows: N8 for B1-8hi cell transfer (Fig. 6, K–M), N4 to N6 for early S phase entry (Fig. 6, B–G), N6 for scRNA-seq analysis (Fig. 6, N–Q), N1 for the longitudinal survival curve (Fig. 7 A), and N1 or N5 for clonal expansion and tumor formation analysis (Fig. 7, B–F; and Fig. S5). Mice were H2s/b for the longitudinal survival curve and H2b/b in all other experiments. Littermate mice were used as controls in all cases. For direct competition assays (Fig. 5 A, Fig. 6 K, and Fig. S3 M), we alternately labeled WT and mutant cells using a PA-GFP transgene or CD45.1/2 congenic markers in order to avoid any technical bias that could be introduced with a given transgene. All mice were housed in groups of two to five animals per cage in specific pathogen–free facilities at The Rockefeller University. All protocols were approved by The Rockefeller University Institutional Animal Care and Use Committee. 6–8-wk-old male and female mice were used in all experiments, except for adoptive transfers, when all recipient mice were males.
Cell transfers, immunizations, and treatments
Spleens were dissected from mice of the indicated genotype, mashed, and filtered through a 40-μm cell strainer, red blood cells were lysed with ACK buffer (Lonza), and resulting cell suspensions were filtered into PBS supplemented with 0.5% BSA and 2 mM EDTA (PBE). Naive B cells were isolated by negative selection with magnetic cell separation using anti-CD43 beads (Miltenyi), according to manufacturer’s manual. Prior to cell transfer, percentage of NP-binding B1-8hi cell were determined by staining a fraction of cells with 5 mg/ml NP(19)-PE (Biosearch Technologies) and analyzing by flow cytometry.
To induce GCs, where indicated, male C57BL/6 recipient mice were first primed i.p. with 50 mg OVA in alum (Thermo Fisher Scientific) at 2:1 vol/vol ratio in 100 µl total volume 2–4 wk before cell transfer. Isolated B1-8hi B cells were adoptively transferred at the indicated proportions as depicted in experimental setup of each figure. 1 d after adoptive cell transfer, mice were immunized with 10 µg NP(19)-OVA (NP-OVA; Biosearch Technologies) absorbed in alum or 25 µg NP-OVA for primary or boosting, respectively, by a s.c. injection into the hind footpad. Where indicated, 6 d after immunization with NP-OVA, 5 µg DEC-OVA, produced in our laboratory as previously described (Pasqual et al., 2015), in PBS was injected s.c. into the hind footpad. To block CD40L (Fig. 1), mice were injected i.v. with 200 μg of a CD40L blocking antibody (Clone MR-1; BioXCell) or 200 µg Armenian hamster IgG isotype control (BioXCell) at the indicated time points. To block MHC class II (Fig. 1), mice were injected i.v. with 200 µg of an MHC class II (I-A/I-E) blocking antibody (clone M5/115; BioXCell) or 200 µg of rat IgG2b isotype control (clone LTF-2; BioXCell) at the indicated time points.
Palbociclib (PD-0332991; SelleckChem) was diluted at 6 mg/ml in PBS, and 270 µl was injected i.p., for a total dose of 1.6 mg or 80 mg/kg.
Flow cytometry and cell sorting
Cell suspensions were resuspended in PBE and incubated on ice for 30 min with fluorescently labeled antibodies (Table S2) along with 1 mg/ml anti-CD16/32 (24G2; eBioscience).
For detection of cells in early S of the cell cycle, we performed dual nucleotide pulse and staining as previously described (Gitlin et al., 2014). Briefly, mice were injected i.v. with 1 mg of EdU (A10044; Thermo Fisher Scientific) and 1 h later with 2 mg BrdU (B5002; Sigma). 30 min after the second injection, LNs were harvested, and single-cell suspensions were prepared. After cell surface receptor staining as described above, cells were fixed and permeabilized using BD Cytofix/Cytoperm fixation and permeabilization solution and BD Cytoperm Permeabilization Buffer PLUS, respectively. EdU and BrdU incorporation into DNA was assayed using the Click-iT Plus EdU Alexa Fluor 647 Flow Cytometry Assay Kit (Invitrogen) and FITC BrdU Flow Kit (BD), respectively.
For single-cell sorting, cells were stained as above and index-sorted directly into 96-well plates containing Buffer TCL (Qiagen) supplemented with 1% β-mercaptoethanol using a BD FACS Aria II. Each plate contained all conditions assayed in each replicate. Cells were washed, filtered, and resuspended in PBE before analysis or sorting on BD FACS LSR II, FACS Symphony, or FACS ARIA II cytometers. All data were analyzed using FlowJo software v.10.
Library preparation for scRNA-seq
Libraries were prepared as previously described (Trombetta et al., 2014). Briefly, nucleic acids were extracted from sorted single cells using RNAClean XP Solid Phase Reversible Immobilization (SPRI) beads (Beckman Coulter), and RNA was hybridized first using RT primer (/5BiosG/AAGCAGTGGTATCAACGCAGAGTACTTTTTTTTTTTTTTTTTTTTTTTTTTTTTTVN) and then reverse transcribed into cDNA using TSO primer (5′-AAGCAGTGGTATCAACGCAGAGTACATrGrGrG-3′) and RT maxima reverse transcription (Thermo Fisher Scientific). cDNA was amplified using ISPCR primer (5′-AAGCAGTGGTATCAACGCAGAGT-3′) and KAPA HiFi HotStart ReadyMix (Thermo Fisher Scientific), cleaned up using RNAClean XP SPRI beads three times, and tagmented using Nextera XT DNA Library Preparation Kit (Illumina). For each sequencing batch, up to four plates were barcoded at a time with Nextera XT Index Kit v2 Sets A–D (Illumina). Finally, dual-barcoded libraries were pooled and sequenced using Illumina Hiseq2500 (experiment 1)/Nextseq 550 (experiments 2–4) platform.
scRNA-seq analysis
Raw fastq sequence files generated from Smartseq2 libraries were aligned to mouse genome (v. mm10) with the annotated transcriptome (v. gencode M22) using STAR (v. 2.6; Dobin et al., 2013). Subsequently, genome-mapped BAM files were processed through RSEM (v. 1.3.1; Li and Dewey, 2011) for gene quantification. The matrix of gene counts was then, used as input for analysis by the R package Seurat (v. 3.1.4.; Stuart et al., 2019). Next, the dataset was corrected by using the regularized negative binomial regression (SCTransform) implemented by Seurat (Hafemeister and Satija, 2019). To control the dataset for unwanted sources of experimental variation, we fed the mitochondrial gene abundance and the experimental batches information into SCTransform. Additionally, cells containing more than 20% of sequence reads aligned to mitochondrial genes were excluded before normalization. Next, single cells were clustered and gene expression was evaluated with the Seurat workflow. Gene signature scoring was performed by using Seurat’s AddModuleScore function (see Data S1 for the complete list).
Immunoblotting
Cells were lysed in ice-cold lysis buffer containing 50 mM Hepes (pH 7.4), 40 mM NaCl, 2 mM EDTA, 1.5 mM sodium orthovanadate, 50 mM NaF, 10 mM pyrophosphate, 10 mM glycerophosphate, and 1% Triton X-100, as well as one tablet of EDTA-free complete protease inhibitors (Roche) per 25 ml. Cell lysates were cleared by centrifugation at 15,000 g for 10 min. Proteins lysates were denatured in sample buffer, boiled for 5 min, resolved by SDS-PAGE, transferred onto polyvinylidene difluoride membranes, and probed with the indicated antibodies.
Generation of Ccnd2-null and Ccnd3T283A mice
Ccnd2-null and Ccnd3T283A mice were generated by CRISPR/Cas9–mediated genome targeting at the Whitehead Institute for Biomedical Research and The Rockefeller University, respectively. For Ccnd2 targeting, cytoplasmic injection of Cas9 mix into fertilized C57BL6 zygotes at the one-cell stage was performed as previously described (Wang et al., 2013; Yang et al., 2013). The Cas9 mix contained Cas9 mRNA and chimeric sgRNA that was in vitro transcribed from a synthetic dsDNA template (gBlock; Integrated DNA Technologies) using the MEGAshortscript T7 Transcription Kit (Thermo Fisher Scientific) and purified using MEGAclear Transcription Clean-Up Kit (Thermo Fisher Scientific). Ccnd3T283A mice were generated in C57BL6 × SJL F1 zygotes using the Easi-CRISPR protocol (Quadros et al., 2017). Cas9 mix contained a CRISPR RNA (crRNA)/transactivating crRNA (tracrRNA) complex and a 200-bp repair oligo centered on the introduced mutations, synthesized as a PAGE-purified single-stranded DNA ultramer (all synthesized by Integrated DNA Technologies).
The dsDNA template for chimeric sgRNA transcription used for Ccnd2 was 5′-cgctgttaatacgactcactatagggACATCCAACCGTACATGCGCgttttagagctagaaatagcaagttaaaataaggctagtccgttatcaacttgaaaaagtggcaccgagtcggtgctttt-3′ (protospacer sequence in capital letters). The crRNA protospacer sequence used for Ccnd3 was 5′-GTGAATGGCTGTGACATCTG-3′. The repair oligo for Ccnd3T283A was 5′-gatcgaagctgccctcagggagagcctcagggaagctgctcagacagcccccagcccagtgcccaaagccccccggggctctagTagTcaAgggcccagtcagaccagcGctccTacagatgtcacagccattcacctgtagcttgagacaggccctctcaggccaccaagcagaggaggggcccctgccaccccctccc-3′ (differences from original C57BL6 sequence are in capital letters).
Generation of mixed BM chimeras
BM cells were isolated from of punctured tibiae and femurs dissected from mice of indicated Ccnd3 genotype, as well as JHT mice, by centrifugation at up to 10,000 g for 10 s followed by lysis of red blood cells using ACK buffer. BM cells isolated from Ccnd3 were mixed with those from JHT mice at 20:80 ratio. Prior to BM cell transfer, recipient mice were irradiated twice at 520 rad 4 h apart.
Histological analysis of tissue sections
For immunofluorescence, LNs were dissected and immediately fixed in PBS containing 4% paraformaldehyde and 10% sucrose for 1 h at 4°C. Fixed tissues were then incubated in 30% sucrose in PBS overnight at 4°C, embedded in optimum cutting temperature compound the following day, and sliced into 20-µm sections using a Leica Cryostat Microtome. For immunostaining, tissue sections were fixed in ice-cold acetone for 10 min at −20°C, blocked with Streptavidin/Biotin Blocking Kit (Vector Laboratories), and incubated with indicated antibodies diluted in PBS containing 5% BSA and 10% normal goat serum. Sections were mounted in Fluoromount-G (Southern Biotech) before imaging on a Zeiss 700 confocal microscope using a 20× objective with numerical aperture of 0.8. Post-acquisition analysis was performed using ImageJ (National Institutes of Health; http://rsb.info.nih.gov/ij/).
For H&E and immunohistochemical staining, organs were fixed in 4% formaldehyde and embedded in paraffin. 5-μm sections of mouse tissue was deparaffinized and heat antigen retrieved in citrate buffer, pH 6.4, and endogenous peroxidase (HRP) activity was blocked by treating the sections with 3% hydrogen peroxide in methanol. Indirect immunohistochemistry was performed using biotinylated peanut agglutinin followed by avidin–horseradish peroxidase or avidin-AP and developed by Vector Blue or DAB color substrates (Vector Laboratories). Sections were counterstained with hematoxylin. Images were acquired using a Zeiss Axioskop imaging microscope.
Single-cell Igh sequencing
Libraries were prepared as previously described (Mesin et al., 2020). Briefly, nucleic acids were extracted from sorted single B cells and reverse transcribed into cDNA using RT maxima reverse transcription (Thermo Fisher Scientific) and oligo(dT) primer. Ig heavy chains were amplified by PCR using a consensus forward primer for all V regions and reverse primers specific for each isotype. In the next round of PCR, 5-nucleotide barcodes were introduced using forward and reverse primers to identify the plate number/row position and column position, respectively. In the last round of PCR, Illumina paired-end sequencing adapters were incorporated. PCR products were then pooled, cleaned up using SPRI beads, and sequenced using a 500-cycle Reagent Nano kit v2 on the Illumina Miseq platform according to the manufacturer’s instructions.
Mathematical modeling
Statistical analysis
Pairs of samples were compared using the Mann–Whitney U nonparametric test. Multiple comparisons were performed using the Kruskal–Wallis nonparametric test with Dunn’s multiple comparison test. P values are reported as nonsignificant when P ≥ 0.05. All statistical analyses were performed using GraphPad Prism v. 8 software or RStudio. Graphs were plotted using Prism v. 8, RStudio, or GCtree and formatted using Adobe Illustrator CS.
Data availability
Sequence data have been deposited in the National Center for Biotechnology Information Gene Expression Omnibus database under accession no. GSE162182.
Online supplemental material
Fig. S1 shows the kinetics of the GC B cell response to DEC-OVA. Fig. S2 shows transcriptional signatures up-regulated by positively selected B cells in different clusters and at different time points. Fig. S3 shows B cell selection and S phase entry in Ccnd2−/− mice. Fig. S4 shows development and GC formation, and Fig. S5 shows disease phenotype, in Ccnd3T283A/+ mice. Table S1 lists samples included in scRNA-seq analysis. Table S2 lists antibodies used in the study. Data S1 shows a list of cell cycle genes, Myc signature genes, E2F target genes, and mTOCR1 target genes used in scRNA-seq analysis. Data S2 shows Igh sequences obtained from Ccnd3T283A/+ mice.
Acknowledgments
We thank P. Sicinski (Dana-Farber Cancer Institute, Boston, MA) and H. Lodish (Whitehead Institute, Cambridge, MA) for Ccnd3−/− mice; K. Gordon and K. Chhosphel for FACS; S. Markoulaki and R. Jaenisch (Whitehead Institute) and R. Norinsky (Rockefeller University) for CRISPR/Cas9 mouse generation; J. Bortolatto (Victora laboratory) for mouse reproductive services; the Laboratory of Comparative Pathology (Memorial Sloan Kettering Cancer Center) for mouse tissue processing and staining; and A. Schiepers for critical reading of our manuscript.
This work was funded by National Institutes of Health/National Institute of Allergy and Infectious Diseases grants R01AI139117 and R01AI119006 (to G.D. Victora) and Starr Foundation consortium grant I11-0027 (to A. Melnick and G.D. Victora), with additional support from National Institutes of Health grant DP1AI144248 (Pioneer award) and the Robertson Foundation (G.D. Victora). J. Pae is a Damon Runyon Cancer Research Foundation Berger Foundation Fellow (DRG-2353-19). J. Ersching was a Cancer Research Institute-Irvington postdoctoral fellow. M. Schips was supported by the European Union's Horizon 2020 research and innovation program under Marie Skłodowska-Curie grant agreement no. 765158. J. Ordovas-Montanes was supported by the Damon Runyon Cancer Research Foundation (DRG-2274-16) and the Richard and Susan Smith Family Foundation. C. Mlynarczyk was supported by a Lymphoma Research Foundation postdoctoral fellowship, a Leukemia and Lymphoma Society Special Fellow Award, and the American Society of Hematology Research Restart Award for early career investigators in hematology. A. Melnick was supported by National Cancer Institute grant R35CA220499. A. Efeyan is a Ministerio de Ciencia, Innovación y Universidades/Agencia Estatal de Investigación Ramon y Cajal Awardee (RYC-2013-13546). A.K. Shalek was supported by the Searle Scholars Program, the Beckman Young Investigator Program, a Sloan Fellowship in Chemistry, and National Institutes of Health grants 1DP2GM119419 and 5U24AI118672. G.D. Victora is a Searle Scholar, a Burroughs Wellcome Investigator in the pathogenesis of infectious disease, a Pew-Stewart Scholar, and a MacArthur Fellow.
Author contributions: J. Pae, J. Ersching, A. Efeyan, and G.D. Victora designed and performed all in vivo experiments. T.B.R. Castro carried out the bioinformatic analysis of scRNA-seq data. L. Mesin, S.J. Allon, and J. Ordovas-Montanes contributed additional scRNA-seq libraries, under supervision of A.K. Shalek. M. Schips and M. Meyer-Hermann performed mathematical modeling. C. Mlynarczyk and A. Melnick contributed to the description of the malignant phenotype of Ccnd3T283A mice, including histological analysis. J. Pae, T.B.R. Castro, and G.D. Victora wrote the manuscript with input from all authors. G.D. Victora supervised the work.

