Maladaptive repair following kidney tubular injury leads to the development of interstitial fibrosis, a pathology common to chronic kidney diseases (CKD). Dysfunctional DNA damage response plays an important role in the progression of CKD. We found that BRCA1 expression was increased in the kidneys of patients with CKD and fibrotic kidneys of mice. Exon 11 deletion of Brca1 in proximal tubule cells (PTCs) of mice subjected to ischemic or nephrotoxic (aristolochic acid) injury resulted in a reduced number of senescent cells, as assessed by a decrease in phospho-histone H3, p16INK4a, RAD51 recruitment, G2/M cell cycle phase cells, GATA4, and senescence-associated β-galactosidase. There was less production of inflammatory profibrotic mediators and reduced kidney fibrosis. After cisplatin exposure in vitro, human PTCs with reduced BRCA1 had increased apoptosis, decreased RAD51 nuclear foci, and fewer cells in the G2/M cell cycle phase, with reduced IL-6 and sonic hedgehog production. Thus, BRCA1 regulates nonmalignant tissue responses to kidney injury, a role hitherto unrecognized.

Introduction
Acute kidney injury (AKI) is an important risk factor for the initiation and progression of irreversible fibrotic kidney disease, which often progresses to chronic and end-stage kidney disease (Coca et al., 2012; Coca et al., 2009; Cohen and Kimmel, 2012; Hsu, 2012). AKI, secondary to ischemia-reperfusion injury (IRI) or toxins, is characterized by the loss of tubular function and histologically by proximal tubule cell (PTC) brush border denudation, cell death, rarefaction of the kidney microvasculature, and tissue inflammation (Bonventre and Yang, 2011). Severe acute or recurrent injury to the PTC leads to maladaptive repair and interstitial fibrosis (Canaud and Bonventre, 2015; Grgic et al., 2012).
DNA damage has been implicated in various etiologies of kidney injury, including IRI (Ma et al., 2014; Pressly and Park, 2016) and exposure to nephrotoxic chemical agents, such as aristolochic acid (AA) (Li et al., 2006) and cisplatin. AA generates DNA adducts (Nortier et al., 2000; Nortier and Vanherweghem, 2002) while cisplatin causes intra-strand DNA cross-links, leading to replication fork collapse (Malinge et al., 1999). DNA double-strand breaks (DSBs) and stalled or collapsed replication forks are repaired by complex molecular pathways, including homologous recombination (HR) and/or nonhomologous end joining (NHEJ) (Cox, 2002; Cox et al., 2000; Michel et al., 2004). When DNA repair is overwhelmed, cell cycle checkpoints are activated to allow time for repair, followed by recovery and cell cycle reinitiation (Chaudhury and Koepp, 2016; Jones and Petermann, 2012; Lopes et al., 2001). Cell cycle arrest can be initiated by inhibiting CDK4/6 by p16INK4a at G2/M or CDK1/2 by p21 at G1/S (Gire and Dulic, 2015). Prolonged cell cycle arrest leads to cellular senescence. Senescent cells resist apoptosis and autophagy (Baisantry et al., 2016) and can generate profibrotic cytokines, which activate perivascular pericytes and interstitial fibroblasts, leading to accelerated fibrosis (Wang, 1995).
Our laboratory has described a causal association between cell cycle arrest at G2/M in kidney epithelial cells following AKI and the development of kidney fibrosis after ischemic, toxic, and obstructive injuries (Yang et al., 2010). The upregulation of p16INK4a and the development of senescence-associated secretory phenotype (SASP) have been implicated in tissue dysfunction in models of aging and predisposition to tumor formation in cancer (Melk and Halloran, 2001; Satriano et al., 2010). GATA4 regulates inflammation associated with the DNA damage response (Kang et al., 2015). GATA4-mediated activation of NFκB has been implicated in the generation of SASP, and its inhibition delays senescence (Kang et al., 2015; Tilstra et al., 2012).
Breast cancer gene-1 (BRCA1) promotes G2 cell cycle arrest by prolonging the phosphorylation of Chk1 in response to DNA damage (Draga et al., 2015). In this study, we explored the relationship between the BRCA1 protein and the development of kidney fibrosis after injury. The Brca1 gene is well-known as a tumor suppressor (Scully and Livingston, 2000) and maintains genome stability (Roy et al., 2012). It is expressed at low levels in the normal human kidney (Karlsson et al., 2021). Conversely, this effect may be maladaptive in cases of noncancerous kidney injury, where DNA damage is linked with cell cycle arrest and SASP facilitation, leading to fibrosis. The Brca1 gene encodes a protein with a molecular weight of 220 kDa, with distinct regions: a 5′ ring domain that has ubiquitin ligase activity (Hashizume et al., 2001; Lorick et al., 1999), the central and largest part of the gene (encoded by exon 11) with its two nuclear localization signals (Deng and Brodie, 2000), and the BRCA1–C-terminal domains that interact with proteins involved in breast cancer (Mohammad and Yaffe, 2009; Yamane et al., 2000). The natural splice variant absent of exon 11 results in a 97-kDa protein with the inability to localize to the nucleus (Clark et al., 2012) and impaired interaction with the retinoblastoma protein (Aprelikova et al., 1999; Thakur et al., 1997), RAD50 (Zhong et al., 1999), and RAD51 (Scully et al., 1997). The role of BRCA1 in nonmalignant disease has not been well studied, except for a few studies indicating that BRCA1 plays an important role in inducing an adaptive response to prevent apoptosis of cardiac myocytes after injury (Shukla et al., 2011) and protecting the neuron genome in Alzheimer’s disease (Suberbielle et al., 2015).
We find that mice with proximal tubule–targeted deletion of exon 11 of the Brca1 gene have reduced p16INK4a and GATA4, fewer cells in the G2/M phase, and are protected from ischemic or nephrotoxin induced interstitial fibrosis. Our findings identify a novel role for BRCA1 and advance understanding of the important role of DNA repair, cell cycle arrest, and senescence in the induction of chronic fibrotic organ damage after acute injury.
Results
Increased BRCA1 expression in human kidneys of patients with chronic kidney disease (CKD)
First, we investigated the expression of BRCA1, p16INK4a, and GATA4 to evaluate the correlation of CKD with cellular senescence and BRCA1 expression in human kidneys with CKD and interstitial fibrosis. The expression of BRCA1 was significantly increased in the cytoplasm and nuclei of CKD kidneys compared with non-CKD kidneys (minimal change disease without fibrosis). Furthermore, in the non-CKD kidneys, BRCA1 expression was seen predominantly in tubules, whereas in the CKD kidneys, BRCA1 expression was seen in both tubules and glomeruli, with a higher fold increase in tubules compared with the glomerulus (Fig. 1 A). The expression of p16INK4a in the cytoplasm and the nuclei of PTCs was increased compared with the kidneys of patients without CKD. A significant increase in expression of p16INK4a was seen in tubules as well as glomeruli in the CKD kidneys compared with the kidneys of patients without CKD (Fig. 1 B). These protein data support RNA sequencing results from previous reports where BRCA1 is increased in the kidneys of patients with diabetic kidney disease compared with the kidneys of healthy subjects (Wilson et al., 2019). Next, we found increased nuclear GATA4 expression in the tubules and glomeruli of CKD kidneys compared with those without CKD (Fig. 1 C). Thus, these data revealed increased BRCA1, p16INK4a, and GATA4 expression in CKD kidneys compared with those without CKD.
Targeted deletion of Brca1 exon 11 in proximal tubules protects mice from kidney fibrosis following injury
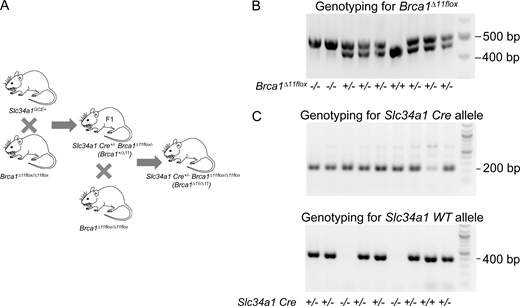
To investigate whether Brca1 can be implicated in the development of fibrosis, we induced tubular injury with either 26-min bilateral IRI (BIRI) or by injecting 5 mg/kg body weight of AA, which we have previously shown to cause severe fibrosis in mice (Yang et al., 2010). For BIRI experiments, kidneys were harvested at 28 days after ischemia; for AA treatment, kidneys were harvested at day 14 after injection. mRNA expression levels for fibrotic factors (Fn1, Col1a1, Acta2, and Tgfb1) and proximal tubular injury marker (Havcr1, also known as KIM-1) were increased after 28 days after BIRI (Fig. 1, D–H) or 14 days after AA injection (Fig. 1, I–M). Due to the absence of a Brca1 exon 11–specific antibody, we performed fluorescence in situ hybridization (FISH) with Brca1 exon 11–specific probes. We found an increase in Brca1 exon 11 mRNA following 28 days after BIRI as well as 14 days after AA (Fig. 1 N). Based on our human data showing an increase of BRCA1 in kidney tubules of CKD patients, we chose to interrogate the function of BRCA1 in the development of kidney fibrosis by deleting exon 11 from PTCs in mice. We used previously reported experimental mouse models in which we have shown that the DNA damage response is an important contributor to maladaptive fibrotic repair (Canaud et al., 2019; Grgic et al., 2012; Yang et al., 2010). To accomplish this, we crossed BRCA1Δ11flox/Δ11flox mice (Deng and Xu, 2004) with Slc34a1-CreERT2 (Slc34a1GCE/+) mice to generate heterozygous mice (Myakala et al., 2014), followed by backcrossing the F1 with Brca1Δ11flox/Δ11flox mice (Fig. S1 A). We generated WT Slc34a1GCE/+; Brca1WT/WT mice (hereafter identified as Brca1+/+), PTC-specific heterozygote Slc34a1GCE/+; Brca1+/Δ11flox mice, which upon administration of tamoxifen, have a deletion of exon 11 on one allele (hereafter identified as Brca1+/Δ11), and PTC-specific homozygote Slc34a1GCE/+; Brca1Δ11flox/Δ11flox mice, which upon tamoxifen administration, have a deletion of both alleles of Brca1 exon 11 in the proximal tubule (hereafter identified as Brca1Δ11/Δ11) (Fig. S1, B and C). We confirmed the deletion of Brca1 exon 11 in mouse PTCs by FISH. When we co-stained for Lotus tetragonolobus lectin (LTL) to label the proximal tubules, we found a decrease in proximal tubule Brca1 exon 11 mRNA expression in both Brca1+/Δ11 and Brca1Δ11/Δ11 mice as compared with Brca1+/+ mice, 18 days after CreERT2 induction by tamoxifen (Fig. 1 O). Moreover, we did not find a significant difference in BRCA1 exon 11 expression in the PTCs of Brca1+/Δ11 when compared with Brca1Δ11/Δ11 mice. To detect whether the reduction in Brca1 has any effect on apoptosis at baseline, we performed terminal deoxynucleotidyl transferase-mediated dUTP nick end labeling (TUNEL) staining at 2 wk after CreERT2 induction by tamoxifen. There were no differences in apoptosis in Brca1+/Δ11 mice compared with Brca1+/+ mice before initiating tubular injury (Fig. S2 A). These results are consistent with reports from breast cancer cell lines where the deletion of Brca1 exon 11 does not induce apoptosis in the absence of chemical injury (Thangaraju et al., 2000). The baseline staining patterns for GATA4 demonstrated low expression in kidneys of both (Brca1+/+ and Brca1+/Δ11) mouse genotypes, and there was a minimal expression of p16INK4a in Brca1+/+ or Brca1+/Δ11 mouse genotypes (Fig. S2, B and C).
Serum creatinine (SCr) increased by day 2 after BIRI or AA injection among Brca1+/+, Brca1+/Δ11, and Brca1Δ11/Δ11 mice (Fig. S3, A and B) without any difference between any of the mouse groups, indicating that proximal tubule Brca1 deletion did not change the initial kidney functional impairment in response to injury. Brca1+/Δ11 and Brca1Δ11/Δ11 mice were protected from kidney fibrosis as compared with Brca1+/+ mice, as shown by Picro Sirius red staining (Fig. 1, P and R), and this was consistent with results from interstitial fibrosis and tubular atrophy (IFTA) scoring (Fig. 1, Q and S) in the 28 days after BIRI and 14 days after AA-injected mice kidneys, respectively. Next, we investigated the deposition of fibronectin (Fn) by immunostaining in kidneys after BIRI or AA treatment compared with kidneys of sham-operated mice. There was a significant increase in Fn at 14 days following AA treatment and 28 days following BIRI, which was mitigated in kidneys from mice with Brca1 exon 11 reduction (Fig. S4; and Fig. 1, T and U). Consistent with reduced fibrosis, there was also a significant decrease in interstitial α-smooth muscle actin (α-SMA) immunofluorescence staining in Brca1+/Δ11 and Brca1Δ11/Δ11 mice (Fig. 1, T and U) as compared with Brca1+/+ mice in the 14 days after AA treatment and 28 days after BIRI mice kidneys, respectively. Western blot analysis confirmed reduced protein levels of Fn, α-SMA, and p16INK4a in the kidney tissues in Brca1+/Δ11 and Brca1Δ11/Δ11 mice as compared with Brca1+/+ mice 28 days after BIRI (Fig. 1 V). Taken together, these data indicate that decreased levels of proximal tubular BRCA1 are associated with reduced myofibroblast activation, kidney fibrosis, and expression of the cell cycle inhibitor, p16INK4a, following tubular ischemic or toxic injury.
Deletion of proximal tubule Brca1 exon 11 leads to decreased tubular senescence and fewer cells in the G2/M phase of the cell cycle
We investigated whether reduced expression of the Brca1 exon 11 in mouse PTCs was associated with fewer cells in the G2/M phase of the cell cycle and less tubular senescence. At 28 days after BIRI (Fig. 2, A, C, E, and G) or 14 days after AA (Fig. 2, B, D, F, and H), kidney cortices of Brca1+/Δ11 or Brca1Δ11/Δ11 mice had reduced numbers of pH3-positive tubular epithelial cells (phosphorylated-histone 3 at S10 residue is a marker of cells in late G2 and early mitosis [Hendzel et al., 1997]) (Fig. 2, A and B) and reduced p16INK4a-positive cells when compared with Brca1+/+ control mice (Fig. 2, C and D). There were decreased numbers of GATA4 and pH3 double-positive epithelial cells (Fig. 2, E and F) and reduced senescence-associated β-galactosidase (SA-β-Gal) staining (Fig. 2, G and H), both indicators of senescence, in Brca1+/Δ11 or Brca1Δ11/Δ11 as compared with Brca1+/+ mice after exposure to BIRI or AA.
Expression of RAD51, a member of a protein complex with BRCA1 that facilitates the repair of DNA DSBs by HR, was reduced in cortical epithelial cells of Brca1+/Δ11 or Brca1Δ11/Δ11 mice as compared with Brca1+/+ mice following BIRI (Fig. 2 I, upper right panel) or AA (data not shown). The p53-binding protein 1 (53BP1) is a tumor suppressor involved in an alternative pathway to repair double-strand DNA breaks by promoting NHEJ. NHEJ is a faster repair pathway, though less accurate. Active 53BP1 deactivates BRCA1 and vice versa. We evaluated whether a decreased Brca1 expression (and consequently reduced RAD51 expression) favored the NHEJ pathway. There was an increase in perinuclear 53BP1 staining in kidney cortices among the Brca1Δ11/Δ11 mice (Fig. 2 I, middle row and right lower panel). However, the lack of nuclear 53BP1 indicates that there is no compensation by the 53BP1–NHEJ pathway when Brca1 is depleted.
In summary, cortical epithelial cells from Brca1+/Δ11 or Brca1Δ11/Δ11 mice had decreased expression of senescence markers (SA-β-Gal, p16INK4a, and GATA4), and less nuclear RAD51 with no nuclear 53BP1, when compared with the kidney PTCs from Brca1+/Δ11 or Brca1Δ11/Δ11 mice after kidney BIRI or AA treatment. Thus, decreased functional BRCA1 results in decreased senescence and fewer cells in the late G2 or M phase of the cell cycle. This may be a result of the lack of BRCA1-induced cell cycle checkpoint activation, which, in the absence of compensatory NHEJ repair, results in the death of damaged cells rather than the accumulation of senescent cells. This may then lead to less kidney fibrosis.
Brca1 loss of function leads to increased apoptosis and reduced epithelial cell BrdU uptake 4 days after AA-induced injury
Since tissue responses shortly after the injury can have critical longer-term consequences, including fibrosis, the role of BRCA1 in repairing DNA damage in PTCs immediately after tubular injury was explored. Mice were sacrificed 4 days after AA treatment. BrdU, an S phase marker, was administered 2 h prior to sacrifice via intraperitoneal injection. Using co-localization experiments with BrdU and antigen Ki-67 (a marker of cell cycle entry) (Yang et al., 2010), we found that epithelial cells in the cell cycle (Ki-67+) that had also gone through S phase (BrdU+), and hence stained for both BrdU and Ki-67, were decreased after tubular injury in both Brca1+/Δ11 or Brca1Δ11/Δ11 as compared with Brca1+/+ mice (Fig. 3 A). This implies that Brca1 exon 11 WT epithelial cells undergo more S phase DNA replication than Brca1 exon 11–depleted cells at 4 days after AA-induced tubular injury, and hence the knockdown or knockout cells are arrested at the G1/S boundary of the cell cycle. It should be noted that this G1/S arrest at the 4 days time point after injury, whereas G2/M arrest is more prevalent during the chronic phase of the injury. We also assessed the role of BRCA1 on apoptosis following kidney injury using TUNEL analysis. There were increased numbers of TUNEL-positive cells and decreased S phase BrdU+ cells in areas of the kidney cortex where Brca1 exon 11 was deleted in Brca1+/Δ11 and Brca1Δ11/Δ11 mice (Fig. 3, B–D). We found similar levels of nuclear γH2AX staining in the Brca1+/+ and Brca1Δ11/Δ11 kidney cortices at the 4-day time point after AA administration (Fig. 3 E), which suggests that the amplitude of acute DNA strand breaks is similar in both Brca1+/+ and Brca1Δ11/Δ11 mice. Thus, without Brca1 exon 11, PTCs stall proliferation and preferentially undergo apoptosis rather than maladaptive repair and senescence.
BRCA1 knockdown results in decreased G2/M cell cycle arrest after cisplatin injury
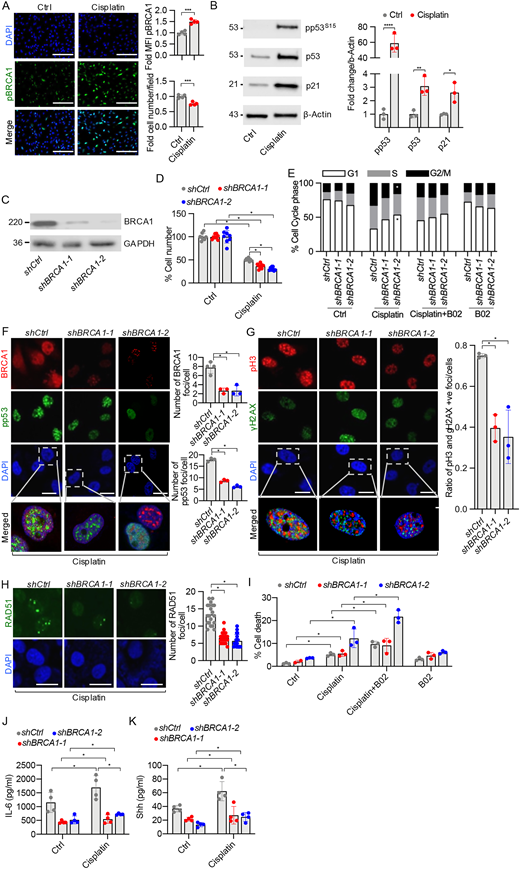
We used cisplatin to introduce another toxin that causes DNA damage and acute and chronic injury to the kidney. To study the effect of BRCA1 knockdown after cisplatin injury on PTCs, we used human-derived primary PTCs and human PTC cell lines to investigate G2/M cell cycle arrest and its mechanisms. We probed for the downstream signaling targets of BRCA1: p53 and p21 by western blot. We treated patient PTCs with 25 µM of cisplatin. We found a significant decrease in cell number and an increase in serine 1524 phosphorylation of BRCA1 (pBRCA1S1524), serine 15 phosphorylation of p53 (pp53S15), p53, and p21 levels (Fig. 4, A and B) following cisplatin treatment. BRCA1 knockdown cells treated with cisplatin had a smaller proportion of pH3+ cells, which may reflect the activation of the G1/S checkpoint and an increase in cell apoptosis. p53 is a tumor suppressor gene, and its deletion or inactivation is involved in the development of human cancers. p53 also plays a crucial role in irreversible cell cycle arrest following DNA damage and acts in concert with BRCA1 in this process (Arizti et al., 2000; el-Deiry et al., 1993). The enhanced cell death may decrease the number of cells in G2/M and reduce profibrotic cytokine and growth factor production. To further investigate this hypothesis, HKC8 cells were infected with lentivirus containing either control shRNA (shCtrl) or two different BRCA1 shRNAs (shBRCA1–1 or shBRCA1–2) to target the p220 product. Stable cell lines were generated and exposed to cisplatin. Western blot analysis showed reduced full-length BRCA1 protein product expression after shRNA-induced knockdown (Fig. 4 C). In the group treated with cisplatin for 24 h, the number of surviving cells was significantly reduced among shBRCA1–1 or shBRCA1–2-expressing cell lines compared with shCtrl-transduced cells (Fig. 4 D). These data confirm that reduction in BRCA1 sensitizes the epithelial cells to cisplatin-induced cell death.
shCtrl or shBRCA1–1 or shBRCA1–2 stably expressing cell lines were treated with either vehicle (control), cisplatin, cisplatin and B02, a small molecule inhibitor of RAD51-mediated HR, or B02 alone. Cell cycle analysis was assessed by flow cytometry using propidium iodide (PI). The cell cycle was not significantly altered in cells expressing either shCtrl or shBRCA1–1 or shBRCA1–2 at baseline, but we found an increasing trend for cells in the S and G2/M phase after BRCA1 knockdown (Fig. 4 E, panel 1). After cisplatin treatment of HKC8 cells for 24 h, cells expressing shBRCA1–2 showed a significant decrease in the number of cells in G2/M and the corresponding increase in cells in G1/S cell cycle phase when compared with shCtrl cells treated with cisplatin (Fig. 4 E, panel 2 and Fig. S5 A). B02, an inhibitor of RAD51, was used to evaluate whether RAD51 influenced the injury-induced increase in G2/M cells. In cells treated with cisplatin and B02 (Fig. 4 E, panel 3), there was a significant reduction in the percentage of cells in G2/M in shCtrl cells compared with shCtrl populations that received cisplatin only, indicating that RAD51 inhibition attenuates injury-induced G2/M arrest. B02, in the absence of cisplatin-related injury, had no significant effect on cell cycle dynamics, but we found an increasing trend in the S and G2/M cell cycle phase after BRCA1 reduction (Fig. 4 E, panel 4).
As expected, there was less BRCA1 nuclear staining in HKC8 cells transfected with either shBRCA1–1 or shBRCA1–2 when compared with those transfected with shCtrl (Fig. 4 F). We investigated how p53 responds to BRCA1 depletion after cisplatin-related DNA damage in kidney cells. pp53 nuclear staining was reduced in cells with reduced levels of native BRCA1 (Fig. 4 F). This implies that with BRCA1 depletion, there is likely a downregulation of p53-mediated cell cycle arrest in kidney epithelial cells. While cells had similar amounts of DNA damage, as represented by γH2AX+, the BRCA1 knockdown (shBRCA1–1 and shBRCA1–2 treated) cells have reduced pH3 expression as compared with shCtrl cells following cisplatin treatment (Fig. 4 G). Taken together, these data indicate that there are more G2/M phase cells among the shCtrl-treated cells. Thus, the reduced percentage of shBRCA1–1 and shBRCA1–2-treated cells in the G2/M phase was associated with a decrease in p53. This reduction in p53 may result in reduced p53-mediated braking function on G1/S, making it more likely that p21 may account for the relative increase in cells in G1. The reduced number of G2/M stage cells with BRCA1 knockdown is consistent with our mouse studies showing that intact BRCA1 is associated with increased numbers of cells at G2/M in PTCs after injury (Fig. 2, A and B).
There is a decrease in nuclear RAD51 foci in cells expressing shBRCA1–1 or shBRCA1–2 as compared with shCtrl-expressing cells after cisplatin treatment (Fig. 4 H). This supports our hypothesis that BRCA1 is essential for RAD51-mediated HR in cisplatin-treated PTCs. As expected, following 2 h of pretreatment with B02 followed by 48 h of cisplatin treatment, there was increased cell death (Fig. 4 I). Next, we investigated the secretion of inflammatory cytokine IL-6 and sonic hedgehog (shh) ligand, which have been implicated as PTC-generated agents in the paracrine activation of pericytes/myofibroblasts. We found that IL-6 secretion was decreased in HKC8 cells with reduced BRCA1. Further, cisplatin treatment increased the secretion of IL-6 (Fig. 4 J) and shh levels (Fig. 4 K) in WT cells treated with shCtrl but not in cells treated with shBRCA1–1 or shBRCA1–2. Thus, BRCA1 deficiency results in decreased PTC production of IL-6 and decreased shh signaling in response to a DNA-damaging influence of cisplatin. Taken together, these data confirm that the reduction in BRCA1 leads to increased apoptosis, decreased PTCs at the G2/M cell cycle phase, and decreased production of inflammatory profibrotic mediators following DNA damage.
BRCA1 promotes entry into the S phase of the cell cycle with profibrotic protein expression and secretion in human PTCs in vitro
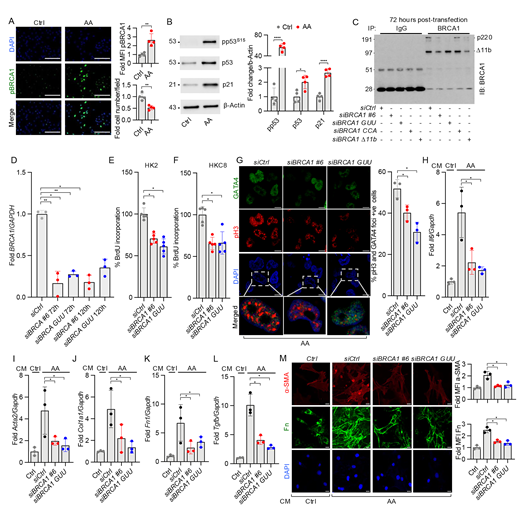
To further interrogate a role for BRCA1 during AKI in an in vitro system, patient-derived PTCs were subjected to AA (30 µM) treatment for 48 h. Immunofluorescence analysis revealed a significant increase in activated pBRCA1S1524 staining (Fig. 5 A). Interestingly, although AA stimulation resulted in a reduction in cell number compared with DMSO-treated control cells (Ctrl) seeded at equivalent densities, we observed a 2.5-fold increase in pBRCA1S1524 fluorescence intensity in the remaining AA-treated cells. We probed for the downstream signaling targets of BRCA1: p53 and p21 by western blot and found pp53S15, total p53, and p21 expression were increased following AA treatment (Fig. 5 B). Further, to investigate mechanisms of BRCA1 in cultures that are more amenable to genetic manipulation, two human kidney epithelial cell lines (HK2 and HKC8) were transfected with either control short interfering RNA (siRNA) (siGL2 [siCtrl]) or p220-specific siRNAs (siBRCA1 #6 and siBRCA1 GUU, siBRCA1 CCA, or siBRCA1 Δ11b). Western blot analysis after immunoprecipitation showed that the WT BRCA1 p220 product was significantly decreased in the cell lines transfected with either siBRCA1 #6, siBRCA1 GUU, or siBRCA1 Δ11b, whereas siBRCA1 CCA siRNA had less knockdown efficiency (Fig. 5 C). Based on these results, we selected siBRCA #6 and siBRCA GUU for further studies. BRCA1 knockdown was ∼75% and 60% with siBRCA1 #6 and siBRCA1 GUU, respectively, for at least 120 h after the transfection (Fig. 5 D). Knockdown of BRCA1 in two non-injured PTC lines (HK2 and HKC8) resulted in a decrease in the number of cells that moved through the S phase during the 2 h of BrdU labeling at 94–96 h after transfection (Fig. 5, E and F) and a reduction in cell proliferation over 48 h (Fig. S5, B and C). There was a decrease in pH3 and GATA4 expression following AA treatment in the cells with BRCA1 knockdown compared with cells transfected with control siCtrl (Fig. 5 G). Decreased numbers of pH3+/GATA4+ cells with BRCA1 knockdown indicated decreased late G2/early M phase cells and potentially less GATA4 stimulation of SASP activation.
Having established that PTCs with knockdown of BRCA1 secrete reduced amounts of IL-6 and shh ligands (Fig. 4, J and K), we further investigated the potential paracrine signaling of epithelial cell BRCA1 in the fibrogenic response to the pericyte cell line 10T1/2. To do this, we transfected HKC8 cells with Ctrl siRNA (siCtrl) or BRCA1 siRNAs (siBRCA1 #6 or siBRCA1 GUU) and 48 h after transfection, treated cells with AA or vehicle for 24 h. We then washed the cells three times with culture medium and added fresh culture medium. After incubation for 48 h, we collected the conditioned media (CM) to treat 10T1/2 cells. When CM was derived from HKC8 cells, transfected with with siBRCA1 #6 or siBRCA1 GUU, the 10T1/2 cells had a reduced activation response to AA as reflected by reduced Il6 (Fig. 5 H), Acta2, Col1a1, and Tgfb (Fig. 5, I–L) mRNAs. In addition, we confirmed the reduction of Fn and α-SMA protein expression by immunostaining following treatment of 10T1/2 pericytes with CM from cells transfected with siBRCA1 #6 or siBRCA1 GUU, compared with CM taken from AA-treated siCtrl-transfected HKC8 cells (Fig. 5 M).
A proposed model for the role of BRCA1 in the regulation of DNA repair and the initiation of kidney fibrosis after acute tubular injury
Following DNA damage induced either by BIRI or AA in mice or cisplatin in PTCs in vitro, BRCA1 recruits RAD51, facilitates G2/M checkpoint activation, and inhibits cell death. This results in an enhanced number of p16INK4a and GATA4-expressing senescent cells with increased SASP and consequently increased fibrosis. Cells with depleted or dysfunctional BRCA1 fail to trigger the G2/M checkpoint, allowing cells with DNA damage to move through the checkpoint and undergo apoptosis. Cells that enter the M phase before repairing their DNA undergo apoptosis before or after cell division. BRCA1-depleted cells have decreased numbers of senescent cells and decreased generation of profibrotic mediators (Fig. 6).
Discussion
Our group and others have identified maladaptive DNA repair after kidney injury as playing a key role in the development of CKD (Basile et al., 2016; Ferenbach and Bonventre, 2015; Yang et al., 2010, 2011). Genetic studies have also linked progressive fibrotic kidney disease to defective repair of intra-strand cross-links (Thongthip et al., 2016; Zhou et al., 2012). We reported that arrest at the G2/M checkpoint leads to senescence with a secretory phenotype that plays a key role in the development of fibrosis (Ferenbach and Bonventre, 2015; Gire and Dulic, 2015; Yang et al., 2010). DNA damage is an important characteristic of maladaptive repair, facilitating transition from acute kidney injury to CKD. Proximal tubule ataxia telangiectasia mutated (ATM) regulates DNA repair to increase maladaptive renal injury responses (Yang et al., 2010), whereas ataxia telangiectasia and Rad3-related (ATR) decreases maladaptive repair (Kishi et al., 2019). We postulated that BRCA1, a known effector of repair of DSBs and G2/M checkpoint activator, may facilitate the development of maladaptive repair. We have found that reduction of intact BRCA1 in vivo and in vitro increases acute injury phase apoptosis, decreases the number of cells in the late G2 or early M phase of the cell cycle, and decreases fibrosis after injury, implicating BRCA1 in progressive kidney disease.
Both BRCA1 and BRCA2 are developmentally essential genes, and deletions of either of the proteins cause embryonic lethality (Cortez et al., 1999; Hohenstein et al., 2001; Ludwig et al., 1997; Sharan et al., 1997; Suzuki et al., 1997). The BRCA1-related BRCA2 gene has similarities in that it also plays a role in genomic stability and repair of DNA damage by HR (Cortez et al., 1999; Patel et al., 1998; Yu et al., 2000), and in some cases, the two have been shown to interact indirectly. BRCA1 recruits BRCA2 to sites of double-stranded DNA breaks and recruits RAD51, so we would expect that reducing BRCA1 would also reduce BRCA2’s function (Moynahan et al., 1999, 2001; Patel et al., 1998; Snouwaert et al., 1999). Loss of BRCA1 gene function can lead to cell transformation (Connor et al., 1997; Foray et al., 1999). The BRCA1 and BRCA2 proteins co-localize to the nuclear foci induced by DNA damage (Chen et al., 1998). BRCA1 recruits PALB2, which serves as a linker with BRCA2 (Zhang et al., 2009), an interaction that is facilitated by the exon 11–13 region of BRCA1 (Clark et al., 2012). Under normal conditions, the BRCA1–PALB2–BRCA2–RAD51 interaction is critical for HR, as mutations that disrupt this complex impair the recruitment of RAD51 to DSBs (Foo et al., 2017). Because of these findings, it is believed that BRCA1 is the critical factor to initiate the HR-mediated DNA damage response. Our studies do not address the potential role of BRCA2 in response to kidney injury.
There are at least three known isoforms of BRCA1, including full-length BRCA1 (p220), Δ11b (lacking exon 11), and BRCA1-IRIS (lacking exons 12–24) (Lu et al., 1996; Orban and Olah, 2001; Xu et al., 1997). P220 is the most well understood of the isoforms of BRCA1, with less known about the functions of Δ11b and BRCA1-IRIS (ElShamy and Livingston, 2004). Full-length mouse and human BRCA1 are phosphorylated by increased ATM in response to DNA damage. ATM associates with RAD51 to repair DNA DSBs by HR and activates the G2/M checkpoint (Paterson, 1998; Yarden et al., 2002). We previously reported that ATR protects against senescence and maladaptive repair after kidney epithelial cell injury (Kishi et al., 2019). A recent study showed that BRCA1 repairs DNA damage caused by small RNAs (Hatchi et al., 2021). Deletion of exon 11 results in malfunction of the G2/M checkpoint (Xu et al., 1999b). Mouse embryos with homozygous deletions of Brca1 exon 11 survive longer than those with homozygous Brca1 null allele (Xu et al., 1999a), indicating that Brca1Δ11/Δ11 maintains some full-length BRCA1 functions (Huber et al., 2001). We and others have reported that injury to PTCs is an early event that initiates fibrosis and CKD. Based on the higher expression of BRCA1 in tubules of CKD patients, we generated conditional knockout mice of BRCA1 in PTCs to investigate the function of BRCA1 following tubular injury.
We found that mice with either heterozygous or homozygous deletion of Brca1 exon 11 in PTCs had no apparent phenotypic consequences and had similar survival for 1.5 years compared with WT littermates. Injury from either BIRI or AA injection caused an elevation in SCr at 48 h that was comparable in Brca1+/+ and both the Brca1+/Δ11 and Brca1Δ11/Δ11 mice. During the acute phase of tubular injury, when DNA damage occurs and repair of PTCs is initiated, Brca1+/Δ11 and Brca1Δ11/Δ11 mice had fewer BrdU-labeled tubular cells in the S phase when compared with the BRCA1+/+ mice. During this same period, Brca1+/Δ11 and Brca1Δ11/Δ11 mice had an increase in apoptotic tubular cells compared with Brca1+/+mice. Thus, depletion of functional Brca1 increases apoptosis, which may clear DNA-damaged cells and result in fewer senescent cells and maladaptive injury resolution.
During the chronic phase of tubular injury, WT Brca1+/+ mice had increased levels of BRCA1 compared with non-injured mouse kidneys. Brca1+/Δ11 and Brca1Δ11/Δ11 mice were protected from the development of interstitial fibrosis, with decreased interstitial α-SMA and Fn gene and protein expression. Reduced expression of WT BRCA1 was associated with fewer cells labeled with markers of the late G2/early M cell cycle phases (pH3) and senescence (SA-β-Gal, p16INK4a, and GATA4) when compared with Brca1+/+ mice. These data are consistent with our human data from patients with CKD, who had increased tubular expression of BRCA1, p16INK4a, and GATA4 when compared with kidneys from patients with minimal change disease, where there was no kidney fibrosis.
Associated with decreased interstitial fibrosis among mice with Brca1 heterozygous or homozygous Δ11 deletion, there was less tubular RAD51 expression and nuclear localization. As BRCA1 plays an important role in HR-mediated DNA damage repair in cancer cells, our data are consistent with an essential role for tubular repair by HR. A RAD51 small molecule inhibitor (B02), which inhibits HR, was associated with increased apoptosis following cisplatin treatment. Thus, cellular processes involved with HR, potentially facilitated by BRCA1 and RAD51, are implicated in reduced apoptosis and G2/M checkpoint activation when BRCA1 is intact.
To investigate the role of DNA damage associated with BRCA1 activation in PTCs, we used two different proximal tubule cell lines (HKC8 and HK2 cells) and two different toxicants, cisplatin and AA. Cisplatin is a nephrotoxic agent that has human relevance as patients treated with cisplatin frequently develop AKI. Thus, cisplatin treatment in in vitro systems offers an excellent tool for studying AKI. Like cisplatin, we found that AA also causes DNA damage in cells. AA or cisplatin stimulation of human primary PTCs in vitro increased BRCA1 phosphorylation, which correlated with growth arrest markers (pp53 and p21). A reduction in BRCA1 led to a decrease in the number of PTCs in G2/M cell cycle arrest and a reduction in the secretion of profibrotic cytokines, including IL-6, Shh and TGFβ1, each of which is implicated in the development of kidney fibrosis (Sato et al., 2003). The reduction in IL-6 might also alter the immune infiltrate. Our data show that CM from AA-treated epithelial cells, expressing an shRNA that reduced full-length BRCA1 protein expression, activated mouse 10T1/2 pericyte-like cells less and resulted in less production of Fn and α-SMA when compared with 10T1/2 cells exposed to CM from AA-treated epithelial cells expressing control shRNA.
It has been shown that heterozygous Brca1 inactivation results in genomic instability in non-tumorigenic human breast epithelial cells in vitro and in vivo with increased sensitivity to genotoxic stress associated with exposure to agents known to cause DNA damage (Konishi et al., 2011). These cells also have impaired homology-mediated repair mechanisms. This may lead to defective repair, inefficient removal of irreversibly damaged DNA, and facilitation of cell death rather than a senescent fate. Our results indicate that full-length BRCA1 is associated with decreased cell apoptosis after IRI and AA toxicity in vivo and AA/cisplatin toxicity in vitro. If the severely damaged cells were removed, a more adaptive repair process might be expected to occur. Instead, the damaged cells remain and are blocked at the BRCA1-activated G2/M checkpoint; express more p53, p21, and p16INK4a, GATA4, and SA-β-Gal; become more senescent; and generate more profibrogenic cytokines and growth factors. The increased apoptosis seen in Brca1+/Δ11 or Brca1Δ11/Δ11 mice may confer an adaptive advantage, resulting in the removal of cells that might otherwise generate profibrotic cytokines (Baker et al., 2011, 2016). Thus, the reduction of BRCA1 is protective against the development of kidney fibrosis after acute injury, which identifies functional reduction strategies of Brca1 as a new potential therapeutic approach. This would have to be done with a concern about predisposition to cancer since reduced function of BRCA1 in patients with BRCA1 mutations is associated with increased cancer risk. It is possible, however, that shorter-term inhibition of function in a postinjury state would not be associated with increased risk for malignancy. Furthermore, loss of heterozygosity of the WT allele of BRCA1 is the most frequent association with cancer, and this may not occur with an inhibitor (Santana Dos Santos et al., 2022).
In conclusion, we have identified a novel role for BRCA1 in the PTC DNA damage response and maladaptive repair leading to kidney fibrosis through upregulation of cellular senescence. This role of BRCA1 in inducing kidney fibrosis is distinctly different from its traditional protective role in breast and ovarian carcinogenesis. Short-term pharmacologic inhibition of BRCA1-mediated pathways in the proximal tubule after acute injury may alleviate kidney fibrosis after tubular injury as a senolytic approach to clear or prevent the accumulation of senescent cells and decrease the progression of CKD.
Materials and methods
Human specimens
Human kidney biopsy specimens from patients with fibrotic CKD or patients without CKD with minimal change disease were obtained from the Brigham and Women’s Hospital Pathology Department.
Mice
Brca1Δ11 mutant mice used for these studies were male C57BL/6, aged 8–10 wk and weighing 20–22 g, obtained from Dr. Chuxia Deng at the National Cancer Institute, Bethesda, MD, USA. Slc34a1-GFPCreERT2 C57BL/6 mice aged 8–10 wk were obtained from Benjamin Humphreys (Washington University, St. Louis, MO, USA). Animals were fed ad libitum and housed at constant ambient temperature using a 12-h light cycle. WT control mice used are the age and gender-matched littermates.
Conditional proximal tubule deletion of Brca1 exon 11
Brca1 Δ11flox/Δ11flox mice were crossed with Slc34a1-CreERT2 (Slc34a1GCE/+) mice (Myakala et al., 2014), followed by backcrossing the F1 with Brca1Δ11flox/Δ11flox mice. We generated male Cre-inducible Brca1 WT Slc34a1GCE/+; Brca1+/+ mice (Brca1+/+), Brca1 heterozygote Slc34a1GCE/+; Brca1+/floxΔ11 mice (Brca1+/floxΔ11), and BRCA1 homozygote Slc34a1GCE/+; Brca1floxΔ11/floxΔ11 mice (Brca1floxΔ11/floxΔ11). Mice were genotyped using the Kappa Biosystem genotyping kit as per the manufacturer’s instructions with modifications in annealing temperatures for specific primers, as shown in Table S1. Tamoxifen was dissolved in 3% (vol/vol) ethanol containing corn oil (Sigma-Aldrich). Slc34a1GCE expression was upregulated before and after tamoxifen injection by feeding mice with a low-phosphorus (0.06%) diet (Test Diet). Following activation of the Cre recombinase with intraperitoneal administration of tamoxifen 100 mg/kg body weight to adult (8–10-wk-old) mice on days −18, −16, and −14, mice were exposed on day 0 to either BIRI or AA (sodium salt purchased from Sigma-Aldrich). AA was administered intraperitoneally. Littermate controls were compared in all cases.
Animal surgery and chemical administration
We chose BIRI and AA models of CKD. Both of these experimental models have human relevance; AA is a human kidney toxin that was found to cause CKD in humans after oral injestion, and BIRI models ischemia which is common etiology of AKI in humans. As previously described (Yang et al., 2010), ischemia was induced by the bilateral retroperitoneal approach on both kidneys for 26 min at 37°C. One milliliter of warm saline (37°C) was injected into the peritoneum after surgery for volume supplementation. Sham operations were performed with surgical exposure of both kidneys but without induction of ischemia. Acute AA nephropathy was induced by a one-time intraperitoneal injection of AA (5 mg per kg body weight) in PBS. The normal control mice were administered the same amount of PBS. Blood samples and kidney tissues were collected 28 days after BIRI or 14 days after AA. Mice were perfused with PBS and tissues were used for histology and molecular analysis. Six to eight mice per group were used for the above experiments. Three to five mice were used for molecular analysis.
Histological analysis
Mouse kidneys were fixed in 4% paraformaldehyde, paraffin-embedded, and 4-μm sections were obtained and stained with specific primary and secondary antibodies or Picrosirius red. Quantitation of Picrosirius red staining was performed by setting up a threshold to detect the gray value of the red stain, and fold changes were calculated with respect to WT littermate mice.
Interstitial fibrosis and tubular atrophy (IFTA) scoring
A score for IFTA was performed by histological evaluation of stained kidney sections under 200× magnification using light microscopy. The scores ranged from 0 to 4, where 0 is no IFTA and 4 is severe IFTA.
Immunohistochemical (IHC) staining and quantitation
IHC staining was performed on paraffin-fixed human and mouse kidney sections. Briefly, kidney sections were deparaffinized using two washes of 100% xylene and a 1:1 mixture of xylene and ethanol, followed by rehydration of samples using the following: 100% ethanol, 95% ethanol, 70% ethanol, 50% ethanol, and water, each for 3 min. Samples were treated with 20 μg/ml proteinase K (cat. no. P2308-5MG; Millipore Sigma) for 10 min at 37°C. Samples were washed with phosphate buffered saline (PBS) with 0.1% Triton X100 (PBST) and blocked with 2% normal donkey serum for 1 h. Primary antibodies diluted in 1% BSA in phosphate buffered saline with Triton X100 (PBST) (1:100) were added and incubated at 4°C overnight. Samples were washed twice with PBST, incubated with 0.3% H2O2 for 15 min and washed thrice with PBST. HRP-conjugated secondary antibodies (1:1,000) were added in 1% BSA in PBST, incubated at room temperature for 1 h, and washed thrice with PBS. 0.05% of 3,3′ diaminobenzidine was added on the tissue sections and incubated at room temperature while observing the color development. The slides were with water and dehydrated using alcohol (95%, 95%, 100%, and 100%) for 3 min each. Sections were washed with xylene and mount using Permount mounting medium (cat. no. SP15–100; Thermo Fisher Scientific). Images were captured using a Nikon 90i microscope with a 20× magnification lens.
Quantitation of IHC was performed using Image J software by quantitating the gray value of the images and plotting them normalized to control samples after setting up a threshold. The image masks were created to detect the glomerulus and tubules by defining the threshold to detect each segment, and then gray values were measured. Fold changes with respect to control were calculated and plotted.
BrdU cell proliferation assay in vivo
In each mouse group in which cell cycle analysis was performed, all mice received an intraperitoneal injection of BrdU (10 mg/ml in PBS, 100 mg/kg body weight) 2 h prior to sacrifice as previously described (Ajay et al., 2012; Yang et al., 2010).
Cell culture
Patient-derived PTCs were cultured in DMEM-F12 medium containing 5% FBS, insulin transferrin selenium (ITS) (Sigma-Aldrich), EGF (10 ng/ml; Peprotech), and hydrocortisone (20 ng/ml; Sigma-Aldrich) until reaching 80% confluency. Once confluency was obtained, PTCs were placed in DMEM-F12 + 2% FBS and incubated with either AA (30 µM; Sigma-Aldrich) or cisplatin (25 µM; Sigma-Aldrich) for 48 h. HK2 human PTCs and 10T1/2, a mouse pericyte cell line, were obtained from ATCC and cultured in DMEM and basal medium eagle (BME) containing 10% FBS, respectively. HKC8 human PTCs were cultured in DMEM-F12 medium supplemented with 10% FBS until the cells were 80% confluent. HK2 or HKC8 cells were then incubated in either DMEM or DMEM-F12 medium containing 2% FBS for 24 h and treated with either AA (5 μg/ml) or cisplatin (25 µM) for 24 h. Cells were then washed three times with DMEM or DMEM-F12 and incubated for an additional 48 h with respective medium containing 1% BSA. This CM was collected for medium transfer experiments, and cells were collected by trypsinization for flow cytometry or lysed in 1× radioimmuno-precipitation assay buffer containing protease and phosphatase inhibitors for immunoblotting analysis. All in vitro experiments were performed in triplicates and repeated at least twice independently.
siRNA transfection
HKC8 or HK2 cells were plated and incubated overnight at 70–80% confluency. siRNA transfection was performed using Lipofectamine RNAi MAX reagent (Thermo Fisher Scientific) as per the manufacturer’s instructions. siRNA-targeting BRCA1 p220 (siCtrl, siBRCA1 #6 and siBRCA1 GUU, siBRCA1 CCA, or siBRCA1 Δ11b) were purchased from Dharmacon and were utilized as previously described (Hill et al., 2014). Briefly, 25 or 55 pmol of siRNA in 250 or 500 μl OPTIMEM were mixed with 7.5 or 17 μl of RNAiMAX in 250 or 500 μl OPTIMEM for 6-well or 60-mm plates, respectively. The siRNA and RNAiMAX solutions were mixed and incubated for 20 min at room temperature. siRNA and RNAiMAX complex were added dropwise to the cells. 6 h after transfection, cells were washed and treated with 5 μg/ml of AA and incubated for 24 h. After 24 h of AA treatment, cells were washed and incubated for an additional 48 h in a growth medium; immunofluorescence staining was performed. Cells without transfection and without AA treatment served as Ctrl. Cells were harvested for endpoint analyses to perform western blotting, RT-PCR, or immunostaining. Experiments were performed in triplicates and repeated at least two times.
Collection of conditioned medium (CM) and treatment
HKC8 or HK2 cells were transfected with siRNA as described above and treated with AA for 24 h. Cells were then washed three times with DMEM or DMEM-F12 and incubated for an additional 48 h in a culture medium containing 1% BSA. This medium was collected as the CM. The Ctrl CM was collected from cells without AA treatment and without siRNA transfection at the same incubation time. The CM was used for medium transfer experiments. 10T1/2 cells were plated and allowed to attach overnight. The next day, cells were washed three times with PBS, and CM were added and incubated for 48 h. Cells were harvested for RT-PCR or immunofluorescence staining.
3-[4, 5-dimethylthiazol-2-yl]-2, 5-diphenyltetrazolium bromide (MTT) assay for cell viability
MTT assay was performed as previously described (Ajay et al., 2014). Briefly, stable cells expressing either control or BRCA1 shRNA were seeded in 96-well plates and allowed to attach for 24 h. Cells were then treated with cisplatin and incubated for a further 22 h with fresh medium. MTT (0.5 mg/ml) was added and incubated in dark at 37°C for 2 h. MTT was removed, and 100 μl of di-methyl-sulfoxide per well was added to stop the reaction. Absorbance was read at 570 nm using an automatic plate reader.
Trypan blue dye exclusion assay
Cells were plated in a 6-well plate and transfected with siRNA, washed 6 h after transfection, and incubated for 96 h. Cells were then trypsinized and counted using an automated cell counter at 24- and 96-h time points. Cells excluding trypan blue stain were considered viable cells.
BrdU incorporation assay in vitro
BrdU incorporation assay in cultured cells was performed as per the manufacturer’s protocol (Abcam). Briefly, 5,000 cells were plated in a 96-well plate and transfected with the siRNAs using RNAiMax (Life Technologies). Cells were washed 6 h after transfection and incubated for 94 h. Then, BrdU was added and incubated for 2 h. Cells were fixed, and the anti-BrdU antibody was added and incubated at room temperature for 30 min. After washing, anti-mouse peroxidase IgG was added, and the washing was repeated. 3,3′,5,5′-tetramethylbenzidine substrate was added and incubated in the dark for 30 min at room temperature. The reaction was stopped with the stop solution, and the plate was read at 450 nm. Cell counts were normalized to Ctrl number as 100% proliferation.
SA-β-Gal staining
Ice-cold PBS-perfused unfixed kidneys were obtained from mice as previously described (Noren Hooten and Evans, 2017). Kidneys were placed in 4% paraformaldehyde for 3–4 h and then transferred into a solution containing 30% sucrose overnight. Kidneys were transferred into optimal cutting temperature compound and flash frozen with dry ice. 5–7-μm cryosections were obtained and washed in PBS, placed in fixative solution (Cell Signaling Technology), and then incubated at 37°C for 12–16 h with fresh 5-bromo-4-chloro-3-indolyl β-D-galactosidase (X-Gal, 1 mg of per ml) solution (20 mg of dimethylformamide per ml, 40 mM citric acid/sodium phosphate, pH 6.0, 5 mM potassium ferrocyanide, 5 mM potassium ferricyanide, 150 mM NaCl, and MgCl2). Coverslips were placed on slides with glycerol.
Immunofluorescence staining and quantitation
Immunofluorescence staining of the kidney was performed on paraffin kidney sections (5-µm thick) as previously described (Yang et al., 2010). Briefly, the paraffin tissue sections were heated, rehydrated, and subjected to antigen retrieval, followed by the addition of specific primary antibodies. We used the following antibodies at indicated dilutions: rabbit antibody to Ki-67 (1:200; Vector labs), mouse antibody to BrdU-FITC (1:100; eBioscience), mouse antibody to pH3 (Ser10) (1:100; Abcam), rabbit antibody to GATA4 (1:100; Abcam), mouse antibody to α-SMA-Cy3 (1:100; Sigma-Aldrich), mouse antibody to 53BP1 (1:100; Millipore), rabbit antibody to BRCA1 (1:100; Cell Signaling Technology), and rabbit antibody to RAD51 (1:100; Abcam). The sections were then exposed to FITC or Cy3-labeled secondary antibodies (Jackson ImmunoResearch). The staining was examined with fluorescence microscopes (Nikon TE 1000 and Nikon C1 confocal) using 20×, 40×, or 60× objectives. For in vitro immunofluorescence staining of pBRCA1(S1524) in human patient-derived PTCs, a rabbit antibody to pBRCA1(S1524) (1:200; Cell Signaling) was used. Antibodies against pH3, γH2AX, GATA4, RAD51, and BRCA1 were used on HK2 and HKC8 cells.
For the quantitation of immunostaining, mean fluorescence intensity (MFI) was calculated using Image J software and normalized with total cell number by counting the DAPI-positive nuclei after setting up a threshold for the images. Image thresholds were set to remove the background from the calculation for counting the foci, and cells with four or more foci were considered positive cells. The tubules were counted manually, and the percentage of tubules positive for staining was calculated with respect to the total number of tubules.
Lotus tetragonolobus lectin (LTL) staining
For immunostaining of the proximal tubule brush border, kidney tissues were incubated with fluorescein-labeled LTL (cat. no. FL-1321-2; dilution 1:500; Vector Laboratories) for 1 h following secondary antibody incubation in DMEM in the dark and then washed with PBST before mounting.
RNA extraction, cDNA synthesis, and RT-PCR
RNA extraction was performed using Trizol reagent (cat. no. 15596026; Life Technologies), and cDNA was synthesized using High-Capacity cDNA Reverse Transcription Kit (cat. no. 4368814; Thermo Fisher Scientific) as per the manufacturer’s instructions. RT-PCR was performed using Fast SYBR Green Master Mix (cat. no. 4385612; Thermo Fisher Scientific ) at an annealing temperature of 57°C. The list of primers is shown in Table S2. Fold changes were calculated by ΔΔCt method and plotted as fold change after normalizing to Gapdh and with respect to control as shown previously (Ajay et al., 2014). Data are represented as mean ± SD.
Immunoprecipitation (IP) and western blot analysis
For IP HKC8 cells transfected were lysed in IP buffer (20 mM Tris-HCl pH 8.0, 137 mM NaCl, 10% glycerol, 1% NP-40, 2 mM EDTA) containing protease inhibitor cocktail as previously performed (Ajay et al., 2014). Briefly, thirty micrograms of lysates were kept as input. Total 1,000 μg protein was incubated overnight at 4°C with 4 μg of BRCA1 antibody (Cat. no. #50799; Cell Signaling Technology). 50 μl protein A/G agarose beads were washed thrice with IP buffer containing protease inhibitor cocktail and resuspended in final volume of 50 μl in IP buffer. Protein A/G agarose slurry was added to the samples and incubated for 2 h at room temperature. Beads were washed once with IP buffer; second wash with high salt IP buffer (500 mM NaCl) and third wash with IP buffer (all containing protease inhibitor cocktail). Immune complexes were eluted by adding 1X SDS loading dye and heating at 100°C and western blot was performed to detect BRCA1 proteins using anot-BRCA1 antibody (Cat. no. sc-135732; Santa Cruz Biotechnology). Rabbit IgG was used as control for IP. Cells or kidney tissues were processed, and lysates were prepared, separated by gel electrophoresis and transferred on to a polyvinylidene fluoride (PVDF or) as previously described (Yang et al., 2010). Polyvinylidene Fluoride (PVDF) or nitrocellulose membranes were incubated with one or more of the following primary antibodies: rabbit antibody to pp53(Ser15) (1:1,000; Cell Signaling); mouse antibody to total p53 (1:1,000; Santa Cruz), ERK2 (1:1,000; Cell Signaling); rabbit antibody to GATA4 or RAD51; mouse antibody to pH3, p16INK4a (1:1,000; Abcam); rabbit antibody to BRCA1 (1:1,000; Cell Signaling Technology) and mouse antibody to α-SMA conjugated to Cy3 (1:1,000; Sigma-Aldrich). Horseradish peroxidase–conjugated secondary antibodies were applied (1:5,000; Thermo Fisher Scientific), and enhanced chemiluminescence (Amersham Biosciences) was used to detect proteins. Rabbit antibodies to β-actin (1:10,000; Cell Signaling), ERK2 (1:1,000; Cell Signaling Technology), or GAPDH (1:10,000; Millipore Sigma) were used for loading controls on stripped membranes or gels run in parallel.
shRNA-mediated BRCA1 knockdown and generation of stable BRCA1 knockdown cells
shRNA lentiviral plasmids (pLKO.1) targeting BRCA1 were obtained from Addgene (catalog no. 8453). The shBRCA1 sequences used were as follows: 5′-TGATGGTCTTAAGGAACATCT-3′ (catalog no. TRCN0000010299) and 5′-CCTTTCATTCAGCCTTTAGAA-3′ (catalog no. TRCN0000194861). Virus titers were adjusted for maximal knockdown of BRCA1. Cells were selected using 1 μg/ml of puromycin for 48 h and cultured for 2–3 wk prior to experimentation in a puromycin-free medium.
FACS analysis for cell cycle distribution
Flow cytometry was performed using a MACSQuant Analyzer (Miltenyi Biotec) or FACSCalibur Analyzer (Becton Dickinson FACScan). HKC8 cells were collected after trypsinization, fixed with 70% ethanol, and then stained with PI (Sigma-Aldrich) according to the standard protocols. DNA content was determined with a FACS-Caliber analyzer. After staining with PI, the percentage of cells in the cell cycle’s G0/G1, S, or G2/M phase was analyzed with the FlowJo software.
Fluorescence in situ hybridization (FISH)
FISH was carried out on paraffin sections using RNAscope Multiplex Fluorescent Assay (Advanced Cell Diagnostics) according to the manufacturer’s instructions. Probes against exon 11 of the mouse Brca1 gene (bases 2159–3120 of NM_009764.3) were designed and ordered from RNAscope. The MFI of Brca1 exon 11 was normalized to the number of DAPI-positive cells to calculate the fold change. To calculate the percentage of LTL-positive PTCs in vivo with Brca1 exon 11 foci, a threshold was determined to detect four or more foci in WT kidneys, and the number of PTCs was counted by LTL staining.
Cell death assay
Apoptosis in kidney tissues was detected on paraffin sections by the in situ TUNEL method following the standard protocol (Roche). Briefly, tissue sections were deparaffinized, and following antigen retrieval using proteinase K, TUNEL mix was added and incubated for 1 h. Samples were washed thrice with PBST, and DAPI-containing medium was added, and images were acquired. The number of TUNEL-positive cells was counted using Image J software, and the percentage was calculated after counting the total number of cells by counting DAPI-positive cells.
Quantitation of IL-6 and shh from the cell culture medium
IL-6 and shh were quantitated using an ELISA kit from R&D Systems. Briefly, the cell culture medium was collected with and without cisplatin treatment following BRCA1 knockdown and was diluted 1:1 in the dilution buffer. ELISA was performed as per the manufacturer’s protocol (R&D Systems).
Statistical analyses
Analysis of variance was used to compare data among groups. Students’ t tests were used to determine a significant difference between the two groups. One-way ANOVA tests were applied to compare more than two groups. Unpaired t tests were performed using Welch’s correction. P values of ≤0.05 were considered significant. The results are presented as means ± SD.
Study approvals
All mouse studies were performed in accordance with the animal use protocol approved by the Institutional Animal Care and Use Committees of the Harvard Medical School and the Brigham and Women’s Hospital. Patient-consented kidney samples were obtained from the pathology core at the Brigham and Women’s Hospital, Boston, MA, USA, with approved Institutional Review Board from the Brigham and Women’s Hospital Committee for Human Research Protection Program.
Online supplemental material
Fig. S1 shows the generation of proximal tubular epithelial cell Brca1 exon 11 knockout mice. Fig. S2 shows the TUNEL and p16 staining in the Brca1 WT and heterozygous Brca1+/Δ11mice kidney without injury. Fig. S3 shows the time dependent changes in SCr levels in Brca1+/+, Brca1+/Δ11, and Brca1Δ11/Δ11 mice following AA- and BIRI-induced injury. Fig. S4 shows the immunostaining for Fn and its quantitation in Brca1+/+, Brca1+/Δ11, and Brca1Δ11/Δ11 mice following BIRI-induced fibrosis. Fig. S5 shows the cell cycle arrest and proliferation following shRNA-mediated BRCA1 knockdown in HKC8 cells. Table S1 shows the list of mouse genotyping primers used with their sequence, annealing temperature and PCR product size. Primers are for genotyping Brca1 allele and Cre recombinase. Table S2 shows the list of RT-PCR primers and their sequences for mouse and human samples to evaluate the gene expression.
Data availability
All the data in this article are available in the published article and its online supplemental material.
Acknowledgments
We thank Dr. Sarah Hill, Dana–Farber Cancer Institute, for her help with siRNA selection.
This work was supported by the National Institutes of Health (NIH) grants R37D39773 and R01DK072381 to J.V. Bonventre, the Ben J. Lipps research fellowship of the American Society of Nephrology to A.A. Akinfolarin, the NIH National Institute of Diabetes and Digestive Kidney Diseases 5T32DK007527–29 training grant to the Renal Division, Brigham and Women’s Hospital to A.A. Akinfolarin, and the Career Development Award from the American Heart Association, 19CDA34780005 to A.K. Ajay.
Author contributions: A.K. Ajay: conceptualization, data curation, formal analysis, funding acquisition, investigation, methodology, project administration, resources, software, supervision, validation, visualization, and writing—original draft, review, and editing. A.A. Akinfolarin: conceptualization, data curation, formal analysis, investigation, methodology, validation, visualization, and writing—original draft, review, and editing. C.C. Gifford: data curation, investigation, visualization, and writing—review and editing. V.S. Sabbisetti: conceptualization, formal analysis, investigation, methodology, supervision, visualization, and writing—review and editing. J.V. Bonventre: conceptualization, data curation, formal analysis, funding acquisition, investigation, methodology, project administration, resources, supervision, validation, visualization, and writing—review and editing.