Skip to Main Content
Skip Nav Destination
1-20 of 133
Follow your search
Access your saved searches in your account

Would you like to receive an alert when new items match your search?
Close Modal
Sort by
Journal Articles
Images
NK cells limit early stages of metastasis in ex vivo models of breast cancer.(A) Dot plot of GFP+ K14+ and K14− tumor cells stained for MHC class I expression. (B) Schema of hNK cell-tumor organoid coculture. Tumor organoids were isolated from dissected MMTV-PyMT mammary tumors, and hNK cells were isolated from the spleens of FVB/n mice. Tumor organoids were cultured alone or in coculture with hNK cells in collagen I gels. (C) Representative DIC images of MMTV-PyMT tumor organoids alone (top) or in coculture with hNK cells (bottom) at 0 and 24 h. Scale bar, 50 µm. (C′ and C″) Boxplots of inverse circularity (C′) and area fold change (C″) of MMTV-PyMT tumor organoids alone or in coculture with hNK cells. Error bars represent 5th to 95th percentile. ****, P < 0.0001 by Mann–Whitney U test. (D) Schema of hNK cell-tumor cluster coculture. Tumor clusters were isolated from dissected MMTV-PyMT mammary tumors, and hNK cells were isolated from the spleens of WT mice. Tumor clusters were cultured alone or in coculture with hNK cells in Matrigel. (D′) Representative DIC images of MMTV-PyMT tumor colonies alone (top) or in coculture with hNK cells (bottom) at 24 h. Scale bar, 50 µm. (D″) Quantification of normalized colony formation count from MMTV-PyMT tumor clusters cultured alone or in coculture with hNK cells. Colony count was normalized to control. Mean is represented; ***, P < 0.001 by Mann–Whitney U test.
Published: 09 July 2020
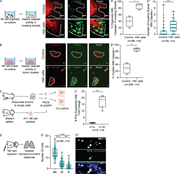
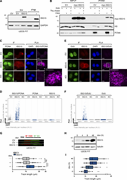
Figure 1. NK cells limit early stages of metastasis in ex vivo models of breast cancer. (A) Dot plot of GFP+ K14+ and K14 tumor cells stained for MHC class I expression. (B) Schema of hNK cell-tumor organoid coculture. Tumor organoids were More about this image found in NK cells limit early stages of metastasis in ex vivo models of breast cance...
Images
hNK cells limit invasion, growth, and colony formation in the C3(1)-Tag mouse model of breast cancer.(A) Representative DIC images of tumor organoids alone (top) or in coculture with hNK cells (bottom) at 0 and 24 h. Scale bar, 50 µm. (A′ and A″) Boxplot of inverse circularity of tumor organoids alone or in coculture with hNK cells (A′) and area fold change of tumor organoids alone or in coculture with hNK cells (A″). Error bars represent 5th to 95th percentile. **, P < 0.01; ***, P < 0.001 by Mann–Whitney U test. (B) Quantification of normalized colony counts from tumor clusters cultured alone or in coculture with hNK cells. **, P < 0.01 by Mann–Whitney U test.
Published: 09 July 2020
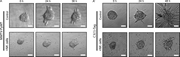
Figure S1. hNK cells limit invasion, growth, and colony formation in the C3(1)-Tag mouse model of breast cancer. (A) Representative DIC images of tumor organoids alone (top) or in coculture with hNK cells (bottom) at 0 and 24 h. Scale bar, 50 More about this image found in hNK cells limit invasion, growth, and colony formation in the C3(1)-Tag mou...
Images
hNK cells induce apoptosis in K14+ invasive breast cancer cells.(A) Representative confocal images of the invading strands of tumor organoids (mTomato+) and caspase activity (green) cultured alone (top) or in coculture with hNK cells (bottom). Scale bar, 10 µm. (A′ and A″) Boxplot of the percentage of organoids with caspase activity in invading strands per biological replicate (A′) and the total number of invading strands with caspase activity (A″) cultured alone or in coculture with hNK cells. *, P < 0.05; ****, P < 0.0001 by Mann–Whitney U test. (B) Representative confocal images of tumor clusters organoids (mTomato+) and caspase activity (green) cultured alone (top) or in coculture with hNK cells (bottom). Scale bar, 10 µm. (B′) Boxplot of the percentage of tumor clusters per biological replicate with caspase activity in tumor clusters cultured alone or in coculture with hNK cells. *, P < 0.05 by Mann–Whitney U test. (C) Schema for assessing IFNγ activity in hNK cells in response to coculture with K14+ or K14− tumor cells. hNK cells were taken from ROSAmT/mG mice and in coculture with K14+ or K14− cells from K14-actin-GFP;MMTV-PyMT mice. In this experiment, hNK cells were fluorescently labeled with mTomato and K14+ cells were labeled with GFP. (C′) Boxplot of IFNγ expression among hNK cells after coculture with K14+ and K14− cells and normalized to K14− cells. Error bars represent 5th to 95th percentile. ***, P < 0.001 by Mann–Whitney U test. (D) Schema for assessment of the innate immune response to an initial metastatic seed. Tumor clusters from the mammary tumors of K14-actin-GFP;MMTV-PyMT;ROSAmT/mG mice were injected into the tail veins of immunocompetent mice, and the lung microenvironment was assessed after 6 h. (D′) Boxplot of the number of NK cells, macrophages, and neutrophils around a metastatic seed. Error bars represent 5th to 95th percentile. ***, P < 0.001; ****, P < 0.0001 by Kruskal–Wallis test. (D″) Representative slide scanned images of lung tissue field of view containing a K14+ (green), metastatic seed (magenta), surrounded by NK cells (NK1.1, white). Scale bar, 20 µm.
Published: 09 July 2020
Figure 2. hNK cells induce apoptosis in K14+ invasive breast cancer cells. (A) Representative confocal images of the invading strands of tumor organoids (mTomato+) and caspase activity (green) cultured alone (top) or in coculture with hNK cells More about this image found in hNK cells induce apoptosis in K14+ invasive breast cancer cells....
Images
hNK cells induce caspase activity in K14+ invasive cells, and hNK cell cytotoxicity can be increased by using a CD44 antibody specific to K14+ cells.(A and B) Representative confocal images of tumor organoids (A) and tumor clusters (B) stained for caspase activity (green) and K14 (white) among tumor organoids cultured alone (top) or in coculture with hNK cells (bottom). Scale bar, 10 µm. (C) Representative confocal images of staining tumor cell clusters for CD44 and K14. Scale bar, 10 µm. (D) Schema for the ADCC assay. Tumor clusters were isolated from MMTV-PyMT mammary tumors and incubated with a CD44 antibody before being in coculture with hNK cells at a reduced ratio of 10 NK cells to 1 tumor cell. (D′) Boxplot of the normalized colony count. Error bars represent 5th to 95th percentile. ns, not significant; *, P < 0.05; ***, P < 0.001 by Mann–Whitney U test.
Published: 09 July 2020
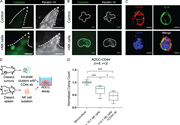
Figure S2. hNK cells induce caspase activity in K14+ invasive cells, and hNK cell cytotoxicity can be increased by using a CD44 antibody specific to K14+ cells. (A and B) Representative confocal images of tumor organoids (A) and tumor clusters More about this image found in hNK cells induce caspase activity in K14+ invasive cells, and hN...
Images
Quantification of macrophage and neutrophil response to early metastatic seeds in the lungs.(A) Schema for assessment of the innate immune response to an initial metastatic seed. Tumor clusters from the mammary tumors of K14-actin-GFP;MMTV-PyMT;ROSAmT/mG mice were injected into the tail veins of immunocompetent mice, and the lung microenvironment was assessed for macrophages and neutrophils after 6 h. (B) Representative slide scanned images of early metastatic seeds staining for F4/80 (macrophages, white) and neutrophil-elastase (neutrophils, white) around K14+ (green) metastatic seeds (magenta). Scale bar, 20 µm. (C) Schema for the control experiment in which PBS was injected into immunocompetent host mice, and the lung microenvironment was assessed for macrophages and neutrophils after 6 h. (D) Representative slide scanned images of staining for NK1.1 (NK cells, white), F4/80 (macrophages, white), and neutrophil-elastase (neutrophils, white) around tumor clusters. Scale bar, 20 µm.
Published: 09 July 2020
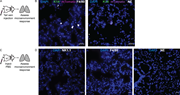
Figure S3. Quantification of macrophage and neutrophil response to early metastatic seeds in the lungs. (A) Schema for assessment of the innate immune response to an initial metastatic seed. Tumor clusters from the mammary tumors of More about this image found in Quantification of macrophage and neutrophil response to early metastatic se...
Images
Breast cancer organoids are able to overcome hNK cell cytotoxicity over time in 3D culture.(A and A′) Representative tumor organoids isolated from MMTV-PyMT (A) and C3(1)-Tag (A′) mice placed in 3D collagen I alone (top) or in coculture with hNK cells from FBV/n mice (bottom). Although hNK cells are initially able to limit tumor organoid invasion in both models at 24 h, by 36–48 h, tumor organoids are able to invade despite hNK cell activity. Scale bar, 50 µm.
Published: 09 July 2020
Figure S4. Breast cancer organoids are able to overcome hNK cell cytotoxicity over time in 3D culture. (A and A′) Representative tumor organoids isolated from MMTV-PyMT (A) and C3(1)-Tag (A′) mice placed in 3D collagen I alone (top) or in More about this image found in Breast cancer organoids are able to overcome hNK cell cytotoxicity over tim...
Images
teNK cells promote colony formation.(A) Schema for teNK cell-tumor organoid coculture. (A′) Boxplot of tumor organoid invasion strands of tumor organoids cultured alone or in coculture with teNK cells. Error bars represent 5th to 95th percentile. ns, not significant by Mann–Whitney U test. (B) Schema for teNK cell-tumor cluster coculture. (B′) Normalized colony count of tumor clusters cultured alone or in coculture with teNK cells. Mean with SEM is represented. **, P < 0.01 by Mann–Whitney U test. (B″) Normalized colony count of tumor clusters cultured alone or in coculture with tiNK cells. Mean with SEM is represented. *, P < 0.05 by Mann–Whitney U test. (C) Schema for generating ceNK cells. (C′) Normalized colony count of MMTV-PyMT tumor clusters cultured alone or in coculture with ceNK cells. Mean with SEM is represented. **, P < 0.01 by Mann–Whitney U test. (D) Normalized colony count of MCF-7 cell clusters cultured alone or in coculture with ceHuNK cells. Mean with SEM is represented. **, P < 0.01 by Mann–Whitney U test. (E) Schema of the adoptive transfer of NK cells following a tail vein injection of cancer cells. (E′) Representative whole-lung images. Macrometastases were identified based on their mTomato expression. Scale bar, 4 mm. (E″) Boxplot of the number of lung macrometastases. Error bars represent 5th to 95th percentile. *, P < 0.05; ****, P < 0.0001 by Kruskal–Wallis test. (F) Heat map displaying z-scores for the variance-stabilized transform of gene expression for differentially expressed genes with absolute value of log2(fold change) >1 between hNK cells and teNK cells. Hierarchical clustering was used to order the genes. (G) Waterfall plot of genes associated with an active and resting NK cell phenotype, expressed by teNK cells and hNK cells. (H) Gene ontology enrichment analysis in “biological process” category for differentially expressed genes up- and down-regulated by teNK cells. Four categories with the lowest P value related to the immune system, metabolic processes, apoptosis, and proliferation are displayed.
Published: 09 July 2020
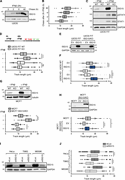
Figure 3. teNK cells promote colony formation. (A) Schema for teNK cell-tumor organoid coculture. (A′) Boxplot of tumor organoid invasion strands of tumor organoids cultured alone or in coculture with teNK cells. Error bars represent 5th to More about this image found in teNK cells promote colony formation. (A) Schema for teNK cell-tumor organ...
Images
RNA-seq analysis of hNK cells and teNK cells reveals differences in identity and biological processes. Receptor–ligand analysis of hNK cells and K14+ or K14− cells reveals interactions between NK cells and cancer cells. Treatment with DNMT inhibitors alter gene expression of inhibitory receptors. (A) Schema for RNA-seq analysis of hNK cells and teNK cells. (B) Gene ontology enrichment analysis in “biological process” category for genes differentially expressed between hNK and teNK cells. 30 categories with the lowest P value associated with up- or down-regulated teNK cells are displayed. (C and C′) Network representation of total receptor–ligand pairs between hNK cells (C) or teNK cells (C′) and K14+ or K14− cells as identified by the databases included in the iTalk algorithm. (D) Relationship map of receptor–ligand pairs of hNK cells and K14+ or K14− cells as identified by the databases included in the iTalk algorithm. (E) Treatment of teNK cells with azacitidine or decitabine alters gene expression of TIGIT and KLRG1 by qPCR. Because of logistical constraints during the COVID-19 pandemic, the assays were able to be conducted only twice and once, respectively.
Published: 09 July 2020
Figure S5. RNA-seq analysis of hNK cells and teNK cells reveals differences in identity and biological processes. Receptor–ligand analysis of hNK cells and K14+ or K14 cells reveals interactions between NK cells and cancer cells. Treatment with More about this image found in RNA-seq analysis of hNK cells and teNK cells reveals differences in identit...
Images
The teNK cell phenotype can be reversed.(A) Heat map of z-scores of gene expression by hNK cells and teNK cells of genes related to NK cell inhibitory signaling. Hierarchical clustering was used to order the genes. (B) Relationship map of receptor-ligand pairs between teNK cells and K14+ or K14− cells as identified by the iTalk algorithm. (C–E) Normalized colony count from antibody-treated control assays and teNK cell–MMTV-PyMT tumor cluster coculture assays. Mean with SEM is represented. ns, not significant; *, P < 0.05; **, P < 0.01; ***, P < 0.001 by Kruskal–Wallis test.
Published: 09 July 2020
Figure 4. The teNK cell phenotype can be reversed. (A) Heat map of z-scores of gene expression by hNK cells and teNK cells of genes related to NK cell inhibitory signaling. Hierarchical clustering was used to order the genes. (B) Relationship More about this image found in The teNK cell phenotype can be reversed. (A) Heat map of z-scores of gene...
Images
Pretreatment of teNK cells with FDA-approved DNMT inhibitors neutralizes the teNK cell phenotype.(A) Heat map of z-scores of gene expression by hNK cells and teNK cells of genes related to DNMTs. Hierarchical clustering was used to order the genes. (B) Schema of pretreatment of teNK cells before coculture with tumor clusters. (C) Normalized colony count from DMSO control or DNMT inhibitor pretreated teNK cell–MMTV-PyMT tumor cluster coculture assays versus monoculture controls. Mean with SEM is represented. n.s., not significant; *, P < 0.05; **, P < 0.01; ****, P < 0.0001 by Mann–Whitney U test. (D and E) Normalized colony count from DMSO or DNMT inhibitor pretreated teNK cells and antibody treated monoculture control assays and teNK cell–tumor cluster coculture assays. Mean with SEM is represented. *, P < 0.05; **, P < 0.01 by Mann–Whitney U test.
Published: 09 July 2020
Figure 5. Pretreatment of teNK cells with FDA-approved DNMT inhibitors neutralizes the teNK cell phenotype. (A) Heat map of z-scores of gene expression by hNK cells and teNK cells of genes related to DNMTs. Hierarchical clustering was used to More about this image found in Pretreatment of teNK cells with FDA-approved DNMT inhibitors neutralizes th...
Journal Articles
Images
ISG15 localizes at the DNA replication forks and accelerates replication fork progression.(A) ISG15 immunoblot on protein extracts of U2OS FIT cells bearing EV or FLAG-ISG15, induced with doxycycline (dox; 1 µg/ml) for 48 h, and in parental U2OS treated with IFN-β (30 U/ml for 2 h) and chased in medium without IFN-β for 46 h before lysis. GAPDH immunoblotting is used to normalize protein loading. (B) Analysis of proteins associated with nascent DNA, isolated by iPOND. HEK293T cells transfected with EV or myc-ISG15 for 24 h were pulse-labeled with EdU for 10 min and then chased with thymidine for 60 min. Immunoblotting with the indicated antibodies reveals the presence of ISG15 on chromatin (H3-positive fraction) and at the replication forks (H3- and PCNA-positive fraction). (C) Representative images of ISG15 colocalization with PCNA (ISG15/PCNA), as revealed by PLA. Immunofluorescence (IF) shows protein expression and cellular distribution of ISG15 and PCNA in U2OS FIT cells (treated with 1 µg/ml doxycycline for 48 h). Scale bars, 10 µm. (D) QIBC shows the distribution of PLA foci counts of samples described in C. For each condition, images containing ≥1,000 cells per experiment were acquired (n = 3). (E) Representative images of ISG15 colocalization with newly synthesized DNA (ISG15/EdU), labeled by the nucleotide analogue EdU (1 µM, 8 min), as revealed by PLA. Immunofluorescence (IF) shows cellular distribution of ISG15 and EdU in U2OS FIT cells (treated with 1 µg/ml doxycycline for 48 h). Scale bars, 10 µm. (F) QIBC shows the distribution of PLA foci counts of samples described in E. For each condition, images containing ≥1,000 cells per experiment were acquired (n = 3). (G) Top: DNA fibers labeling strategy and representative image. Bottom: Analysis of IdU track length measurements in U2OS FIT cells expressing EV or FLAG-ISG15 (treated with 1 µg/ml doxycycline for 48 h). At least 100 tracks were scored per sample (n = 5). Vertical lines represent the median value, and boxes and whiskers show 10–90th percentiles. Statistical analysis according to Mann–Whitney test; ns, not significant; ****, P < 0.0001. (H) FLAG-ISG15 expression in U2OS FIT cells after induction with 1 µg/ml doxycycline for the indicated time points. (I) Analysis of IdU track length measurements in U2OS FIT cells upon ISG15 induction as in H. At least 100 tracks were scored per sample (n = 3).
Published: 29 June 2020
Figure 1. ISG15 localizes at the DNA replication forks and accelerates replication fork progression. (A) ISG15 immunoblot on protein extracts of U2OS FIT cells bearing EV or FLAG-ISG15, induced with doxycycline (dox; 1 µg/ml) for 48 h, and in More about this image found in ISG15 localizes at the DNA replication forks and accelerates replication fo...
Images
ISG15 localizes at the DNA replication forks and accelerates replication fork progression.(A) Schematic representation of the pipeline followed for the generation of CRISPR/Cas9-mediated ISG15 KO cell lines. (B) Analysis of ISG15 protein levels in 7 of the 42 single clones tested, obtained from the CRISPR/Cas9 KO in U2OS FIT cells. Clone D3 was selected and used for the following experiments (in the main text referred to as U2OS ISG15/KO). 50 µg cell extracts was analyzed by Western blotting as indicated. (C) Subcellular localization of ISG15 in U2OS FIT cells expressing EV or FLAG-ISG15 after 48 h induction with 1 µg/ml doxycycline. Indicated are the different fractions analyzed. (D) Quantification of PLA foci counts by automated microscopy (QIBC) of FLAG-ISG15 colocalization with PCNA (FLAG/PCNA) determined by PLA in U2OS FIT cells after induction with 1 µg/ml doxycycline for 48 h. For each condition, images containing ≥1,000 cells per experiment were acquired (n = 3). (E) U2OS FIT cells after doxycycline induction (1 µg/ml, 48 h) and grown in media supplemented with 10 µM EdU for 30 min before collecting and processing for FACS analysis. Left: DNA content (DAPI) and DNA synthesis, indicated by EdU incorporation (FITC) measured by FACS. Right: Quantification of EdU incorporation of cells in S phase. Similar results were obtained in at least one independent experiment. (F) Percentage of origin firing events in U2OS FIT expressing either the EV or FLAG-ISG15 after doxycycline induction (1 µg/ml, 48 h). Origin firing events were evaluated by fibers assay (IdU-CldU-IdU) scoring ≥200 DNA fibers per experiment; each point indicates a single experiment. The line connects values for EV and FLAG-ISG15 of the same experiment. (G) Graphical scheme of sister forks imaging by DNA fiber assay with representative image. (H) Sister forks symmetry plot in U2OS FIT cells after doxycycline induction (1 µg/ml, 48 h). U2OS FIT cells expressing EV were treated with CPT (50 nM, 1 h; EV + CPT) as a positive control for asymmetry. Each fork is described by the length of left and right IdU tracks. Red lines define a range of 30% difference between left and right tracks; left > right + 30% and right > left + 30% are considered asymmetric. Similar results were obtained in at least one independent experiment.
Published: 29 June 2020
Figure S1. ISG15 localizes at the DNA replication forks and accelerates replication fork progression. (A) Schematic representation of the pipeline followed for the generation of CRISPR/Cas9-mediated ISG15 KO cell lines. (B) Analysis of ISG15 More about this image found in ISG15 localizes at the DNA replication forks and accelerates replication fo...
Images
ISG15 expression levels impact on replication fork progression in different systems.(A) Time course of ISG15 expression in U2OS treated with IFN-β (30 U/ml, 2 h) and chased for the indicated time points before lysis. (B) Analysis of IdU track length measurements in U2OS cells treated with IFN-β as in A. At least 100 tracks were scored per sample (n = 3). (C) ISG15 protein levels in U2OS FIT cells carrying ISG15 WT or ISG15 KO treated with IFN-β (30 U/ml, 2 h) and chased for 46 h before lysis. Phosphorylated STAT1 (pSTAT1) reveals activation of IFN-β pathway. Immunoblot with STAT1 and GAPDH are used to normalize protein loading. (D) Top: DNA fiber–labeling strategy. Bottom: Analysis of IdU track length measurements in U2OS as in C. At least 100 tracks were scored per sample (n = 3). Vertical lines represent the median value, and boxes and whiskers show 10–90th percentiles. Statistical analysis according to Mann–Whitney test; ns, not significant; ****, P < 0.0001. (E) ISG15 immunoblot of parental U2OS FIT cells expressing EV or FLAG-ISG15 and U2OS FIT cells lacking the endogenous ISG15 (U2OS ISG15/KO) and reexpressing stably integrated EV or exogenous FLAG-ISG15 after 48 h induction with 1 µg/ml doxycycline. Western blot analysis reveals the expression of endogenous (black triangle) and exogenous (white triangle) ISG15. (F) Analysis of IdU track length measurements in U2OS as in (E). At least 100 tracks were scored per sample (n = 3). Vertical lines represent the median value, and boxes and whiskers show 10–90th percentiles. Statistical analysis according to Mann–Whitney test; ****, P < 0.0001. (G) Top: ISG15 expression in MCF7 cells carrying ISG15 WT or ISG15 KO treated with IFN-β (30 U/ml, 2 h) and chased for 46 h before lysis. Bottom: Analysis of IdU track length measurements. At least 100 tracks were scored per sample (n = 3). Vertical lines represent the median value, and boxes and whiskers show 10–90th percentiles. Statistical analysis according to Mann–Whitney test; ****, P < 0.0001; *, P < 0.05. (H) Top: ISG15 protein levels in MCF7 cells bearing the WT gene of ISG15 (MCF7) and cells lacking the endogenous ISG15 (MCF7 ISG15/KO) stably integrated with EV or FLAG-ISG15. Bottom: Analysis of IdU track length measurements. At least 100 tracks were scored per sample (n = 3). Vertical lines represent the median value, and boxes and whiskers show 10–90th percentiles. Statistical analysis according to Mann–Whitney test; ****, P < 0.0001; *, P < 0.05. (I)ISG15 knockdown (siISG15) 48 h after siRNA transfection in HeLa, T98G, and M059K cells. siLuc is used as control. (J) Analysis of IdU track length measurements as in I. At least 100 tracks were scored per sample (n = 3). Vertical lines represent the median value, and boxes and whiskers show 10–90th percentiles. Statistical analysis according to Mann–Whitney test; ****, P < 0.0001.
Published: 29 June 2020
Figure 2. ISG15 expression levels impact on replication fork progression in different systems. (A) Time course of ISG15 expression in U2OS treated with IFN-β (30 U/ml, 2 h) and chased for the indicated time points before lysis. (B) Analysis More about this image found in ISG15 expression levels impact on replication fork progres...

or Create an Account

Close Modal
Close Modal