
Skip Nav Destination
Close Modal


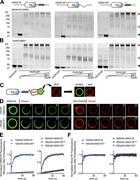
![Figure 3. hSNX16 generates membrane tubules via its CC region. (A) Representative single confocal slices of rhodamine PE–labeled GUVs (0%, 1% [30 nM], or 10% [300 nM] PI(3)P) incubated with 100 nM or 500 nM hSNX16 CC variants. Scale bars, 10 µm. (B) Percentage of tubulated vesicles at the indicated PI(3)P and hSNX16 concentrations. Quantification is from at least 20 GUVs per condition. (C) Negative-stain EM of liposomes incubated with buffer, hSNX1, or hSNX16 CC variants (2 µM final protein concentration). Two representative fields are shown for each condition. Scale bar, 400 nm.](https://cdn.rupress.org/rup/content_public/journal/jcb/218/8/10.1083_jcb.201811074/8/s_jcb_201811074_fig3.jpeg?Expires=2147483647&Signature=DzIvcoM3lisgK0rabkl-Vxyh7oCeoklhUTVg1jND9dGxMAtEMfRvIv0Ov-QX7Aa126mgj5QRcZR1XKWHtRPPhbvIGl1Lu5pSGfLRi-504etR0iLe~LmOg8yPxViJQJwN-pBK2HeEnXYl-GxpFJo9jF-hvMZCwiUdN~wlOCG6S688t~MPvRAxCUdZNXCNNVsLTvXm2w3hPCwiO0G~Hb0iQnNx3jfsT9b6H-oVlHf1U24Iura~69lkS0TzJXa8nJg3OVBzwP2NOzgNGJvIpUwpSmw05BWSCWGeiU3P-2FGbYNY6mJqqgxQonyau9hqO0c4Yr-MWTWCIM4yQQ0ZewJLxQ__&Key-Pair-Id=APKAIE5G5CRDK6RD3PGA)

![Figure 5. dSNX16 CC variants alter endosome structure, localization, and distribution in larval motor neurons. (A and B) Representative images of animals expressing indicated UAS-dSnx16-SNAP variants driven by VGlut-GAL4. Shown are muscle 4 NMJ, proximal axons (within 100 µm of the ventral ganglion), and MNISN-I cell bodies (motor neuron in the intersegmental nerve I [Choi et al., 2004a]; see Fig. S2 A for schematics). dSNX16ΔCC reduces and dSNX163A enhances dSNX16 punctate localization. dSNX163A levels are increased at the cell body and reduced at the NMJ. (B) dSNX16 localizes tubular structures at the cell body revealed by SIM. dSNX16ΔCC reduces and dSNX163A increases the quantity of tubulated SNX16 compartments. (C and D) CoV and mean intensity quantification of dSNX16-SNAPJF549. Quantification is from ≥20 NMJs, 42 axons, or 65 cell bodies and analyzed using a Kruskal–Wallis test followed by Dunn’s multiple comparisons test. Intensities were normalized to the mean intensity in the wild-type dSNX16 condition. All images show 2D maximum intensity projections of confocal stacks unless noted otherwise. Data are shown as box-and-whisker plots with all data points superimposed. *, P < 0.05; **, P < 0.01; ***, P < 0.001. Scale bars, 10 µm.](https://cdn.rupress.org/rup/content_public/journal/jcb/218/8/10.1083_jcb.201811074/8/s_jcb_201811074_fig5.jpeg?Expires=2147483647&Signature=vsKy1PSxl76UsQLLJywqbb84E~qSd~~CUIQEEhVSg4hM4rpVGAfKuLW5ow9xFkd1DLDPzbNyxGJFi5d6aZ~xwcenlQMipUpbyD8K9q-dCI4TiERo4IVx8miIKbUnz9Ma0KhVrCQEK12D2QGDMukz3m3ekkoYrrqiJCq884Kp7fyNGtb96psbmX00csTlazEdAyR5lk67T9podKD0BYAj60OClMel~3-00EFghMNqxn43~W~0-DVgiULfxkqCdPHl2~3Rh7jyNpLgtVAnmj3TDpSIhb6nSeDh1sOf~0sFqlUVnaWqRNmbOeH5S2O5TsxtVejyvWCmjImQmJsMy0dvog__&Key-Pair-Id=APKAIE5G5CRDK6RD3PGA)

1-20 of 129
Follow your search
Access your saved searches in your account
Would you like to receive an alert when new items match your search?
1
Journal Articles
In Special Collection:
Cellular Neurobiology
Journal:
Journal of Cell Biology
J Cell Biol (2019) 218 (8): 2677–2698.
Published: 01 July 2019
Includes: Supplementary data
in Synaptic neurexin-1 assembles into dynamically regulated active zone nanoclusters
> Journal of Cell Biology
Published: 01 July 2019
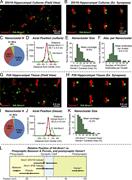
Figure 1. Schematic of the Nrxn1 cKI mice and impaired survival following constitutive truncation of Nrxn1. (A) Diagram of WT, HA-tagged full-length, and HA-tagged truncated Nrxn1α, Nrxn1β, and Nrxn1γ. Top: WT Nrxn1 proteins. Middle: Nrxn1 More about this image found in Schematic of the Nrxn1 cKI mice and impaired survival foll...
in Synaptic neurexin-1 assembles into dynamically regulated active zone nanoclusters
> Journal of Cell Biology
Published: 01 July 2019
Figure 2. Nrxn1 cKI mice express full-length HA-tagged Nrxn1 in the absence of Cre recombination, but truncated HA-tagged Nrxn1 after Cre recombination. (A) HA-tagged Nrxn1 exhibits a punctate surface-staining pattern in cultured hippocampal More about this image found in Nrxn1 cKI mice express full-length HA-tagged Nrxn1 in the ...
in Synaptic neurexin-1 assembles into dynamically regulated active zone nanoclusters
> Journal of Cell Biology
Published: 01 July 2019
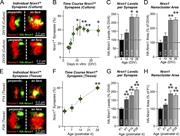
Figure 3. Super-resolution STORM imaging identifies synaptic Nrxn1 nanoclusters. (A) Representative image of cultured neurons at DIV18, showing multiple Homer1(+) synapses with a subset containing Nrxn1 nanoclusters. (B) Representative images More about this image found in Super-resolution STORM imaging identifies synaptic Nrxn1 nanoclusters. (A) ...
in Synaptic neurexin-1 assembles into dynamically regulated active zone nanoclusters
> Journal of Cell Biology
Published: 01 July 2019
Figure 4. Synaptic Nrxn1 nanoclusters are dynamic across development. (A) Example synapses illustrating the features of Nrxn1 nanoclusters in cultured neurons at DIV18 (top) and DIV26 (bottom), including central and peripheral localizations of More about this image found in Synaptic Nrxn1 nanoclusters are dynamic across development. (A) Example sy...
in Synaptic neurexin-1 assembles into dynamically regulated active zone nanoclusters
> Journal of Cell Biology
Published: 01 July 2019
Figure 5. Synaptic Nrxn1 nanoclusters are independent of HA-epitope tagging and contain other neurexins. (A) Labeling with a pan-neurexin antibody shows neurexin nanoclusters in DIV12 hippocampal neurons from Nrxn1 cKO mice that are not More about this image found in Synaptic Nrxn1 nanoclusters are independent of HA-epitope tagging and conta...
in Synaptic neurexin-1 assembles into dynamically regulated active zone nanoclusters
> Journal of Cell Biology
Published: 01 July 2019
Figure 6. Excitatory synapses containing Nrxn1 nanoclusters exhibit higher surface GluA1 levels and more active presynaptic vesicle exocytosis. (A) Representative synapses from HA-Nrxn1 cKI hippocampal neurons (DIV12) showing synapses without More about this image found in Excitatory synapses containing Nrxn1 nanoclusters exhibit higher surface Gl...
in Synaptic neurexin-1 assembles into dynamically regulated active zone nanoclusters
> Journal of Cell Biology
Published: 01 July 2019
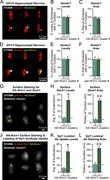
Figure 7. Nrxn1 is extensively cleaved across synaptic development in cultured neurons. (A) Cultured hippocampal neurons from HA-Nrxn1 cKI mice for defined DIV5–18 were analyzed by quantitative immunoblotting directly (cell lysates) or after More about this image found in Nrxn1 is extensively cleaved across synaptic development in cultured neuron...
in Synaptic neurexin-1 assembles into dynamically regulated active zone nanoclusters
> Journal of Cell Biology
Published: 01 July 2019
Figure 8. Nrxn1 is cleaved physiologically by proteolysis at approximately twice the rate of neuroligin-1. (A) Brain subcellular fractionation protocol to obtain the total homogenate (H) and to separate soluble proteins (S) from More about this image found in Nrxn1 is cleaved physiologically by proteolysis at approximately twice the ...
in Synaptic neurexin-1 assembles into dynamically regulated active zone nanoclusters
> Journal of Cell Biology
Published: 01 July 2019
Figure 9. ADAM10 is the major Nrxn1 sheddase in dissociated hippocampal and cortical cultures. (A) Experimental design of metalloprotease inhibition experiments. (B) Protease inhibitors used for experiments. (C) Immunoblot analysis of the More about this image found in ADAM10 is the major Nrxn1 sheddase in dissociated hippocampal and cortical ...
in Synaptic neurexin-1 assembles into dynamically regulated active zone nanoclusters
> Journal of Cell Biology
Published: 01 July 2019
Figure 10. ADAM10 inhibition dramatically enhances Nrxn1 nanocluster presence and content at excitatory synapses. (A) Representative 3D STORM images of Homer1(+) synapses with surface HA-Nrxn1 clusters visualized in hippocampal neurons treated More about this image found in ADAM10 inhibition dramatically enhances Nrxn1 nanocluster presence and cont...
Journal Articles
Higher-order assembly of Sorting Nexin 16 controls tubulation and distribution of neuronal endosomes
In Special Collection:
Cellular Neurobiology
Journal:
Journal of Cell Biology
J Cell Biol (2019) 218 (8): 2600–2618.
Published: 28 June 2019
Includes: Supplementary data
in Higher-order assembly of Sorting Nexin 16 controls tubulation and distribution of neuronal endosomes
> Journal of Cell Biology
Published: 28 June 2019
Figure 1. PI(3)P-dependent lipid binding of hSNX16 CC domain mutants. (A) Schematic of hSNX16 constructs. (B) Location of hSNX16 CC mutations on hSNX16 PX-CC dimer (PDB accession number 5GW0 ; Xu et al., 2017 ). CC domains are shown in green More about this image found in PI(3)P-dependent lipid binding of hSNX16 CC domain mutants. (A) Schematic ...
in Higher-order assembly of Sorting Nexin 16 controls tubulation and distribution of neuronal endosomes
> Journal of Cell Biology
Published: 28 June 2019
Figure 2. hSNX16 oligomerizes into higher-order assemblies on membranes via its CC domain. (A and B) hSNX16ΔCC reduces and hSNX163A promotes self-association compared with hSNX16WT on PI(3)P liposomes. 5 µM purified hSNX16, hSNX163A, or hSNX16 More about this image found in hSNX16 oligomerizes into higher-order assemblies on membranes via its CC do...
in Higher-order assembly of Sorting Nexin 16 controls tubulation and distribution of neuronal endosomes
> Journal of Cell Biology
Published: 28 June 2019
Figure 3. hSNX16 generates membrane tubules via its CC region. (A) Representative single confocal slices of rhodamine PE–labeled GUVs (0%, 1% [30 nM], or 10% [300 nM] PI(3)P) incubated with 100 nM or 500 nM hSNX16 CC variants. Scale bars, 10 µm. More about this image found in hSNX16 generates membrane tubules via its CC region. (A) Representative si...
in Higher-order assembly of Sorting Nexin 16 controls tubulation and distribution of neuronal endosomes
> Journal of Cell Biology
Published: 28 June 2019
Figure 4. hSNX16 CC mutants exhibit altered subcellular localization in vivo. hSNX16ΔCC reduces and hSNX163A enhances hSNX16 punctate localization in mammalian cells. (A) Representative images of cell body and neurites from immunostained DIV 7 More about this image found in hSNX16 CC mutants exhibit altered subcellular localization in vivo. hSNX16...
in Higher-order assembly of Sorting Nexin 16 controls tubulation and distribution of neuronal endosomes
> Journal of Cell Biology
Published: 28 June 2019
Figure 5. dSNX16 CC variants alter endosome structure, localization, and distribution in larval motor neurons. (A and B) Representative images of animals expressing indicated UAS-dSnx16-SNAP variants driven by VGlut-GAL4. Shown are muscle 4 NMJ, More about this image found in dSNX16 CC variants alter endosome structure, localization, and distribution...
in Higher-order assembly of Sorting Nexin 16 controls tubulation and distribution of neuronal endosomes
> Journal of Cell Biology
Published: 28 June 2019
Figure 6. dSNX16 CC variants regulate endosomal localization of Tkv to promote BMP signaling. (A) Quantification of the mean bouton number on muscle 4 in animals expressing VGlut-driven UAS-TkvQ199D and UAS-dSnx16-SNAP variants. (B) More about this image found in dSNX16 CC variants regulate endosomal localization of Tkv to promote BMP si...
1

