
Skip Nav Destination
Close Modal
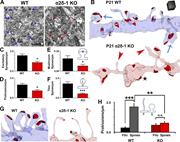


![Figure 6. TSP-induced synapse formation requires Rho GTPase Rac1. (A) Rat cortical neuron purification and TSP2 treatment timeline. (B) Rat cortical neurons transfected with a pX601 vector containing saCas9 and sgRNA identified by HA expression. The pX601-only control (top) did not include an sgRNA sequence. Neurons were treated with TSP2-containing or deficient growth media. Colocalized pre- (VGluT1) and postsynaptic (PSD95) puncta reveal sites of excitatory synapses (yellow arrowheads). (C) Excitatory synapse density on HA+ neurons (n = 30 cells per condition; two independent experiments). (D) GFP+ rat cortical neuron dendrites. After transfection with an shRNA-expressing vector (with a scrambled shRNA sequence [shScr] as a control), neurons were treated with TSP2-containing or -deficient growth media. Colocalized pre (Bassoon) and postsynaptic (Homer) puncta reveal sites of excitatory synapses (yellow arrowheads). (E) Excitatory synapse density on GFP+ neurons (n = 30 cells per condition; two independent experiments). Error bars represent SEM. (F and G) Same scheme as D and E except using shRNA against the Rho GEFs Kalirin-7, Tiam1, and β-Pix. One-way ANOVA with Tukey’s multiple comparisons post hoc test. Bars, 5 µm. *, P < 0.05; ***, P < 0.0001.](https://cdn.rupress.org/rup/content_public/journal/jcb/217/10/10.1083_jcb.201802057/5/s_jcb_201802057_fig6.jpeg?Expires=2147483647&Signature=u83sjioSknCri5-23~ndYcdi9r61qX6lrOoY7aCd7yJ9p5oIXrhxUj8tDHak-LxPoAaETzYRWE7-j6b3lTFCzp-HunyzpSuUPMU4LovTM6M6BMNSoODzrBQcGvq98njtnyWuAsUuQnePfnNXE~~xMvuDWz56yyBGM8nqdgmhdsntYFGYR7cK0N8MSBTB7gpmFvn-U2w-0uodUIT35tczSCQHEyAZws4auheNCAMbaEgmXZjiNEOJpp94oeyf1fdSUernltR2J2ir9jp3ELDMxekC3tDdkyawaeGQeOye6cu0lUqCA-ClR7kDlMe-0mOLcJtcc7nLRDkddRuAqCs~Hg__&Key-Pair-Id=APKAIE5G5CRDK6RD3PGA)


1-20 of 113
Follow your search
Access your saved searches in your account
Would you like to receive an alert when new items match your search?
1
Journal Articles
Journal:
Journal of Cell Biology
J Cell Biol (2018) 217 (10): 3747–3765.
Published: 27 July 2018
Includes: Supplementary data
in Thrombospondin receptor α2δ-1 promotes synaptogenesis and spinogenesis via postsynaptic Rac1
> Journal of Cell Biology
Published: 27 July 2018
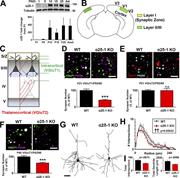
Figure 1. Impaired synaptic connectivity in α2δ-1–deficient cortex. (A) Top: Western blot of α2δ-1 expression from WT cortex and hippocampus from postnatal day (PND) 1 to adult. Tubulin: loading control. Bottom: α2δ-1 expression as fold change More about this image found in Impaired synaptic connectivity in α2δ-1–deficient cortex. (A) Top: Western...
in Thrombospondin receptor α2δ-1 promotes synaptogenesis and spinogenesis via postsynaptic Rac1
> Journal of Cell Biology
Published: 27 July 2018
Figure 2. Lack of α2δ-1 results in decreased excitatory synaptic function. (A) Recordings were made from LII/III pyramidal neurons in V1 at P21. (B) mEPSC traces from WT and α2δ-1 KO pyramidal neurons. (C and D) Frequency (C, left), More about this image found in Lack of α2δ-1 results in decreased excitatory synaptic function. (A) Recor...
in Thrombospondin receptor α2δ-1 promotes synaptogenesis and spinogenesis via postsynaptic Rac1
> Journal of Cell Biology
Published: 27 July 2018
Figure 3. Ultrastructural analysis reveals that α2δ-1 promotes synapse and spine maturation. (A) Electron micrographs from P21 V1 WT and α2δ-1 KO brains. Arrows, excitatory synapses. Bar, 1 µm. (B) ssEM 3D reconstructions of LI dendrites from More about this image found in Ultrastructural analysis reveals that α2δ-1 promotes synapse and spine matu...
in Thrombospondin receptor α2δ-1 promotes synaptogenesis and spinogenesis via postsynaptic Rac1
> Journal of Cell Biology
Published: 27 July 2018
Figure 4. α2δ-1 promotes synapse and spine development cell autonomously. (A) Schematic for in utero electroporation. (B) Confocal image of P21 V1. Cre+ neurons in LII/III express RTm. Dendrites were imaged in the S/Z. (C) Workflow for More about this image found in α2δ-1 promotes synapse and spine development cell autonomously. (A) Schema...
in Thrombospondin receptor α2δ-1 promotes synaptogenesis and spinogenesis via postsynaptic Rac1
> Journal of Cell Biology
Published: 27 July 2018
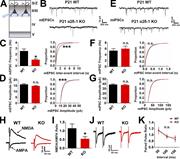
Figure 5. TSP stimulates synaptogenesis via postsynaptic α2δ-1. (A) Mouse cortical neuron purification and TSP2 treatment timeline. (B) Cortical dendrites from α2δ-1 Het or KO mouse pups. Cells were treated with TSP2-containing or deficient More about this image found in TSP stimulates synaptogenesis via postsynaptic α2δ-1. (A) Mouse cortical n...
in Thrombospondin receptor α2δ-1 promotes synaptogenesis and spinogenesis via postsynaptic Rac1
> Journal of Cell Biology
Published: 27 July 2018
Figure 6. TSP-induced synapse formation requires Rho GTPase Rac1. (A) Rat cortical neuron purification and TSP2 treatment timeline. (B) Rat cortical neurons transfected with a pX601 vector containing saCas9 and sgRNA identified by HA More about this image found in TSP-induced synapse formation requires Rho GTPase Rac1. (A) Rat cortical n...
in Thrombospondin receptor α2δ-1 promotes synaptogenesis and spinogenesis via postsynaptic Rac1
> Journal of Cell Biology
Published: 27 July 2018
Figure 7. Rac1 promotes synaptic development and spinogenesis downstream of α2δ-1. (A) Schematic for organotypic slice culture/biolistic transfection. GFP+ dendrites (blue) are imaged at high magnification by confocal microscopy to capture spine More about this image found in Rac1 promotes synaptic development and spinogenesis downstream of α2δ-1. (A...
in Thrombospondin receptor α2δ-1 promotes synaptogenesis and spinogenesis via postsynaptic Rac1
> Journal of Cell Biology
Published: 27 July 2018
Figure 8. α2δ-1 and Rac1 work in concert to rescue synapses and spines in α2δ-1–null cortex. (A) 3D confocal images (top) and Imaris reconstructions (bottom) of GFP+ dendrites in the S/Z of DEV19 (i.e., P21) organotypic slices from α2δ-1 Het or More about this image found in α2δ-1 and Rac1 work in concert to rescue synapses and spines in α2δ-1–null ...
in Thrombospondin receptor α2δ-1 promotes synaptogenesis and spinogenesis via postsynaptic Rac1
> Journal of Cell Biology
Published: 27 July 2018
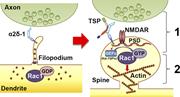
Figure 9. Model for α2δ-1’s dual role in promoting synapse and spine development. Early on, α2δ-1 is present on filopodia seeking contact with axonal partners. Rac1 is predominantly bound to GDP, rendering it inactive. After TSP binding, (1) More about this image found in Model for α2δ-1’s dual role in promoting synapse and spine development. Ea...
Published: 24 July 2018
Figure 1. Distribution and dynamics of actin blobs in dendrites. (A) Distribution of LifeAct (green) expressed by ppk-GAL4 in dendritic arbors of class IV da neurons marked by ppk-CD4-tdTomato (magenta). Arrows indicate high LifeAct signals in More about this image found in Distribution and dynamics of actin blobs in dendrites. (A) Distribution of...
Published: 24 July 2018
Published: 24 July 2018
Published: 24 July 2018
Published: 24 July 2018
Published: 24 July 2018
Published: 24 July 2018
Published: 24 July 2018
Published: 24 July 2018
Published: 24 July 2018
1

