
Skip Nav Destination
Close Modal


1-20 of 167
Follow your search
Access your saved searches in your account
Would you like to receive an alert when new items match your search?
1
Journal Articles
In Special Collection:
Cell Division 2018
Journal:
Journal of Cell Biology
J Cell Biol (2017) 216 (12): 4041–4052.
Published: 19 October 2017
Includes: Supplementary data
in SUMOylation of human septins is critical for septin filament bundling and cytokinesis
> Journal of Cell Biology
Published: 19 October 2017
Figure 1. Interaction between septins and the human SUMOylation machinery. (a) Schematic representation of a prototypical human septin protein (++, phosphoinositide-binding polybasic region; SUE, septin unique element). (b) Schematic More about this image found in Interaction between septins and the human SUMOylation machinery. (a) Schem...
in SUMOylation of human septins is critical for septin filament bundling and cytokinesis
> Journal of Cell Biology
Published: 19 October 2017
Figure 2. SUMOylation of human septins. (a) HeLa cells were cotransfected with WT His6-SUMO1, 2, or nonconjugatable (ΔGG) mutants and HA-tagged septins. Cell lysates were then subjected to denaturing His pull-down, and the presence of SUMOylated More about this image found in SUMOylation of human septins. (a) HeLa cells were cotransfected with WT Hi...
in SUMOylation of human septins is critical for septin filament bundling and cytokinesis
> Journal of Cell Biology
Published: 19 October 2017
Figure 3. Mapping of human septin SUMOylation sites. (a) Schematic representation of HA-tagged WT and mutant SEPT2, SEPT6, SEPT7, SEPT9, and SEPT11. Black arrowheads indicate K to R mutations (KRn, K to R mutant in all N-terminal lysines; KRn+m, More about this image found in Mapping of human septin SUMOylation sites. (a) Schematic representation of...
in SUMOylation of human septins is critical for septin filament bundling and cytokinesis
> Journal of Cell Biology
Published: 19 October 2017
Figure 4. Non-SUMOylatable septin variants form aberrant bundles. (a) Fluorescent light microscopy images of HeLa cells transfected with HA-tagged WT or non-SUMOylatable SEPT7 and SEPT11 variants. Cells were stained for HA-tagged septins More about this image found in Non-SUMOylatable septin variants form aberrant bundles. (a) Fluorescent li...
in SUMOylation of human septins is critical for septin filament bundling and cytokinesis
> Journal of Cell Biology
Published: 19 October 2017
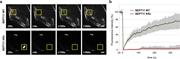
Figure 5. Role of SUMOylation in septin dynamics. HeLa cells were transfected with GFP-tagged WT or non-SUMOylatable (KRc) SEPT11, and GFP-labeled septin filaments were subjected to FRAP. (a) Representative images of fluorescence recovery for WT More about this image found in Role of SUMOylation in septin dynamics. HeLa cells were transfected with G...
in SUMOylation of human septins is critical for septin filament bundling and cytokinesis
> Journal of Cell Biology
Published: 19 October 2017
Figure 6. Role of septin SUMOylation in cell division. (a) Percentage of HeLa cells exhibiting multinucleation after transfection with a control plasmid (pCDNA.3; CTRL) or expression vectors for WT or mutant septins (mean from three to five More about this image found in Role of septin SUMOylation in cell division. (a) Percentage of HeLa cells ...
in SUMOylation of human septins is critical for septin filament bundling and cytokinesis
> Journal of Cell Biology
Published: 19 October 2017
Figure 7. Lack of septin SUMOylation interferes with late steps of cytokinesis. (a) Representative images from time-lapse microscopy analysis of HeLa cells expressing WT or non-SUMOylatable SEPT7. Images correspond to different cell division More about this image found in Lack of septin SUMOylation interferes with late steps of cytokinesis. (a) ...
in SUMOylation of human septins is critical for septin filament bundling and cytokinesis
> Journal of Cell Biology
Published: 19 October 2017
Figure 8. SUMO-deficient septin bundles localize at intercellular bridges during cell division. (a) Fluorescent light microscopy images of HeLa cells transfected with HA-tagged WT, non-SUMOylatable (KRc), or constitutively SUMOylated (KRcSUMO1) More about this image found in SUMO-deficient septin bundles localize at intercellular bridges during cell...
Journal Articles
In Special Collection:
Cell Division 2018
Journal:
Journal of Cell Biology
J Cell Biol (2017) 216 (11): 3463–3470.
Published: 22 September 2017
Includes: Supplementary data
Journal Articles
In Special Collection:
Cell Division 2018
Journal:
Journal of Cell Biology
J Cell Biol (2017) 216 (11): 3453–3462.
Published: 22 September 2017
Includes: Supplementary data
in The duration of mitosis and daughter cell size are modulated by nutrients in budding yeast
> Journal of Cell Biology
Published: 22 September 2017
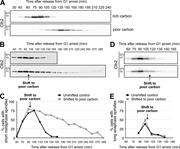
Figure 1. The duration of mitosis is modulated by nutrients. (A) Wild-type cells growing in YPD (rich carbon) or YPG/E (poor carbon) were arrested in G1 phase by addition of mating pheromone. The cells were released from arrest, and levels of More about this image found in The duration of mitosis is modulated by nutrients. (A) Wild-type cells gro...
in The duration of mitosis and daughter cell size are modulated by nutrients in budding yeast
> Journal of Cell Biology
Published: 22 September 2017
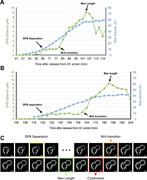
Figure 2. Simultaneous imaging of bud growth and mitotic spindle dynamics. (A and B) Representative growth curves for cells growing in rich carbon (A) or poor carbon (B). The volume of the daughter bud is plotted in blue, and the distance More about this image found in Simultaneous imaging of bud growth and mitotic spindle dynamics. (A and B)...
in The duration of mitosis and daughter cell size are modulated by nutrients in budding yeast
> Journal of Cell Biology
Published: 22 September 2017
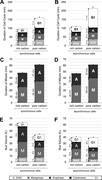
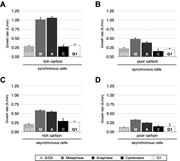
Figure 3. The duration of mitosis and cell size at completion of mitosis are modulated by nutrients. (A and B) Plots showing the mean durations of all cell cycle stages for synchronous cells (A) or asynchronous cells (B) growing in rich or poor More about this image found in The duration of mitosis and cell size at completion of mitosis are modulate...
in The duration of mitosis and daughter cell size are modulated by nutrients in budding yeast
> Journal of Cell Biology
Published: 22 September 2017
Figure 4. Cell growth rate is modulated during the cell cycle. The growth rate at each phase of the cell cycle was calculated as the mean of individual cell growth rates. Growth rate was calculated by dividing the volume increase of the cell More about this image found in Cell growth rate is modulated during the cell cycle. The growth rate at ea...
in The duration of mitosis and daughter cell size are modulated by nutrients in budding yeast
> Journal of Cell Biology
Published: 22 September 2017
Figure 5. Cell size at completion of cytokinesis is proportional to growth rate during mitosis. (A and B) The growth rate in mitosis of each daughter bud was plotted against the volume of its mother cell for synchronous cells (A) and More about this image found in Cell size at completion of cytokinesis is proportional to growth rate durin...
Published: 22 September 2017
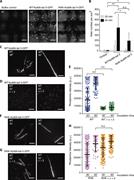
Figure 1. Biochemical and structural characterization of the heterotrimeric NuMA-tail II – Importin-α – Importin-β complex. (A) Domain structures of NuMA, Importin-α, and Importin-β. For NuMA, the microtubule-binding regions suggested by the More about this image found in Biochemical and structural characterization of the heterotrimeric NuMA-tail...
Published: 22 September 2017
Figure 2. Importin- α /- β regulates NuMA-tail II-mediated higher-order microtubule structure assembly. (A) Microtubule aster assembly in Xenopus egg extracts, examined with buffer control (left), WT NuMA-tail II-GFP (5 µM, center), and More about this image found in Importin- α /- β regulates NuMA-tail II-mediated higher-order microtubule ...
Published: 22 September 2017
Figure 3. Importin-β regulates interaction of NuMA-tail II with microtubules. (A) SDS-PAGE analysis of microtubule cosedimentation assays for NuMA-tail II-GFP in the presence of Importin-α or Importin-α/-β. BSA (final, 0.25 mg/ml), which was More about this image found in Importin-β regulates interaction of NuMA-tail II with microtubules. (A) SD...
Published: 22 September 2017
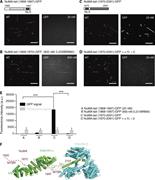
Figure 4. Importin-β regulates the microtubule-binding region that lies C-terminal to the NuMA NLS. GMPCPP-stabilized microtubules (X-rhodamine– and biotin-labeled) were incubated with NuMA-tail (1868–1997) and NuMA-tail (1970–2091) that contain More about this image found in Importin-β regulates the microtubule-binding region that lies C-terminal to...
1

