The arrangement of neurons into ordered layers underlies circuit function in many nervous system regions. This is particularly true in the mammalian retina. Here, fate-committed retinal ganglion cells (RGCs) migrate from the apical to the inner retina, where they form connections that enable vision. The mechanisms that permit ganglion cell migration and whether distinct ganglion cell types use different migration modes are unknown. We show that the serine/threonine kinase LKB1 regulates ganglion cell migration and nuclear positioning. In the absence of LKB1, many ganglion cells remain in the apical retina. Misplaced cells show modified morphologies and display altered cytoskeletal proteins. Examination of RGC types revealed that LKB1 is specifically required to promote F-type RGC (F-RGC) migration. The failure of F-RGCs to migrate results in a significant F-RGC loss via increased cell death and microglia engulfment. Together, these results identify molecular determinates of ganglion cell migration and indicate that different ganglion cell types can use distinct programs to ensure their localization.
Introduction
The precise temporal, spatial, and cell type–specific regulation of neuron migration are all crucial to ensure neural circuit integrity. While many genes have been identified that regulate neuron fate (Bassett and Wallace, 2012; Blackshaw et al., 2004; Sainath and Gallo, 2015), we know little about the molecular processes by which distinct neuron types derive their ordered arrangements. This is particularly true in the mammalian retina. In this critical circuit, the somas of distinct neuron types are organized into three cellular layers (Fig. 1 A). Visual information is relayed through these cellular layers and ultimately integrated by ∼48 retinal ganglion cell (RGC) types in mice (Goetz et al., 2022; Li et al., 2024). RGCs are among the earliest born retinal neuron types (Fig. 1 B), and their somas reside in the inner most retinal layer called the ganglion cell layer (GCL) (Dräger, 1985; Marcucci et al., 2019; Voinescu et al., 2009). This location is vital to their function. RGC dendrites form precisely patterned contacts with lamina restricted presynaptic neurons, and RGC axons form the optic nerve, which relays visual information to the brain.

RGC nuclear position is altered in the absence of LKB1. (A) Schematic of retina neuron organization in adult mice. The outer nuclear layer (ONL) contains rod (RP) and cone photoreceptors (CP), which form synapses in the outer plexiform player (OPL) with bipolar cells (BP) and horizontal cells (HC). Bipolar cells extend axons to the inner plexiform layer (IPL), where they and amacrines cells (ACs) form synapses with RGCs (green), whose nuclei are in the GCL. Muller glia (MG) cell bodies reside in the INL, and their processes form the outer- (brown) and inner- (orange) limiting membrane. (B) Cartoon depicting the timeline of inner retina neurogenesis. Mouse RGCs are born over a 10-day period that begins at ∼E10, and the peak of RGC birth occurs at P14 (green line). Other retinal neuron types are born over different time courses (grey lines). (C) Cartoon depicting the two known RGC migration modes based on studies in zebrafish. The predominate form is somal translocation, where RGCs extend an apical and basal processes, the soma migrates downwards, and the apical process then detaches and retracts. Zebrafish RGCs can switch to multipolar migration under certain conditions. (D) Representative images of RGCs (anti-RBPMS, green) in control and LKB1RET mice at P0. Many LKB1RET RGCs display migration defects (boxed cells), with somas positioned in the apical retina. The white dashed line demarks the outer boundary of the apical retina. (E and F) Scatterplot (E) and graph (F) displaying the location and percent quantification of RGC nuclei normalized to the width of the retina in control (black) and LKB1RET mice (green) in each retinal quadrant at P0. There is a significant increase in the number of LKB1RET RGC nuclei in the outer retina relative to controls (n = 0 and n = 41 cells from four control and four LKB1RET mice, respectively). (G) Quantification of the average normalized distance of RGC nuclei from the basal retinal surface. There is a significant increase in the average distance of RGC nuclei in LKB1RET mice relative to controls (6% and 32% of total distance from four control and four LKB1RET mice, respectively). (H) Representative images of RGCs (anti-RBPMS, green) in control and LKB1RET mice at P3. LKB1RET RGCs continue to display migration defects (boxed cells), with somas positioned in the apical retina as well as more basally outside of the GCL. The white dashed line demarks the outer boundary of the apical retina. (I and J) Scatterplot (I) and graph (J) displaying the location and percent quantification of RGC nuclei normalized to the width of the retina in control (black) and LKB1RET mice (green) in each retinal quadrant at P3. RGCs remain misplaced, with an increase in the number of LKB1RET RGC nuclei in the outer retina relative to controls (n = 0 and n = 49 cells from four control and four LKB1RET mice, respectively). (K) Quantification of the average normalized distance of RGC nuclei from the basal retinal surface at P3 shows a continued increase in the average distance of RGC nuclei in LKB1RET mice relative to controls (n = 17% and 34% of total distance from four control and four LKB1RET mice, respectively). Scale bars = 50 µm. Data are represented as the mean ± the SEM (C) or as beeswarm SuperPlots (G and K), in which individual RGC nuclei values are presented together with the mean from each animal ± the SEM. ****P < 0.0001, nonparametric Mann–Whitney rank-sum U test.
RGC nuclear position is altered in the absence of LKB1. (A) Schematic of retina neuron organization in adult mice. The outer nuclear layer (ONL) contains rod (RP) and cone photoreceptors (CP), which form synapses in the outer plexiform player (OPL) with bipolar cells (BP) and horizontal cells (HC). Bipolar cells extend axons to the inner plexiform layer (IPL), where they and amacrines cells (ACs) form synapses with RGCs (green), whose nuclei are in the GCL. Muller glia (MG) cell bodies reside in the INL, and their processes form the outer- (brown) and inner- (orange) limiting membrane. (B) Cartoon depicting the timeline of inner retina neurogenesis. Mouse RGCs are born over a 10-day period that begins at ∼E10, and the peak of RGC birth occurs at P14 (green line). Other retinal neuron types are born over different time courses (grey lines). (C) Cartoon depicting the two known RGC migration modes based on studies in zebrafish. The predominate form is somal translocation, where RGCs extend an apical and basal processes, the soma migrates downwards, and the apical process then detaches and retracts. Zebrafish RGCs can switch to multipolar migration under certain conditions. (D) Representative images of RGCs (anti-RBPMS, green) in control and LKB1RET mice at P0. Many LKB1RET RGCs display migration defects (boxed cells), with somas positioned in the apical retina. The white dashed line demarks the outer boundary of the apical retina. (E and F) Scatterplot (E) and graph (F) displaying the location and percent quantification of RGC nuclei normalized to the width of the retina in control (black) and LKB1RET mice (green) in each retinal quadrant at P0. There is a significant increase in the number of LKB1RET RGC nuclei in the outer retina relative to controls (n = 0 and n = 41 cells from four control and four LKB1RET mice, respectively). (G) Quantification of the average normalized distance of RGC nuclei from the basal retinal surface. There is a significant increase in the average distance of RGC nuclei in LKB1RET mice relative to controls (6% and 32% of total distance from four control and four LKB1RET mice, respectively). (H) Representative images of RGCs (anti-RBPMS, green) in control and LKB1RET mice at P3. LKB1RET RGCs continue to display migration defects (boxed cells), with somas positioned in the apical retina as well as more basally outside of the GCL. The white dashed line demarks the outer boundary of the apical retina. (I and J) Scatterplot (I) and graph (J) displaying the location and percent quantification of RGC nuclei normalized to the width of the retina in control (black) and LKB1RET mice (green) in each retinal quadrant at P3. RGCs remain misplaced, with an increase in the number of LKB1RET RGC nuclei in the outer retina relative to controls (n = 0 and n = 49 cells from four control and four LKB1RET mice, respectively). (K) Quantification of the average normalized distance of RGC nuclei from the basal retinal surface at P3 shows a continued increase in the average distance of RGC nuclei in LKB1RET mice relative to controls (n = 17% and 34% of total distance from four control and four LKB1RET mice, respectively). Scale bars = 50 µm. Data are represented as the mean ± the SEM (C) or as beeswarm SuperPlots (G and K), in which individual RGC nuclei values are presented together with the mean from each animal ± the SEM. ****P < 0.0001, nonparametric Mann–Whitney rank-sum U test.
The retina was one of the first circuits in which neuron migration was documented due to its organization and accessibility. Fate-committed neurons are born in the apical retina from pluripotent retinal progenitor cells and then migrate basally to their respective layers (Fig. 1 C). Live imaging in zebrafish has shown that RGC migration is driven by somal translocation (Icha et al., 2016). In this form of migration, developing RGCs display bipolar processes that contact the apical and basal regions of the retina that enable movement of the soma from its apical position to the basal developing GCL (Icha et al., 2016). When somal translocation is disrupted in zebrafish by microtubule destabilization, RGCs can switch to a less efficient form of migration known as multipolar migration. In this migration mode, cells display many small processes that extend around the cell (Icha et al., 2016). Despite many decades of work on the retina, almost no progress has been made in deciphering the molecular and cellular mechanisms that control RGC migration. Also unknown is whether RGC types utilize distinct pathways to ensure they properly target the basal retina.
To resolve these questions, we focused on the serine/threonine kinase LKB1 (liver kinase B1, also called STK11 or Par4). LKB1 regulates 14 kinases (AMPKα1/α2, SAD-A/B, NUAK1/2, SIK1-3, MARK1–4, and SNRK (Jaleel et al., 2005; Lizcano et al., 2004) and has cell-specific roles in polarity, neuron maturation, axon formation, and dendrite self-avoidance in the retina and the brain (Barnes et al., 2007; Burger et al., 2021; Courchet et al., 2013; Huang et al., 2014; Kuwako and Okano, 2018a, 2018b). We thus asked whether LKB1 may participate in RGC migration and whether it may differentially modulate the translocation of distinct RGC types. We show that loss of LKB1 restricts RGC migration, with subsets of RGC somas retained at the apical border throughout the first postnatal week. Misplaced RGCs show basal process defects, adopt a variety of shapes that include multipolar process extensions, and display disrupted cytoskeletal proteins. The bulk of misplaced ganglion cells are comprised of F-type RGCs (termed F-RGCs), the most abundant mouse RGC group (Rousso et al., 2016). This set of closely related ganglion cell types constitutes ∼20% of all mouse RGC types but comprises the majority of mislocalized neurons. F-RGCs that display defective migration fail to properly integrate into the retinal circuit, and over half of these cells are lost in the second postnatal week through apoptotic cell death and microglia engulfment. Together, these data suggest a model in which LKB1-mediated basal process formation is required in a critical RGC type to ensure somal translocation and circuit integration necessary for RGC survival and function.
Results and discussion
LKB1 regulates RGC migration and positioning
RGCs are among the first cell type derived from retinal progenitors and migrate from their apical birthplace to their basal location in the retina following their birth, which occurs around embryonic day E11 and lasts over a 10-day period (Peng, 2023) (Fig. 1 B). In wild-type animals, RGCs undergo somal translocation, with abundant migrating RGCs present in the inner retina at E16. All fate committed RGCs arrive in the GCL by postnatal day (P)1 (Fig. 1, B and C). We have previously shown that early in development, Lkb1 transcripts are enriched in the outer neuroblast layer, which contains cycling retinal progenitor cells, and in the GCL (Burger et al., 2020). To determine the role of LKB1 in RGC migration, we thus generated conditional retina neuron LKB1 knockout mice using the allele Stk11F/F (previously called Lkb1F/F [Bardeesy et al., 2002]) and the Six3:cre line ([Furuta et al., 2000], provided by W. Kline, MD Anderson Cancer Center, Houston, TX, USA) that expresses Cre in embryonic retinal progenitors to generate Stk11F/F; Six3-Cre animals. We verified that Six3:cre is active on or before P0 by crossing to the Cre-dependent reporter Ai14 (Fig. S1 A). We further confirmed that LKB1 is reduced in RGCs from Stk11F/F; Six3-Cre animals, confirming the robustness of this knockout approach (Fig. S1 B). We refer to this line hereafter as LKB1RET.
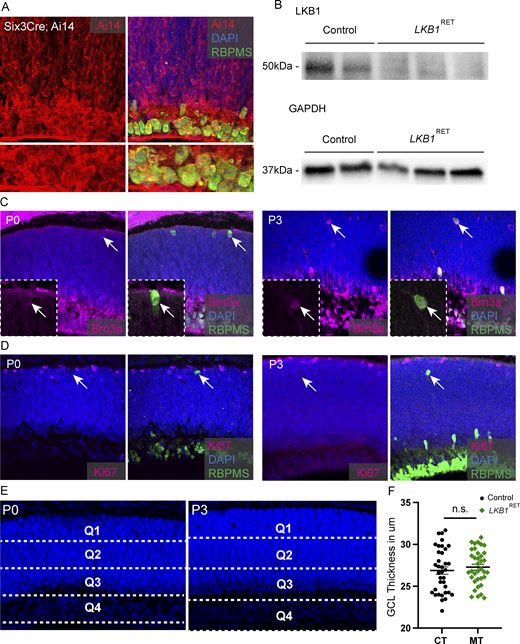
Validation of mutant line and cell type analysis parameters. (A) Representative images of Six3:cre activity. Six3:cre was crossed to the Cre-dependent reporter Ai14. Cre-positive (red) cells overlapped with the RGC marker RBPMS (green) at P3. (B and C) Representative images (B) and quantification of (C) LKB1 immunoreactivity (magenta) in control Stk11F/F animals and Stk11F/F; Six3-Cre animals at P3. Co-staining with DAPI and RGC marker RBPMS (cyan) shows that LKB1 is lost from the retina generally and from RGCs specifically (arrows). (C and D) Representative images show that mistargeted cells (anti-RBPMS, green) are positive for additional RGC markers (anti-Brn3a, magenta, C) and negative for markers of cycling progenitors (Ki67, magenta, D) in LKB1RET mice at P0 (arrows). (E) Representative quadrant demarcation lines (white doted lines) utilized for quantification of the numbers and location of RGC nuclei relative to their distance from the apical retina surface. These quadrants were demarcated as apical (quadrant one; Q1), upper middle (quadrant two; Q2), lower middle (quadrant three; Q3), and basal (quadrant four; Q4) retinal quadrants. Each quadrant thus represents 25% of the retina at each time point. The cellular composition of these quadrants change slightly over development as retinal layers matures (DAPI, blue). (F) Quantification of GCL thickness at P3. There is no significant increase in the average thickness of GCL of RGC nuclei in LKB1RET mice relative to controls. Data are represented as the mean ± the SEM. nonsignificant (n.s.), nonparametric Mann–Whitney rank-sum U test. Source data are available for this figure: SourceData FS1.
Validation of mutant line and cell type analysis parameters. (A) Representative images of Six3:cre activity. Six3:cre was crossed to the Cre-dependent reporter Ai14. Cre-positive (red) cells overlapped with the RGC marker RBPMS (green) at P3. (B and C) Representative images (B) and quantification of (C) LKB1 immunoreactivity (magenta) in control Stk11F/F animals and Stk11F/F; Six3-Cre animals at P3. Co-staining with DAPI and RGC marker RBPMS (cyan) shows that LKB1 is lost from the retina generally and from RGCs specifically (arrows). (C and D) Representative images show that mistargeted cells (anti-RBPMS, green) are positive for additional RGC markers (anti-Brn3a, magenta, C) and negative for markers of cycling progenitors (Ki67, magenta, D) in LKB1RET mice at P0 (arrows). (E) Representative quadrant demarcation lines (white doted lines) utilized for quantification of the numbers and location of RGC nuclei relative to their distance from the apical retina surface. These quadrants were demarcated as apical (quadrant one; Q1), upper middle (quadrant two; Q2), lower middle (quadrant three; Q3), and basal (quadrant four; Q4) retinal quadrants. Each quadrant thus represents 25% of the retina at each time point. The cellular composition of these quadrants change slightly over development as retinal layers matures (DAPI, blue). (F) Quantification of GCL thickness at P3. There is no significant increase in the average thickness of GCL of RGC nuclei in LKB1RET mice relative to controls. Data are represented as the mean ± the SEM. nonsignificant (n.s.), nonparametric Mann–Whitney rank-sum U test. Source data are available for this figure: SourceData FS1.
We then examined the relative position and alignment of RGC nuclei in LKB1RET mutant and littermate control animals within the retina in the first postnatal week using the RGC-specific antibody RBPMS (Rodriguez et al., 2014) and DAPI to indicate the upper and lower boundaries of the retinal layers. RGC migration defects were apparent in LKB1 mutant retinas at early developmental time points. While all RGCs were localized to the GCL in control animals at P0, mislocalized RGCs were visible in LKB1RET mice throughout the retina (Fig. 1 D, arrows). To further confirm the RGC identity of the mistargeted cells, we used an additional RGC marker, Brn3a, and the proliferation marker Ki-67 to rule out that misloclaized cells were cycling retinal progenitor cells, which are known to be in the apical retina at this time (Fig. S1, C and D). The mislocalized RGCs had faint Brn3a expression at P0 and robust expression by P3. These data further support that the mislocalized cells are indeed RGCs. Furthermore, Ki67 expression was not detected at either time point, indicating that these cells are not actively proliferating (Fig. S1, C and D).
To quantify RGC nuclear positions, we divided the retina into four equal quadrants relative to their distance from the apical retina surface and examined the numbers and location of RGC nuclei in each quadrant at P0 and P3. These quadrants were demarcated as apical (quadrant one; Q1), upper middle (quadrant two; Q2), lower middle (quadrant three; Q3), and basal (quadrant four; Q4) retinal quadrants (Fig. 1, E and I). Each quadrant thus represents 25% of the retina at each time point, and we note that the cellular composition of these quadrants will change slightly over development as retinal layers mature. Representative quadrant demarcation lines are presented in Fig. S1 E. In control mice at P0, RGC nuclei were localized near the basal surface of the retina, with 100% localized within Q4 (lower 25%) (Fig. 1 F). Control RGC nuclei were also well aligned with each other at this time point, with an average nuclear position within 6 ± 0.05% of the basal surface relative to the total retina width (Fig. 1, E–G). In contrast, LKB1RET mice displayed markedly altered RGC nuclear positioning: 39% were displaced into the upper quadrants of the retina outside quadrant 4, which contains the GCL, compared with 0% in controls (P < 0.00001, Fig. 1, E–G). Among these mislocalized nuclei, 20% were in Q1 and 19% were in Q2 and Q3. These displaced RGC somas were not well aligned with one another. LKB1RET RGC nuclei had an average nuclear position within 33 ± 0.29% of the basal surface relative to the total retina width, representing a 5.5-fold increase in displacement relative to control RGCs (P < 0.00001, Fig. 1, E–G). RGC nuclei remained mistargeted at P3 in LKB1RET mice, with 45% displaced into the upper quadrants of the retina outside the GCL (P < 0.0001, Fig. 1, H–K). This is compared with 17% in controls, which likely represents the small population of displaced RGCs known to reside in the inner half of the INL (Dogiel, 1895). Control RGC nuclei at P3 remained well aligned with each other, with an average nuclear position within 17 ± 0.08% of the basal surface, while in LKB1RET mice nuclei were located an average of 34 ± 0.31% of the basal surface, representing a two-fold increase (P < 0.0001, Fig. 1, J and K). The thickness of the GCL itself did not differ between control and mutant animals at P3 (Fig. S1 F). Thus, LKB1 is required for basal RGC somal migration and positioning in the GCL.
LKB1 promotes RGC somal translocation
We next examined RGC migration modes. In zebrafish, somal translocation is the primary mode of RGC migration and is indicated by the presence of RGC somas that are connected to the outer and inner retina by apical and basal processes (Icha et al., 2016). To visualize these apical and basal RGC processes in mice, we stained developing retinas with antibodies to β-tubulin, a main component of microtubules (Sullivan and Cleveland, 1986), and to doublecortin, a microtubule-associated protein that labels migrating neurons (Francis et al., 1999). In alignment with the zebrafish data, we observed migrating RGCs in control mice at E16 with abundant β-tubulin and doublecortin staining present in the outer and inner retina (Fig. 2, A and B, arrows). In LKB1RET animals at E16, migrating RGCs also contained β-tubulin and doublecortin, and most were in the inner retina away from the apical surface. This is consistent with the idea that LKB1RET RGCs may initiate migration but that they eventually fail to reach the GCL. In control retinas at P0, no RGCs remained in the outer retina (Fig. 2, C and D), and co-staining for neural type markers confirmed that the remaining β-tubulin and doublecortin-positive nuclei were horizontal cells (Fig. S2 A). In contrast, in LKB1RET mice, many RGCs failed to arrive in the inner retina at P0. β-tubulin and doublecortin staining persisted in these mislocalized RGCs, indicating that they may still be attempting to migrate to their final location (Fig. 2, C and D, arrows). To determine whether these migration defects reflected alterations to basal process extension, we visualized and quantified individual RBPMS and doublecortin dual-labeled migrating RGCs in controls and mutants at E16. In controls, the majority of migrating RGCs possessed a basal neurite (77%), indicated by both basal neurite quantification and the reconstruction of single migrating RGCs (Fig. 2, E–H). LKB1RET mice, in contrast, had a significantly decreased proportion of migrating RGCs with a detectible basal process (48% reduction, P < 0.001). In those RGCs that possessed a basal process, the length of this process was also shorter in mutants than that in controls (21.63 ± 17.44 µm in mutants versus 27.88 ±19.1 µm in controls mice, P ≤ 0.01) (Fig. 2 G). Single-cell reconstruction in LKB1 mutants at E16 showed that migrating RGCs have diverse morphologies, with some showing apical and basal processes that somewhat resemble those in control animals (Fig. 2 H, solid arrows), while others appear to lack process extension (Fig. 2 H, dotted arrows). Thus, a subset of LKB1RET RGCs may attempt somal translocation. However, by P0 and P3, LKB1RET RGCs that remain in the outer retina take on morphologies typical of alternative forms of migration. These include teardrop shapes with an apical process (Fig. 2 I, star), while others appear rounder and display multipolar processes extending in many directions (Fig. 2 I, arrowheads). Together, these data indicate that LKB1 coordinately regulates RGC migration and is required for initiating or maintaining the extension of a basal process that enables efficient somal translocation.

Mislocalized RGCs retain cytoskeletal markers and show altered morphology in LKB1 mutants. RGC migration-related microtubule proteins were identified with antibodies to β-tubulin and doublecortin (magenta). (A–D) Representative images from E16 (A and B) and P0 (C and D) of migrating neurons positive for β-tubulin (A and C) and doublecortin (B and D). At E16, migrating RGCs in both control and LKB1RET animals are positive for microtubule-associated proteins (arrows). At P0, β-tubulin and doublecortin are largely absent from the outer retina in controls, but both proteins remain localized to mistargeted RGC nuclei in LKB1RET animals (arrows). Scale bars = 50 µm. (E) Representative high magnification images of migrating RGCs in control and LKB1RET mutants show that control RGCs retain long basal processes (solid arrow), while basal processes are shorter or absent in mutant RGCs (dotted arrow). (F and G) Quantification of the percent of RGCs without a basal neurite (F), and measurements of the length of the basal neurite when it was extended (G) at E16 in controls and LKB1RET mutants. Significantly more RGCs lacked a basal neurite in LKB1RET mutants, and among those RGCs that possessed a basal neurite, its length was significantly shorter. (H and I) Representative single reconstructions of migrating RGCs in control and LKB1RET mutants at E16 (H) and P0 (I). At E16, control RGCs showed apical and basal process, while in LKB1 mutants, RGCs showed variable morphologies with some retaining process (solid arrows) and some lacking processes (dotted arrows), suggesting some mutant RGCs may attempt bipolar migration. At P0 and P3, LKB1RET RGC that remain in the outer retina take on different morphologies, consistent with alternative forms of migration. These include tear drop shapes (star) and multipolar processes extending in many directions (arrowheads). n = 3 control and n = 3 LKB1RET animals. Scale bars = 25 µm. ***P < 0.001 and ***P < 0.01, unpaired two-tailed Student’s t test. n.s., nonsignificant.
Mislocalized RGCs retain cytoskeletal markers and show altered morphology in LKB1 mutants. RGC migration-related microtubule proteins were identified with antibodies to β-tubulin and doublecortin (magenta). (A–D) Representative images from E16 (A and B) and P0 (C and D) of migrating neurons positive for β-tubulin (A and C) and doublecortin (B and D). At E16, migrating RGCs in both control and LKB1RET animals are positive for microtubule-associated proteins (arrows). At P0, β-tubulin and doublecortin are largely absent from the outer retina in controls, but both proteins remain localized to mistargeted RGC nuclei in LKB1RET animals (arrows). Scale bars = 50 µm. (E) Representative high magnification images of migrating RGCs in control and LKB1RET mutants show that control RGCs retain long basal processes (solid arrow), while basal processes are shorter or absent in mutant RGCs (dotted arrow). (F and G) Quantification of the percent of RGCs without a basal neurite (F), and measurements of the length of the basal neurite when it was extended (G) at E16 in controls and LKB1RET mutants. Significantly more RGCs lacked a basal neurite in LKB1RET mutants, and among those RGCs that possessed a basal neurite, its length was significantly shorter. (H and I) Representative single reconstructions of migrating RGCs in control and LKB1RET mutants at E16 (H) and P0 (I). At E16, control RGCs showed apical and basal process, while in LKB1 mutants, RGCs showed variable morphologies with some retaining process (solid arrows) and some lacking processes (dotted arrows), suggesting some mutant RGCs may attempt bipolar migration. At P0 and P3, LKB1RET RGC that remain in the outer retina take on different morphologies, consistent with alternative forms of migration. These include tear drop shapes (star) and multipolar processes extending in many directions (arrowheads). n = 3 control and n = 3 LKB1RET animals. Scale bars = 25 µm. ***P < 0.001 and ***P < 0.01, unpaired two-tailed Student’s t test. n.s., nonsignificant.

LKB1 is required for RGC migration and survival over time. (A) Representative images of doublecortin (anti-DCX, magenta), RGCs (anti-RBPMS, green), and horizontal cells (outer retina, calbindin, white). In controls at P3, remaining doublecortin-labeled cells in the outer retina are positive for the horizontal cell marker calbindin (solid arrows). In contrast, in LKB1RET mice, doublecortin-positive RGCs also persist in the outer retina (dotted arrows). (B–C) Representative cross-section images of RGCs (anti-RBPMS, green) undergoing active apoptosis (anti-activated caspase 3, magenta) at P0 and P3 the first postnatal week in LKB1RET mice and littermate controls. Caspase 3–positive RGCs are located both apically and basally at these time points (arrows).
LKB1 is required for RGC migration and survival over time. (A) Representative images of doublecortin (anti-DCX, magenta), RGCs (anti-RBPMS, green), and horizontal cells (outer retina, calbindin, white). In controls at P3, remaining doublecortin-labeled cells in the outer retina are positive for the horizontal cell marker calbindin (solid arrows). In contrast, in LKB1RET mice, doublecortin-positive RGCs also persist in the outer retina (dotted arrows). (B–C) Representative cross-section images of RGCs (anti-RBPMS, green) undergoing active apoptosis (anti-activated caspase 3, magenta) at P0 and P3 the first postnatal week in LKB1RET mice and littermate controls. Caspase 3–positive RGCs are located both apically and basally at these time points (arrows).
How might the RGCs with altered morphologies overcome these migration deficits? Advances in iPSC-generated RGCs for the purposes of transplantation and therapy have driven recent interest in alternative ways to ensure RGCs arrive in the inner retina. When RGC translocation is disrupted in zebrafish, the majority of RGCs were still able to reach the inner retina by switching to an alternative migration strategy. This alternative form of movement is called multipolar migration and more closely resembles migration strategies employed by other inner retina neuron types. Multipolar migration does not rely on a basal process that soma travel along but instead involves the extension and retraction of multiple process that may enable late-born neurons to navigate through developed tissues (Buchsbaum and Cappello, 2019; Hayashi et al., 2015). Whether RGCs are capable of multipolar migration in mammals is unclear, but studies aimed at identifying stem cell–derived RGC chemoattractant gradients suggest this may be possible (Soucy et al., 2023). Our data are consistent with the idea that mouse RGCs can switch to alternative migration strategies and suggest that LKB1 may regulate this process. Disruption of LKB1 resulted in more cells with multiple processes that resembled migrating multipolar RGCs. Despite this, many RGCs were unable to migrate to the basal retina and remained localized to the apical retina. Thus, LKB1 may be necessary for RGC migration through multiple modalities.
Abnormal RGC migration is associated with cell loss
To determine the impact of LKB1-dependent migration defects on the survival of RGCs, we imaged whole-mount retinas and quantified the total number of RGCs in the GCL across the first postnatal week (Fig. 3, A–D). At P3, the number of RGCs in the GCL was significantly lower in LKB1RET retinas relative to controls (12% reduction, P = 0.0001) (Fig. 3 D). We considered the possibility that increased apoptosis may contribute to RGC loss in the LKB1 mutants. To assess this, we stained control and mutant retinas with the pro-apoptotic marker-activated caspase 3. At P3, LKB1 mutants showed a doubling in the number of activated caspase 3–positive nuclei (Fig. 3, A and E). Some of these cells were present in the GCL, while others were present more apically (Fig. 3 A, arrows; and Fig. S2, B and C). These data suggest either that mistargeted cells die before they reach their destination in the GCL or that mistargeted RGCs eventually reach the GCL layer but then die, potentially due to failed circuit integration. To help distinguish between these possibilities, we further quantified RGC numbers and caspase 3 positivity at P5 and P8. At these time points, mistargeted RGCs are no longer present in the outer retina of LKB1 mutant animals. At P5, RGC numbers continued to decline in LKB1 mutant animals relative to controls with a 21% cell loss (Fig. 3 D). Activated caspase 3 levels also remained elevated, showing a 2.2-fold increase in positive cells, and caspase 3 positive cells were largely restricted to the GCL (Fig. 3, B and E, P < 0.0001). At P8, the number of RGCs in LKB1 mutants continued to decline, with a further significant reduction in RGC numbers relative to controls (Fig. 3 D, P < 0.0001). Together, these data are consistent with a model in which LKB1 drives RGC migration and is required to restrict the levels of apoptotic RGC loss that occur normally in the developing retina (Mosinger Ogilvie et al., 1998; Péquignot et al., 2003; White et al., 1998). In the absence of this kinase, subsets of RGCs fail to reach the GCL, and even RGCs that eventually reach their destination are susceptible to cell death, potentially due to failed polarization or circuit integration.

LKB1 is required for RGCs survival over time. (A–E) Representative images (A–C), quantification of RGC number (D, anti-RBPMS, green), and quantification of active apoptosis in RGCs (E, anti-activated caspase 3, magenta) in the first postnatal week in LKB1RET mice and littermate controls. RGC number is significantly decreased at P3, P5, and P8 relative to control animals (D). This decrease may be in part due to increased levels of apoptosis, as the presence (A–C) and number (E) of activated caspase 3–positive RGCs is increased at both P3 and P5. n = 4 control and n = 4 LKB1RET animals. Scale bars = 50 µm. Data are represented as beeswarm SuperPlots (D and E), in which individual RGC nuclei values are presented together with the mean from each animal ± the SEM. ****n = 0.0001, nonparametric Mann–Whitney rank-sum U test. n.s., nonsignificant.
LKB1 is required for RGCs survival over time. (A–E) Representative images (A–C), quantification of RGC number (D, anti-RBPMS, green), and quantification of active apoptosis in RGCs (E, anti-activated caspase 3, magenta) in the first postnatal week in LKB1RET mice and littermate controls. RGC number is significantly decreased at P3, P5, and P8 relative to control animals (D). This decrease may be in part due to increased levels of apoptosis, as the presence (A–C) and number (E) of activated caspase 3–positive RGCs is increased at both P3 and P5. n = 4 control and n = 4 LKB1RET animals. Scale bars = 50 µm. Data are represented as beeswarm SuperPlots (D and E), in which individual RGC nuclei values are presented together with the mean from each animal ± the SEM. ****n = 0.0001, nonparametric Mann–Whitney rank-sum U test. n.s., nonsignificant.
Microglia engulf RGCs in LKB1 mutants
How might defective and dying RGCs be removed? Resident immune cells called microglia were a good candidate because these cells have been shown to regulate elimination of both apoptotic and non-apoptotic RGCs during development (Anderson et al., 2019; Blume et al., 2020). We thus examined control and LKB1 mutant retinas for the number and localization of microglia together with their relationship to RGCs over the first postnatal week by staining for the microglia marker Iba1 and the RGC marker RBPMS (Fig. 4). Imaging and quantification of Iba1+ microglia showed that microglia numbers did not differ in controls and mutants either at P3 or P5 (Fig. 4, E and K). The number of microglia processes that interacted with RGCs also did not differ, indicating that general microglia surveying activity may not be altered in mutants (Fig. 4, F and M). To directly assess microglia engulfment of RGCs, we quantified the number of microglia that contained RBPMS signal over time. We found that the number of microglia-engulfed RGCs was elevated in LKB1 mutants, with a 2-fold and 2.7-fold increase at P3 and P5, respectively (Fig. 4, G and N, arrows P = 0.005 and P = 0.0017). These data suggest that RGCs that are lost in LKB1 mutants undergo apoptosis and may also be engulfed and degraded by resident microglia.

Microglia engulfment of RGCs is increased in the absence of LKB1. (A–F) Representative images (A–D) and quantification (E and F) of RGCs (anti-RBPMS, green) and microglia (anti-Iba1, magenta) at P3 in LKB1RET mice and littermate controls. While the total number of microglia (E) and the number of microglia processes that touch RGCs does not change (F), there are significantly more RGCs that are engulfed my microglia in mutants relative to controls. (G) RGC engulfment by microglia can be visualized in whole mount (arrows, A and C) and in cross section (arrows, B and D). (H–N) Representative images (H–K) and quantification (K–N) of RGCs (anti-RBPMS, green) and microglia (anti-Iba1, magenta) at P5 in LKB1RET mice and littermate controls. At P5, the total number of microglia (L) and the number of microglia processes that touch RGCs are also unaffected (M), but there continues to be significantly more RGCs that are engulfed by microglia in mutants relative to controls (N). Whole mount (arrows, H and J) and cross-section analysis (arrows, I and K) show RGC cell bodies within microglia. n = 4 control and n = 4 LKB1RET animals. Scale bars = 30 µm (whole mounts) and 25 µm (cross section). **P < 0.001, nonparametric Mann–Whitney rank-sum U test. n.s., nonsignificant.
Microglia engulfment of RGCs is increased in the absence of LKB1. (A–F) Representative images (A–D) and quantification (E and F) of RGCs (anti-RBPMS, green) and microglia (anti-Iba1, magenta) at P3 in LKB1RET mice and littermate controls. While the total number of microglia (E) and the number of microglia processes that touch RGCs does not change (F), there are significantly more RGCs that are engulfed my microglia in mutants relative to controls. (G) RGC engulfment by microglia can be visualized in whole mount (arrows, A and C) and in cross section (arrows, B and D). (H–N) Representative images (H–K) and quantification (K–N) of RGCs (anti-RBPMS, green) and microglia (anti-Iba1, magenta) at P5 in LKB1RET mice and littermate controls. At P5, the total number of microglia (L) and the number of microglia processes that touch RGCs are also unaffected (M), but there continues to be significantly more RGCs that are engulfed by microglia in mutants relative to controls (N). Whole mount (arrows, H and J) and cross-section analysis (arrows, I and K) show RGC cell bodies within microglia. n = 4 control and n = 4 LKB1RET animals. Scale bars = 30 µm (whole mounts) and 25 µm (cross section). **P < 0.001, nonparametric Mann–Whitney rank-sum U test. n.s., nonsignificant.
F-RGCs are specifically affected in LKB1 mutant mice
Only a portion of RGCs are mislocalized in LKB1 mutant mice. We thus questioned whether LKB1 may be required in defined RGC types for their positioning and survival. This was of particular interest because although ∼48 types of RGCs have been defined in mice (Baden et al., 2016; Goetz et al., 2022; Rheaume et al., 2018; Sanes and Masland, 2015), cell type–specific RGC migration pathways have not been uncovered to date. We thus used molecular markers that label major RGC subclasses at P3 to determine whether displaced RGCs in LKB1 mutants represented one or more types of RGCs. We focused our analysis on F-RGCs (FOXP2), M1–M3 intrinsically photosensitive RGCs (melanopsin and OPN4), and ON-OFF DSRGCs (ooDSRGCs and SATB1), as expression of these markers is sufficient to distinguish them in the first postnatal week. Among these populations, co-labeling of misplaced RGCs for ipRGCs was only rarely observed (Fig. 5 A). In contrast, over 53% of misplaced RGCs were positive for the pan F-type marker FoxP2 (Fig. 5, A and B, arrows). This represents a 2.65-fold enrichment in representation within the displaced population, as F-RGCs comprise only ∼20% of all RGC types in the retina (Rousso et al., 2016). We also observed a more modest co-labeling of SATB1 with mistargeted RGCs at P3. This marker also labels a subset of FOXP2 RGCs, which may help account for this partial overlap Fig. 5, C and D).

LKB1 specifically modulates the migration and survival of F-RGCs. (A and B) Representative images (A) and quantification (B) of RGCs (anti-RBPMS, green) and their subtypes (anti-FOXP2, F-RGCs; anti-OPN4, ipRGCs; and anti-SATB1; ooDSRGCs, magenta) in control and LKB1RET mice at P3 in the outer retina (top panels) and the GCL (bottom panels). Only FoxP2-labeled RGCs display significant migration defects and are observed in the outer retina in LKB1RET mice (A, arrows). Scale bars = 25 µm. (C and D) Representative images (C) and quantification (D) of RGCs subtypes (FOXP2, F-RGCs; OPN4, iPRGCs; and SATB1; ooDSRGCs, magenta) in control and LKB1RET mice at P8. Among these types, significantly fewer FoxP2-labeled RGCs were present LKB1RET mice, with a more modest reduction observed in ooDSRGCs. n = 4–6 controls and n = 4–6 LKB1RET animals. Scale bars = 50 µm. ****P < 0.0001, nonparametric Mann–Whitney rank-sum U test. n.s., nonsignificant; ONL, outer nuclear layer.
LKB1 specifically modulates the migration and survival of F-RGCs. (A and B) Representative images (A) and quantification (B) of RGCs (anti-RBPMS, green) and their subtypes (anti-FOXP2, F-RGCs; anti-OPN4, ipRGCs; and anti-SATB1; ooDSRGCs, magenta) in control and LKB1RET mice at P3 in the outer retina (top panels) and the GCL (bottom panels). Only FoxP2-labeled RGCs display significant migration defects and are observed in the outer retina in LKB1RET mice (A, arrows). Scale bars = 25 µm. (C and D) Representative images (C) and quantification (D) of RGCs subtypes (FOXP2, F-RGCs; OPN4, iPRGCs; and SATB1; ooDSRGCs, magenta) in control and LKB1RET mice at P8. Among these types, significantly fewer FoxP2-labeled RGCs were present LKB1RET mice, with a more modest reduction observed in ooDSRGCs. n = 4–6 controls and n = 4–6 LKB1RET animals. Scale bars = 50 µm. ****P < 0.0001, nonparametric Mann–Whitney rank-sum U test. n.s., nonsignificant; ONL, outer nuclear layer.
Our data suggested that LKB1-regulated migration is necessary for RGC survival in the first postnatal week. We thus asked whether F-RGCs were lost in greater numbers from LKB1 mutants relative to other RGC types at P8. We found that the number of F-RGCs was significantly reduced in LKB1 mutants, with a 48% loss of this population (P < 0.0001) (Fig. 5, C and D). Consistent with this reduction, we found that larger RGC categories, which encompass F-RGC types, were also reduced, including those marked by SATB1 (Fig. 5, C and D), SATB2, and TUSC5, while other non-F-RGC types remained unaltered at P8, including OPN4 (ipRGCs) and Spp1/SMI32 (αRGCs) (Fig. S3, A and B) (Krieger et al., 2017; Rousso et al., 2016). These data suggest that F-RGCs may specifically require LKB1 to migrate to the GCL. Consistent with this, data mining of existing RGC-type gene expression datasets (Shekhar et al., 2022) showed that Lkb1 (Stk11) was significantly enriched at E16 in F-RGCs relative to all other RGC types and relative to αRGCs specifically (Fig. S3). This difference in enrichment could make F-RGCs more sensitized to the loss of LKB1 than other RGCs. It is also possible that F-RGCs express lower levels of redundant migration pathway proteins, preventing these cells from overcoming LKB1-regulated defects in migration. A further possibility is that F-RGCs are more reliant on an unknown extrinsic migration cue produced by non-RGC types, which may be altered in our pan-retina LKB1 deletion lines. With currently available models, we cannot rule in or rule out these possibilities due to the cell type specificity, Cre expression timing, and embryonic lethality of currently available Cre and LKB1F/F lines that target cell types of interest. Future efforts aimed at developing mouse lines that enable early RGC type–specific removal of LKB1 may help resolve these questions.

LKB1-dependent RGC migration is restricted to particular RGC classes. (A and B) Representative images (A) and quantification (B) of additional RGC subtypes in controls and in LKB1RET mice at P8 (anti-Tusc5, T5-type, and F-RGCs; Spp1/SMI32 and αRGCs; and anti-SATB2, ON-OFF DSRGCs, and F-RGCs in the first postnatal week). Larger RGC categories that contain F-RGC types were reduced in LKB1 mutants, including those marked by SATB2 and TUSC5, while non-F-RGC type (Spp1/SMI32 and αRGCs) remained unaltered at P8. (C) Reanalysis of an E16 retina single-cell RNA-seq database generated by Shekhar et al. (2022) using the Broad Institute Single Cell Portal (Tarhan et al., 2023). Clusters that formed transcriptionally defined RGC types were used to compare LKB1 expression levels between different RGC classes. Lkb1 (STK11) expression levels were significantly elevated in F-RGCs relative to all other RGCs and relative to ooDSRGCs and αRGCs types specifically. *P < 0.05, **P < 0.01, ***P < 0.001, nonparametric Mann–Whitney rank-sum U test.
LKB1-dependent RGC migration is restricted to particular RGC classes. (A and B) Representative images (A) and quantification (B) of additional RGC subtypes in controls and in LKB1RET mice at P8 (anti-Tusc5, T5-type, and F-RGCs; Spp1/SMI32 and αRGCs; and anti-SATB2, ON-OFF DSRGCs, and F-RGCs in the first postnatal week). Larger RGC categories that contain F-RGC types were reduced in LKB1 mutants, including those marked by SATB2 and TUSC5, while non-F-RGC type (Spp1/SMI32 and αRGCs) remained unaltered at P8. (C) Reanalysis of an E16 retina single-cell RNA-seq database generated by Shekhar et al. (2022) using the Broad Institute Single Cell Portal (Tarhan et al., 2023). Clusters that formed transcriptionally defined RGC types were used to compare LKB1 expression levels between different RGC classes. Lkb1 (STK11) expression levels were significantly elevated in F-RGCs relative to all other RGCs and relative to ooDSRGCs and αRGCs types specifically. *P < 0.05, **P < 0.01, ***P < 0.001, nonparametric Mann–Whitney rank-sum U test.
Consequences of altered RGC migration and therapeutic implications
What are the downstream consequences of altered RGC migration to the organization of the retinal circuit? Our results and that of others suggest these outcomes may depend on developmental state of the affected neurons, the number of neurons affected, and the developmental timing of the manipulations. When the majority of RGCs are prevented from migrating in zebrafish via overexpression of a membrane-targeted atypical aPKC-CAAX, large-scale retinal lamination defects were observed that included mislocalization of later born neurons and the ectopic extension of RGC axons (Icha et al., 2016). Lamination was normal overall in the LKB1RET mice, however, suggesting the possibility that there may be fundamental differences between zebrafish and mammals in their dependence of RGCs for organizing retinal lamina. In line with this idea, eliminating RGCs from mice does not prevent the proper localization of other non-RGC cell types (Mu et al., 2005), and transplanting developing mouse RGCs (many of which do not laminate properly) into adult mouse eyes does not appear to induce wholescale rearrangement of the retinal lamina (Hertz et al., 2014). However, it remains to be seen whether similar results would occur if RGCs were transplanted earlier during the peak of their generation in mice (e.g., E14). In addition, mistargeted RGCs in LKB1 mutants appear to die by apoptosis and/or be engulfed by microglia. These data suggest either that LKB1 itself is required for the survival of F-RGC types or that proper dendritic and axonal integration into the developing circuit is required for RGC survival. In support of the latter idea, subsets of LKB1-deficient cells that eventually reach the GCL show a second wave of cell death that peaks at P8 when IPL circuit refinement is ongoing. Further, transplanted RGCs that fail to integrate into the mouse circuit also die (Oswald et al., 2021). It will be interesting to determine whether LKB1 is required for the survival of adult RGCs in future studies to help distinguish between these possibilities.
In summary, we have identified a critical molecular pathway that regulates RGC migration to the inner retina. Additionally, we demonstrate that distinct RGC types rely on different migratory mechanisms and highlight an important role for proper somal positioning in promoting RGC survival. Our findings contribute to the growing evidence for LKB1’s specialized cellular functions, despite its ubiquitous expression, suggesting further layers of regulation. As more RGC type–specific developmental pathways are uncovered, these insights will guide targeted interventions to enhance RGC survival, migration, polarization, and circuit integration—paving the way for future therapeutic strategies aimed at RGC replacement.
Materials and methods
Mouse strains
The LKB1 conditional null mutant (LKB1F/F) has been described previously and was provided by R. DePinho, MD Anderson Cancer Center (Bardeesy et al., 2002). LoxP sequences flank exons 2–6, resulting in a complete loss of LKB1 function. To broadly delete Lkb1 in the retina, LKB1F/F mice were crossed to SIX3:Cre (Furuta et al., 2000), provided by W. Kline, Anderson Cancer Center, to generate animals referred to here as LKB1RET mice. Experiments were carried out in male and female mice in accordance with the recommendations in the Guide for the Care and Use of Laboratory Animals of the National Institutes of Health under protocols approved by the BCM Institutional Animal Care and Use Committee.
Immunohistochemistry
Eyes were collected from animals at embryonic (E)16 and at P0, P3, P5, and P8. The day of birth was designated as P0. Antibody staining in whole-mount retinas was performed as previously described (Burger et al., 2021; Jiang et al., 2022). Briefly, eyes were harvested from animals and subsequently fixed in 4% PFA for 45 min. Retinas were then removed from the optic cup and incubated in 300 μl blocking buffer (0.5% Triton X-100 and 10% normal donkey serum in PBS) for 1 h at room temperature. Subsequently, the blocking buffer was replaced with primary antibody diluted in blocking buffer. Retinas were incubated in primary antibody for 3–5 days at 4°C and then washed three times with 1 ml of PBS at room temperature. Retinas were then placed in secondary antibody diluted in blocking buffer and incubated for an additional day at 4°C. Retinas were then washed three times with 1 ml of PBS, mounted onto glass slides, overlaid with ProLong Gold Antifade mounting media (#P36930; Invitrogen), and cover slipped.
To generate retinas for cross-section analysis, eyes were harvested from animals and fixed in 4% PFA for 45 min, followed by the removal of the cornea and lens. Dissected optic cups were cryopreserved in a 30% sucrose/PBS solution and then embedded in Tissue-Tek OCT compound (VWR). Blocks were frozen in methyl butane and then sectioned at 20 μm. Sections were mounted directly onto charged glass slides. To stain retinal sections, tissue was rehydrated with PBS, followed by the addition of blocking buffer for 1 h at room temperature (0.3% Triton X-100 and 3% normal donkey serum in PBS solution). Primary antibodies were diluted in blocking buffer and then overlaid onto the tissue sections. Slides were incubated in a humidified chamber overnight at 4°C and then washed three times for 10 min each in glass chambers filled with PBS. Secondary staining was performed using fluorescently labeled secondary antibodies diluted in blocking buffer, and slides were incubated at room temperature for 1 h. Slides were then washed three times for 10 min each with PBS in glass chambers. Sections were overlaid with ProLong Gold Antifade mounting media (#P36930; Invitrogen) and then cover slipped. Images were acquired on an Olympus Fluoview FV1200 confocal microscope using the Olympus FV10-ASW software, and images were postprocessed using Fiji. All images were acquired at room temperature. Secondary antibodies were labeled with either Alexa Fluor 488, 594, or 647, and DAPI (405) was used to visualize cell nuclei. Magnifications for each image analysis type are described in the histological quantification section. Images were acquired using either a uPlanSApo20×/0.85 oil lens or a uPlanSApo60×/1.35 oil lens.
Histological quantification
All quantification was performed using whole-mount retinas and retinal sections prepared from LKB1RET and control animals at embryonic and early postnatal ages (E16, P0, P3, P5, and P8). Littermate controls were used in all experiments, and all images were acquired at equivalent retinal eccentricities from the optic nerve head. For all experiments, data were collected from four to six mice per group, and three to four images per animal were obtained. To demarcate the retinal layer boundaries and measure the displacement of misplaced RGCs, cross-sectioned tissue from P0 and P3 retinas collected from n = 4 controls and n = 4 mutants were incubated with DAPI to label nuclei paired with an anti-RBPMS antibody (GP α-RBPMS PA5119676; Invitrogen) to label RGCs. The total distance was measured between the apical surface of the retina, demarked as the region just below the retinal pigmented epithelial layer, to the basal retina, demarked as the region just below the cell bodies in the GCL. The total distance was divided into four quadrants, and RGC location was measured relative to either the apical or basal surface and assigned to one of the four quadrants.
To quantify the number of migrating RGCs that have a basal neurite and to measure the length of the neurite, retinal cross sections were generated from E16 tissue and were labeled with antibodies for RBPMS (RGCs) and doublecourtin (migrating RGC neurites, RB α-DCX ab18723; Abcam). To identify the basal neurite, we used the doublecortin label that surrounds the soma of the migrating RGC and extends in a continuous structure and constricts down to form the basal neurite. The percentage of RGCs located outside of the presumptive GCL that did not have a basal neurite were calculated using 60× images from n = 3 controls and n = 3 mutants. Each slice in the image stack was manually examined to determine the presence of the basal neurite for migrating RGCs and to measure its length. The length of the neurite was measured from the basal side of the RGC soma.
To quantify the number of RGCs in the GCL that were lost over development, whole-mount retinas collected at P3, P5, and P8 (n = 4 to 6 controls and n = 4 to 6 mutants) were labeled with RBPMS and imaged at 20×. RBPMS− positive cells were counted in a 20.7-mm2 area, and four representative areas were imaged in each animal. To quantify the number of apoptotic RGCs whole-mount P3, P5, and P8 retinas were labeled with antibodies for RBPMS (RGCs) and caspase 3 (pro-apoptotic marker, RB α-Caspase3 559565; BD Pharmingen) and imaged at 20×. RBPMS+ cells that co-localized with caspase 3 were counted in a 20.7-mm2 area, and four representative areas were imaged in each animal. All caspase-positive RGC nuclei were included in the analysis.
To quantify the number of microglia over development and assess their interaction with RGCs, retinas were collected at P3, P5, and P8 and labeled with an antibody for IBA1 (microglia, RB α-IBA1 019–19741; Fujifilm) and RBPMS, mounted, and imaged at 20×. Total microglia numbers (IBA1-positive cells) were counted in n = 4 controls and n = 4 mutants in a 90.34-mm2 area from four representative areas imaged in each animal. To determine the number of engulfed RGCs, each slice in the image stack was manually examined to determine the association of microglia cells with RGCs. Engulfed RGCs were defined as an IBA1+ cell that contained an RBPMS signal within it. For this analysis, retinas were imaged at 20×, and cells were counted in a 90.34-mm2 area in four representative areas imaged in each animal.
To quantify the proportion of misplaced RGCs that belong to specific RGCs types, P3 retina cross sections from n = 4 controls and n = 4 mutants were labeled with antibodies for RBPMS (pan-RGC marker), Foxp2 (F-RGCs [Rousso et al., 2016], Cat# AF5647; R&D Systems), Opn4 (ipRGCs [Hattar et al., 2002; Provencio et al., 1998], Cat# AN-N39; Advanced Targeting Systems), and SATB1 (Peng et al., 2017) (ON-OFF DSRGCs [Peng et al., 2017], Cat# ab109122, SATB2; Abcam) (enriched in nasal ON-OFF DSRGCs in the first postnatal week [Peng et al., 2017], Cat# ab51502; Abcam), and TUSC5 (T5-RGCs [Tran et al., 2019], Cat# NBP2–48982; Novus Biologicals). Total misplaced RGCs were counted, and the percentage of RGCs that co-localized with one of the RGC type markers were calculated. For Satb1 quantification, brightly stained Satb1-positive dsRGCs (Peng et al., 2017) were separated from dim Satb1-positive cells by deriving the average values of bright cells through sampling mean pixel values from stain images using FIJI. Cells were then quantified and categorized as bright or dim in comparison with the average bright cell pixel value.
Lkb1 transcript analysis
To determine Lkb1 (STK11) expression levels in different RGC types at E16, a reanalysis was performed of the single-cell RNA-seq database generated by Shekhar et al. (2022) using the Broad Institute Single Cell Portal (Tarhan et al., 2023, Preprint). RGC type determination was performed based on transcriptional analysis of genes known to be enriched in specific RGC types (annotated as cell type_trajin in the dataset). At E16, 23 clusters formed transcriptionally defined RGC types, and these were used to compare LKB1 expression. Lkb1 expression values in individual RGCs in each subset were derived from the annotated scatterplot data. In this dataset, retained cells expressed at least 700 genes, resulting in 98,452 cells. Genes expressed in <10 cells were removed. The resulting M genes × N cells matrix of UMI counts CmnCmn was normalized along each column (cell) to sum to 8,340, the median of the column sums resulting in a normalized matrix XmnXmn. This was followed by the transformation Xmn←log(Xmn+1)Xmn←log-(Xmn+1). The raw UM1 counts (expression/transcripts) were adjusted with a factor calculated using the median UMI count across all cells and then log transformed to yield the final normalized expression value, so that the expression is comparable between all cells. Because the data came from different biological replications, batch correction was performed, and the normalized expression values were used.
Statistical analysis
Analyses of the number of mismigrated RGCs, the distance the RGCs were displaced, the length of the basal neurite, the proportion of migrating RGCs that lack the basal neurite, the number of apoptotic RGCs, the number of RGCs in the GCL, the number of microglia, and the number of RGCs engulfed by microglia were performed using a nonparametric Mann–Whitney rank-sum U test. All tests were performed on averaged quantitative values derived from individual animals. Statistical differences were evaluated using GraphPad Prism 10 software. P < 0.05 was considered statistically significant.
Online supplemental material
Fig. S1 provides the validation that Six3:cre is expressed in ganglion cells and that this Cre line effectively knocks out LKB1 in retinal neurons. The mistargeted cells were further confirmed to be RGCs using BRN3A antibodies and are not cycling progenitor cells. This figure also shows that ganglion cell thickness was not changed in mutant retinas compared with controls, and the cross sections were divided into four quadrants for migration distance analysis. Fig. S2 provides the validation that cells labeled with doublecortin in control retinas at P3 are horizontal cells and not RGCs. The figure further characterizes caspase 3 expression in mistargeted cells and shows that caspase 3–positive RGCs are found both in the GCL and in mistargeted RGCs. Fig. S3 further confirms that the RGCs positive for Foxp2 and other markers found in Foxp2 RGCs are significantly reduced at P8 in mutants compared with controls, while other RGC types are not reduced. Furthermore this figure shows scRNAseq data analysis from publicly available depositories, which indicate that LKB1 is enriched in Foxp2 RGCs compared with other RGC types.
Data availability
The data underlying all figures are available either in the published article or its online supplemental material or will be made available upon reasonable request. The database used to generate the transcriptome analysis in Fig. S3 is available through Broad Institute online portal located at https://singlecell.broadinstitute.org/single_cell/study/SCP1706/diversification-of-multipotential-postmitotic-mouse-retinal-ganglion-cell-precursors-into-discrete-types.
Acknowledgments
We thank Sun Chi and Tyler Jackson for their advice, comments, and suggestions on this manuscript.
This work was supported by the National Institutes of Health (grants NIH R01EY030458 and R01EY032566 to M.A. Samuel and F32-EY034358 to R.D. Mackin).
Author contributions: R.D. Mackin: conceptualization, data curation, formal analysis, investigation, methodology, project administration, supervision, validation, visualization, and writing—original draft, review, and editing. R.V. Bhalla: data curation, formal analysis, investigation, visualization, and writing—review and editing. V. Akhanov: formal analysis, methodology, validation, visualization, and writing—review and editing. Q.T. Abdulwahab: investigation. C.A. Burger: conceptualization. M.A. Samuel: conceptualization, funding acquisition, methodology, project administration, resources, supervision, and writing—original draft, review, and editing.