


Arginylation is the posttranslational addition of arginine to a protein by arginyltransferase-1 (ATE1). Previous studies have found that ATE1 targets multiple cytoskeletal proteins, and Ate1 deletion causes cytoskeletal defects, including reduced cell motility and adhesion. Some of these defects have been linked to actin arginylation, but the role of other arginylated cytoskeletal proteins has not been studied. Here, we characterize tubulin arginylation and its role in the microtubule cytoskeleton. We identify ATE1-dependent arginylation of ⍺-tubulin at E77. Ate1−/− cells and cells overexpressing non-arginylatable ⍺-tubulinE77A both show a reduced microtubule growth rate and increased microtubule stability. Additionally, they show an increase in the fraction of the stabilizing protein MAP1S associated with microtubules, suggesting that E77 arginylation directly regulates MAP1S binding. Knockdown of Map1s is sufficient to rescue microtubule growth rate and stability to wild-type levels. Together, these results demonstrate a new type of tubulin regulation by posttranslational arginylation, which modulates microtubule growth rate and stability through the microtubule-associated protein, MAP1S.
Introduction
Arginylation is a posttranslational modification carried out by arginyltransferase-1 (ATE1), which transfers the amino acid arginine (Arg, R) from a tRNA molecule onto a protein (reviewed in Kashina [2015]). In mice, global deletion of Ate1 leads to embryonic lethality starting at E12.5 due to a host of developmental defects (Kwon et al., 2002). Conditional knockout studies implicate ATE1 in multiple physiological processes, including cardiac morphogenesis (Rai et al., 2008), brain development (Wang et al., 2017a), brain health (Wang et al., 2017b), germ cell development (Leu et al., 2009), tumor suppression (Rai et al., 2016), and others (Saha and Kashina, 2011).
While the effects of Ate1 deletion in both development and disease have been extensively studied, its protein targets and the specific functional consequences of their arginylation remain poorly understood. Originally, it was thought that arginylation was restricted to N-terminal acidic residues, where the added Arg could serve as a signal for degradation by the proteasome (Bachmair et al., 1986; Kwon et al., 1999, 2002; Rai and Kashina, 2005). However, more recent studies have shown that many arginylated proteins are metabolically stable (Wong et al., 2007). Furthermore, it was found that arginylation can also occur on the sidechains of the acidic residues glutamate (Glu, E) and aspartate (Asp, D) within a protein, and some ATE1 isoforms can potentially target other N-terminal residues with low efficiency (Eriste et al., 2005; Wang et al., 2014, 2018; MacTaggart et al., 2023). These discoveries have broadened the scope of arginylation targets, as well as their potential biological functions.
One of the major intracellular systems found to be affected by arginylation is the cytoskeleton. Tissue-specific Ate1 mouse knockouts exhibit a variety of cytoskeleton-related phenotypes. For example, Ate1 knockout in neural crest cells leads to reduced cell migration in the embryo and craniofacial defects at birth (Kurosaka et al., 2010). Ate1 knockout in the cardiac muscle leads to disorganized myofibrils and reduced cardiomyocyte contractility (Rai et al., 2008; Kurosaka et al., 2012). Cultured neurons derived from brain-specific Ate1 knockout mice have reduced neurite outgrowth (Wang et al., 2017a). Ate1 knockout mouse embryonic fibroblasts show gross actin cytoskeleton defects, accompanied by reduced cell adhesion and reduced cell motility (Karakozova et al., 2006; Zhang et al., 2012; Batsios et al., 2019).
The best-understood example of cytoskeletal regulation by ATE1 is β-actin, which undergoes N-terminal arginylation (Karakozova et al., 2006; Batsios et al., 2019). Arginylated actin is enriched at the leading edge of cells, where it promotes actin polymerization and cell migration (Saha et al., 2010; Pavlyk et al., 2018; Varland et al., 2019). However, ATE1 has multiple targets in vivo, and it appears likely that the role of ATE1 in the cytoskeleton also extends to other cytoskeletal proteins. Different isoforms of ⍺- and β-tubulin have been detected as putative targets of arginylation in global screens performed by our lab (Wong et al., 2007; Wang et al., 2014; MacTaggart et al., 2023), but these hits have not been further validated, and specific arginylation sites on tubulin have never been definitively identified.
Tubulin is known to undergo extensive regulation by a variety of posttranslational modifications that modulate its activity and are often referred to as the “tubulin code” (reviewed in Roll-Mecak [2020]). Many of these modifications target the unstructured C-terminal tails of tubulin, which protrude from the surface of the polymerized microtubules, but a variety of other modifications occur within the body of the ⍺-/β-tubulin dimer. Since each microtubule is made up of 13 protofilaments formed by these dimers, and each dimer can undergo different modifications, there is an enormous combinatorial capacity to fine-tune microtubule properties. Some tubulin modifications can directly alter microtubule properties, such as acetylation of ⍺K40, which stabilizes microtubules by making them more flexible and preventing breakage (Portran et al., 2017; Xu et al., 2017; Eshun-Wilson et al., 2019). Other modifications can facilitate or prevent the binding of specific microtubule-associated proteins, such as detyrosination of the C-terminal tail of ⍺-tubulin, which stabilizes microtubules in part by protecting them from the depolymerizing kinesin-13/MCAK (Peris et al., 2006; Sirajuddin et al., 2014). Many other tubulin modifications have been reported but not functionally studied (Liu et al., 2015).
Here, we demonstrate that tubulin is a bona fide arginylation target and characterize tubulin arginylation and its functional consequences to cellular microtubules. Cells lacking arginylation exhibit reduced microtubule dynamics and increased microtubule stability. Mass spectrometry analysis of tubulin purified from cultured cells reveals an arginylation site on E77 of ⍺-tubulin exclusively in wild-type cells. Expression of non-arginylatable ⍺-tubulin (TUBA1BE77A) in wild-type cells recapitulates the defects in microtubule dynamics and stability seen in Ate1 knockout cells. Lack of tubulin arginylation in Ate1 knockout and TUBA1BE77A-expressing cells facilitates the binding of the microtubule-stabilizing protein MAP1S, and MAP1S depletion in these cells is sufficient to rescue the microtubule phenotypes. Additionally, Ate1 knockout cells show an increased association of MAP1S with the mitotic spindle, potentially contributing to their increased mitotic index. Together, these studies establish tubulin arginylation as a novel regulator of microtubule dynamics and a new player in the tubulin code.
Results
Tubulin can be directly arginylated by ATE1 in vitro
Tubulin has been previously proposed as a target of arginylation, but its arginylation has never been experimentally verified. To test whether tubulin can be directly arginylated by ATE1, we used the in vitro arginylation assay developed in our lab (Kashina, 2015). Purified porcine brain tubulin was incubated with ATE1, radioactively labeled Arg, and the components required for the tRNA–Arg charging reaction (tRNAArg, RRS, and ATP), followed by autoradiography on SDS-PAGE to visualize Arg incorporation. Tubulin incorporated radiolabeled Arg in a time-dependent manner, as expected for an enzymatic reaction, although not as efficiently as other arginylation targets, such as ⍺-synuclein (Fig. 1 A; Fig. S1, A and B; and Video 1). Consistent with previous findings, ATE1 also self-arginylates (Wang et al., 2011). To test whether this in vitro arginylation depends on tubulin polymerization state, we performed in vitro arginylation on separate preparations of soluble tubulin and prepolymerized microtubules and found that ATE1 efficiently modified both tubulin pools (Fig. 1 B and Fig. S1, C–E). These results confirmed that both soluble tubulin and polymerized microtubules can be directly arginylated by ATE1 in vitro.

ATE1 can directly target tubulin in vitro and is required for maintaining normal intracellular microtubule growth rate and stability. (A) Time course in vitro arginylation reaction showing Coomassie blue (top) and autoradiography (bottom). (B) In vitro arginylation on soluble tubulin and polymerized microtubules showing Coomassie blue (top) and autoradiography (bottom). (C) mCherry-EB3 signal (top) and EB3 tracks color-coded by mean straight-line speed ranging from 0 to 0.4 μm/s (bottom) from movies of Ate1+/+, Ate1−/−, and Ate1−/− + Ate1-GFP cells overexpressing mCherry-EB3 (Video 1). Scale bar = 20 μm. (D) Quantification of EB3 comet velocity. Mean ± SEM, N = 4 (n = 20 cells per condition), Ate1+/+ versus Ate1−/−: ***P = 0.0006, Ate1−/− versus Ate1−/−+ Ate1-GFP: ***P = 0.0003, one-way RM ANOVA corrected for multiple comparisons. Symbol colors indicate paired average measurements. The violin plot represents the distribution of average EB3 comet velocity for individual cells. (E) Immunofluorescence images of Ate1+/+, Ate1−/−, and Ate1−/− + Ate1-GFP cells treated with 2 μM nocodazole for 0 or 10 min, extracted, and stained for ⍺-tubulin (magenta), GFP (green), and DAPI (blue). Scale bar = 10 μm. (F) Quantification of the average microtubule-positive area per cell normalized to t = 0. Mean ± SEM, N = 3 (n = 365–567 cells per condition), 10 min Ate1+/+ versus Ate1−/−: **P = 0.002, 10 min Ate1−/− versus Ate1−/−+ Ate1-GFP: ***P = 0.001, two-way RM ANOVA corrected for multiple comparisons. Symbol colors indicate paired average measurements. The truncated violin plot represents the distribution of the average microtubule-positive area for individual cells. Source data are available for this figure: SourceData F1.
ATE1 can directly target tubulin in vitro and is required for maintaining normal intracellular microtubule growth rate and stability. (A) Time course in vitro arginylation reaction showing Coomassie blue (top) and autoradiography (bottom). (B) In vitro arginylation on soluble tubulin and polymerized microtubules showing Coomassie blue (top) and autoradiography (bottom). (C) mCherry-EB3 signal (top) and EB3 tracks color-coded by mean straight-line speed ranging from 0 to 0.4 μm/s (bottom) from movies of Ate1+/+, Ate1−/−, and Ate1−/− + Ate1-GFP cells overexpressing mCherry-EB3 (Video 1). Scale bar = 20 μm. (D) Quantification of EB3 comet velocity. Mean ± SEM, N = 4 (n = 20 cells per condition), Ate1+/+ versus Ate1−/−: ***P = 0.0006, Ate1−/− versus Ate1−/−+ Ate1-GFP: ***P = 0.0003, one-way RM ANOVA corrected for multiple comparisons. Symbol colors indicate paired average measurements. The violin plot represents the distribution of average EB3 comet velocity for individual cells. (E) Immunofluorescence images of Ate1+/+, Ate1−/−, and Ate1−/− + Ate1-GFP cells treated with 2 μM nocodazole for 0 or 10 min, extracted, and stained for ⍺-tubulin (magenta), GFP (green), and DAPI (blue). Scale bar = 10 μm. (F) Quantification of the average microtubule-positive area per cell normalized to t = 0. Mean ± SEM, N = 3 (n = 365–567 cells per condition), 10 min Ate1+/+ versus Ate1−/−: **P = 0.002, 10 min Ate1−/− versus Ate1−/−+ Ate1-GFP: ***P = 0.001, two-way RM ANOVA corrected for multiple comparisons. Symbol colors indicate paired average measurements. The truncated violin plot represents the distribution of the average microtubule-positive area for individual cells. Source data are available for this figure: SourceData F1.
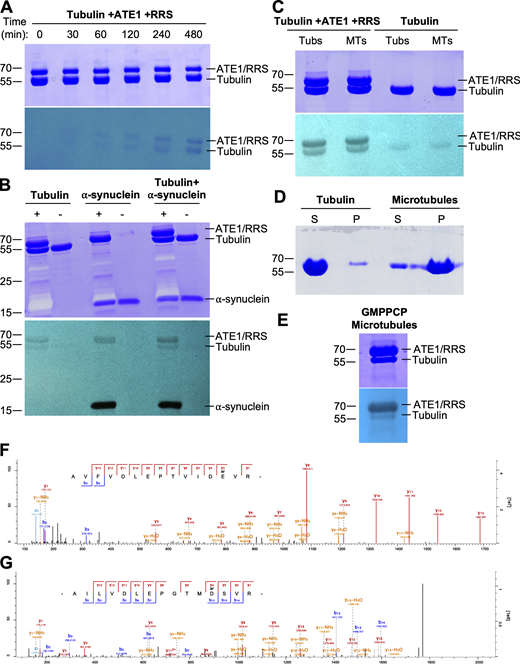
Tubulin can be directly arginylated by ATE1 in vitro and in cells. (A) Independent repeat of the result from Fig. 1 A. Time course in vitro arginylation reaction showing Coomassie blue (top) and autoradiography (bottom). (B) In vitro arginylation reactions on tubulin and/or ⍺-synuclein with Coomassie blue (top) and autoradiography (bottom) to show that incorporation of radiolabeled Arg into the 55 kDa band is specific to tubulin reactions, as opposed to being a contaminant in or degradation product of purified ATE1 or RRS. + indicates a full reaction, and – indicates a negative control. (C) Independent repeat of the result from Fig. 1 B. In vitro arginylation on soluble tubulin and polymerized microtubules showing Coomassie blue (top) and autoradiography (bottom). (D) Coomassie blue gel showing the polymerization status of tubulin used for the in vitro arginylation reactions in Fig. 1 B. Most of the tubulin sample is in the supernatant, and most of the microtubule sample is in the pellet. (E) In vitro arginylation reactions on microtubules polymerized with the GMPPCP, a non-hydrolyzable GTP analog, with Coomassie blue (top) and autoradiography (bottom) to show that arginylation of microtubules is not an artifact of Taxol treatment. (F and G) Representative spectra of E77 arginylation on ⍺-tubulin (F) and D74 arginylation on β-tubulin (G) from Taxol-purified microtubules from wild-type MEFs. Source data are available for this figure: SourceData FS1.

Tubulin can be directly arginylated by ATE1 in vitro and in cells. (A) Independent repeat of the result from Fig. 1 A. Time course in vitro arginylation reaction showing Coomassie blue (top) and autoradiography (bottom). (B) In vitro arginylation reactions on tubulin and/or ⍺-synuclein with Coomassie blue (top) and autoradiography (bottom) to show that incorporation of radiolabeled Arg into the 55 kDa band is specific to tubulin reactions, as opposed to being a contaminant in or degradation product of purified ATE1 or RRS. + indicates a full reaction, and – indicates a negative control. (C) Independent repeat of the result from Fig. 1 B. In vitro arginylation on soluble tubulin and polymerized microtubules showing Coomassie blue (top) and autoradiography (bottom). (D) Coomassie blue gel showing the polymerization status of tubulin used for the in vitro arginylation reactions in Fig. 1 B. Most of the tubulin sample is in the supernatant, and most of the microtubule sample is in the pellet. (E) In vitro arginylation reactions on microtubules polymerized with the GMPPCP, a non-hydrolyzable GTP analog, with Coomassie blue (top) and autoradiography (bottom) to show that arginylation of microtubules is not an artifact of Taxol treatment. (F and G) Representative spectra of E77 arginylation on ⍺-tubulin (F) and D74 arginylation on β-tubulin (G) from Taxol-purified microtubules from wild-type MEFs. Source data are available for this figure: SourceData FS1.
Ate1 knockout results in a decreased microtubule growth rate.Ate1+/+, Ate1−/−, and Ate1−/− + Ate1-GFP cells overexpressing mCherry-EB3. Time is indicated in min:s format, playback speed is 16 fps. Scale bar = 10 μm. Stills from this movie are included in Fig. 1 C.
Ate1 knockout results in a decreased microtubule growth rate.Ate1+/+, Ate1−/−, and Ate1−/− + Ate1-GFP cells overexpressing mCherry-EB3. Time is indicated in min:s format, playback speed is 16 fps. Scale bar = 10 μm. Stills from this movie are included in Fig. 1 C.
Deletion of Ate1 results in decreased microtubule growth rate and increased microtubule stability
To look for ATE1-dependent microtubule phenotypes in cells, we generated mouse embryonic fibroblasts (MEFs) collected from three pairs of littermate wild-type/Ate1 knockout mouse embryos and immortalized them in culture to create biological triplicate cell lines for the experiments. First, we confirmed that these cells indeed lack ATE1 and arginyltransferase activity (Fig. S2, A and B). To measure arginyltransferase activity, we used an intracellular arginylation sensor consisting of ubiquitin, the first 15 amino acids of N-terminally processed β-actin (DDIAALVVDNGSGMC), and GFP. When transfected into cells, the ubiquitin is rapidly cleaved by deubiquitinases, resulting in the expression of N-terminally processed β-actin, which is a well-known target of arginylation by ATE1 (Fig. S2 B) (MacTaggart and Kashina, 2023). In wild-type cells, the arginylated sensor was detected by antibodies to arginylated actin. In Ate1 knockout, the sensor was not arginylated but its arginylation was partially restored after co-transfection with Ate1-GFP (Fig. S2, A–C).
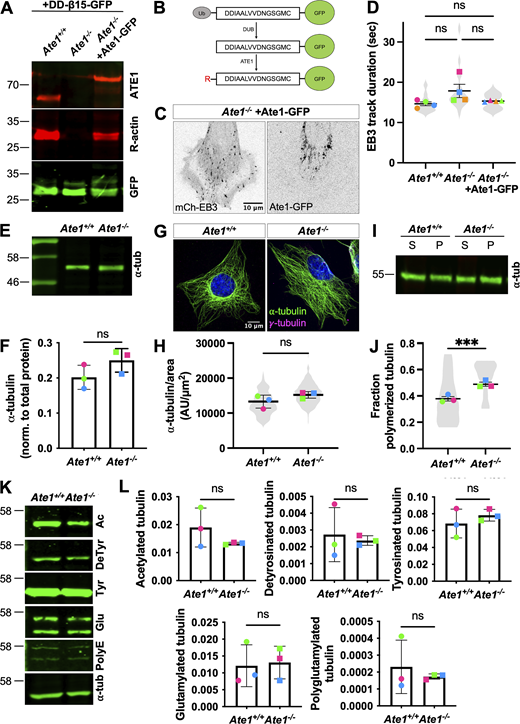
Ate1−/−cells do not show gross defects in the microtubule cytoskeleton. (A) Western blots for ATE1 (top, red), R-actin (middle, red), and GFP (bottom, green) in Ate1+/+ or Ate1−/− cells transfected with the arginylation sensor DD-β15-GFP and/or Ate1-GFP. (B) Schematic for the arginylation sensor used in A. Ub-DD-β15-GFP is expressed, and the ubiquitin is immediately cleaved, producing DD-β15-GFP. ATE1 can arginylate the N-terminal D, producing RDD-β15-GFP. (β15 is the first 15 amino acids of β-actin after N-terminal processing, DDIAALVVDNGSGMC.) (C) Images of Ate1−/− cells co-transfected with mch-EB3 (left) and Ate1-GFP (right). Scale bar = 10 μm. (D) Quantification of the EB3 track duration. Mean ± SEM, N = 4 (n = 20 cells per condition), one-way RM ANOVA corrected for multiple comparisons. Symbol colors indicate paired average measurements. Symbol colors indicate paired average measurements. Violin plot represents the distribution of average EB3 track duration for individual cells. (E) Western blot for ⍺-tubulin in Ate1+/+ or Ate1−/− cells. (F) Quantification of ⍺-tubulin normalized to total protein. Mean ± SD, N = 3, paired t test. Symbol colors indicate paired average measurements. (G) Immunofluorescence images of Ate1+/+ or Ate1−/− cells stained for ⍺-tubulin (green), γ-tubulin (magenta), and DAPI (blue). Scale bar = 20 μm. (H) Quantification of ⍺-tubulin per cell area. Mean ± SEM, N = 3 (n = 182–225 cells per condition), paired t test. Symbol colors indicate paired average measurements. Violin plot represents the distribution of ⍺-tubulin per cell area for individual cells. (I) Western blots for ⍺-tubulin on soluble and polymerized tubulin fractions from Ate1+/+ or Ate1−/− cells. (J) Quantification of the fraction of ⍺-tubulin in the polymerized tubulin fraction. Mean ± SEM, N = 3 (n = 12 total repeats per condition), Ate1+/+ versus Ate1−/−: ***P = 0.0005, paired t test. Symbol colors indicate paired average measurements. Truncated violin plot represents the fraction of polymerized tubulin for individual repeats. (K) Western blots for other tubulin post-translational modifications in Ate1+/+ or Ate1−/− cells: acetylation, detyrosination, tyrosination, glutamylation, and polyglutamylation. (L) Quantification of other tubulin post-translational modifications normalized to total protein. Mean ± SD, N = 3, paired t test. Symbol colors indicate paired average measurements. Source data are available for this figure: SourceData FS2.

Ate1−/−cells do not show gross defects in the microtubule cytoskeleton. (A) Western blots for ATE1 (top, red), R-actin (middle, red), and GFP (bottom, green) in Ate1+/+ or Ate1−/− cells transfected with the arginylation sensor DD-β15-GFP and/or Ate1-GFP. (B) Schematic for the arginylation sensor used in A. Ub-DD-β15-GFP is expressed, and the ubiquitin is immediately cleaved, producing DD-β15-GFP. ATE1 can arginylate the N-terminal D, producing RDD-β15-GFP. (β15 is the first 15 amino acids of β-actin after N-terminal processing, DDIAALVVDNGSGMC.) (C) Images of Ate1−/− cells co-transfected with mch-EB3 (left) and Ate1-GFP (right). Scale bar = 10 μm. (D) Quantification of the EB3 track duration. Mean ± SEM, N = 4 (n = 20 cells per condition), one-way RM ANOVA corrected for multiple comparisons. Symbol colors indicate paired average measurements. Symbol colors indicate paired average measurements. Violin plot represents the distribution of average EB3 track duration for individual cells. (E) Western blot for ⍺-tubulin in Ate1+/+ or Ate1−/− cells. (F) Quantification of ⍺-tubulin normalized to total protein. Mean ± SD, N = 3, paired t test. Symbol colors indicate paired average measurements. (G) Immunofluorescence images of Ate1+/+ or Ate1−/− cells stained for ⍺-tubulin (green), γ-tubulin (magenta), and DAPI (blue). Scale bar = 20 μm. (H) Quantification of ⍺-tubulin per cell area. Mean ± SEM, N = 3 (n = 182–225 cells per condition), paired t test. Symbol colors indicate paired average measurements. Violin plot represents the distribution of ⍺-tubulin per cell area for individual cells. (I) Western blots for ⍺-tubulin on soluble and polymerized tubulin fractions from Ate1+/+ or Ate1−/− cells. (J) Quantification of the fraction of ⍺-tubulin in the polymerized tubulin fraction. Mean ± SEM, N = 3 (n = 12 total repeats per condition), Ate1+/+ versus Ate1−/−: ***P = 0.0005, paired t test. Symbol colors indicate paired average measurements. Truncated violin plot represents the fraction of polymerized tubulin for individual repeats. (K) Western blots for other tubulin post-translational modifications in Ate1+/+ or Ate1−/− cells: acetylation, detyrosination, tyrosination, glutamylation, and polyglutamylation. (L) Quantification of other tubulin post-translational modifications normalized to total protein. Mean ± SD, N = 3, paired t test. Symbol colors indicate paired average measurements. Source data are available for this figure: SourceData FS2.
Next, we tested whether the lack of ATE1 leads to any overall changes in the microtubule cytoskeleton. We found no significant changes in the total amount of tubulin (Fig. S2, E and F) or the overall organization of cellular microtubules (Fig. S2, G and H). We observed a small but significant increase in the fraction of polymerized tubulin in Ate1−/− cells (Fig. S2, I and J). Additionally, we found no changes in the abundance of other major tubulin posttranslational modifications (Fig. S2, K and L). Thus, Ate1 deletion does not appear to affect the microtubule steady state.
Microtubules in cells are highly dynamic and many regulatory factors can affect this dynamic behavior without any visible changes in the steady state. To test whether lack of arginylation affects microtubule dynamics, we transfected wild-type and Ate1−/− cells with mCherry-EB3, a microtubule plus-end tracking protein, to track microtubule growth rate. Strikingly, Ate1−/− cells showed a 30% decrease in EB3 comet velocity compared with wild-type, indicating a decrease in microtubule growth rate. To confirm that this change was due to the lack of ATE1, we cotransfected Ate1-GFP into these cells and found that this fully rescued the microtubule growth rate (Fig. 1, C and D; and Fig. S2 C). We also observed a 20% increase in EB3 track duration in Ate1−/− cells, although this did not reach statistical significance, suggesting that microtubules in these cells might undergo slightly longer periods of growth (Fig. S2 D).
A decrease in microtubule growth is commonly associated with an increase in microtubule stability. To test if microtubules in Ate1−/− cells are more stable than those in wild-type cells, we treated cells with the microtubule depolymerizing drug nocodazole for different durations, extracted the soluble tubulin, and visualized the remaining depolymerization-resistant microtubules by immunofluorescence. We then quantified the total area occupied by the microtubules in each cell after the treatment. While there was no significant difference in the microtubule area before treatment, Ate1−/− cells showed a twofold increase in the fraction of microtubule area remaining following nocodazole treatment compared to wild-type cells, indicating an increase in microtubule stability. This effect could be fully rescued by re-expressing Ate1-GFP (Fig. 1, E and F; and Fig. S3, A–C).

Ate1 −/− cells show increased microtubule stability, and knockdown of Map1s can rescue microtubule stability in Ate1 −/− cells. (A) Immunofluorescence images of Ate1+/+, Ate1−/−, Ate1−/− + Ate1-GFP cells treated with 2 μM nocodazole for 0, 30, or 60 min, extracted, and stained for ⍺-tubulin (magenta) and DAPI (blue). Scale bar = 10 μm. (B) Quantification of the microtubule area per cell before nocodazole treatment. Mean ± SEM, N = 6 (n = 1,217–1,635 cells per condition), one-way RM ANOVA corrected for multiple comparisons. (C) Quantification of the average microtubule positive area per cell normalized to t = 0. Mean ± SEM, N = 3 (n = 650–1,137 cells per condition), 30 min Ate1+/+ versus Ate1−/−: ****P < 0.0001, 30 min Ate1−/− versus Ate1−/− + Ate1-GFP: ****P < 0.0001, 60 min Ate1+/+ versus Ate1−/−: ***P = 0.0009, 60 min Ate1−/− versus Ate1−/− + Ate1-GFP: ***P = 0.0002, two-way RM ANOVA corrected for multiple comparisons. For (B and C), symbol colors indicate paired average measurements, and truncated violin plots represent the distribution of average microtubule-positive area for individual cells. (D) Immunofluorescence images of Ate1+/+ and Ate1−/− cells transfected with siCtrl or siMap1s and treated with 2 μM nocodazole for 0, 30, or 60 min, extracted, and stained for ⍺-tubulin (magenta) and DAPI (blue). Scale bar = 10 μm. (E) Quantification of the microtubule area per cell before nocodazole treatment. Mean ± SEM, N = 6 (n = 1,263–2,042 cells per condition), one-way RM ANOVA corrected for multiple comparisons. (F) Quantification of the average microtubule-positive area per cell normalized to t = 0. Mean ± SEM, N = 3 (n = 769–1,174 cells per condition), 30 min Ate1+/+ + siCtrl versus Ate1−/− + siCtrl: ****P < 0.0001, 30 min Ate1+/+ + siCtrl versus Ate1−/− + siMap1s: *P = 0.0123, 30 min Ate1−/− + siCtrl versus Ate1+/+ +siMap1s: ****P < 0.0001, 30 min Ate1−/− + siCtrl versus Ate1−/− + siMap1s: ****P < 0.0001, 60 min Ate1+/+ +siCtrl versus Ate1−/− + siCtrl: ***P = 0.001, 60 min Ate1−/− + siCtrl versus Ate1+/+ +siMap1s: ***P = 0.0005, 60 min Ate1−/− + siCtrl versus Ate1−/− + siMap1s: ***P = 0.0001, two-way RM ANOVA corrected for multiple comparisons. For (E and F), symbol colors indicate paired average measurements, and truncated violin plots represent the distribution of average microtubule-positive area for individual cells.

Ate1 −/− cells show increased microtubule stability, and knockdown of Map1s can rescue microtubule stability in Ate1 −/− cells. (A) Immunofluorescence images of Ate1+/+, Ate1−/−, Ate1−/− + Ate1-GFP cells treated with 2 μM nocodazole for 0, 30, or 60 min, extracted, and stained for ⍺-tubulin (magenta) and DAPI (blue). Scale bar = 10 μm. (B) Quantification of the microtubule area per cell before nocodazole treatment. Mean ± SEM, N = 6 (n = 1,217–1,635 cells per condition), one-way RM ANOVA corrected for multiple comparisons. (C) Quantification of the average microtubule positive area per cell normalized to t = 0. Mean ± SEM, N = 3 (n = 650–1,137 cells per condition), 30 min Ate1+/+ versus Ate1−/−: ****P < 0.0001, 30 min Ate1−/− versus Ate1−/− + Ate1-GFP: ****P < 0.0001, 60 min Ate1+/+ versus Ate1−/−: ***P = 0.0009, 60 min Ate1−/− versus Ate1−/− + Ate1-GFP: ***P = 0.0002, two-way RM ANOVA corrected for multiple comparisons. For (B and C), symbol colors indicate paired average measurements, and truncated violin plots represent the distribution of average microtubule-positive area for individual cells. (D) Immunofluorescence images of Ate1+/+ and Ate1−/− cells transfected with siCtrl or siMap1s and treated with 2 μM nocodazole for 0, 30, or 60 min, extracted, and stained for ⍺-tubulin (magenta) and DAPI (blue). Scale bar = 10 μm. (E) Quantification of the microtubule area per cell before nocodazole treatment. Mean ± SEM, N = 6 (n = 1,263–2,042 cells per condition), one-way RM ANOVA corrected for multiple comparisons. (F) Quantification of the average microtubule-positive area per cell normalized to t = 0. Mean ± SEM, N = 3 (n = 769–1,174 cells per condition), 30 min Ate1+/+ + siCtrl versus Ate1−/− + siCtrl: ****P < 0.0001, 30 min Ate1+/+ + siCtrl versus Ate1−/− + siMap1s: *P = 0.0123, 30 min Ate1−/− + siCtrl versus Ate1+/+ +siMap1s: ****P < 0.0001, 30 min Ate1−/− + siCtrl versus Ate1−/− + siMap1s: ****P < 0.0001, 60 min Ate1+/+ +siCtrl versus Ate1−/− + siCtrl: ***P = 0.001, 60 min Ate1−/− + siCtrl versus Ate1+/+ +siMap1s: ***P = 0.0005, 60 min Ate1−/− + siCtrl versus Ate1−/− + siMap1s: ***P = 0.0001, two-way RM ANOVA corrected for multiple comparisons. For (E and F), symbol colors indicate paired average measurements, and truncated violin plots represent the distribution of average microtubule-positive area for individual cells.
It has been previously shown that Ate1 knockout leads to prominent changes in the actin cytoskeleton, largely due to the lack of arginylated β-actin (Karakozova et al., 2006; Saha et al., 2010; Pavlyk et al., 2018; Batsios et al., 2019; Varland et al., 2019). We wanted to confirm that the microtubule phenotypes observed in Ate1−/− cells are not an indirect consequence of the absence of arginylated β-actin via actin-microtubule crosstalk. To this end, we transfected Ate1−/− cells with arginylated β-actin (R-β-actin-GFP). In our previous studies, such overexpression was sufficient to rescue the leading edge defects in Ate1−/− cells (Karakozova et al., 2006). However, we found that overexpression of R-β-actin was unable to rescue microtubule growth rate or stability in Ate1−/− cells (Fig. S4 and Video 2).
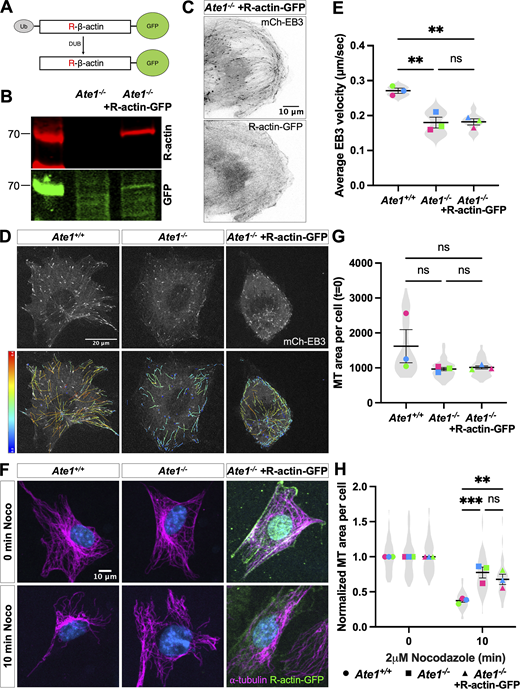
Expressing R-β-actin in Ate1−/−cells does not rescue microtubule growth rate or stability. (A) Schematic of expressing R-actin-GFP. Ub-R-β-actin-GFP is expressed, and the ubiquitin is immediately cleaved, producing R-β-actin-GFP. (B) Western blot showing the expression of R-β-actin-GFP in Ate1−/− cells. (C) Images of Ate1−/− cells co-transfected with mch-EB3 (top) and R-actin-GFP (bottom). Scale bar = 10 μm. (D) mCherry-EB3 signal (top) and tracks color-coded by mean straight line speed ranging from 0 to 0.4 μm/s (bottom) from movies of Ate1+/+ or Ate1−/− cells overexpressing R-actin-GFP and/or mCherry-EB3 (Video 2). Scale bar = 20 μm. (E) Quantification of the EB3 comet velocity. Mean ± SEM, N = 3 (n = 9 cells per condition), Ate1+/+ versus Ate1−/−: ***P = 0.0031, Ate1−/− versus Ate1−/− + R-actin-GFP: ***P = 0.0033, one-way RM ANOVA corrected for multiple comparisons. Symbol colors indicate paired average measurements, Violin plot represents the distribution of average EB3 comet velocity for individual cells. (F) Immunofluorescence images of Ate1+/+, Ate1−/−, Ate1−/− + R-actin-GFP cells treated with 2 μM nocodazole for 0 or 10 min, extracted, and stained for ⍺-tubulin (magenta), GFP (green), and DAPI (blue). Scale bar = 10 μm. (G) Quantification of the microtubule area per cell before nocodazole treatment. Mean ± SEM, N = 3 (n = 324–432 cells per condition), one-way RM ANOVA corrected for multiple comparisons. (H) Quantification of the average microtubule-positive area per cell normalized to t = 0. Mean ± SEM, N = 3 (n = 227–432 cells per condition), 10 min Ate1+/+ versus Ate1−/−: ***P = 0.0003, 10 min Ate1−/− versus Ate1−/− + Ate1-GFP: **P = 0.0021, two-way RM ANOVA corrected for multiple comparisons. For G and H, symbol colors indicate paired average measurements, and truncated violin plots represent the distribution of average microtubule-positive area for individual cells. Source data are available for this figure: SourceData FS4.

Expressing R-β-actin in Ate1−/−cells does not rescue microtubule growth rate or stability. (A) Schematic of expressing R-actin-GFP. Ub-R-β-actin-GFP is expressed, and the ubiquitin is immediately cleaved, producing R-β-actin-GFP. (B) Western blot showing the expression of R-β-actin-GFP in Ate1−/− cells. (C) Images of Ate1−/− cells co-transfected with mch-EB3 (top) and R-actin-GFP (bottom). Scale bar = 10 μm. (D) mCherry-EB3 signal (top) and tracks color-coded by mean straight line speed ranging from 0 to 0.4 μm/s (bottom) from movies of Ate1+/+ or Ate1−/− cells overexpressing R-actin-GFP and/or mCherry-EB3 (Video 2). Scale bar = 20 μm. (E) Quantification of the EB3 comet velocity. Mean ± SEM, N = 3 (n = 9 cells per condition), Ate1+/+ versus Ate1−/−: ***P = 0.0031, Ate1−/− versus Ate1−/− + R-actin-GFP: ***P = 0.0033, one-way RM ANOVA corrected for multiple comparisons. Symbol colors indicate paired average measurements, Violin plot represents the distribution of average EB3 comet velocity for individual cells. (F) Immunofluorescence images of Ate1+/+, Ate1−/−, Ate1−/− + R-actin-GFP cells treated with 2 μM nocodazole for 0 or 10 min, extracted, and stained for ⍺-tubulin (magenta), GFP (green), and DAPI (blue). Scale bar = 10 μm. (G) Quantification of the microtubule area per cell before nocodazole treatment. Mean ± SEM, N = 3 (n = 324–432 cells per condition), one-way RM ANOVA corrected for multiple comparisons. (H) Quantification of the average microtubule-positive area per cell normalized to t = 0. Mean ± SEM, N = 3 (n = 227–432 cells per condition), 10 min Ate1+/+ versus Ate1−/−: ***P = 0.0003, 10 min Ate1−/− versus Ate1−/− + Ate1-GFP: **P = 0.0021, two-way RM ANOVA corrected for multiple comparisons. For G and H, symbol colors indicate paired average measurements, and truncated violin plots represent the distribution of average microtubule-positive area for individual cells. Source data are available for this figure: SourceData FS4.
Expressing R-β-actin in Ate1−/−cells does not rescue microtubule growth rate.Ate1+/+, Ate1−/−, and Ate1−/− + R-actin-GFP cells overexpressing mCherry-EB3. Time is indicated in min:s format, playback speed is 20 fps. Scale bar = 10 μm. Stills from this movie are included in Fig. S4 D.
Expressing R-β-actin in Ate1−/−cells does not rescue microtubule growth rate.Ate1+/+, Ate1−/−, and Ate1−/− + R-actin-GFP cells overexpressing mCherry-EB3. Time is indicated in min:s format, playback speed is 20 fps. Scale bar = 10 μm. Stills from this movie are included in Fig. S4 D.
Thus, Ate1 knockout leads to decreased microtubule growth and a prominent increase in the fraction of stable microtubules, showing that ATE1 plays a role in maintaining microtubule dynamics that is independent of actin arginylation.
Arginylation of E77 in ⍺-tubulin is essential for normal microtubule dynamics and stability
To test if tubulin is functionally arginylated in vivo, we performed mass spectrometry of Taxol-purified microtubules from Ate1+/+ and Ate1−/− cells (Fig. 2 A) (Miller et al., 2010). We identified two arginylated sites that were present exclusively in wild-type samples: E77 on ⍺-tubulin (TUBA1B) and D74 on β-tubulin (TUBB5) (Fig. 2 B; and Fig. S1, F and G). Notably, peptides containing both of these residues were identified as targets of arginylation in a recent ex vivo ATE1 activity screen on human brain lysates (Lin et al., 2024, Preprint), and the β-tubulin peptide was previously identified in an arginylation screen from various mouse tissues (Wong et al., 2007). Both sites are located in similar positions in the highly homologous ⍺- and β-tubulin (Fig. 2 C), suggesting that this specific region of the tubulin molecule possesses structural features that make them favorable substrates for ATE1 (Wang et al., 2014, 2018). Furthermore, both sites are located on the luminal side of the tubulin dimer, rather than on the C-terminal tails which tend to be extensively modified. Structural modeling using published tubulin crystal structures reveals that ⍺E77 and βD74 occupy the intradimer and interdimer interfaces, respectively, and are both predicted to be involved in electrostatic interactions within and/or between dimers (Fig. 2, D and E) (Nogales et al., 1998; Berman et al., 2000; Löwe et al., 2001; Berman et al., 2003; Alushin et al., 2014).

Tubulin is arginylated at E77 on ⍺-tubulin and D74 on β-tubulin in cells. (A) Western blot of microtubule purification steps for mass spectrometry analysis of arginylation. Total protein (top, red); tubulin (bottom, green). (B) Summary of the average ratio of arginylated to total peptide intensity, posterior error probability, and location probability for each arginylation site identified. (C) Sequence alignment of ⍺-tubulin (mouse Tuba1b) and β-tubulin (mouse Tubb5) in the vicinity of the arginylated sites, with the identified peptides underlined and the arginylated residues highlighted in red. (D and E) Structural modeling of the tubulin dimer (PDB ID: 1JFF) showing the location of ⍺E77 (D) and βD74 (E) (highlighted in yellow). Insets show the enlarged regions around the arginylated sites in the microtubule (PDB ID: 3J6F) to illustrate the interactions ⍺E77 and βD74 participate in. Structures are from the RSCB PDB (http://RSCB.org), PDB IDs 1JFF and 3J6F. (F) Extracted ion chromatograms of chemically synthesized non-arginylated and arginylated ⍺-tubulin peptides: CDLEPTVIDEVRTG (top) and CDLEPTVIDE(Arg)VRTG (bottom), showing that the peaks for these two peptides have similar intensities and their abundance can be compared directly in a physiological sample assuming they were not differentially affected by signal suppression from co-eluting peptides. Red boxes indicate the area (AA) and base peak (BP) of the major product. (G) Estimation of the percentage of the peptide AVFVDLEPTVIDEVR that is arginylated at E77 derived from peak intensities in the physiological samples. Source data are available for this figure: SourceData F2.
Tubulin is arginylated at E77 on ⍺-tubulin and D74 on β-tubulin in cells. (A) Western blot of microtubule purification steps for mass spectrometry analysis of arginylation. Total protein (top, red); tubulin (bottom, green). (B) Summary of the average ratio of arginylated to total peptide intensity, posterior error probability, and location probability for each arginylation site identified. (C) Sequence alignment of ⍺-tubulin (mouse Tuba1b) and β-tubulin (mouse Tubb5) in the vicinity of the arginylated sites, with the identified peptides underlined and the arginylated residues highlighted in red. (D and E) Structural modeling of the tubulin dimer (PDB ID: 1JFF) showing the location of ⍺E77 (D) and βD74 (E) (highlighted in yellow). Insets show the enlarged regions around the arginylated sites in the microtubule (PDB ID: 3J6F) to illustrate the interactions ⍺E77 and βD74 participate in. Structures are from the RSCB PDB (http://RSCB.org), PDB IDs 1JFF and 3J6F. (F) Extracted ion chromatograms of chemically synthesized non-arginylated and arginylated ⍺-tubulin peptides: CDLEPTVIDEVRTG (top) and CDLEPTVIDE(Arg)VRTG (bottom), showing that the peaks for these two peptides have similar intensities and their abundance can be compared directly in a physiological sample assuming they were not differentially affected by signal suppression from co-eluting peptides. Red boxes indicate the area (AA) and base peak (BP) of the major product. (G) Estimation of the percentage of the peptide AVFVDLEPTVIDEVR that is arginylated at E77 derived from peak intensities in the physiological samples. Source data are available for this figure: SourceData F2.
To estimate the fraction of tubulin that is arginylated, we used mass spectrometry to compare the intensities of arginylated peptides to the total intensity of the non-arginylated versions of those peptides. The average ratio of arginylated peptide intensity to total peptide intensity was 0.06 for ⍺E77 and 0.01 for βD74 (Fig. 2 B and Table S1). However, this estimation was complicated by the fact that posttranslational modifications can alter the ionization efficiency of peptides, meaning you cannot always directly compare the intensities of arginylated and unmodified peptides (Parker et al., 2010). To address this, we compared known quantities of standard arginylated and unmodified peptides corresponding to those we wanted to quantify. For βD74, we were unable to provide an estimate because the unmodified and arginylated peptides behaved so differently with an intensity ratio of 1–4.4. For ⍺E77, the chemically synthesized unmodified and arginylated peptides behaved similarly by mass spectrometry with an intensity ratio of 1–0.7 (Fig. 2 F), allowing us to use peak intensity data to directly compare the abundance of the two peptides. While not fully quantitative, this method enabled us to estimate that 7–9% of ⍺-tubulin isolated from wild-type cells was arginylated at E77 (Fig. 2 G). This level of arginylation is overall consistent with published estimates of steady-state levels of different posttranslational modifications and is considerably higher than the level of arginylation observed on actin (Chen and Kashina, 2019).
To test whether tubulin arginylation at ⍺E77 and/or βD74 has functional consequences to microtubule dynamics and/or stability, as seen in Ate1 knockout cells, we generated “non-arginylatable” Flag-tagged tubulin constructs by mutating the target D/E residue to alanine (Ala, A) (Fig. S5 A). We performed several control experiments to make sure that these mutations do not render tubulin non-functional in cells. First, we confirmed that both Flag-TUBA1BE77A and TUBB5D74A-Flag were able to incorporate into microtubules, and their expression did not alter the overall microtubule distribution (Fig. S5 B). Next, we performed a cycloheximide chase to confirm that the protein stability of Flag-TUBA1BE77A and TUBB5D74A-Flag does not differ from wild-type Flag-tagged tubulin (Flag-TUBA1BWT and TUBB5WT-Flag) (Fig. S5, C and D). Finally, we fractionated transfected cell extracts to confirm that Flag-TUBA1BE77A and TUBB5D74A-Flag showed no change in their partition between soluble and polymerized tubulin fractions compared to Flag-TUBA1BWT and TUBB5WT-Flag, respectively. Additionally, we confirmed that the expression of Flag-TUBA1BE77A or TUBB5D74A-Flag caused no change in the fraction of total polymerized tubulin compared with the expression of wild-type Flag-tagged tubulin (Fig. S5, E and F). These assays showed no impairments of D/E to A tubulin mutations on the structure or function of tubulin. Since no other tubulin posttranslational modifications have been reported on these specific residues (Hornbeck et al., 2012), we concluded that our mutants were suitable for testing the direct effects of preventing tubulin arginylation at either ⍺E77 or βD74 on microtubules.
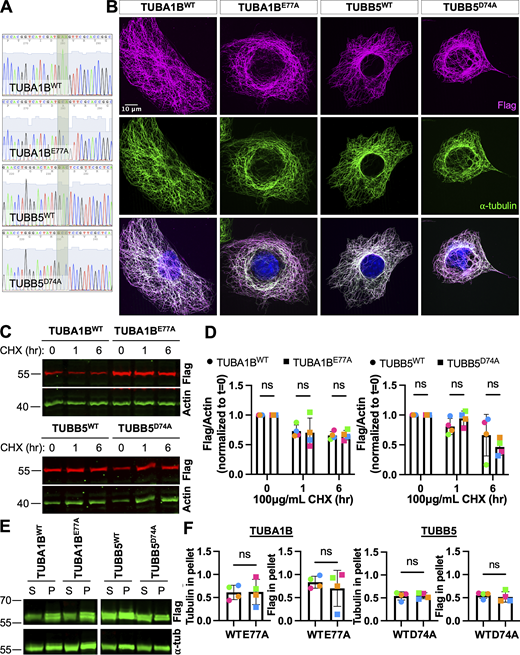
Non-arginylatable tubulin constructs Flag-TUBA1BE77Aand TUBB5D74A-Flag can be incorporated into the microtubule cytoskeleton similarly to wild-type tubulin. (A) Sanger sequencing confirmation of Flag-TUBA1BWT, Flag-TUBA1BE77A, TUBB5WT-Flag, and TUBB5D74A-Flag. (B) Immunofluorescence of wild-type MEFs overexpressing Flag-TUBA1BWT, Flag-TUBA1BE77A, TUBB5WT-Flag, or TUBB5D74A-Flag, showing incorporation of the Flag-tagged tubulin constructs (magenta) into the normal microtubule cytoskeleton (green). Scale bar = 10 μm. (C) Western blots for Flag (top, red) and actin (bottom, green) on cell lysates from wild-type MEFs overexpressing Flag-TUBA1BWT, Flag-TUBA1BE77A, TUBB5WT-Flag, or TUBB5D74A-Flag and treated with 100 μg/ml CHX for 0–6 h. (D) Quantification of the Flag to actin (loading control) signal ratio normalized to t = 0. Mean ± SD, N = 4, two-way RM ANOVA corrected for multiple comparisons. Symbol colors indicate paired average measurements. (E) Western blots for Flag (top, green) and tubulin (bottom, green) on soluble and polymerized tubulin fractions from cells overexpressing Flag-TUBA1BWT, Flag-TUBA1BE77A, TUBB5WT-Flag, or TUBB5D74A-Flag. Note that the tubulin loading control images (bottom) are the same as the ones in the main text Fig. 6 A, since the two blots shown come from the same experimental repeat. (F) Quantification of the fraction of Flag-tubulin (top) or total tubulin (bottom) in the polymerized tubulin fraction. Mean ± SD, N = 4, paired t test. Symbol colors indicate paired average measurements. Source data are available for this figure: SourceData FS5.

Non-arginylatable tubulin constructs Flag-TUBA1BE77Aand TUBB5D74A-Flag can be incorporated into the microtubule cytoskeleton similarly to wild-type tubulin. (A) Sanger sequencing confirmation of Flag-TUBA1BWT, Flag-TUBA1BE77A, TUBB5WT-Flag, and TUBB5D74A-Flag. (B) Immunofluorescence of wild-type MEFs overexpressing Flag-TUBA1BWT, Flag-TUBA1BE77A, TUBB5WT-Flag, or TUBB5D74A-Flag, showing incorporation of the Flag-tagged tubulin constructs (magenta) into the normal microtubule cytoskeleton (green). Scale bar = 10 μm. (C) Western blots for Flag (top, red) and actin (bottom, green) on cell lysates from wild-type MEFs overexpressing Flag-TUBA1BWT, Flag-TUBA1BE77A, TUBB5WT-Flag, or TUBB5D74A-Flag and treated with 100 μg/ml CHX for 0–6 h. (D) Quantification of the Flag to actin (loading control) signal ratio normalized to t = 0. Mean ± SD, N = 4, two-way RM ANOVA corrected for multiple comparisons. Symbol colors indicate paired average measurements. (E) Western blots for Flag (top, green) and tubulin (bottom, green) on soluble and polymerized tubulin fractions from cells overexpressing Flag-TUBA1BWT, Flag-TUBA1BE77A, TUBB5WT-Flag, or TUBB5D74A-Flag. Note that the tubulin loading control images (bottom) are the same as the ones in the main text Fig. 6 A, since the two blots shown come from the same experimental repeat. (F) Quantification of the fraction of Flag-tubulin (top) or total tubulin (bottom) in the polymerized tubulin fraction. Mean ± SD, N = 4, paired t test. Symbol colors indicate paired average measurements. Source data are available for this figure: SourceData FS5.
Compared with overexpression of Flag-TUBA1BWT, overexpression of Flag-TUBA1BE77A in wild-type cells resulted in a decrease in the microtubule growth rate and an increase in the fraction of depolymerization-resistant microtubules comparable with that observed in Ate1−/− cells (Fig. 3and Video 3). In contrast, overexpression of TUBB5D74A-Flag did not cause any change in microtubule growth rate or in the fraction of depolymerization-resistant microtubules (Fig. 3 and Video 4). Thus, arginylation of ⍺-tubulin at E77, but not β-tubulin at D74, is specifically required for ATE1-dependent regulation of microtubule dynamics.

Overexpression of Flag-TUBA1B E77A in Ate1 +/+ cells phenocopies microtubule defects observed in Ate1 −/− cells. (A) mCherry-EB3 signal (top) and tracks color-coded by mean straight-line speed ranging from 0 to 0.4 μm/s (bottom) from movies of wild-type cells overexpressing Flag-TUBA1BWT, Flag-TUBA1BE77A, TUBB5WT-Flag, or TUBB5D74A-Flag and mCherry-EB3 (Videos 3 and 4). Scale bar = 20 μm. (B) Quantification of the EB3 comet velocity. Mean ± SEM, N = 3 (n = 12 cells per condition), Flag-TUBA1BWT versus Flag-TUBA1BE77A: **P = 0.003, two-tailed paired t test. Symbol colors indicate paired average measurements. The violin plot represents the distribution of average EB3 comet velocity for individual cells. (C) Immunofluorescence images of wild-type cells overexpressing Flag-TUBA1BWT, Flag-TUBA1BE77A, TUBB5WT-Flag, or TUBB5D74A-Flag treated with 0.5 μM nocodazole for 0 or 10 min, extracted, and stained for Flag (magenta), ⍺-tubulin (green), and DAPI (blue). Scale bar = 10 μm. (D) Quantification of the average microtubule-positive area per cell normalized to t = 0. Mean ± SEM, N = 3 (n = 124–197 cells per condition), 10 min Flag-TUBA1BWT versus Flag-TUBA1BE77A: **P = 0.004, two-way RM ANOVA corrected for multiple comparisons. Symbol colors indicate paired average measurements. The truncated violin plot represents the distribution of the average microtubule-positive area for individual cells.
Overexpression of Flag-TUBA1B E77A in Ate1 +/+ cells phenocopies microtubule defects observed in Ate1 −/− cells. (A) mCherry-EB3 signal (top) and tracks color-coded by mean straight-line speed ranging from 0 to 0.4 μm/s (bottom) from movies of wild-type cells overexpressing Flag-TUBA1BWT, Flag-TUBA1BE77A, TUBB5WT-Flag, or TUBB5D74A-Flag and mCherry-EB3 (Videos 3 and 4). Scale bar = 20 μm. (B) Quantification of the EB3 comet velocity. Mean ± SEM, N = 3 (n = 12 cells per condition), Flag-TUBA1BWT versus Flag-TUBA1BE77A: **P = 0.003, two-tailed paired t test. Symbol colors indicate paired average measurements. The violin plot represents the distribution of average EB3 comet velocity for individual cells. (C) Immunofluorescence images of wild-type cells overexpressing Flag-TUBA1BWT, Flag-TUBA1BE77A, TUBB5WT-Flag, or TUBB5D74A-Flag treated with 0.5 μM nocodazole for 0 or 10 min, extracted, and stained for Flag (magenta), ⍺-tubulin (green), and DAPI (blue). Scale bar = 10 μm. (D) Quantification of the average microtubule-positive area per cell normalized to t = 0. Mean ± SEM, N = 3 (n = 124–197 cells per condition), 10 min Flag-TUBA1BWT versus Flag-TUBA1BE77A: **P = 0.004, two-way RM ANOVA corrected for multiple comparisons. Symbol colors indicate paired average measurements. The truncated violin plot represents the distribution of the average microtubule-positive area for individual cells.
Overexpression of Flag-TUBA1BE77Ain wild-type cells results in a decreased microtubule growth rate. Wild-type cells overexpressing Flag-TUBA1BWT or Flag-TUBA1BE77A and mCherry-EB3. Time is indicated in min:s format, playback speed is 15 fps. Scale bar = 10 μm. Stills from this movie are included in Fig. 3 A.
Overexpression of Flag-TUBA1BE77Ain wild-type cells results in a decreased microtubule growth rate. Wild-type cells overexpressing Flag-TUBA1BWT or Flag-TUBA1BE77A and mCherry-EB3. Time is indicated in min:s format, playback speed is 15 fps. Scale bar = 10 μm. Stills from this movie are included in Fig. 3 A.
Overexpression of TUBB5D74A-Flag in wild-type cells does not result in a decreased microtubule growth rate. Wild-type cells overexpressing TUBB5WT-Flag or TUBB5D74A-Flag and mCherry-EB3. Time is indicated in min:s format, playback speed is 15 fps. Scale bar = 10 μm. Stills from this movie are included in Fig. 3 A.
Overexpression of TUBB5D74A-Flag in wild-type cells does not result in a decreased microtubule growth rate. Wild-type cells overexpressing TUBB5WT-Flag or TUBB5D74A-Flag and mCherry-EB3. Time is indicated in min:s format, playback speed is 15 fps. Scale bar = 10 μm. Stills from this movie are included in Fig. 3 A.
Arginylation modulates binding of MAP1S to microtubules
Many tubulin posttranslational modifications regulate microtubule dynamics indirectly by altering the binding of microtubule-associated proteins (MAPs). To test whether arginylation induces any differential binding of MAPs to microtubules, we used the high-salt wash fractions from the Taxol-based microtubule preparations that were previously used to analyze tubulin arginylation to compare the overall MAP composition between Ate1+/+ and Ate1−/− cells using mass spectrometry (Fig. 2 A). To identify significant changes in MAP binding, we used the following criteria: (1) absolute Ate1−/− versus Ate1+/+ fold change >2, (2) q-value <0.2, (3) identified by a minimum of 2 razor + unique peptides in at least one of the triplicates in either group, and (4) identified in at least two of the triplicates in either group. This analysis revealed a significant change in four proteins: RPL12, RPL10A, PSMG2, and MAP1S (Table S2). While ribosomal proteins and proteasome chaperones have been shown to copurify with microtubules in previous screens (Patel et al., 2009; He et al., 2015), they are not known to specifically affect microtubules. For this reason, we focused our analysis on the only known microtubule associated protein identified in our screen, MAP1S, which showed a threefold increase in Ate1−/− samples compared with wild-type samples (Fig. 4 A). We did not observe any change in the association of the other MAP1 family members, MAP1A and MAP1B, with microtubules from Ate1−/− cells (Fig. 4, B and C). Thus, arginylation appears to specifically modulate the interaction of MAP1S with microtubules without affecting other MAPs.

Ate1−/−cells show an increased association of MAP1S with microtubules. (A–C) Quantification of the LFQ intensity of MAP1S (A), MAP1A (B), and MAP1B (C) identified by mass spectrometry in microtubule preparations from Ate1+/+ and Ate1−/− cells. Mean ± SD, N = 3, Ate1+/+ versus Ate1−/−: *P = 0.016, two-tailed paired t test. Symbol colors indicate paired measurements. (D) Quantification of the RNA-level expression of Map1s in Ate1+/+ and Ate1−/− cells. Mean ± SD, N = 4, Wilcoxon matched-pairs signed rank test. Symbol colors indicate paired measurements. (E) Western blot for MAP1S (top, green) and tubulin (bottom, red) from Ate1+/+ and Ate1−/− cells. (F) Quantification of total MAP1S normalized to tubulin in Ate1+/+ and Ate1−/− cells. Mean ± SD, N = 3, two-tailed Wilcoxon matched-pairs signed rank test. Symbol colors indicate paired measurements. (G) Western blot for MAP1S (top, green) and tubulin (bottom, green) on soluble and polymerized tubulin fractions from Ate1+/+ and Ate1−/− cells. (H) Quantification of the fraction of MAP1S associated with the polymerized tubulin. Mean ± SEM, N = 3 (n = 12 total repeats per condition), Ate1+/+ versus Ate1−/−: *P = 0.0416, one-tailed paired t test. Symbol colors indicate paired average measurements. Violin plot represents the fraction of MAP1S in the pellet for individual repeats. (I) Immunofluorescence images of Ate1+/+ and Ate1−/− cells stained for MAP1S (green), ⍺-tubulin (magenta), and DAPI (blue). Scale bar = 20 μm. Tubulin and MAP1S are scaled to the same respective intensity as the wild-type image, for ease of visual comparison of intensity. (J) Western blot for total protein stain (left, red) and MAP1S (right, green) on immunoprecipitated MAP1S (IP) and input (In). Source data are available for this figure: SourceData F4.
Ate1−/−cells show an increased association of MAP1S with microtubules. (A–C) Quantification of the LFQ intensity of MAP1S (A), MAP1A (B), and MAP1B (C) identified by mass spectrometry in microtubule preparations from Ate1+/+ and Ate1−/− cells. Mean ± SD, N = 3, Ate1+/+ versus Ate1−/−: *P = 0.016, two-tailed paired t test. Symbol colors indicate paired measurements. (D) Quantification of the RNA-level expression of Map1s in Ate1+/+ and Ate1−/− cells. Mean ± SD, N = 4, Wilcoxon matched-pairs signed rank test. Symbol colors indicate paired measurements. (E) Western blot for MAP1S (top, green) and tubulin (bottom, red) from Ate1+/+ and Ate1−/− cells. (F) Quantification of total MAP1S normalized to tubulin in Ate1+/+ and Ate1−/− cells. Mean ± SD, N = 3, two-tailed Wilcoxon matched-pairs signed rank test. Symbol colors indicate paired measurements. (G) Western blot for MAP1S (top, green) and tubulin (bottom, green) on soluble and polymerized tubulin fractions from Ate1+/+ and Ate1−/− cells. (H) Quantification of the fraction of MAP1S associated with the polymerized tubulin. Mean ± SEM, N = 3 (n = 12 total repeats per condition), Ate1+/+ versus Ate1−/−: *P = 0.0416, one-tailed paired t test. Symbol colors indicate paired average measurements. Violin plot represents the fraction of MAP1S in the pellet for individual repeats. (I) Immunofluorescence images of Ate1+/+ and Ate1−/− cells stained for MAP1S (green), ⍺-tubulin (magenta), and DAPI (blue). Scale bar = 20 μm. Tubulin and MAP1S are scaled to the same respective intensity as the wild-type image, for ease of visual comparison of intensity. (J) Western blot for total protein stain (left, red) and MAP1S (right, green) on immunoprecipitated MAP1S (IP) and input (In). Source data are available for this figure: SourceData F4.
To validate this result, we first confirmed that the increase of MAP1S in the non-arginylated microtubule fraction is not driven by a change in its overall abundance in Ate1 knockout cells. To do this, we compared the global levels of MAP1S mRNA and protein in Ate1+/+ and Ate1−/− cells and found no difference (Fig. 4, D–F). Next, we separated cellular tubulin into soluble and polymerized fractions and confirmed that, in agreement with the mass spectrometry result, the fraction of MAP1S associated with polymerized microtubules in Ate1−/− cells was significantly higher than in wild type (Fig. 4, G and H). Immunofluorescence also shows an increased colocalization of MAP1S with microtubules in cells extracted of soluble tubulin (Fig. 4 I). Finally, to test whether the binding of MAP1S to microtubules may be modulated by direct arginylation of MAP1S, which is known to be regulated posttranslational modifications (Baltussen et al., 2018; Muñoz et al., 2018), we analyzed our mass spectrometry data sets from this experiment, as well as from a separately obtained immunoprecipitated MAP1S preparation (Fig. 4 J), using arginylation search algorithms. We found no MAP1S arginylation in any of these samples. Notably, no arginylation of MAP1S was detected in our prior mass spectrometry screens for arginylated protein targets either (Wong et al., 2007; MacTaggart et al., 2023). Thus, MAP1S is unlikely to be an arginylation target, and its binding to microtubules appears to be directly modulated by tubulin arginylation.
Prior studies have shown that overexpression of MAP1S stabilizes microtubules against depolymerization, and knockdown of Map1s results in a decrease in microtubule stability and an increase in microtubule growth rate (Orbán-Németh et al., 2005; Tegha-Dunghu et al., 2014). To test whether the increased MAP1S binding to microtubules is responsible for the increased microtubule stability and decreased microtubule dynamics observed in Ate1−/− cells, we tested if depletion of MAP1S by siRNA knockdown could rescue these phenotypes in Ate1−/− cells. We first confirmed that siMap1s was able to deplete MAP1S by about 80% in both Ate1+/+ and Ate1−/− cells compared with cells treated with control siRNA (siCtrl) (Fig. 5, A and B). Similar to untreated cells, Ate1−/− cells treated with siCtrl showed a 30% decrease in microtubule growth rate and a twofold increase in the fraction of depolymerization-resistant microtubules compared with wild type. Knockdown of Map1s in Ate1−/− cells rescued both microtubule growth rate and stability to wild-type levels (Fig. 5, C–F and Fig. S3, D–F and Video 5). Depletion of Map1s did not cause a significant change in EB3 comet velocity or in the fraction of depolymerization resistant microtubules in wild-type cells (Fig. 5, C–F and Fig. S3, D–F). This lack of effect may be due to wild-type cells having very little MAP1S associated with their microtubules already (Fig. 4, H–I).

Depletion of MAP1S in Ate1−/−cells rescues decreased microtubule growth rate and increased microtubule stability. (A) Western blot showing MAP1S (top, green) and tubulin (bottom, red) in Ate1+/+ and Ate1−/− cells transfected with siCtrl or siMap1s. (B) Quantification of MAP1S normalized to tubulin in Ate1+/+ and Ate1−/− cells transfected with siCtrl or siMap1s. Mean ± SD, N = 5, two-tailed paired t-test. Symbol colors indicate paired measurements. (C) mCherry-EB3 signal (top) and tracks color-coded by mean straight-line speed ranging from 0 to 0.4 μm/s (bottom) from movies of Ate1+/+ and Ate1−/− cells transfected with siCtrl or siMap1s and overexpressing mCherry-EB3 (Video 5). Scale bar = 20 μm. (D) Quantification of EB3 comet velocity. Mean ± SEM, N = 3 (n = 15 cells per condition), Ate1+/+ + siCtrl versus Ate1−/− + siCtrl: ***P = 0.0003, Ate1−/− + siCtrl versus Ate1+/+ +siMap1s: **P = 0.0014, Ate1−/− + siCtrl versus Ate1−/− + siMap1s: ***P = 0.0003, one-way RM ANOVA corrected for multiple comparisons. Symbol colors indicate paired average measurements. Violin plot represents the distribution of average EB3 comet velocity for individual cells. (E) Immunofluorescence images of Ate1+/+ and Ate1−/− cells transfected with siCtrl or siMap1s and treated with 2 μM nocodazole for 0 or 10 min, extracted, and stained for ⍺-tubulin (magenta) and DAPI (blue). Scale bar = 10 μm. (F) Quantification of the average microtubule-positive area per cell normalized to t = 0. Mean ± SEM, N = 3 (n = 407–896 cells per condition), 10 min Ate1+/+ +siCtrl versus Ate1−/− + siCtrl: ****P < 0.0001, 10 min Ate1−/− + siCtrl versus Ate1+/+ + siMap1s: ****P < 0.0001, 10 min Ate1−/− + siCtrl versus Ate1−/− + siMap1s: ****P < 0.0001, two-way RM ANOVA corrected for multiple comparisons. Symbol colors indicate paired average measurements. The truncated violin plot represents the distribution of the average microtubule-positive area for individual cells. Source data are available for this figure: SourceData F5.
Depletion of MAP1S in Ate1−/−cells rescues decreased microtubule growth rate and increased microtubule stability. (A) Western blot showing MAP1S (top, green) and tubulin (bottom, red) in Ate1+/+ and Ate1−/− cells transfected with siCtrl or siMap1s. (B) Quantification of MAP1S normalized to tubulin in Ate1+/+ and Ate1−/− cells transfected with siCtrl or siMap1s. Mean ± SD, N = 5, two-tailed paired t-test. Symbol colors indicate paired measurements. (C) mCherry-EB3 signal (top) and tracks color-coded by mean straight-line speed ranging from 0 to 0.4 μm/s (bottom) from movies of Ate1+/+ and Ate1−/− cells transfected with siCtrl or siMap1s and overexpressing mCherry-EB3 (Video 5). Scale bar = 20 μm. (D) Quantification of EB3 comet velocity. Mean ± SEM, N = 3 (n = 15 cells per condition), Ate1+/+ + siCtrl versus Ate1−/− + siCtrl: ***P = 0.0003, Ate1−/− + siCtrl versus Ate1+/+ +siMap1s: **P = 0.0014, Ate1−/− + siCtrl versus Ate1−/− + siMap1s: ***P = 0.0003, one-way RM ANOVA corrected for multiple comparisons. Symbol colors indicate paired average measurements. Violin plot represents the distribution of average EB3 comet velocity for individual cells. (E) Immunofluorescence images of Ate1+/+ and Ate1−/− cells transfected with siCtrl or siMap1s and treated with 2 μM nocodazole for 0 or 10 min, extracted, and stained for ⍺-tubulin (magenta) and DAPI (blue). Scale bar = 10 μm. (F) Quantification of the average microtubule-positive area per cell normalized to t = 0. Mean ± SEM, N = 3 (n = 407–896 cells per condition), 10 min Ate1+/+ +siCtrl versus Ate1−/− + siCtrl: ****P < 0.0001, 10 min Ate1−/− + siCtrl versus Ate1+/+ + siMap1s: ****P < 0.0001, 10 min Ate1−/− + siCtrl versus Ate1−/− + siMap1s: ****P < 0.0001, two-way RM ANOVA corrected for multiple comparisons. Symbol colors indicate paired average measurements. The truncated violin plot represents the distribution of the average microtubule-positive area for individual cells. Source data are available for this figure: SourceData F5.
Knocking down Map1s in Ate1−/−can rescue microtubule growth rate.Ate1+/+ and Ate1−/− cells transfected with siCtrl or siMap1s and mCherry-EB3. Time is indicated in min:s format, playback speed is 25 fps. Scale bar = 10 μm. Stills from this movie are included in Fig. 5 C.
Knocking down Map1s in Ate1−/−can rescue microtubule growth rate.Ate1+/+ and Ate1−/− cells transfected with siCtrl or siMap1s and mCherry-EB3. Time is indicated in min:s format, playback speed is 25 fps. Scale bar = 10 μm. Stills from this movie are included in Fig. 5 C.
To test whether blocking arginylation of ⍺-tubulin at E77 in wild-type cells has any effect on MAP1S binding, we looked at the fraction of MAP1S associated with microtubules in cells expressing Flag-TUBA1BE77A. Remarkably, the expression of this non-arginylatable tubulin mutant resulted in a 40% increase in the fraction of MAP1S associated with polymerized microtubules compared with the expression of Flag-TUBA1BWT (Fig. 6, A and B). Furthermore, siRNA knockdown of Map1s rescued the decreased microtubule growth rate and increased microtubule stability observed in Flag-TUBA1BE77A expressing cells (Fig. 6, C–F and Video 6). Thus, the effect of the non-arginylatable Flag-TUBA1BE77A on microtubule dynamics was fully MAP1S-dependent. These results further confirm the direct functional link between tubulin arginylation at ⍺E77 and MAP1S binding. No significant changes in MAP1S distribution were seen in wild-type cells expressing TUBB5D74A-Flag (Fig. 6, A and B), which is consistent with there being no change in microtubule stability or dynamics caused by this mutant (Fig. 3). Together, these experiments demonstrate that the decreased microtubule dynamics and increased microtubule stability observed in Ate1−/− cells and cells expressing Flag-TUBA1BE77A are likely a direct result of the increased association of MAP1S with microtubules in these cells.

Map1s depletion in cells overexpressing of Flag-TUBA1BE77Ais sufficient to rescue microtubule growth rate and stability. (A) Western blot for MAP1S (top) and tubulin (bottom) in soluble and polymerized tubulin fractions from wild-type cells overexpressing Flag-TUBA1BWT, Flag-TUBA1BE77A, TUBB5WT-Flag, or TUBB5D74A-Flag. Note that the tubulin loading control images in both panels (bottom) are the same as the ones in the supplemental panel S5E, since the two blots shown come from the same experimental repeat. (B) Quantification of the fraction of MAP1S associated with the polymerized tubulin. Mean ± SD, N = 3, Flag-TUBA1BWT versus Flag-TUBA1BE77A: *P = 0.042, two-tailed paired t test. Symbol colors indicate paired measurements. (C) mCherry-EB3 signal (top) and tracks color-coded by mean straight line speed ranging from 0 to 0.4 μm/s (bottom) from movies of wild-type cells overexpressing Flag-TUBA1BWT or Flag-TUBA1BE77A, siCtrl or siMap1s, and mCherry-EB3 (Video 6). Scale bar = 20 μm. (D) Quantification of the average EB3 comet velocity. Mean ± SEM, N = 3 (n = 15 cells per condition), Flag-TUBA1BWT + siCtrl versus Flag-TUBA1BE77A + siCtrl: **P = 0.004, Flag-TUBA1BE77A + siCtrl versus. Flag-TUBA1BE77A + siMap1s: **P = 0.002, one-way RM ANOVA corrected for multiple comparisons. Symbol colors indicate paired average measurements. Violin plot represents the distribution of average EB3 comet velocity for individual cells. (E) Immunofluorescence images of wild-type cells overexpressing Flag-TUBA1BWT or Flag-TUBA1BE77A and siCtrl or siMap1s and treated with 0.5 μM nocodazole for 0 or 10 min, extracted, fixed in methanol, and stained for Flag (magenta), ⍺-tubulin (green), and DAPI (blue). Scale bar = 10 μm. (F) Quantification of the average microtubule-positive area per cell normalized to t = 0. Mean ± SEM, N = 3 (n = 112–194 cells per condition), 10 min Flag-TUBA1BWT + siCtrl versus Flag-TUBA1BE77A + siCtrl: ***P = 0.001, 10 min Flag-TUBA1BE77A + siCtrl versus. Flag-TUBA1BE77A + siMap1s: ***P = 0.001, two-way RM ANOVA corrected for multiple comparisons. Symbol colors indicate paired average measurements. The truncated violin plot represents the distribution of the average microtubule-positive area for individual cells. Source data are available for this figure: SourceData F6.
Map1s depletion in cells overexpressing of Flag-TUBA1BE77Ais sufficient to rescue microtubule growth rate and stability. (A) Western blot for MAP1S (top) and tubulin (bottom) in soluble and polymerized tubulin fractions from wild-type cells overexpressing Flag-TUBA1BWT, Flag-TUBA1BE77A, TUBB5WT-Flag, or TUBB5D74A-Flag. Note that the tubulin loading control images in both panels (bottom) are the same as the ones in the supplemental panel S5E, since the two blots shown come from the same experimental repeat. (B) Quantification of the fraction of MAP1S associated with the polymerized tubulin. Mean ± SD, N = 3, Flag-TUBA1BWT versus Flag-TUBA1BE77A: *P = 0.042, two-tailed paired t test. Symbol colors indicate paired measurements. (C) mCherry-EB3 signal (top) and tracks color-coded by mean straight line speed ranging from 0 to 0.4 μm/s (bottom) from movies of wild-type cells overexpressing Flag-TUBA1BWT or Flag-TUBA1BE77A, siCtrl or siMap1s, and mCherry-EB3 (Video 6). Scale bar = 20 μm. (D) Quantification of the average EB3 comet velocity. Mean ± SEM, N = 3 (n = 15 cells per condition), Flag-TUBA1BWT + siCtrl versus Flag-TUBA1BE77A + siCtrl: **P = 0.004, Flag-TUBA1BE77A + siCtrl versus. Flag-TUBA1BE77A + siMap1s: **P = 0.002, one-way RM ANOVA corrected for multiple comparisons. Symbol colors indicate paired average measurements. Violin plot represents the distribution of average EB3 comet velocity for individual cells. (E) Immunofluorescence images of wild-type cells overexpressing Flag-TUBA1BWT or Flag-TUBA1BE77A and siCtrl or siMap1s and treated with 0.5 μM nocodazole for 0 or 10 min, extracted, fixed in methanol, and stained for Flag (magenta), ⍺-tubulin (green), and DAPI (blue). Scale bar = 10 μm. (F) Quantification of the average microtubule-positive area per cell normalized to t = 0. Mean ± SEM, N = 3 (n = 112–194 cells per condition), 10 min Flag-TUBA1BWT + siCtrl versus Flag-TUBA1BE77A + siCtrl: ***P = 0.001, 10 min Flag-TUBA1BE77A + siCtrl versus. Flag-TUBA1BE77A + siMap1s: ***P = 0.001, two-way RM ANOVA corrected for multiple comparisons. Symbol colors indicate paired average measurements. The truncated violin plot represents the distribution of the average microtubule-positive area for individual cells. Source data are available for this figure: SourceData F6.
Knocking down Map1s in wild-type cells overexpressing Flag-TUBA1BE77Acan rescue microtubule growth rate. Wild-type cells overexpressing Flag-TUBA1BWT or Flag-TUBA1BE77A, siCtrl or siMap1s, and mCherry-EB3. Time is indicated in min:s format, playback speed is 11 fps. Scale bar = 10 μm. Stills from this movie are included in Fig. 6 C.
Knocking down Map1s in wild-type cells overexpressing Flag-TUBA1BE77Acan rescue microtubule growth rate. Wild-type cells overexpressing Flag-TUBA1BWT or Flag-TUBA1BE77A, siCtrl or siMap1s, and mCherry-EB3. Time is indicated in min:s format, playback speed is 11 fps. Scale bar = 10 μm. Stills from this movie are included in Fig. 6 C.
Ate1 knockout cells show increased MAP1S associated with the mitotic spindle and an increased mitotic index
The biological functions of MAP1S are not well understood, but prior studies have shown that it plays a role in several biological processes, including mitosis. In mitosis, MAP1S decorates the spindle and centrosomes and is required for proper spindle formation (Song et al., 2005; Dallol et al., 2007; Tegha-Dunghu et al., 2014; Malerød et al., 2018). Depletion of Map1s results in mitotic defects, including failure to form a stable metaphase plate, premature sister chromatid separation, lagging chromosomes, multipolar spindles, and genetic instability (Dallol et al., 2007). Both depletion and overexpression of MAP1S have been shown to cause delays in mitosis (Song et al., 2005; Dallol et al., 2007). Increased MAP1S binding in Ate1−/− cells, and the resulting change in microtubule dynamics, may conceivably lead to abnormalities in either of these processes.
To test whether these cells have mitotic abnormalities, we compared MAP1S staining intensity on the spindle in Ate1+/+ and Ate1−/− cells during prophase (Fig. 7, A–E), metaphase (Fig. 7, B and F), anaphase (Fig. 7, C and G), and telophase (Fig. 7, D and H). In each mitotic phase, we observed an approximately twofold increase in the ratio of MAP1S to tubulin staining intensity on the spindle, and in all cases, this increase could be rescued by re-expressing Ate1-GFP. Thus, a lack of ATE1 results in increased MAP1S binding to microtubules throughout the cell cycle.

Depletion of Ate1 results in increased MAP1S association with spindle microtubules and increased mitotic index. (A–D) Immunofluorescence images of mitotic Ate1+/+, Ate1−/−, and Ate1−/− + Ate1-GFP cells stained for MAP1S (green), ⍺-tubulin (magenta), and DAPI (blue). Scale bar = 2 μm. Images are sum stacks. For each phase of the cell cycle, tubulin and MAP1S are scaled to the same respective intensity as the wild-type image for ease of visual comparison of intensity. (E) Quantification of MAP1S/⍺-tubulin during prometaphase. Mean ± SEM, N = 3 (n = 77–101 cells per condition), Ate1+/+ versus Ate1−/−: *P = 0.0286, Ate1−/− versus Ate1−/−+ Ate1-GFP: *P = 0.0462. (F) Quantification of MAP1S/⍺-tubulin during metaphase. Mean ± SEM, N = 3 (n = 40–42 cells per condition), Ate1+/+ versus Ate1−/−: **P = 0.0098, Ate1−/− versus Ate1−/−+ Ate1-GFP: *P = 0.0132. (G) Quantification of MAP1S/⍺-tubulin during anaphase. Mean ± SEM, N = 3 (n = 20–48 cells per condition), Ate1+/+ versus Ate1−/−: **P = 0.0027, Ate1−/− versus Ate1−/−+ Ate1-GFP: **P = 0.0095. (H) Quantification of MAP1S/⍺-tubulin during telophase. Mean ± SEM, N = 3 (n = 40–96 cells per condition), Ate1+/+ versus Ate1−/−: **P = 0.0014, Ate1−/− versus Ate1−/−+ Ate1-GFP: ***P = 0.0006. For E through H, the statistical test is a one-way RM ANOVA corrected for multiple comparisons. Symbol colors indicate paired average measurements. Truncated violin plots represent the distribution of MAP1S/⍺-tubulin for individual cells. (I) Growth curve for Ate1+/+ and Ate1−/− cells. Mean ± SEM, N = 3 (n = 4 technical repeats for each condition), Day 9 Ate1+/+ versus Ate1−/−: **P = 0.0014, Day 9 Ate1+/+ versus Ate1−/−: **P = 0.0014, Day 10 Ate1+/+ versus Ate1−/−: **P = 0.0014, one-way RM ANOVA corrected for multiple comparisons. (J) Doubling rate calculated from Day 1–5 of the growth curve shown in I. In mitotic index experiments, cells were seeded at 10,000 cells/cm2, which falls into this range. Mean ± SD, N = 3, two-tailed paired t test. (K) Quantification of mitotic index for Ate1+/+ and Ate1−/− cells. Mean ± SEM, N = 3, **P = 0.0019, two-tailed paired t test.
Depletion of Ate1 results in increased MAP1S association with spindle microtubules and increased mitotic index. (A–D) Immunofluorescence images of mitotic Ate1+/+, Ate1−/−, and Ate1−/− + Ate1-GFP cells stained for MAP1S (green), ⍺-tubulin (magenta), and DAPI (blue). Scale bar = 2 μm. Images are sum stacks. For each phase of the cell cycle, tubulin and MAP1S are scaled to the same respective intensity as the wild-type image for ease of visual comparison of intensity. (E) Quantification of MAP1S/⍺-tubulin during prometaphase. Mean ± SEM, N = 3 (n = 77–101 cells per condition), Ate1+/+ versus Ate1−/−: *P = 0.0286, Ate1−/− versus Ate1−/−+ Ate1-GFP: *P = 0.0462. (F) Quantification of MAP1S/⍺-tubulin during metaphase. Mean ± SEM, N = 3 (n = 40–42 cells per condition), Ate1+/+ versus Ate1−/−: **P = 0.0098, Ate1−/− versus Ate1−/−+ Ate1-GFP: *P = 0.0132. (G) Quantification of MAP1S/⍺-tubulin during anaphase. Mean ± SEM, N = 3 (n = 20–48 cells per condition), Ate1+/+ versus Ate1−/−: **P = 0.0027, Ate1−/− versus Ate1−/−+ Ate1-GFP: **P = 0.0095. (H) Quantification of MAP1S/⍺-tubulin during telophase. Mean ± SEM, N = 3 (n = 40–96 cells per condition), Ate1+/+ versus Ate1−/−: **P = 0.0014, Ate1−/− versus Ate1−/−+ Ate1-GFP: ***P = 0.0006. For E through H, the statistical test is a one-way RM ANOVA corrected for multiple comparisons. Symbol colors indicate paired average measurements. Truncated violin plots represent the distribution of MAP1S/⍺-tubulin for individual cells. (I) Growth curve for Ate1+/+ and Ate1−/− cells. Mean ± SEM, N = 3 (n = 4 technical repeats for each condition), Day 9 Ate1+/+ versus Ate1−/−: **P = 0.0014, Day 9 Ate1+/+ versus Ate1−/−: **P = 0.0014, Day 10 Ate1+/+ versus Ate1−/−: **P = 0.0014, one-way RM ANOVA corrected for multiple comparisons. (J) Doubling rate calculated from Day 1–5 of the growth curve shown in I. In mitotic index experiments, cells were seeded at 10,000 cells/cm2, which falls into this range. Mean ± SD, N = 3, two-tailed paired t test. (K) Quantification of mitotic index for Ate1+/+ and Ate1−/− cells. Mean ± SEM, N = 3, **P = 0.0019, two-tailed paired t test.
Ate1 depletion has previously been shown to have various defects in cell division, including increased duration of prometaphase, increased rates of chromosome missegregation, and increased mutation frequency (Kumar et al., 2016; Rai et al., 2016; Birnbaum et al., 2019; Chen and Kashina, 2022). We wanted to compare the mitotic index of our wild-type and Ate1 knockout cells. However, Ate1−/− cells have also been shown to have defects in contact inhibition that cause them to continue dividing even after they reach confluency, whereas most wild-type cells stop actively duplicating in dense cultures (Rai et al., 2016). Consistent with this, when grown at high density, our Ate1−/− cells showed an increased cell density compared with wild-type cells (Fig. 7 I). However, in scarce cultures, there were no significant differences in duplication between Ate1+/+ and Ate1−/− cells, enabling direct comparison of their mitotic index in the absence of contact inhibition (Fig. 7, I and J) (Rai et al., 2016). We used these low-density cultures to count the number of mitotic cells in each culture, as visible by the presence of condensed chromosomes using DAPI staining. The mitotic index in Ate1−/− cells was threefold higher than in wild-type cells (Fig. 7 K). This was not accompanied by any increase in doubling rate (Fig. 7, I and J), suggesting that this effect was caused by cells spending more time in mitosis. This result suggests that increased MAP1S binding in the absence of tubulin arginylation, and the ensuing increase in microtubule stability, may contribute to the impairments in cell division previously observed in Ate1 knockout cells.
Discussion
Our study demonstrates that ⍺-tubulin can be arginylated at E77 in cells and that this arginylation is specifically required to facilitate intracellular microtubule dynamics by limiting the binding of the stabilizing protein MAP1S to microtubules. Lack of arginylation at E77 in ⍺-tubulin due to knockout of Ate1 or alanine substitution results in reduced microtubule dynamics and an increase in microtubule stability. These effects can be fully rescued by knocking down Map1s (Fig. 8). Tubulin is an essential protein that is highly regulated by posttranslational modifications, and our study adds a new modification to the tubulin code.

Regulation of MAP1S-dependent microtubule dynamics by tubulin arginylation. Tubulin arginylation can occur on E77 of ⍺-tubulin (indicated by yellow circles). Within the dimer, E77 occurs near the interdimer interface (left inset), and within the microtubule, E77 occurs between protofilaments on the luminal side (right inset). In the absence of this modification in Ate1−/− cells, there is an increase in the amount of MAP1S associated with microtubules, which leads to increased microtubule stability and decreased microtubule dynamics. Created using http://BioRender.com.
Regulation of MAP1S-dependent microtubule dynamics by tubulin arginylation. Tubulin arginylation can occur on E77 of ⍺-tubulin (indicated by yellow circles). Within the dimer, E77 occurs near the interdimer interface (left inset), and within the microtubule, E77 occurs between protofilaments on the luminal side (right inset). In the absence of this modification in Ate1−/− cells, there is an increase in the amount of MAP1S associated with microtubules, which leads to increased microtubule stability and decreased microtubule dynamics. Created using http://BioRender.com.
Previous studies have shown that ATE1 targets cytoskeletal proteins for arginylation and that Ate1 deletion induces gross cytoskeletal defects, including reduced cell motility and adhesion. Some of these defects have been linked to disruption of the actin cytoskeleton and β-actin arginylation. However, the role of other arginylated cytoskeletal proteins has not yet been validated or functionally studied. Here, we identify functional arginylation of the microtubule cytoskeleton and show a direct mechanistic link between this arginylation and the regulation of microtubule stability and dynamics. These effects are mediated directly by tubulin, independently of β-actin arginylation (Fig. S3).
Our study reveals two ATE1-dependent sites of tubulin arginylation in cells: E77 on ⍺-tubulin (TUBA1B) and D74 on β-tubulin (TUBB5). These two tubulin isoforms, ⍺IB-tubulin and βI-tubulin, are highly expressed in cultured cells (Lopata and Cleveland, 1987; Vemu et al., 2017). However, since the ⍺E77 and βD74 sites are conserved, it is possible that arginylation at these sites is not isoform-specific and that analyzing other tissues and cell types may identify arginylation on one or both of these sites in other tubulin isoforms.
We also showed that ATE1 can directly arginylate both soluble tubulin and polymerized microtubules in vitro (Fig. 1). This raises the question of how ATE1 accesses these sites. On soluble tubulin, both ⍺Glu77 and βAsp74 are available on the surface, but in a microtubule, these sites occur between protofilaments, close to the microtubule lumen. It is possible that ATE1 enters the lumen, similarly to the tubulin acetyltransferase ⍺TAT1. In support, a recent screen for targets of arginylation in vitro identified the same peptides of ⍺- and β-tubulin seen in our study, as well as several others, suggesting that ATE1 is more promiscuous in vitro (Lin et al., 2024, Preprint). However, the mechanisms of microtubule targeting by ATE1 require further studies.
While the specific functions of ⍺E77 and βD74 residues are not known, structural modeling shows that they are located at the intradimer and interdimer surfaces, respectively (Fig. 2). It is feasible to suggest that the addition of a positively charged amino acid onto these negatively charged sidechains could result in a change that affects microtubule dynamics (Reijo et al., 1994; Richards et al., 2000). Notably, our study shows that only the E77 arginylation on ⍺-tubulin has a functional effect on microtubules, while D74 arginylation on β-tubulin appears to have no effect. It is possible that β-tubulin arginylation has different functional consequences not seen in our assays. It is also possible that β-tubulin D74 arginylation is coincidental due to its proximity and sequence homology to the ⍺E77 sequence context and does not carry an independent functional role. Notably, a previously published screen for Taxol-resistant tubulin mutants identified a charge reversal mutation at ⍺E77 (E77K) that results in a general increase in microtubule dynamics (Schibler and Cabral, 1986; Ganguly et al., 2010, 2012). This E to K mutation mimics arginylation in biochemical properties by converting the negative charge on the E side chain to the positively charged K. Consistent with these findings, E77 arginylation facilitates normal microtubule dynamics, and lack of arginylation at this site due to Ate1 knockout or overexpression of the non-arginylatable Flag-TUBA1BE77A results in a reduction in microtubule growth rate and increased microtubule stability (Fig. 3).
Based on mass spectrometry, we estimate that 7–9% of ⍺-tubulin is arginylated at E77 in our Taxol-purified microtubule preparations (Fig. 2, F and G). However, it is unclear if this 7–9% is evenly distributed or enriched in a specific subpopulation of microtubules. It is also unclear if this modification is stationary or occurs dynamically in response to specific signaling events. Since the changes in microtubule stability and dynamics observed in Ate1−/− cells occur globally throughout the cell and cell cycle, it seems unlikely that this modification is restricted to a highly specific place or time, but if localized, it could in principle have a much more profound effect at a local level within the cell. Further studies are required to see if and how the levels of tubulin arginylation vary in other cell types and under different conditions. The question of whether arginylation is reversible also remains an active possibility and an exciting direction of study.
Our data suggest that all or most of the functional effects of arginylation on microtubule dynamics are mediated by altered MAP1S binding to microtubules with or without arginylation. In support, disrupting tubulin arginylation either by knocking out Ate1 or by mutating E77 of ⍺-tubulin to Ala results in an increased association of MAP1S with microtubules, and while knocking down Map1s is sufficient to rescue the changes in microtubule growth rate and stability (Fig. 4, Fig. 5, and Fig. 6). MAP1S is a member of the MAP1 family, but unlike the classical MAP1 proteins, MAP1A and MAP1B, which are predominantly neuronal, MAP1S is ubiquitously expressed (Orbán-Németh et al., 2005). All MAP1 proteins are cleaved into a heavy chain and a light chain, both of which contain microtubule-binding domains (Orbán-Németh et al., 2005; Ding et al., 2006). In general, MAP1 proteins function to stabilize microtubules. While MAP1S has not been extensively studied, it is known that MAP1S overexpression can stabilize microtubules against colchicine-induced depolymerization, and knockdown of Map1s results in a decrease in microtubule stability and an increase in microtubule growth rate (Orbán-Németh et al., 2005; Tegha-Dunghu et al., 2014). Our finding that lack of E77 arginylation on tubulin and the resulting increase in MAP1S binding lead to reduced microtubule dynamics and increased microtubule stability is consistent with these prior observations.
Since E77 in ⍺-tubulin is located between protofilaments rather than on the microtubule surface, the role of its arginylation in MAP1S binding is not immediately obvious. Most MAPs bind to the microtubule surface and interact with the exposed negatively charged tubulin C-terminus (Cross et al., 1991). While the site of MAP1S binding to tubulin has not been specifically mapped, it has been assumed that it targets the same microtubule site as the other MAPs. It is possible, however, that MAP1S binds to a different part of the microtubule surface in the vicinity of E77. It is known that the microtubule-binding site of MAP1S is highly basic (Orbán-Németh et al., 2005; Ding et al., 2006), implying an electrostatic interaction with negatively charged residues on tubulin. If ⍺E77 is directly involved in this interaction, the addition of a positively charged Arg to this site would decrease this interaction. However, it is also possible that arginylation at ⍺E77 causes a larger structural change in the microtubule lattice that indirectly reduces MAP1S binding. Based on our estimate that 7–9% of ⍺-tubulin is arginylated at E77, in a 13 protofilament microtubule, an even distribution of arginylated tubulin subunits would mean approximately one modified ⍺-tubulin per layer of tubulin dimers. This ratio could potentially propagate a structural change that alters the surface of the microtubule to affect MAP1S binding without coming in direct contact with it. Moreover, if arginylated tubulin subunits are localized, the effect in this zone could potentially be much more powerful. Curiously, we did not observe an increase in the amount of MAP1A or MAP1B, other members of the MAP1 family, on microtubules from Ate1−/− cells (Fig. 4, B and C). This implies that the regulation of microtubule binding by tubulin arginylation is potentially unique to MAP1S (Orbán-Németh et al., 2005). MAP1 family members are only 29% conserved at the protein level, so it is feasible to imagine they would exhibit different types of microtubule binding. However, it would be interesting to see if Ate1 knockout alters MAP1A/MAP1B microtubule binding in a cell type where they are more abundant, such as neurons.
The detailed biological functions of MAP1S are not well understood, but increased MAP1S expression and/or microtubule binding was associated with defects in mitosis (Song et al., 2005). Consistent with this, we observe a twofold increase in the association of MAP1S with spindle microtubules in Ate1−/− cells, which is accompanied by an increase in their mitotic index but no corresponding increase in doubling rate (Fig. 7). This suggests that Ate1−/− cells might spend longer in mitosis in general, as has previously been reported for cells with increased microtubule stability due to low-dose Taxol treatment or overexpression of MAP1S (Ikui et al., 2005; Song et al., 2005). How exactly MAP1S is regulated during mitosis and how this intersects with the regulation of tubulin arginylation remains to be studied.
Changes in microtubule dynamics have profound effects in multiple tissues and organs. Dampening microtubule dynamics has been linked to defects in physiological processes that are also impaired by Ate1 knockout, such as neurite outgrowth (Letourneau and Ressler, 1984; Wang et al., 2017a), cardiomyocyte contractility (Rai et al., 2008; Kurosaka et al., 2012; Robison et al., 2016; Chen et al., 2018), and cell migration (Kurosaka et al., 2010; Ganguly et al., 2012; Pavlyk et al., 2018; Batsios et al., 2019). It will be interesting to see if arginylation of ⍺E77 occurs in multiple tissues and cell types and if its regulation of microtubule dynamics is an overall regulator of microtubule-dependent organismal functions.
Materials and methods
Antibodies
Antibodies used in this study were as follows: Ms Anti-⍺-tubulin (Cat# ab7291, RRID:AB_2241126; Abcam) - WB 1:2,000 and IF 1:500, Rb Anti-β-tubulin (Cat# ab15568, RRID:AB_2210952; Abcam) – WB 1:1,000, Rb Anti-FLAG (Cat# 14793, RRID:AB_2572291; Cell Signaling Technology) – WB 1:1,000 and IF 1:500, Ms Anti-actin (Cat# MABT825, RRID:AB_2571580; Millipore) – WB 1:3,000, Ms Anti-MAP1S (Cat# SQ6214271; Precision Antibody) – WB 1:500, Rb Anti-MAP1S (Cat# 15695-1-AP, RRID:AB_2137868; Proteintech) – WB 1:500 and IF 1:50, Rb Anti-R-actin (Cat# ABT264; Millipore) – WB 1:2,000, Ms Anti-GFP (Cat# ab1218, RRID:AB_298911; Abcam) – WB 1:3,000, Ch Anti-GFP (Cat# A10262, RRID:AB_2534023; Thermo Fisher Scientific) – IF 1:100, Rat Anti-ATE1 (Cat# MABS436; Millipore) – WB 1:2,000, Ms Anti-AcTub (Cat# T7451, RRID:AB_609894; Sigma-Aldrich) – WB 1:10,000, Rb Anti-DeTyrTub (Cat# AB3201, RRID:AB_177350; Millipore) – WB 1:2,000, Rat Anti-TyrTub (Cat# MAB1864, RRID:AB_2210391; Millipore) – WB 1:2,000, Ms Anti-GluTub (Cat# AG-20B-0020, RRID:AB_2490210; AdipoGen) – WB 1:500, Adipogen Rb Anti-polyETub (Cat# AG-25B-0030, RRID:AB_2490540; AdipoGen) – WB 1:2,000.
Constructs
pEGFP-N2-ATE1-1 and pEGFP-N2-R-β-actin were previously generated by our lab (Zhang et al., 2010; Rai et al., 2016). pEGFP-N2-DD-β15 was a gift from Dr. Fangliang Zhang (Miami Miller School of Medicine). The plasmid expressing mCherry-EB3 was a gift from Dr. Erika Holzbaur (Perelman School of Medicine at the University of Pennsylvania). pCMV-Flag-Tuba1b and pCMV-Tubb5-Flag were purchased from SinoBiological. pCMV-Flag-Tuba1bE77A and pCMV-Tubb5D74A-Flag were generated in this study, as described below.
In vitro arginylation assays
In vitro arginylation assays were performed as previously described (Kashina, 2015). In brief, a 100 μl reaction was mixed on ice, containing 1x assay buffer (50 mM HEPES pH 7.5, 25 mM KCl, 15 mM MgCl2, 0.1 mM DTT), 12.5 μM [14C]-arginine (#MC137; Moravek, Inc.), 40 μM tRNAArg, 2 μM RRS, 1 μM ATE1, and 8 μM tubulin (#HTS03; Cytoskeleton). The reaction was carried out at 37°C. For time course reactions, a 10 μl sample was taken at each time point (0, 10, 20, 30, 60, 120, 240 min), added to an equal volume of 2X SDS sample buffer, and heated to 95°C for 5 min. For reactions comparing the arginylation of soluble tubulin and microtubules, tubulin was first polymerized at 37°C for 40 min in G-PEM Buffer (80 mM PIPES pH 6.9, 0.5 mM EGTA, 2 mM MgCl2, 1 mM GTP) supplemented with 1 mM GTP and 10% DMSO. The sample was split into two aliquots and the microtubules were pelleted by centrifugation at 15,000 × g for 10 min at room temperature. One pellet was resuspended in ice-cold BRB80 (80 mM PIPES pH 6.8, 1 mM MgCl2, 1 mM EGTA) and incubated on ice for 10 min to produce soluble tubulin. The other pellet was resuspended in warm BRB80 supplemented with 10 μM Taxol (#T7191; Sigma-Aldrich) to produce microtubules. For reactions assaying the arginylation of microtubules in the absence of Taxol, tubulin was polymerized at 37°C for 40 min in G-PEM Buffer supplemented with 1 mM GMPPCP (#ab146660; Abcam), and the microtubules were pelleted by centrifugation at 15,000 × g for 10 min at room temperature and resuspended in warm BRB80. The in vitro arginylation reactions were assembled as described above and carried out for 4 h at 37°C. The reactions were stopped by adding an equal volume of 2X SDS sample buffer and heating to 95°C for 5 min. Samples were run on 12% SDS gels and stained with Coomassie. The gels were incubated with AutoFluor (#LS-315; National Diagnostics) for 1 h and dried at 80°C for 1 h. Gels were exposed to film at −80°C for 10–14 days before developing.
Cell lines and cell culture
Ate1+/+ and Ate1−/− MEF lines were generated by retroviral SV40 immortalization of three littermate pairs of primary MEFs in this study, or as previously described (Kwon et al., 2002). The cells were grown in Dulbecco’s modified Eagle’s medium with GlutaMAX (#10569-010; Gibco) with 10% fetal bovine serum (#35010CV; Corning) and 1% penicillin–streptomycin (#30-002-CI; Corning) at 37°C with 5% CO2.
For transfection, ∼2 × 10⁵ cells were seeded in six-well plates overnight. Plasmid transfection was performed using Lipofectamine 2000 (Thermo Fisher Scientific), according to manufacturer instructions. Briefly, 2.5 μg of total plasmid per well was diluted in Opti-Mem and mixed with diluted Lipofectamine at a ratio of 1 μg:3 μl. After 20 min at room temperature, the complexes were added to cells in 1X DMEM + 10% FBS. Cells were assayed 48 h after transfection. The average transfection efficiency was 50.2 ± 9.0%.
RNAi knockdown was performed using Lipofectamine RNAiMAX 2000 (Thermo Fisher Scientific), according to manufacturer instructions. Briefly, 25 pmol of siRNA per well was diluted in Opti-Mem and mixed with diluted Lipofectamine at a ratio of 10 pmol:3 μl. After 20 min, at room temperature, the complexes were added to cells in 1X DMEM + 10% FBS. Cells were assayed 72 h after transfection. Map1s siRNA pool (#M-055497-01; Dharmacon) target sequences were 5′-CACAAAGCCUCGUGUAUCA-3′, 5′-GGUUGUGCGUGUACUAUUU-3′, 5′-CAACAGGAGUACAGUGCGA-3′, and 5′-CCUGCAAGGUGGAGUUCUA-3′. Knockdown using a non-specific siRNA (#SIC003; Sigma-Aldrich) was used as a negative control.
Nocodazole-resistant microtubule measurement
Following the indicated transfection, ∼1 × 10⁵ cells were seeded onto cleaned coverslips in six-well plates overnight. Cells were treated with 0.5–2 μM nocodazole (#M1404; Sigma-Aldrich) in 1X DMEM + 10% FBS for 0, 10, 30, or 60 min at 37°C. Cells were extracted in microtubule stabilization buffer (BRB80 + 4 mM EGTA) + 0.5% Triton X-100 for 30 s at room temperature to remove soluble tubulin. The cells were then fixed in ice-cold 100% methanol for 3 min at −20°C and washed three times in PBS for 5 min. Immunofluorescence and microscopy were performed, as described below. Images were analyzed by thresholding the microtubule signal in FIJI and normalizing it to the microtubule area per cell at t = 0.
Immunofluorescence
Approximately 1 × 10⁵ cells were seeded onto cleaned coverslips in 6-well plates overnight. Cells were fixed in ice-cold 100% methanol for 3 min at −20°C and washed three times in PBS for 5 min. Cells were blocked in PBS + 5% goat serum + 0.3% Triton X-100 for 1 h at room temperature. Cells were incubated with primary antibodies diluted in PBS + 1% BSA + 0.3% Triton X-100 at 4°C overnight in humid chambers. Cells were washed three times in PBS for 5 min, incubated with secondary antibodies at 1:500 (Invitrogen) for 1 h at room temperature, incubated with DAPI for 10 min at room temperature, washed three times in PBS for 5 min, mounted using ProLong Glass Antifade Mountant (#P36980; Invitrogen), and cured overnight at room temperature.
EB3 comet velocity measurement
Following the indicated transfection, ∼1 × 10⁵ cells were seeded into uncoated 35-mm glass bottom dishes (#P35G-1.5-14-C; MatTek) overnight. Before imaging, the cell media was changed to FluoroBrite DMEM (#A1896701; Thermo Fisher Scientific) +10% FBS to minimize the background signal. Movies were captured for 1–2 min with no delay (∼200 ms). Images were analyzed using the FIJI TrackMate plug-in (Tinevez et al., 2017): the DoG Detector was used to find spots with an average diameter of 0.7 μm, and the Simple LAP Tracker was used to link spots with a maximum distance of <1 μm with no gaps allowed. Tracks were filtered for a duration of >10 s, and the first 60–100 tracks per cell were used. Each track was manually inspected for accuracy.
Microscopy
Images were acquired on an inverted Nikon Eclipse Ti microscope (Nikon) equipped with a spinning-disk CSUX1 confocal head (Yokogawa Electric Corporation), a Plan Apochromat ×100/1.49-numerical aperture (NA) oil immersion or Plan Fluor 40× Ph2 DLL dry lens objective (Nikon), and an Andor iXon Ultra 897 electron-multiplying charge-coupled-device (EMCCD) camera. Image acquisition was controlled with NIS-Elements AR software (Nikon). Live cell imaging was carried out in an environmental chamber at 37°C with 5% CO2. All images were viewed and analyzed in FIJI.
Western blotting
Unless otherwise stated, cells were washed three times in PBS, collected by scraping, and spun down at 2,000 × g for 7 min at 4°C. Cell pellets were weighed and resuspended in 10× wt/vol SDS sample buffer. Samples were boiled for 5 min before running on 10–12% SDS-PAGE gels at 100 V for 90 min, along with a protein ladder (#26626; Thermo Fisher Scientific). Gels were transferred to 0.45 μm nitrocellulose membranes at 100 V for 60–70 min. Blots were stained with REVERT Total Protein Stain (LI-COR) and imaged before blocking. Blots were blocked in 0.1% PBST + 3% BSA for 1 h at room temperature, then incubated with primary antibodies diluted in 0.1% PBST + 1% BSA at 4°C overnight. The blots were washed three times in PBST for 5 min and incubated with secondary antibodies conjugated to IRDye800 or IRDye680 at 1:10,000 (LI-COR) for 1 h at room temperature. The blots were washed three times in PBST for 5 min and once in PBS for 5 min before scanning. Images were acquired and quantified using the Odyssey Imaging System (LI-COR).
Separation of polymerized and free tubulin from cells
Cells were rinsed twice in PBS and lysed in 800 μl microtubule-stabilizing buffer (20 mM Tris-HCl pH 6.8, 0.14 M NaCl, 0.5% IGEPAL, 1 mM MgCl2, 2 mM EGTA, and 4 μM Taxol) and centrifuged at 12,000 × g for 10 min at 4°C (Ganguly et., 2010). Protein was precipitated from the supernatant by adding 250 μl 100% TCA, incubating on ice for 30 min by spinning down at 16,000 × g for 5 min at 4°C. All pellets were washed twice in 200 μl cold acetone. Pellets were dried for 10 min in a 95°C heat block and resuspended in equal volumes of SDS sample buffer.
Purification of microtubules and MAPs from cell extracts
Taxol-based purification of microtubules from cell extracts was performed as previously described (Miller et al., 2010; Liu et al., 2015). Briefly, 7–10 10-cm dishes of cells were grown to ∼80% confluence. Cells were collected in 1 ml of 1X PBS by scraping and centrifuged at 1,200 × g for 5 min at room temperature. The cell pellet was resuspended in 1.5 volumes of MME buffer (100 mM Mes Free Acid pH 6.8, 1 mM MgCl2, 1 mM EGTA) supplemented with 1:50 protease inhibitor mix (#P2714; Sigma-Aldrich) and 1 mM DTT. Cell suspensions were sonicated on ice on Level 3 for 3 s on, 3 s off 20 times. The cell lysate was cleared by centrifugation at 120,000 × g for 1 h at 4°C. The cleared supernatants were supplemented with 20 μM Taxol and 1 mM GTP and heated to 37°C for 30 min. The mixture was layered over a prewarmed 300 μl cushion containing MME buffer supplemented with 20% sucrose, 20 μM Taxol, and 1 mM GTP and centrifuged at 80,000 × g for 30 min at 37°C. The pellet was washed in 500 μl of MME Buffer supplemented with 0.5 M NaCl, 20 μM Taxol, and 1 mM GTP and centrifuged at 80,000 × g for 30 min at 37°C. The tubulin pellets were resuspended in 200 μl of MME buffer. The wash fractions and the tubulin pellets were snap-frozen in liquid nitrogen and stored at −80°C before sending for mass spectrometry.
Mass spectrometry
Mass spectrometry analysis was performed as previously described (MacTaggart et al., 2023). Briefly, samples were run into a 4–12% Bis-Tris protein gel (#NP0321; Thermo Fisher Scientific) for mass spectrometry. The bands of interest or the entire protein-containing lanes were excised, reduced with TCEP, alkylated with iodoacetamide, and digested with trypsin. Tryptic digests were analyzed using a 90-min LC-MS/MS run on a Thermo Q Exactive Plus mass spectrometer. MS data were searched with full tryptic specificity (Trypsin/P) against the Swiss-Prot mouse proteome database and a common contaminant database (consisting of keratins, bovine, and mycoplasma proteins, commonly detected in cell culture, and proteases used in sample digestion) using MaxQuant (Cox and Mann, 2008). Protein and peptide false discovery rates (FDR) were set to 1%. Variable modifications searched included mass addition of 156.1011 (R), 170.1168 (R+methyl), and 184.1324 (R+dimethyl) on the protein N-terminus, D and E, and also variable protein N-terminal acetylation and M oxidation.
For identification of changes in MAPs, fold changes were calculated based on LFQ intensity. We used the following identification criteria: (1) minimum absolute fold change of 2 and q-value <0.2, (2) identified by a minimum of two razor + unique peptides in at least one of the triplicates in either group, and (3) identified in at least two of the triplicates in either group.
Standard peptides were generated by GenScript and subjected to electrospray ionization (ESI) analysis. Samples were diluted to a 1 pmol/μl concentration with 2 mM TCEP and 0.1%TFA and incubated at 37°C for 1 h 1 Pmol injections were reversed phase on a Thermo Q Exactive Plus mass spectrometer. Prominent peaks were eluted between 14 and 20 min. Peptide monoisotopic mass was deisotoped from Thermo Free Style Extract program.
Generation of non-arginylatable ⍺- and β-tubulin constructs
Mutagenesis was carried out using the Quikchange II XL Site-Directed Mutagenesis Kit (#200521; Agilent Technologies) according to manufacturer instructions and verified by DNA sequencing. Mouse pCMV-Flag-Tuba1b (#MG51606-NF) and pCMV-Tubb5-Flag (#MG52582-CF) were used as templates for alanine substitution at Glu77 and Asp74, respectively. Primers used for the introduction of amino acid substitutions using the Agilent Primer Design Program are given in Table 1.
Immunoprecipitation
Cells were collected in 1 ml of 1X PBS by scraping and spun down at 2,000 × g for 7 min at 4°C. Cell pellets were weighed and resuspended in 10X wt/vol Lysis Buffer (50 mM Tris-HCl pH 7.5, 150 mM NaCl, 0.1% Triton X-100) supplemented with 1:50 protease inhibitor mix. Cell lysates were vortexed, incubated on ice for 10 min, and sonicated on ice on Level 3 for 3 s on, 3 s off 20 times. The cell lysate was cleared by centrifugation at 16 × g for 15 min at 4°C. For each reaction, an equal volume of lysate was mixed with 50 μl of washed Protein A agarose beads and incubated with rocking for 2 h at 4°C to remove proteins that non-specifically bind to beads. The beads were removed by centrifugation and the lysate was then mixed with 3 μg of MAP1S antibody and incubated with rocking for 1 h at 4°C. Then 50 μl of washed Protein A agarose beads were added and incubated with rocking overnight at 4°C. The beads were washed three times with Lysis Buffer. Gel samples were collected by adding 50 μl of 2X SDS sample buffer to the beads.
MAP1S spindle measurement
In FIJI, z-stacks were projected into sum stacks. The area of the spindle was selected by thresholding the ⍺-tubulin signal. The mean signal in that area was measured for ⍺-tubulin and MAP1S. Since the MAP1S antibody gives a background cytoplasmic signal even when cells are extracted, the mean signal intensity from a nearby area of the cytoplasm was subtracted. The ratio of mean MAP1S to mean tubulin intensity is reported.
Mitotic index measurement
Approximately, 1 × 10⁵ cells (10,000 cells/cm2) were seeded onto washed coverslips and stained for ⍺-tubulin and γ-tubulin, as described above. The microscope was set to acquire 100 2 × 2 images at random positions within the coverslip area. The number of mitotic cells per 100 images was counted.
Growth rate measurement
Cells were seeded at 2,000 cells/cm2 in duplicate 12-well plates. Each day for 10 days, 2 wells of each cell line were trypsinized and counted twice using a hemacytometer. The average of the four counts was reported. The doubling rate was calculated by Txln(2)/ln(XT/X0).
Statistics
Statistics for each experiment are indicated in the figure legends. All data were tested for normality using a Shapiro–Wilk test before choosing a statistical test. Statistical analyses were performed in GraphPad Prism 10 version 10.1.0 for macOS, GraphPad Software, https://www.graphpad.com.
Online supplemental material
Fig. S1 shows that tubulin can be directly arginylated by ATE1 in vitro and in cells. Fig. S2,Ate1−/− cells do not show gross defects in the microtubule cytoskeleton. Fig. S3,Ate1−/− cells show increased microtubule stability, and knockdown of Map1s can rescue microtubule stability in Ate1−/− cells. Fig. S4 shows that expressing R-β-actin in Ate1−/− cells does not rescue microtubule growth rate or stability. Fig. S5 shows that non-arginylatable tubulin constructs Flag-TUBA1BE77A and TUBB5D74A-Flag can be incorporated into the microtubule cytoskeleton, similar to wild-type tubulin. Video 1 shows that Ate1 knockout results in a decreased microtubule growth rate. Video 2 shows that expressing R-β-actin in Ate1−/− cells does not rescue the microtubule growth rate. Video 3 shows that overexpression of Flag-TUBA1BE77A in wild-type cells results in a decreased microtubule growth rate. Video 4 shows that overexpression of TUBB5D74A-Flag in wild-type cells does not result in a decreased microtubule growth rate. Video 5 shows that knocking down Map1s in Ate1−/− can rescue microtubule growth rate. Video 6 shows that knocking down Map1s in wild-type cells overexpressing Flag-TUBA1BE77A can rescue microtubule growth rate. Table S1 contains information about the intensity values of arginylation at ⍺E77 and βD74 in Taxol-purified microtubules from Ate1+/+ and Ate1−/− cells. Table S2 contains information about the intensity values of proteins present in the wash fractions of Taxol-purified microtubules from Ate1+/+ and Ate1−/− cells.
Data availability
The mass spectrometry proteomics data have been deposited into the MassIVE (https://massive.ucsd.edu/) data repository with the accession number MSV000095053. Other data are available from the corresponding author upon reasonable request.
Acknowledgments
We thank members of the Kashina Lab for helpful discussions.
This work was supported by National Institutes of Health grants NIH R35GM122505 and R01NS102435 to A. Kashina and T32 GM007229.
Author contributions: B. MacTaggart: Conceptualization, Formal analysis, Investigation, Methodology, Validation, Visualization, Writing - original draft, Writing - review & editing, J. Wang: Conceptualization, Resources, Supervision, H.-Y. Tang: Investigation, Resources, Writing - review & editing, A. Kashina: Conceptualization, Data curation, Funding acquisition, Methodology, Project administration, Supervision, Visualization, Writing - original draft, Writing - review & editing.

