


Endocytosis, required for the uptake of receptors and their ligands, can also introduce pathological aggregates such as α-synuclein (α-syn) in Parkinson’s Disease. We show here the unexpected presence of intrinsically perforated endolysosomes in neurons, suggesting involvement in the genesis of toxic α-syn aggregates induced by internalized preformed fibrils (PFFs). Aggregation of endogenous α-syn in late endosomes and lysosomes of human iPSC-derived neurons (iNs), seeded by internalized α-syn PFFs, caused the death of the iNs but not of the parental iPSCs and non-neuronal cells. Live-cell imaging of iNs showed constitutive perforations in ∼5% of their endolysosomes. These perforations, identified by 3D electron microscopy in iNs and CA1 pyramidal neurons and absent in non-neuronal cells, may facilitate cytosolic access of endogenous α-syn to PFFs in the lumen of endolysosomes, triggering aggregation. Inhibiting the PIKfyve phosphoinositol kinase reduced α-syn aggregation and associated iN death, even with ongoing PFF endolysosomal entry, suggesting that maintaining endolysosomal integrity might afford a therapeutic strategy to counteract synucleinopathies.
Introduction
The endocytic pathway is a vital route for molecular uptake into cells. It is also a potential entryway for pathology-inducing cargo, as illustrated by the cell-to-cell transmission of cytotoxic aggregates such as α-synuclein (α-syn) in Parkinson’s Disease (PD). Hallmarks of PD, which affects ∼10 million individuals worldwide (Lashuel et al., 2013), are Lewy bodies, intracellular inclusions composed largely of α-syn aggregates, and fragmented membranes; α-syn also has an important role in normal synaptic function, probably by influencing synaptic vesicle trafficking (Iwai et al., 1995; Jakes et al., 1994; Courte et al., 2020).
α-syn, a 14-kDa neuronal protein, constitutes ∼1% of cytosolic proteins in neurons (Stefanis, 2012). In its native state, α-syn is an unstructured monomer that can adopt an α-helical conformation upon interacting with phospholipids (Bartels et al., 2011; Wang et al., 2011; Burré et al., 2013; Breydo et al., 2012; Theillet et al., 2016; Rovere et al., 2018; Galvagnion et al., 2015; Weinreb et al., 1996; Eliezer et al., 2001; Kramer and Schulz-Schaeffer, 2007). Under pathological conditions, however, α-syn forms cross β-sheet-rich amyloid fibrils that contribute to neurotoxicity (Conway et al., 2001). The transition of α-syn from a soluble, unfolded polypeptide to insoluble fibrillar aggregates is a critical aspect of PD pathogenesis. This process follows a nucleation-polymerization mechanism, in which preformed oligomers seed assembly of fibrillar structures, resulting in the formation of Lewy bodies (Weinreb et al., 1996; Fauvet et al., 2012; Suzuki et al., 2018; Kramer and Schulz-Schaeffer, 2007; Desplats et al., 2009; Baba et al., 1998; Danzer et al., 2007).
In vitro studies using various central nervous system–derived models and in vivo experiments using brain tissues have contributed substantially to our understanding of α-syn pathology in PD (Luk et al., 2009, 2012; Volpicelli-Daley et al., 2011; Luna et al., 2018; Dryanovski et al., 2013; Masuda-Suzukake et al., 2013; Paumier et al., 2015; Desplats et al., 2009; Recasens et al., 2018; Nonaka et al., 2010; Redmann et al., 2017). These investigations have shown that α-syn aggregates disseminate in a “prion-like” fashion, propagating from one cell to another. Thus, when neurons expressing wild-type α-syn are exposed to pre-formed fibrils (PFFs) of α-syn, these fibrils seed intracellular formation of α-syn aggregates, which damage the affected neurons.
α-syn aggregates that form in cells upon incubation with PFFs localize predominantly within lysosomes (Bayati et al., 2022; Domert et al., 2016; Xie et al., 2022; Karpowicz et al., 2017; Konno et al., 2012). Freeman and colleagues (Freeman et al., 2013) proposed that this mechanism requires disruption of the lysosomal membrane, which they suggested would be caused by the internalized PFFs themselves. Others have proposed that in neuronal tissues, cell-to-cell propagation of α-syn aggregates might occur by transfer within lysosomes from donor cells to recipient cells through tunneling nanotubes (Dilsizoglu Senol et al., 2021; Abounit et al., 2016).
While PFF-mediated aggregation of α-syn is typically observed in neuronal cells, it can also occur in non-neuronal cells. For instance, human HEK293T cells ectopically expressing wild-type α-syn can form aggregates when PFFs are introduced by protein transfection, e.g., by Lipofectamine (Woerman et al., 2015). A genome-wide CRISPR interference screen in HEK293T cells showed that depletion of 1-phosphatidylinositol 3-phosphate 5-kinase containing an FYVE-type zinc finger (PIKfyve) reduces this α-syn aggregation (See et al., 2021, Preprint). PIKfyve, a 240-kDa class III lipid kinase located on endosomal membranes, has a critical function in endolysosomal trafficking and autophagy (Bissig et al., 2017; Rutherford et al., 2006; de Lartigue et al., 2009; Sharma et al., 2019; Karabiyik et al., 2021; Kim et al., 2014). Inhibition of PIKfyve, either genetically or pharmacologically, depletes endolysosomal PI(5)P and PI(3,5)P2 phosphoinositides and leads to enlarged endolysosomes, disrupted fission, and impaired formation of autophagolysosomes (Karabiyik et al., 2021; Sharma et al., 2019; Choy et al., 2018; McCartney et al., 2014; Krishna et al., 2016; De Leo et al., 2021). See and colleagues (See et al., 2021, Preprint) suggested that inhibiting the transport of PFFs from endosomes to lysosomes by lowering PIKfyve activity would reduce lysosomal damage and that the reduced release of PFFs into the cytosol would prevent seeding of cytosolic α-syn aggregates. Others have proposed that pharmacological inhibition of PIKfyve might instead reduce lysosomal PFF content by increased endolysosomal fusion with the plasma membrane and consequent exocytic release of PFFs into the medium (Hung et al., 2023).
In the work reported here, we re-examined these questions with an experimental approach that avoided non-physiological protein transfection. We used human induced pluripotent stem cell (iPSC)–derived neurons (iNs), in which α-syn aggregates accumulated in late endosomes and lysosomes, seeded by wild-type α-syn PFFs internalized from the medium. In the absence of exposure to PFFs, we found that a small but significant proportion of late endosomes and lysosomes were inherently perforated (“leaky”) within the soma but not in the neurites of iNs; incubation with PFFs did not exacerbate this damage. We detected these perforated late endosomes and lysosomes by live-cell fluorescence microscopy, using biosensors designed to detect continuity with the cytosol. Volumetric high-resolution images acquired using focused ion beam scanning electron microscopy (FIB-SEM) corroborated these observations, both in iNs and in CA1 pyramidal neurons from mouse brain. In contrast, endolysosomes in parental iPSCs and other non-neuronal cells, whether in tissue culture or in the liver, appeared structurally intact, in agreement with current understanding.
Acute pharmacological inhibition of PIKfyve activity in iNs with Apilimod or Vacuolin-1 reduced the damage detected in late endosomes and lysosomes, prevented the PFF-mediated aggregation of cytosolic α-syn induced by PFF exposure, and substantially lowered neurotoxicity and associated neuronal cell death. These findings suggest that targeting PIKfyve activity might represent a viable therapeutic strategy for preventing and treating synucleinopathies. This approach would offer a way to mitigate the progression of these neurodegenerative disorders by addressing a fundamental aspect of their cellular pathology.
Results
Incubation of iNs with PFFs causes the formation of α-syn-YFP aggregates
As a tissue-culture model resembling the early stages in the synucleinopathy of Parkinson’s disease, we used human iNs. We could induce formation of α-syn aggregates in these cells from ectopically, transiently expressed, cytosolic α-syn fused to YFP (α-syn-YFP) by incubating them for 3 days with 4 µg/ml (∼ 0.3 µM) PFFs produced from recombinant wild-type α-syn expressed in Escherichia coli (Volpicelli-Daley et al., 2014; Gribaudo et al., 2019). The iNs were generated by differentiation from iPSCs in response to the expression of the neuronal transcription factor NGN2 (Zhang et al., 2013; Lagomarsino et al., 2021). Inspection of the iNs 14–21 days after onset of differentiation showed the appearance of neurites emanating from the soma and expression of the neuronal marker MAP2 (detected by immunofluorescence; Fig. 1 A); neurites and MAP2 were absent in the parental iPSCs (Fig. 1 B).

α-syn-YFP aggregation in iNs exposed to PFFs . (A and B) Immunofluorescence images obtained using spinning disc confocal microscopy depict maximum z-projections made from consecutive optical planes spaced 270 nm apart of chemically fixed parental iPSCs (A) and iNs (B) treated with MAP2-specific antibody for neuronal identification. Cell perimeters in B are outlined with white dotted lines. Images are representative of two biological replicates. Scale bar: 40 µm. (C–E) iNs transiently expressing α-syn-YFP display a diffuse cytoplasmic distribution of α-syn-YFP without PFF treatment (C), compared to distinct α-syn-YFP aggregates mostly in soma and fewer in neurites after 3 days of incubation with 4 µg/ml (∼0.3 µM) PFFs (D). Live-cell spinning-disc confocal microscopy images depict maximum z-projections and are representative of three biological replicates. Scale bar: 10 µm. Insets provide 2× magnification. Bar graph in E quantifies the fraction of cells containing α-syn-YFP aggregates for the specified number of cells; each dot represents data from each replicate. (F–H) iNs stably expressing α-syn-YFP, when incubated without (F) and with (G) 4 µg/ml PFFs for 3 days, show puncta consistent with α-syn-YFP aggregates. Live-cell spinning-disc confocal microscopy images depict maximum z-projections and are representative of two biological replicates. Scale bar: 10 µm. Insets offer 2× magnification. Bar graph in H quantifies the fraction of cells containing α-syn-YFP aggregates; each dot represents data from a biological replicate. (I–K) iPSCs stably expressing α-syn-YFP exhibit a diffuse cytosolic α-syn-YFP signal in the absence (I) or after a 3-day incubation with 4 µg/ml PFFs (J). Live-cell spinning-disc confocal microscopy images depict maximum z-projections and are representative of two biological replicates. Scale bar: 10 µm. Insets show 2× magnification. Bar graph in K quantifies the fraction of cells containing α-syn-YFP aggregates for the specified number of cells; each dot represents data from each replicate. (L–N) SVG-A cells stably expressing α-syn-YFP show diffuse cytoplasmic α-syn-YFP signal in (L) the absence of or (M) after a 3-day incubation with 4 µg/ml PFFs. Live-cell spinning-disc confocal microscopy images depict maximum z-projections and are representative of three biological replicates. Scale bar: 10 µm. Insets show 2× magnification. Bar graph in N quantifies the fraction of cells containing α-syn-YFP aggregates for the specified number of cells; each dot represents data from each replicate. Statistical significance (P < 0.005) is indicated by a star; “ns” denotes no statistical difference.
α-syn-YFP aggregation in iNs exposed to PFFs . (A and B) Immunofluorescence images obtained using spinning disc confocal microscopy depict maximum z-projections made from consecutive optical planes spaced 270 nm apart of chemically fixed parental iPSCs (A) and iNs (B) treated with MAP2-specific antibody for neuronal identification. Cell perimeters in B are outlined with white dotted lines. Images are representative of two biological replicates. Scale bar: 40 µm. (C–E) iNs transiently expressing α-syn-YFP display a diffuse cytoplasmic distribution of α-syn-YFP without PFF treatment (C), compared to distinct α-syn-YFP aggregates mostly in soma and fewer in neurites after 3 days of incubation with 4 µg/ml (∼0.3 µM) PFFs (D). Live-cell spinning-disc confocal microscopy images depict maximum z-projections and are representative of three biological replicates. Scale bar: 10 µm. Insets provide 2× magnification. Bar graph in E quantifies the fraction of cells containing α-syn-YFP aggregates for the specified number of cells; each dot represents data from each replicate. (F–H) iNs stably expressing α-syn-YFP, when incubated without (F) and with (G) 4 µg/ml PFFs for 3 days, show puncta consistent with α-syn-YFP aggregates. Live-cell spinning-disc confocal microscopy images depict maximum z-projections and are representative of two biological replicates. Scale bar: 10 µm. Insets offer 2× magnification. Bar graph in H quantifies the fraction of cells containing α-syn-YFP aggregates; each dot represents data from a biological replicate. (I–K) iPSCs stably expressing α-syn-YFP exhibit a diffuse cytosolic α-syn-YFP signal in the absence (I) or after a 3-day incubation with 4 µg/ml PFFs (J). Live-cell spinning-disc confocal microscopy images depict maximum z-projections and are representative of two biological replicates. Scale bar: 10 µm. Insets show 2× magnification. Bar graph in K quantifies the fraction of cells containing α-syn-YFP aggregates for the specified number of cells; each dot represents data from each replicate. (L–N) SVG-A cells stably expressing α-syn-YFP show diffuse cytoplasmic α-syn-YFP signal in (L) the absence of or (M) after a 3-day incubation with 4 µg/ml PFFs. Live-cell spinning-disc confocal microscopy images depict maximum z-projections and are representative of three biological replicates. Scale bar: 10 µm. Insets show 2× magnification. Bar graph in N quantifies the fraction of cells containing α-syn-YFP aggregates for the specified number of cells; each dot represents data from each replicate. Statistical significance (P < 0.005) is indicated by a star; “ns” denotes no statistical difference.
Ectopic expression of α-syn-YFP in iNs yielded a diffuse, cytosolic fluorescent signal (Fig. 1, C and E), a distribution expected for soluble cytosolic α-syn-YFP, also observed when stably expressed in immortalized astroglia-derived simian virus 40 transformed glial (SVG-A) cells (Fig. 1 L). This diffuse distribution has also been observed in other non-neuronal cell types (Vasili et al., 2022; Furlong et al., 2000; Fortin et al., 2005; Imberdis et al., 2019). Continuous 3-day incubation of iNs with PFFs resulted in the appearance of α-syn-YFP fluorescent spots, indicating the formation of α-syn-YFP aggregates, primarily in somas and less frequently in neurites (Fig. 1, D and E). In contrast, similarly treated SVG-A cells showed only a cytosolic α-syn-YFP signal (Fig. 1, M and N), despite expressing higher levels of α-syn-YFP (Fig. S1), ruling out the possibility that aggregation was directly related to expression levels.

Expression levels of α-syn-YFP do not correlate with PFF-mediated α-syn-YFP aggregate formation (associated with Figs. 1,and2 ). α-syn-YFP expression levels do not predict PFF-mediated α-syn-YFP aggregation. F.I., fluorescence intensity. Bar graphs show relative α-syn-YFP expression per cell, calculated by summing total fluorescence across sequential z-planes (spaced 270 nm apart) after background subtraction, acquired under identical live-cell fluorescence spinning disc confocal microscopy conditions. Analysis includes iNs transiently expressing α-syn-YFP as well as iPSCs and SVG-A cells with stable α-syn-YFP expression; each dot represents a single cell. Horizontal bar denotes median value. Cells were preincubated with 4 µg/ml PFFs for 3 days before imaging. Aggregation was quantified as the percentage of cells containing PFF-mediated α-syn-YFP spots. The number of cells analyzed is indicated.

Expression levels of α-syn-YFP do not correlate with PFF-mediated α-syn-YFP aggregate formation (associated with Figs. 1,and2 ). α-syn-YFP expression levels do not predict PFF-mediated α-syn-YFP aggregation. F.I., fluorescence intensity. Bar graphs show relative α-syn-YFP expression per cell, calculated by summing total fluorescence across sequential z-planes (spaced 270 nm apart) after background subtraction, acquired under identical live-cell fluorescence spinning disc confocal microscopy conditions. Analysis includes iNs transiently expressing α-syn-YFP as well as iPSCs and SVG-A cells with stable α-syn-YFP expression; each dot represents a single cell. Horizontal bar denotes median value. Cells were preincubated with 4 µg/ml PFFs for 3 days before imaging. Aggregation was quantified as the percentage of cells containing PFF-mediated α-syn-YFP spots. The number of cells analyzed is indicated.
Equivalent experiments with undifferentiated parental iPSCs were not feasible because iPSCs were not amenable to transient α-syn-YFP expression with our transfection protocol. Instead, using iPSCs harboring wild-type α-syn-YFP stably expressed by lentiviral transduction, we detected only diffuse cytosolic α-syn-YFP, regardless of whether they had been incubated for 3 days with PFFs (Fig. 1, I–K). In contrast, iNs stably expressing α-syn-YFP imaged 5–14 days after the onset of differentiation had both abundant intracellular α-syn-YFP spots and diffuse cytosolic α-syn-YFP, regardless of whether the iNs had been exposed to PFF for 3 days or not (Fig. 1, F–H). We concluded that the formation of α-syn-YFP aggregates induced by incubation with PFF is restricted to iNs and is not detected in cell types of non-neuronal origin. We note that transient or stable expression of ectopic α-syn-YFP in iNs was not toxic and did not induce cell death (see Fig. 9, I–K)—an observation relevant for many of the following experiments.
Incubation of iNs with PFFs mediates endolysosomal aggregation of cytosolic α-syn-YFP
Published observations show that α-syn aggregates induced by internalized α-syn PFFs localize to LAMP1-containing lysosomes in human H4-neuroglioma derived cells (Jiang et al., 2017), mouse Cath.a-differentiated (CAD) cells (Dilsizoglu Senol et al., 2021), and mouse-derived primary neurons (Volpicelli-Daley et al., 2011).
Using three different fluorescence microscopy-based approaches, we extended these observations to show that 3-day incubation of iNs with PFFs also induced the formation of α-syn-YFP aggregates in late endosomes and lysosomes. In the first approach (Fig. 2, A–F and Fig. S2), we used live-cell, spinning-disc confocal fluorescence microscopy to visualize iNs transiently or stably expressing α-syn-YFP that had been continuously incubated for 2 h before imaging with fluorescent Alexa Fluor 647 labeled dextran (Dextran-AF647), an endocytic fluid phase marker known to appear as intracellular fluorescent spots when accumulated in late endosomes and lysosomes (Fig. 2, A–F and Fig. S2, A–D) (Ellinger et al., 1998). In the presence of PFF, these dextran spots colocalized with most PFF-induced α-syn-YFP aggregates that formed in iNs transiently expressing α-syn-YFP (Fig. 2, B and C; and Fig. S2 B). α-syn-YFP aggregates that were spontaneously formed in iNs stably expressing α-syn-YFP and not exposed to PFFs failed to colocalize with internalized Dextran-AF647, suggesting in that case a non-endolysosomal location of the α-syn-YFP aggregates (Fig. 2 D and Fig. S2 C). 3-day incubation of α-syn-YFP expressing cells with PFFs led to partial colocalization (Fig. 2, E and F; and Fig. S2 D). These observations are therefore consistent with endolysosomal localization of PFF-induced α-syn aggregates.

Localization of PFF-induced α-Syn-YFP aggregates in endosomal and lysosomal compartments. (A, B, D, E, G, H, J, K, M, N, P, and Q) 3D visualization of live (A, B, D, and E) and chemically fixed (G, H, J, K, M, N, P, and Q) cells using spinning-disc confocal microscopy. Representative images show maximum z-projections of four consecutive optical planes, spaced 270 nm apart. (A–C) iNs transiently expressing α-syn-YFP, incubated for 3 days without (A) or with (B) 4 µg/ml PFF, followed by a 2-h incubation with 20 µg/ml fluorescent Dextran Alexa Fluor 647. Images are representative of three biological replicates. Scale bar: 10 µm. Insets show 3× magnification. Scale bar: 3.3 µm. Bar graph (C) quantifies the fraction of dextran spots colocalized with α-syn-YFP aggregates in the absence or presence of PFF, highlighting the predominant localization of α-syn-YFP in late endosomes and lysosomes in the PFF condition. Each dot represents data from an individual cell. (D–F) iNs stably expressing α-syn-YFP, incubated for 3 days without (D) or with (E) 4 µg/ml PFF, followed by 20 µg/ml Dextran Alexa Fluor 647. Images are representative of three biological replicates. Scale bar: 10 µm. Insets show 3× magnification. Scale bar: 3.3 µm. Bar graph (F) shows minimal colocalization between spontaneously formed α-syn-YFP aggregates (without PFF) and Dextran, indicating reduced endolysosomal localization. Each dot represents data from all spots in each field (five to nine cells per field). (G–L) iNs transiently (G and H) or stably (J and K) expressing α-syn-YFP, incubated with 4 µg/ml PFF for 3 days, stained for EEA1 (early endosome marker, G and J) or LAMP1 (late endosome/lysosome marker, H and K). Images represent three biological replicates. Scale bar: 10 µm. Insets show 3× magnification. Scale bar: 3.3 µm. Bar graphs (I and L) quantify colocalization between α-syn-YFP aggregates and EEA1 or LAMP1 markers. In I, each dot represents data from all spots in a cell; in L, each dot represents data from all spots in a field (five to nine cells per field). (M–O) iNs incubated with 4 µg/ml PFF-AF647 for 3 days, immunostained for EEA1 (M) or LAMP1 (N). Images represent three biological replicates. Scale bar: 10 µm. Insets show 3× magnification. Scale bar: 3.3 µm. Bar graph (O) quantifies colocalization between internalized PFF-AF647 and EEA1 or LAMP1. Each dot represents data from all spots in a field (five to nine cells per field). (P–R) iNs transiently expressing α-syn-YFP, incubated with 4 µg/ml PFF-AF647 for 3 days, stained for EEA1 (P) or LAMP1 (Q). Images represent two biological replicates. Scale bar: 10 µm. Insets show 3× magnification. Scale bar: 3.3 µm. (R) Bar graph quantifies colocalization between α-syn-YFP aggregates and EEA1 or LAMP1 markers. Each dot represents an individual cell. Total cell counts are provided. Statistical significance (P < 0.005) is indicated by a star; “ns” denotes no statistical difference.
Localization of PFF-induced α-Syn-YFP aggregates in endosomal and lysosomal compartments. (A, B, D, E, G, H, J, K, M, N, P, and Q) 3D visualization of live (A, B, D, and E) and chemically fixed (G, H, J, K, M, N, P, and Q) cells using spinning-disc confocal microscopy. Representative images show maximum z-projections of four consecutive optical planes, spaced 270 nm apart. (A–C) iNs transiently expressing α-syn-YFP, incubated for 3 days without (A) or with (B) 4 µg/ml PFF, followed by a 2-h incubation with 20 µg/ml fluorescent Dextran Alexa Fluor 647. Images are representative of three biological replicates. Scale bar: 10 µm. Insets show 3× magnification. Scale bar: 3.3 µm. Bar graph (C) quantifies the fraction of dextran spots colocalized with α-syn-YFP aggregates in the absence or presence of PFF, highlighting the predominant localization of α-syn-YFP in late endosomes and lysosomes in the PFF condition. Each dot represents data from an individual cell. (D–F) iNs stably expressing α-syn-YFP, incubated for 3 days without (D) or with (E) 4 µg/ml PFF, followed by 20 µg/ml Dextran Alexa Fluor 647. Images are representative of three biological replicates. Scale bar: 10 µm. Insets show 3× magnification. Scale bar: 3.3 µm. Bar graph (F) shows minimal colocalization between spontaneously formed α-syn-YFP aggregates (without PFF) and Dextran, indicating reduced endolysosomal localization. Each dot represents data from all spots in each field (five to nine cells per field). (G–L) iNs transiently (G and H) or stably (J and K) expressing α-syn-YFP, incubated with 4 µg/ml PFF for 3 days, stained for EEA1 (early endosome marker, G and J) or LAMP1 (late endosome/lysosome marker, H and K). Images represent three biological replicates. Scale bar: 10 µm. Insets show 3× magnification. Scale bar: 3.3 µm. Bar graphs (I and L) quantify colocalization between α-syn-YFP aggregates and EEA1 or LAMP1 markers. In I, each dot represents data from all spots in a cell; in L, each dot represents data from all spots in a field (five to nine cells per field). (M–O) iNs incubated with 4 µg/ml PFF-AF647 for 3 days, immunostained for EEA1 (M) or LAMP1 (N). Images represent three biological replicates. Scale bar: 10 µm. Insets show 3× magnification. Scale bar: 3.3 µm. Bar graph (O) quantifies colocalization between internalized PFF-AF647 and EEA1 or LAMP1. Each dot represents data from all spots in a field (five to nine cells per field). (P–R) iNs transiently expressing α-syn-YFP, incubated with 4 µg/ml PFF-AF647 for 3 days, stained for EEA1 (P) or LAMP1 (Q). Images represent two biological replicates. Scale bar: 10 µm. Insets show 3× magnification. Scale bar: 3.3 µm. (R) Bar graph quantifies colocalization between α-syn-YFP aggregates and EEA1 or LAMP1 markers. Each dot represents an individual cell. Total cell counts are provided. Statistical significance (P < 0.005) is indicated by a star; “ns” denotes no statistical difference.

Localization of PFF-induced α-Syn-YFP aggregates in endosomal and lysosomal compartments (associated with Fig. 2 ). (A–L) 3D visualization of (A–D) live and (E–L) chemically fixed cells imaged using spinning-disc confocal microscopy. Representative images depict maximum z-projections of the whole cell volume made from consecutive optical planes spaced 270 nm apart. (A and B) iNs transiently expressing α-syn-YFP incubated for 3 days without (A) or with (B) 4 µg/ml PFF, followed by a 2-h incubation with 20 µg/ml fluorescent Dextran Alexa Fluor 647. Images are representative of three biological replicates. Scale bar: 10 µm. Insets with 3× magnification, Scale bar: 3.3 µm. (C and D) iNs stably expressing α-syn-YFP incubated for 3 days without (C) or with (D) 4 µg/ml PFF, followed by 20 µg/ml Dextran Alexa Fluor 647 incubation. Images are representative of three biological replicates. Scale bar: 10 µm. Insets with 3× magnification. Scale bar: 3.3 µm. (E–H) iNs expressing α-syn-YFP transiently (E and F) or stably (G and H), incubated with 4 µg/ml PFF for 3 days, were stained for EEA1 (early endosome marker, E and G) or LAMP1 (late endosome/lysosome marker, F and H). Images are representative of three biological replicates. Scale bar: 10 µm. Enlargements with 3× magnification. Scale bar: 3.3 µm. (I and J) iNs incubated with 4 µg/ml PFF-AF647 for 3 days and immune-stained for EEA1 (I) or LAMP1 (J). Images are representative of two biological replicates. Scale bar: 10 µm. Enlargements with 3× magnification, Scale bar: 3.3 µm. (K and L) iNs transiently expressing α-syn-YFP incubated with 4 µg/ml PFF-AF647 for 3 days, stained for EEA1 (K) or LAMP1 (L). Images are representative of two biological replicates. Scale bar: 10 µm. Insets with 3× magnification. Scale bar: 3.3 µm.

Localization of PFF-induced α-Syn-YFP aggregates in endosomal and lysosomal compartments (associated with Fig. 2 ). (A–L) 3D visualization of (A–D) live and (E–L) chemically fixed cells imaged using spinning-disc confocal microscopy. Representative images depict maximum z-projections of the whole cell volume made from consecutive optical planes spaced 270 nm apart. (A and B) iNs transiently expressing α-syn-YFP incubated for 3 days without (A) or with (B) 4 µg/ml PFF, followed by a 2-h incubation with 20 µg/ml fluorescent Dextran Alexa Fluor 647. Images are representative of three biological replicates. Scale bar: 10 µm. Insets with 3× magnification, Scale bar: 3.3 µm. (C and D) iNs stably expressing α-syn-YFP incubated for 3 days without (C) or with (D) 4 µg/ml PFF, followed by 20 µg/ml Dextran Alexa Fluor 647 incubation. Images are representative of three biological replicates. Scale bar: 10 µm. Insets with 3× magnification. Scale bar: 3.3 µm. (E–H) iNs expressing α-syn-YFP transiently (E and F) or stably (G and H), incubated with 4 µg/ml PFF for 3 days, were stained for EEA1 (early endosome marker, E and G) or LAMP1 (late endosome/lysosome marker, F and H). Images are representative of three biological replicates. Scale bar: 10 µm. Enlargements with 3× magnification. Scale bar: 3.3 µm. (I and J) iNs incubated with 4 µg/ml PFF-AF647 for 3 days and immune-stained for EEA1 (I) or LAMP1 (J). Images are representative of two biological replicates. Scale bar: 10 µm. Enlargements with 3× magnification, Scale bar: 3.3 µm. (K and L) iNs transiently expressing α-syn-YFP incubated with 4 µg/ml PFF-AF647 for 3 days, stained for EEA1 (K) or LAMP1 (L). Images are representative of two biological replicates. Scale bar: 10 µm. Insets with 3× magnification. Scale bar: 3.3 µm.
In the second approach (Fig. 2, G–L and Fig. S2, E–H), we chemically fixed iNs after the 3-day PFF incubation before imaging by spinning disc confocal fluorescence microscopy to determine the extent of colocalization of PFF-induced α-syn-YFP aggregates with antibody markers specific for early endosomes (EEA1) and lysosomes (LAMP1) (Humphries et al., 2011). In agreement with recent observations (Dilsizoglu Senol et al., 2021; Bayati et al., 2022) and the results obtained with the first approach, we found minimal colocalization of PFF-induced α-syn-YFP aggregates with EEA1 (Fig. 2, G and I; and Fig. S2 E) and extensive colocalization with LAMP1 (Fig. 2, H and I; and Fig. S2 F) in iNs transiently expressing α-syn-YFP. Also, in agreement with results obtained with the first approach, iNs stably expressing α-syn-YFP and incubated for 3 days with PFF failed to show colocalization of the induced α-syn-YFP aggregates with EEA1 (Fig. 2, J and L; and Fig. S2 G) and showed only a small fraction of α-syn-YFP aggregates colocalized with LAMP1 (Fig. 2, K and L; and Fig. S2 H).
In the third approach (Fig. 2, M–R and Fig. S2, I–L), we incubated iNs expressing endogenous α-syn alone (Fig. 2, M–O; and Fig. S2, I and J) or transiently expressing α-syn-YFP (Fig. 2, P–R; and Fig. S2, K and L) with PFF tagged with Alexa Fluor 647 (PFF-AF647) for 3 days, followed by chemical fixation. We then used spinning disc confocal microscopy to determine the extent of colocalization of the internalized PFFs with early or late endosomes and lysosomes, identified by antibodies specific for EEA1 or LAMP1, respectively. We again found minimal colocalization of internalized PFFs with EEA1 (Fig. 2, M, O, P, and R; and Fig. S2, I and K) and extensive colocalization with LAMP1 (Fig. 2, N, O, Q, and R; and Fig. S2, J and L), indicating that transient expression of α-syn-YFP had no detectable effect on the endolysosomal traffic of internalized PFFs.
Taken together, these colocalization observations, which were consistent with published results obtained with neuronal cells (Jiang et al., 2017; Volpicelli-Daley et al., 2011; Dilsizoglu Senol et al., 2021; Karpowicz et al., 2017; Konno et al., 2012), validated our use of iNs as a convenient model system to study the early formation in endolysosomes of α-syn aggregates mediated by internalized PFFs.
Constitutive perforation of limiting membranes in late endosomes and lysosomes of iNs
The limiting membrane surrounding endolysosomes acts as a natural barrier, preventing macromolecular exchange between the lumen and the cytosol. Aggregation of α-syn within endolysosomes suggests a breach in the integrity of the limiting membrane (Dilsizoglu Senol et al., 2021), which could allow cytosolic α-syn to reach internalized PFFs retained in the lumen of perforated endolysosomes could be reached by cytosolic α-syn and then lead to PFF-seeded formation of α-syn endolysosomal aggregates. We described below two strategies we used to investigate this hypothesis.
First, we implemented galectin-3 biosensors in both fixed and live cells to detect endolysosomal perforation. The recruitment of galectin-3 to damaged membranes provided a quantifiable readout for membrane integrity. It is known that damage to the endolysosomal membrane exposes luminal oligosaccharides that recruit galectins, such as galectin-3 and galectin-8, triggering repair mechanisms (Radulovic et al., 2018; Jia et al., 2018, 2020). Hence, the presence of galectin-3 puncta is commonly used as a reporter for endolysosomal damage. Using a galectin-3 antibody, we observed that ∼40% of iNs contain 1–3 endogenous galectin-3 puncta (Fig. 3, B and C), while non-neuronal SVG-A cells had only a diffuse cytosolic distribution of galectin-3 (Fig. 3 A). The immunofluorescent signal for galectin-3 in iNs was lower and closer to background levels than in SVG-A cells, consistent with differences in their relative expression levels of galectin-3 as confirmed by western blot analysis (Fig. S3 A).

PFF-induced α-Syn-YFP aggregates in perforated endolysosomes. (A and B) Immunofluorescence images of SVG-A and iNs, obtained in the absence of PFFs, labeled with antibody specific for galectin-3. Scale bar: 10 µm. Insets provide 2× magnification. (C) Bar graph quantifies the fraction of cells containing galectin-3 puncta; each dot represents a biological replicate. (D–F) Live imaging of SVG-A and iNs, stably or transiently expressing eGFP-galectin-3, respectively. Scale bar: 10 µm. Insets provide 2× magnification. The bar graph in F quantifies the fraction of cells containing eGFP-galectin-3 spots; each dot represents a biological replicate. (G–L) Live imaging of iNs transiently expressing eGFP-galectin-3 incubated without (G) or with 4 µg/ml PFFs for 3 days (H), in the absence (J) or presence of 1 µM Apilimod for 3 days (K). Scale bar: 10 µm. Insets provide 2× magnification. Images are representative of two biological replicates. Bar graphs in I and L quantify the fraction of cells containing galectin-3 puncta; each dot represents a biological replicate. Statistical significance (P < 0.005) is indicated by a star; “ns” denotes no statistical difference.
PFF-induced α-Syn-YFP aggregates in perforated endolysosomes. (A and B) Immunofluorescence images of SVG-A and iNs, obtained in the absence of PFFs, labeled with antibody specific for galectin-3. Scale bar: 10 µm. Insets provide 2× magnification. (C) Bar graph quantifies the fraction of cells containing galectin-3 puncta; each dot represents a biological replicate. (D–F) Live imaging of SVG-A and iNs, stably or transiently expressing eGFP-galectin-3, respectively. Scale bar: 10 µm. Insets provide 2× magnification. The bar graph in F quantifies the fraction of cells containing eGFP-galectin-3 spots; each dot represents a biological replicate. (G–L) Live imaging of iNs transiently expressing eGFP-galectin-3 incubated without (G) or with 4 µg/ml PFFs for 3 days (H), in the absence (J) or presence of 1 µM Apilimod for 3 days (K). Scale bar: 10 µm. Insets provide 2× magnification. Images are representative of two biological replicates. Bar graphs in I and L quantify the fraction of cells containing galectin-3 puncta; each dot represents a biological replicate. Statistical significance (P < 0.005) is indicated by a star; “ns” denotes no statistical difference.
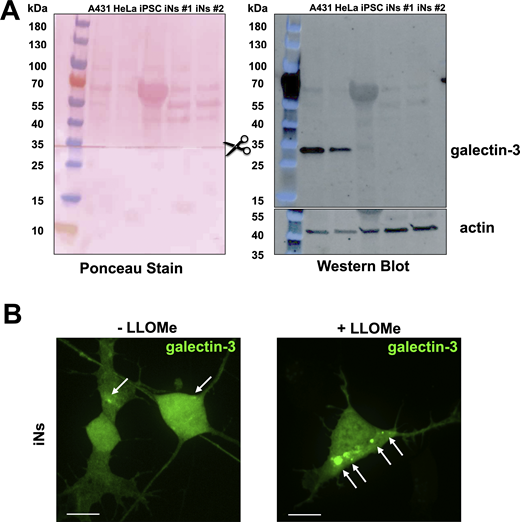
Endogenous expression level of galectin-3 is relatively low in iNs and validation of eGFP-galectin-3 as a sensor of endolysosome damage (associated withFig. 3 ). (A) Galectin-3 expression levels compared via SDS-PAGE and western blot of lysates from human A431, HeLa, parental iPSCs, and two independently differentiated iNs. The membrane was first probed for endogenous galectin-3, then cut at the indicated region and the lower portion was probed for actin, and finally, both portions stained with Ponceau. Western blot shows significantly lower galectin-3 expression in iPSCs and iNs when compared with A431 and HeLa cells. (B) iNs ectopically expressing eGFP-galectin-3 were treated with or without 0.5 mM LLOMe for 1 h to induce endolysosomal damage. Cells were imaged using spinning disc confocal microscopy. Representative maximum z-projection images from consecutive optical planes spaced 270 nm apart. Arrows highlight eGFP-galectin-3 spots. This experiment demonstrates the utility of eGFP-galectin-3 as a probe for extensive endolysosomal damage in iNs. Images are representative of 48 and 49 cells expressing eGFP-galectin-3 without or with LLOMe treatment from one biological replicate. Scale bar: 10 µm. Source data are available for this figure: SourceData FS3.

Endogenous expression level of galectin-3 is relatively low in iNs and validation of eGFP-galectin-3 as a sensor of endolysosome damage (associated withFig. 3 ). (A) Galectin-3 expression levels compared via SDS-PAGE and western blot of lysates from human A431, HeLa, parental iPSCs, and two independently differentiated iNs. The membrane was first probed for endogenous galectin-3, then cut at the indicated region and the lower portion was probed for actin, and finally, both portions stained with Ponceau. Western blot shows significantly lower galectin-3 expression in iPSCs and iNs when compared with A431 and HeLa cells. (B) iNs ectopically expressing eGFP-galectin-3 were treated with or without 0.5 mM LLOMe for 1 h to induce endolysosomal damage. Cells were imaged using spinning disc confocal microscopy. Representative maximum z-projection images from consecutive optical planes spaced 270 nm apart. Arrows highlight eGFP-galectin-3 spots. This experiment demonstrates the utility of eGFP-galectin-3 as a probe for extensive endolysosomal damage in iNs. Images are representative of 48 and 49 cells expressing eGFP-galectin-3 without or with LLOMe treatment from one biological replicate. Scale bar: 10 µm. Source data are available for this figure: SourceData FS3.
We used chimeric fluorescent galectin-3 as a live-cell biosensor to detect endolysosomal membrane damage. Upon membrane damage, the fluorescent signal redistributes from the cytosol into distinct puncta marking damaged organelles (Jia et al., 2020; Thurston et al., 2012). In iNs transiently expressing eGFP-galectin-3, this redistribution was observed as punctate spots following treatment with 0.5 mM L-leucyl-L-leucine methyl ester (LLOMe) for 1 h, inducing endolysosomal damage (Fig. S3 B). In untreated iNs expressing eGFP-galectin-3, ∼30% of cells exhibited one to three fluorescent spots (Fig. 3, E and F), comparable with the number of endogenous galectin-3 puncta detected by immunofluorescence in cells lacking eGFP-galectin-3 expression. These results confirm that ectopically expressed eGFP-galectin-3 reliably serves as a biosensor for endolysosomal damage in iNs. A 3-day incubation with PFFs did not change the fraction of iNs containing eGFP-galectin spots (Fig. 3, G–I). These puncta were absent in adjacent, non-expressing cells, ruling out extracellular uptake of eGFP-galectin-3. In contrast, SVG-A cells showed only a diffuse cytosolic distribution of eGFP-galectin-3 (Fig. 3 D), as seen in other non-neuronal cells (Freeman et al., 2013; Paz et al., 2010; Aits et al., 2015). Thus, galectin-3 recruitment in both fixed and live cells detected the presence of perforated endolysosomes in iNs that had not been exposed to PFFs. Consistent with a recent report on tau-PFF-mediated aggregation (Rose et al., 2024), we similarly observed that galectin-3 puncta did not colocalize with PFF-seeded α-syn-YFP endolysosomal aggregates.
Our second strategy used live-cell imaging combined with ratiometric fluorescence microscopy to monitor pH changes in endolysosomes upon membrane damage. By tracking pHrodo Green-tagged Dextran, we could directly assess the luminal pH. Membrane rupture is expected to neutralize the endolysosomal lumen by allowing equilibration with the cytosol (Maxson and Grinstein, 2014). We measured luminal pH using a spinning disc and ratiometric fluorescence microscopy with Dextran conjugated to pH-sensitive pHrodo Green and pH-insensitive Alexa Fluor 560. The fluorescence from internalized Dextran spots was monitored at early and late time points (1 and 6 h, respectively). At the early time point, only ∼0.8% of labeled compartments in iNs were neutral (Fig. 4, B and C), increasing to 3–6% at the later time point (Fig. 4, E, G, H, and J), like findings in primary rat hippocampal neurons (Fig. 4, F and G). In contrast, endosomes and lysosomes in parental iPSCs remained acidic (Fig. 4, A, C, D, and G). Late endosomes and lysosomes in iNs were generally slightly less acidic than those in iPSCs (Fig. 4, C and G).

pH of endolysosomes. (A–G) Live imaging of iPSCs and iNs incubated with 20 µg/ml of pH-sensitive pHrodo Dextran 488 and pH-insensitive Dextran Alexa Fluor 560 for 1 h (A–C) or 2 h followed by a 4-h chase (D–G), labeling early/late endosomes and late endosomes/lysosomes, respectively. Images are representative of three biological replicates. Scale bar: 10 µm. Heat map bars show pH values derived from fluorescence ratios in permeabilized samples incubated with solutions of different pH. Histogram in C presents average pH values ± standard deviation from Dextran-containing spots, based on data from 14,586 spots across 60 fields from 3 independently differentiated iN samples and from the 5,366 spots across 20 fields from iPSCs, respectively. Histogram in G presents average pH values ± standard deviation from Dextran-containing spots, based on data from 20,293 spots across 60 fields from one dissection of primary rat hippocampal neurons, from 10,922 spots across 20 fields from three independently differentiated iN samples and from the 5,366 spots across 20 fields from iPSCs, respectively. The error at 95% confidence of the calculated pH values is ∼0.4 pH units. (H–J) iNs incubated with or without 4 µg/ml PFF for 3 days, then treated with the dextran pH sensor mixture for 2 h and a 4-h chase. Images are representative of three biological replicates. Scale bar: 10 µm. Heat map and histogram (J) as in C and G, with data from 3,497 to 2,239 spots across 10 fields from three independently differentiated iN samples. (K) Z-maximum projection from a z-stack of a 10-min time series, acquired by live-cell lattice light sheet microscopy 4 h after iNs were incubated for 2 h with a mixture of pH-sensitive pHrodo Green dextran and pH-insensitive Alexa Fluor 560 Dextran. For clarity, the red and green channels were shifted horizontally by 10 pixels. Scale bar: 5 µm. Snapshots represent images from time series acquired in seven different fields from one differentiated iN biological sample. The image highlights the presence of endolysosomes with neutral pH. Representative of two biological replicates. (L) Ratiometric fluorescence intensity plots of the endolysosomes highlighted in A, based on a 10-min 3D time series acquired using the ZEISS Lattice Light Sheet 7 microscope with a 2.6-s interval and 0.25-µm spacing between optical planes along the z-axis. Partial traces 1 and 3 illustrate examples of endolysosomes maintaining neutral pH, while trace 2 shows an endolysosome that remains acidic. Arrows indicate the acquisition times corresponding to the snapshots in J. (M) Representative image from a 3D 5-min time series of an SVG-A cell, captured by ratiometric fluorescence imaging using MOSAIC at 2-s intervals with 0.3 µm spacing between optical planes along the z-axis. The image demonstrates the absence of endolysosomes with neutral pH. Representative of three biological replicates. (N) Ratiometric fluorescence intensity plots of the endolysosomes highlighted in C, showing examples of endolysosomes maintaining constant acidic pH. Arrows indicate the acquisition times corresponding to the snapshots in L.
pH of endolysosomes. (A–G) Live imaging of iPSCs and iNs incubated with 20 µg/ml of pH-sensitive pHrodo Dextran 488 and pH-insensitive Dextran Alexa Fluor 560 for 1 h (A–C) or 2 h followed by a 4-h chase (D–G), labeling early/late endosomes and late endosomes/lysosomes, respectively. Images are representative of three biological replicates. Scale bar: 10 µm. Heat map bars show pH values derived from fluorescence ratios in permeabilized samples incubated with solutions of different pH. Histogram in C presents average pH values ± standard deviation from Dextran-containing spots, based on data from 14,586 spots across 60 fields from 3 independently differentiated iN samples and from the 5,366 spots across 20 fields from iPSCs, respectively. Histogram in G presents average pH values ± standard deviation from Dextran-containing spots, based on data from 20,293 spots across 60 fields from one dissection of primary rat hippocampal neurons, from 10,922 spots across 20 fields from three independently differentiated iN samples and from the 5,366 spots across 20 fields from iPSCs, respectively. The error at 95% confidence of the calculated pH values is ∼0.4 pH units. (H–J) iNs incubated with or without 4 µg/ml PFF for 3 days, then treated with the dextran pH sensor mixture for 2 h and a 4-h chase. Images are representative of three biological replicates. Scale bar: 10 µm. Heat map and histogram (J) as in C and G, with data from 3,497 to 2,239 spots across 10 fields from three independently differentiated iN samples. (K) Z-maximum projection from a z-stack of a 10-min time series, acquired by live-cell lattice light sheet microscopy 4 h after iNs were incubated for 2 h with a mixture of pH-sensitive pHrodo Green dextran and pH-insensitive Alexa Fluor 560 Dextran. For clarity, the red and green channels were shifted horizontally by 10 pixels. Scale bar: 5 µm. Snapshots represent images from time series acquired in seven different fields from one differentiated iN biological sample. The image highlights the presence of endolysosomes with neutral pH. Representative of two biological replicates. (L) Ratiometric fluorescence intensity plots of the endolysosomes highlighted in A, based on a 10-min 3D time series acquired using the ZEISS Lattice Light Sheet 7 microscope with a 2.6-s interval and 0.25-µm spacing between optical planes along the z-axis. Partial traces 1 and 3 illustrate examples of endolysosomes maintaining neutral pH, while trace 2 shows an endolysosome that remains acidic. Arrows indicate the acquisition times corresponding to the snapshots in J. (M) Representative image from a 3D 5-min time series of an SVG-A cell, captured by ratiometric fluorescence imaging using MOSAIC at 2-s intervals with 0.3 µm spacing between optical planes along the z-axis. The image demonstrates the absence of endolysosomes with neutral pH. Representative of three biological replicates. (N) Ratiometric fluorescence intensity plots of the endolysosomes highlighted in C, showing examples of endolysosomes maintaining constant acidic pH. Arrows indicate the acquisition times corresponding to the snapshots in L.
Live-cell imaging of iNs using lattice light sheet microscopy showed that the neutral endolysosomes maintained a neutral pH for 5–10 min. We monitored pH dynamics by measuring the ratio of fluorescence pHrodo Green and Alexa Fluor 560 Dextrans by allowing them to accumulate in endolysosomes for 6 h and then capturing whole-cell volume images at 2–2.6-s intervals. While most endolysosomes in iNs were acidic (Fig. S4 C), a subset maintained a neutral pH throughout the 5–10 min time series (examples in Fig. 4, K and L; and Fig. S4B). In control SVG-A cells, all endolysosomes remained acidic (examples in Fig. 4, M and N; and Fig. S4 D). These findings support our inference that a subset of endolysosomes in iNs is constitutively compromised.

Representative fluorescence traces of the internalized pH sensor in endolysosomes within iNs and SVG-A cells (associated with Fig. 4 ). (A) Sequential Z-maximum projections from a 3D time series of an iN cell, captured with 0.25 µm z-spacing and 2.6-s intervals using a ZEISS Lattice Lightsheet 7. The images are from a 10-min time series that began 4 h after a 2-h incubation with a Dextran mixture tagged with pHrodo Green (pH-sensitive) and Alexa Fluor 560 (pH-insensitive). For visualization, red and green channels were shifted horizontally by 10 pixels. Regions showing a red signal without green indicate neutral endolysosomes; the white arrow highlights a neutral endolysosome. The image represents two biological replicates. Scale bar: 5 µm. Data include 10-min time series from seven fields in a single differentiated iN sample. (B–D) Ratiometric fluorescence intensity plots of neutral (B) and acidic (C) endolysosomes in the somas of seven iNs, and acidic endolysosomes (D) from four SVG-A cells. iN data were acquired from 3D, 10-min time series captured every 2.6 s with 0.25 µm z-spacing, using a ZEISS Lattice Lightsheet 7. SVG-A data were acquired from 3D, 7-min time series captured every 2 s, with 0.25 µm z-spacing, using a lattice light sheet microscope modified with adaptive optics (MOSAIC). Vertical scale is logarithmic, and traces are arbitrarily aligned at t = 0 s. Shorter traces reflect incomplete tracking by the CME program.

Representative fluorescence traces of the internalized pH sensor in endolysosomes within iNs and SVG-A cells (associated with Fig. 4 ). (A) Sequential Z-maximum projections from a 3D time series of an iN cell, captured with 0.25 µm z-spacing and 2.6-s intervals using a ZEISS Lattice Lightsheet 7. The images are from a 10-min time series that began 4 h after a 2-h incubation with a Dextran mixture tagged with pHrodo Green (pH-sensitive) and Alexa Fluor 560 (pH-insensitive). For visualization, red and green channels were shifted horizontally by 10 pixels. Regions showing a red signal without green indicate neutral endolysosomes; the white arrow highlights a neutral endolysosome. The image represents two biological replicates. Scale bar: 5 µm. Data include 10-min time series from seven fields in a single differentiated iN sample. (B–D) Ratiometric fluorescence intensity plots of neutral (B) and acidic (C) endolysosomes in the somas of seven iNs, and acidic endolysosomes (D) from four SVG-A cells. iN data were acquired from 3D, 10-min time series captured every 2.6 s with 0.25 µm z-spacing, using a ZEISS Lattice Lightsheet 7. SVG-A data were acquired from 3D, 7-min time series captured every 2 s, with 0.25 µm z-spacing, using a lattice light sheet microscope modified with adaptive optics (MOSAIC). Vertical scale is logarithmic, and traces are arbitrarily aligned at t = 0 s. Shorter traces reflect incomplete tracking by the CME program.
Electron microscopic visualization of perforated limiting membranes in endosomes and lysosomes of iNs and primary neurons
To understand what type of endosomal or lysosomal opening accounts for the loss of the usual pH gradient and for the local clustering of galectin-3, we used FIB-SEM (Fig. 5; and Videos 1, 2, and 3) to volumetrically examine at ∼5 nm isotropic resolution iNs prepared by high-pressure freezing and freeze substitution, an approach that minimizes membrane perturbations (Studer et al., 2008). We could identify endosomes and lysosomes by their distinctive shape, size, and appearance. Unlike traditional single-plane imaging, our volumetric data enabled the detection of small orifices in nearly any orientation relative to the beam direction. We identified 3 early endosomes with nanoscale ruptures in the limiting membrane out of 147 early endosomes (organelles with none or few intraluminal vesicles) and 5 ruptures in 91 endolysosomes (organelles containing intraluminal vesicles alone or a mix of intraluminal membranes and membrane fragments). The ruptures varied in shape and size, measuring between 25 and 185 nm along their shortest and longest orthogonal axes, respectively (Fig. 5, A, B, and E; Fig. S5; and Videos 1 and 2). Given the 5-nm per voxel resolution of our FIB-SEM analysis, we estimate that potential perforations <20 nm (4 voxels) likely went undetected. The staining pattern at the damage sites suggested minor leakage of luminal contents into the cytosol.

Visualization by FIB-SEM of perforated endolysosomes in iNs and primary mouse neurons. (A–C) Orthogonal views, each averaged from three consecutive planes, and surface renderings of iNs visualized by FIB-SEM, acquired at 5 × 5 × 5 nm resolution. Samples were prepared by high-pressure freezing and freeze substitution. Scale bars: 200, 500, 1,000 nm. A and B show representative examples from two different iNs with perforated endolysosomes, each exhibiting a small nanopore in the limiting membrane, highlighted by the arrowheads. Data from 10 somas revealed 5 compromised endolysosomes and 3 early endosomes out of a total of 91 endolysosomes and 147 early endosomes examined. Inspection of limiting membranes in 13 endosomes from 37 volumetric cross-sections of different neurites did not reveal nanopores. C shows a representative endolysosome from parental iPSCs, intact and lacking nanopores. (D) The top three panels show single-plane views of three perforated endolysosomes, highlighted by the arrowheads, from three different mouse CA1 pyramidal neurons, prepared by chemical fixation and imaged by volumetric FIB-SEM at 5.4 × 5.4 × 16 nm resolution (Sheu et al., 2022). The bottom panel shows a zoomed-out view of the region containing the upper-left panel. Scale bars: 400, 4,000 nm. (E) Representative examples of nanopores in the limiting membranes of two endolysosomes (left and center panels) and one early endosome (right panel) from somas of three different iNs. Perforation outlines were manually traced with single pixels using LabKit, with voxel resolution of 5 nm. The longest and shortest inner dimensions of the perforations were measured in orthogonal views using FIJI. For visualization, voxels were enlarged during 3D rendering in Imaris to clearly depict the perforations.
Visualization by FIB-SEM of perforated endolysosomes in iNs and primary mouse neurons. (A–C) Orthogonal views, each averaged from three consecutive planes, and surface renderings of iNs visualized by FIB-SEM, acquired at 5 × 5 × 5 nm resolution. Samples were prepared by high-pressure freezing and freeze substitution. Scale bars: 200, 500, 1,000 nm. A and B show representative examples from two different iNs with perforated endolysosomes, each exhibiting a small nanopore in the limiting membrane, highlighted by the arrowheads. Data from 10 somas revealed 5 compromised endolysosomes and 3 early endosomes out of a total of 91 endolysosomes and 147 early endosomes examined. Inspection of limiting membranes in 13 endosomes from 37 volumetric cross-sections of different neurites did not reveal nanopores. C shows a representative endolysosome from parental iPSCs, intact and lacking nanopores. (D) The top three panels show single-plane views of three perforated endolysosomes, highlighted by the arrowheads, from three different mouse CA1 pyramidal neurons, prepared by chemical fixation and imaged by volumetric FIB-SEM at 5.4 × 5.4 × 16 nm resolution (Sheu et al., 2022). The bottom panel shows a zoomed-out view of the region containing the upper-left panel. Scale bars: 400, 4,000 nm. (E) Representative examples of nanopores in the limiting membranes of two endolysosomes (left and center panels) and one early endosome (right panel) from somas of three different iNs. Perforation outlines were manually traced with single pixels using LabKit, with voxel resolution of 5 nm. The longest and shortest inner dimensions of the perforations were measured in orthogonal views using FIJI. For visualization, voxels were enlarged during 3D rendering in Imaris to clearly depict the perforations.
Perforated endolysosome from an iN. The video starts with a series of consecutive single-plane images traversing the endolysosome depicted in Fig. 5 A, visualized using FIB-SEM, concluding with a three-dimensional surface depiction of the limiting membrane. This rendering accentuates a single perforation corresponding to a nanopore situated within the limiting membrane. Playback speed, 30 frames/second.
Perforated endolysosome from an iN. The video starts with a series of consecutive single-plane images traversing the endolysosome depicted in Fig. 5 A, visualized using FIB-SEM, concluding with a three-dimensional surface depiction of the limiting membrane. This rendering accentuates a single perforation corresponding to a nanopore situated within the limiting membrane. Playback speed, 30 frames/second.
Perforated endolysosome from an iN. The video starts with a series of consecutive single-plane images traversing the endolysosome depicted in Fig. 5 B, visualized using FIB-SEM, concluding with a three-dimensional surface depiction of the limiting membrane. This rendering accentuates a single perforation corresponding to a nanopore situated within the limiting membrane. Playback speed, 30 frames/second.
Perforated endolysosome from an iN. The video starts with a series of consecutive single-plane images traversing the endolysosome depicted in Fig. 5 B, visualized using FIB-SEM, concluding with a three-dimensional surface depiction of the limiting membrane. This rendering accentuates a single perforation corresponding to a nanopore situated within the limiting membrane. Playback speed, 30 frames/second.
Intact endolysosome from an iPSC. The video starts with a series of consecutive single-plane images traversing the endolysosome depicted in Fig. 5 C, visualized using FIB-SEM, concluding with a three-dimensional surface depiction of the limiting membrane. This rendering accentuates the absence of perforations in the limiting membrane. Playback speed, 30 frames/second.
Intact endolysosome from an iPSC. The video starts with a series of consecutive single-plane images traversing the endolysosome depicted in Fig. 5 C, visualized using FIB-SEM, concluding with a three-dimensional surface depiction of the limiting membrane. This rendering accentuates the absence of perforations in the limiting membrane. Playback speed, 30 frames/second.

Visualization of perforated endolysosomes in iNs and primary mouse neurons using FIB-SEM (associated with Fig. 5 ). (A–E) Representative examples of nanopores in the limiting membranes of (A–C) three endolysosomes (top panels) and (D and E) two early endosomes (bottom panels) within the somas of distinct iNs. Perforation boundaries were manually traced at single-pixel thickness using LabKit, with a voxel resolution of 5 nm. The longest and shortest inner dimensions of each perforation were quantified in orthogonal views using FIJI. For clarity in 3D rendering, voxel sizes were increased in Imaris to enhance the visibility of the perforations. (F) Each point in the plot represents the longest and shortest inner dimensions of individual nanopores observed in endolysosomes or early endosomes within the somas of various iNs.

Visualization of perforated endolysosomes in iNs and primary mouse neurons using FIB-SEM (associated with Fig. 5 ). (A–E) Representative examples of nanopores in the limiting membranes of (A–C) three endolysosomes (top panels) and (D and E) two early endosomes (bottom panels) within the somas of distinct iNs. Perforation boundaries were manually traced at single-pixel thickness using LabKit, with a voxel resolution of 5 nm. The longest and shortest inner dimensions of each perforation were quantified in orthogonal views using FIJI. For clarity in 3D rendering, voxel sizes were increased in Imaris to enhance the visibility of the perforations. (F) Each point in the plot represents the longest and shortest inner dimensions of individual nanopores observed in endolysosomes or early endosomes within the somas of various iNs.
In contrast, endosomes and lysosomes in parental iPSCs, as shown in Fig. 5 C and Video 3, and in non-neuronal cell lines such as SVG-A human fetal glial–derived cells, HEK293A human epithelial–derived cells, SUM159 human breast carcinoma–derived cells, BSC-1 African green monkey kidney epithelial–derived cells, U2OS human sarcoma–derived cells (Gallusser et al., 2023), and HeLa human cells (Heinrich et al., 2021) showed no such openings. Consequently, we proposed that the membrane breaches in iNs directly observed by FIB-SEM represent the endolysosomal damage and the inferred interaction between luminal contents and adjacent cytosol we postulated from optical microscopy.
We also visualized neurons in their natural environment within an adult mouse brain, focusing on the endolysosomal integrity. Specifically, hippocampal CA1 pyramidal neurons in mouse brains were chemically fixed and visualized in our laboratory with FIB-SEM imaging at a resolution of 8 × 8 × 20 nm (Fig. 5 D) (Sheu et al., 2022); we also analyzed similar images collected with 5.5 × 5.5 × 15 nm resolution at Janelia Research Campus (Sheu et al., 2022). The resulting data showed that the mouse brain neurons also contained a subset of endosomes and lysosomes with compromised limiting membranes, just as in our iN culture model. By contrast, inspection of FIB-SEM images acquired at 8 × 8 × 8 nm resolution of chemically fixed mouse liver (Parlakgül et al., 2022) and P7 mouse skin cells (OpenOrganelle, HMMI) failed to show damaged endosomes, endolysosomes, or lysosomes. Thus, there appears to be a neuron-specific propensity for perforation to develop in the endolysosomal compartment.
Pharmacological inhibition of endosomal PIKfyve kinase activity in iNs prevents PFF-mediated α-syn-YFP aggregation
The phosphoinositides PI(5)P and PI(3,5)P2, generated by the endolysosomal PIKfyve kinase, are required for efficient vesicular cargo traffic from late endosomes to lysosomes and for autophagosome maturation (Kim et al., 2014; Bissig et al., 2017; Rutherford et al., 2006; Choy et al., 2018; Sharma et al., 2019). Without these lipids, endosomes enlarge into distended, vacuole-like structures (Krishna et al., 2016; Bissig et al., 2017; Choy et al., 2018; Kang et al., 2020).
PIKfyve kinase inhibition with its inhibitors Apilimod (Cai et al., 2013) or Vacuolin-1 (Cerny et al., 2004) led to the expected enlarged endosomes in iNs (Figs. 6, 7, and 8) just as seen in non-neuronal cells (Kang et al., 2020; Cerny et al., 2004). This treatment did not hinder receptor-mediated endocytosis of transferrin-AF647 (Fig. 6, A–C; 5′ Tf pulse), fluid-phase uptake of Dextran-AF647 (Fig. 6, D–F; 3 h uptake), or PFF-AF647 internalization (Fig. 6, G–I; 3-day uptake). While iNs transiently expressing α-syn-YFP incubated for 3 days with PFFs generated PFF-mediated α-syn-YFP aggregates in endosomes and lysosomes (Fig. 7 A), the aggregates failed to form if Vacuolin-1 (Fig. 7, B and C) or Apilimod (Fig. 7, C–G) were present during PFF incubation. In contrast to iNs transiently expressing α-syn-YFP, iNs stably expressing α-syn-YFP and treated with Apilimod exhibited α-syn-YFP aggregates that did not colocalize with internalized Dextran (Fig. 7 J). Thus, while PIKfyve inhibition interfered with PFF-mediated α-syn aggregation in endolysosomes, it did not appear to affect PFF-independent α-syn aggregate formation in the cytosol (Fig. 7, H–K).

PIKfyve inhibition doesn’t affect the endocytosis of PFFs. (A–I) iNs were incubated with (A and B) 20 µg/ml Transferrin AF647 for 5 min, (C and D) 20 µg/ml Dextran-AF647 for 2 h, or (E and F) 4 µg/ml PFF-AF647 for 3 days, in the absence (A, D, and G) or presence (B, E, and H) of 100 nM Apilimod. Cells were imaged using live-cell 3D spinning-disc confocal microscopy. Maximum z-projection images are representative of three biological replicates for A and B and four biological replicates for D–H. Cells are outlined with dotted lines. Scale bar: 10 µm. Insets show a 3× magnification with a scale bar of 3.3 µm. (C, F, and I) Quantitative analysis shows that 100 nM Apilimod did not affect the uptake of Transferrin, Dextran-AF647, or PFF-AF647. Each dot represents the total relative fluorescence intensity per cell for each internalized cargo. The number of cells analyzed is indicated.
PIKfyve inhibition doesn’t affect the endocytosis of PFFs. (A–I) iNs were incubated with (A and B) 20 µg/ml Transferrin AF647 for 5 min, (C and D) 20 µg/ml Dextran-AF647 for 2 h, or (E and F) 4 µg/ml PFF-AF647 for 3 days, in the absence (A, D, and G) or presence (B, E, and H) of 100 nM Apilimod. Cells were imaged using live-cell 3D spinning-disc confocal microscopy. Maximum z-projection images are representative of three biological replicates for A and B and four biological replicates for D–H. Cells are outlined with dotted lines. Scale bar: 10 µm. Insets show a 3× magnification with a scale bar of 3.3 µm. (C, F, and I) Quantitative analysis shows that 100 nM Apilimod did not affect the uptake of Transferrin, Dextran-AF647, or PFF-AF647. Each dot represents the total relative fluorescence intensity per cell for each internalized cargo. The number of cells analyzed is indicated.

PIKfyve inhibition prevents PFF-induced α-syn aggregation. (A, B, and D–G) iNs transiently expressing α-syn-YFP were incubated for 3 days without, with 4 µg/ml PFF, and combinations of 4 µg/ml PFF with Apilimod or Vacuolin-1 at specified concentrations. The remaining images are maximum z-projections of the whole cell volume. Scale bar: 10 µm. Insets show 3× magnification, Scale bar: 3.3 µm. (C) Bar graph quantifies the fraction of cells containing α-syn-YFP aggregates; each dot represents data from a biological replicate. (H–J) iNs stably expressing α-syn-YFP were subjected to similar 3-day incubation protocols, including no treatment, exposure to 4 µg/ml PFF, and PFF combined with 100 nM Apilimod and including a 2-h pre-imaging uptake of Dextran-AF647. Scale bar: 10 µm. Insets provide 3× magnification. Scale bar: 3.3 µm. (K) Bar graph quantifies the fraction of cells containing α-syn-YFP aggregates; each dot represents data from a biological replicate.
PIKfyve inhibition prevents PFF-induced α-syn aggregation. (A, B, and D–G) iNs transiently expressing α-syn-YFP were incubated for 3 days without, with 4 µg/ml PFF, and combinations of 4 µg/ml PFF with Apilimod or Vacuolin-1 at specified concentrations. The remaining images are maximum z-projections of the whole cell volume. Scale bar: 10 µm. Insets show 3× magnification, Scale bar: 3.3 µm. (C) Bar graph quantifies the fraction of cells containing α-syn-YFP aggregates; each dot represents data from a biological replicate. (H–J) iNs stably expressing α-syn-YFP were subjected to similar 3-day incubation protocols, including no treatment, exposure to 4 µg/ml PFF, and PFF combined with 100 nM Apilimod and including a 2-h pre-imaging uptake of Dextran-AF647. Scale bar: 10 µm. Insets provide 3× magnification. Scale bar: 3.3 µm. (K) Bar graph quantifies the fraction of cells containing α-syn-YFP aggregates; each dot represents data from a biological replicate.

PIKfyve inhibition prevents the formation of neutral endolysosomes. (A–D) iNs without ectopic α-syn-YFP expression were incubated for 8 h with or without 4 µg/ml PFF, in the presence or absence of 100 nM Apilimod. Before in vivo pH imaging, cells were incubated with 20 µg/ml each of pH-sensitive pHrodo Dextran 488 and pH-insensitive Dextran Alexa Fluor 560 for 2 h, followed by a 4-h chase to label late endosomes, endolysosomes, and lysosomes. Images are representative of three biological replicates. Scale bar: 10 µm. Heat maps show pH values derived from fluorescence ratios in permeabilized iNs incubated with pH-adjusted solutions. (E) Histogram shows average pH values ± standard deviation from 8,036, 5,135, 2,382, and 2,575 Dextran-containing spots across six fields from three independent iN differentiations treated with the indicated combinations of PFF and Apilimod. (F–I) Experimental design as in A–D, except iNs were incubated with or without 4 µg/ml PFF for 3 days and 8 h, with 100 nM Apilimod added during the last 8 h. Samples were subjected to in vivo pH imaging as in A–D. Images are representative of six biological replicates for F–H and three replicates for I. Scale bar: 10 µm. Heat maps show pH values from fluorescence ratios in permeabilized iNs in pH-calibrated solutions. (J) The histogram shows average pH values ± standard deviation from 8,896, 3,838, and 271 Dextran-containing spots across six fields from three independent iN differentiations treated with the indicated combinations of PFF and Apilimod.
PIKfyve inhibition prevents the formation of neutral endolysosomes. (A–D) iNs without ectopic α-syn-YFP expression were incubated for 8 h with or without 4 µg/ml PFF, in the presence or absence of 100 nM Apilimod. Before in vivo pH imaging, cells were incubated with 20 µg/ml each of pH-sensitive pHrodo Dextran 488 and pH-insensitive Dextran Alexa Fluor 560 for 2 h, followed by a 4-h chase to label late endosomes, endolysosomes, and lysosomes. Images are representative of three biological replicates. Scale bar: 10 µm. Heat maps show pH values derived from fluorescence ratios in permeabilized iNs incubated with pH-adjusted solutions. (E) Histogram shows average pH values ± standard deviation from 8,036, 5,135, 2,382, and 2,575 Dextran-containing spots across six fields from three independent iN differentiations treated with the indicated combinations of PFF and Apilimod. (F–I) Experimental design as in A–D, except iNs were incubated with or without 4 µg/ml PFF for 3 days and 8 h, with 100 nM Apilimod added during the last 8 h. Samples were subjected to in vivo pH imaging as in A–D. Images are representative of six biological replicates for F–H and three replicates for I. Scale bar: 10 µm. Heat maps show pH values from fluorescence ratios in permeabilized iNs in pH-calibrated solutions. (J) The histogram shows average pH values ± standard deviation from 8,896, 3,838, and 271 Dextran-containing spots across six fields from three independent iN differentiations treated with the indicated combinations of PFF and Apilimod.
Aggregation of cytosolic α-syn in iNs mediated by internalized PFFs occurs in constitutively perforated endolysosomes
Since PIKfyve inhibition by Apilimod blocked PFF-mediated α-syn-YFP aggregation, we investigated whether the same treatment would decrease the proportion of perforated endolysosomes, as indicated by eGFP-galectin-3 puncta. After 3 days of Apilimod treatment, the number of eGFP-galectin-3 puncta and the number of spots per iN remained unchanged (Fig. 3, J–L). These galectin-3 puncta did not associate with the characteristic vacuolated endolysosomes typically seen upon PIKfyve inhibition, suggesting that the eGFP-galectin-3 spots labeled non-enlarged endolysosomes, potentially due to limiting membrane perforations. Another explanation is that damaged endolysosomes underwent endophagy, which does not lead to vacuolation in response to Apilimod (Sharma et al., 2019).
The lack of Apilimod’s effect on galectin-3 recruitment suggests that this form of membrane damage may not correspond to the perforations reported by pH neutralization (Rose et al., 2024). To investigate further, we used our in vivo pH imaging assay with dextran to assess the effect of PIKfyve inhibition on endolysosomes with constitutive perforations. Neutral endolysosomes were absent in iNs treated with Apilimod, regardless of PFF exposure, at a time point at which α-syn aggregates had not yet formed (Fig. 8, A–E). Apilimod treatment reduced but did not eliminate the proportion of neutral endolysosomes in iNs exposed to PFFs for 3 days, followed by an additional 8-h incubation, at a time at which α-syn aggregates formed (Fig. 8, F–J). As expected, in iNs not exposed to PFFs, 8-h Apilimod treatment eliminated neutral endolysosomes without altering the distribution of acidic pH values (Fig. 8, E and J). These findings suggest that internalized PFFs do not induce endolysosomal damage detected by galectin-3 recruitment (Fig. 3, G–I) or perforations detected as neutral endolysosomes (Fig. 4, H–J; and Fig. 8, C, E, H, and J). Instead, PIKfyve inhibition reduces the proportion of neutral endolysosomes without α-syn aggregates seeded by internalized PFFs (Fig. 8 E). This implies that α-syn aggregation, which requires exposure of internalized PFFs to cytosolic α-syn, occurs in pre-existing, constitutively perforated endolysosomes, rather than in PFF-induced damaged endolysosomes as previously described (See et al., 2021, Preprint; Dilsizoglu Senol et al., 2021; Freeman et al., 2013; Jiang et al., 2017). Our observations do not rule out the possibility that the aggregates seeded by PFFs may eventually cause further disruption of the endolysosomal limiting membrane.
Pharmacological inhibition of PIKfyve activity protects neurons from death caused by PFF-induced α-syn endolysosomal aggregation
Prolonged exposure of primary neurons (Volpicelli-Daley et al., 2011; Redmann et al., 2017) or rodent brains (Desplats et al., 2009) to PFFs is toxic and leads to neuronal cell death. Using our iN-model system, we recapitulated similar toxicity in response to prolonged incubation with PFFs. Representative images of iNs incubated with cell impermeant BOBO-3 (to detect nucleic acids in dead cells) and cell-permeant calcein AM (to detect viable cells) and the corresponding quantitative analysis (Fig. 9) showed that 10-day exposure to PFFs led to the accumulation of α-syn-YFP aggregates (Fig. 9 B) and to the progressive death of up to ∼50% of the iNs compared with only 10% of iNs not exposed to PFFs during the same period (Fig. 9, K and M). The extent of cell death was similar regardless of the absence (Fig. 9 I) or presence of stably (Fig. 9 J) or transiently (Fig. 9, K and M) expressed α-syn-YFP. We used parental iPSCs as a non-neuronal negative control, as they do not form PFF-mediated aggregates (Fig. 1, I and J); as expected, these cells also did not undergo PFF-induced cell death (Fig. 9 H).

Effect of PIKfyve inhibition on PFF-induced α-syn aggregation and neuronal death in iNs. (A–C) iNs transiently expressing α-syn-YFP were cultured for 10 days with or without 4 µg/ml PFFs, in the presence or absence of 100 nM Apilimod. PIKfyve inhibition reduced the accumulation of α-synuclein aggregates. Images are representative of two biological replicates. Scale bar: 10 µm. (D–G) iNs were grown for 10 days with or without 4 µg/ml PFFs, in the presence or absence of 100 nM Apilimod or 1 µM Vacuolin. Cells were stained with calcein AM to identify live cells and BOBO-3-iodide to label dead cells prior to imaging. Representative images from three biological replicates are shown. Scale bar: 10 µm. (H–M) Quantitative analysis of PIKfyve inhibition on PFF-induced neuronal death. Data represent imaging fields with values averaged and expressed as mean ± standard deviation. Data are based on at least two biological replicates, with each data point representing observations from 20 to 40 imaging fields, containing 10–25 iPSCs or iNs per field. Statistical significance (P < 0.0001) is indicated by a star; “ns” denotes no statistical difference. (H) Bar graph showing the fraction of live and dead iPSCs over a 10-day period with or without 4 µg/ml PFFs. Apilimod (100 nM) was administered either throughout the entire 10 days or during the last 6 days. Cells were passaged every 3 days at a 3× dilution. Aliquots were plated in 8-well glass-bottom chambers and imaged on days 6 and 10, following incubation with calcein AM and BOBO-3-iodide. (I–K) Bar graphs summarizing the fraction of live and dead iNs not expressing α-syn-YFP or those stably or transiently expressing α-syn-YFP, subjected to the same PFF and Apilimod or 1 µM Vacuolin-1 treatment as described in H. (L) Schematic representation of the experimental design and summary of results for the setup depicted in M. (M) iNs transiently expressing α-syn-YFP were treated with 100 nM Apilimod throughout the entire 10-day period or restricted to the last 2, 4, 6, or 8 days. An intermittent schedule involved alternating 2-day incubation periods with Apilimod, beginning on day 1 of the 10-day period.
Effect of PIKfyve inhibition on PFF-induced α-syn aggregation and neuronal death in iNs. (A–C) iNs transiently expressing α-syn-YFP were cultured for 10 days with or without 4 µg/ml PFFs, in the presence or absence of 100 nM Apilimod. PIKfyve inhibition reduced the accumulation of α-synuclein aggregates. Images are representative of two biological replicates. Scale bar: 10 µm. (D–G) iNs were grown for 10 days with or without 4 µg/ml PFFs, in the presence or absence of 100 nM Apilimod or 1 µM Vacuolin. Cells were stained with calcein AM to identify live cells and BOBO-3-iodide to label dead cells prior to imaging. Representative images from three biological replicates are shown. Scale bar: 10 µm. (H–M) Quantitative analysis of PIKfyve inhibition on PFF-induced neuronal death. Data represent imaging fields with values averaged and expressed as mean ± standard deviation. Data are based on at least two biological replicates, with each data point representing observations from 20 to 40 imaging fields, containing 10–25 iPSCs or iNs per field. Statistical significance (P < 0.0001) is indicated by a star; “ns” denotes no statistical difference. (H) Bar graph showing the fraction of live and dead iPSCs over a 10-day period with or without 4 µg/ml PFFs. Apilimod (100 nM) was administered either throughout the entire 10 days or during the last 6 days. Cells were passaged every 3 days at a 3× dilution. Aliquots were plated in 8-well glass-bottom chambers and imaged on days 6 and 10, following incubation with calcein AM and BOBO-3-iodide. (I–K) Bar graphs summarizing the fraction of live and dead iNs not expressing α-syn-YFP or those stably or transiently expressing α-syn-YFP, subjected to the same PFF and Apilimod or 1 µM Vacuolin-1 treatment as described in H. (L) Schematic representation of the experimental design and summary of results for the setup depicted in M. (M) iNs transiently expressing α-syn-YFP were treated with 100 nM Apilimod throughout the entire 10-day period or restricted to the last 2, 4, 6, or 8 days. An intermittent schedule involved alternating 2-day incubation periods with Apilimod, beginning on day 1 of the 10-day period.
Inhibition of PIKfyve in iNs prevented PFF-mediated cell death. Representative images show the absence of α-syn-YFP aggregates (Fig. 9 C) and significantly reduced incidence of cell death when iNs were co-incubated for 10 days with PFF and Apilimod (Fig. 9, F, I, J, and M) or PFF and Vacuolin-1 (Fig. 9, G and K). Comparable Apilimod or Vacuolin treatment of iNs during the last 6 days of PFF incubation afforded partial protection (Fig. 9, J, K, and M), but shorter Apilimod treatments in the last 2 or 4 days, or sequentially alternating 2-day treatments on days 0, 4, and 8 did not (Fig. 9, L and M). Off-target effects of Apilimod or Vacuolin-1 were unlikely as Apilimod inhibited more strongly than Vacuolin-1, consistent with their relative inhibitory potencies for PIKfyve enzymatic activity in vitro (Sano et al., 2016; Cai et al., 2014) and for the infectivity of PIKfyve-kinase dependent Zaire Ebola virus or SARS-CoV-2 infectivity in vivo (Kant et al., 2023, Preprint; Kang et al., 2020). We conclude that pharmacological inhibition of PIKfyve by Apilimod or Vacuolin-1 protects iNs from cell death by preventing endolysosomal damage rather than by directly reversing α-syn toxicity.
Discussion
The most striking finding from the results presented here is the detection of a subset of constitutively leaky late endosomes and lysosomes in the soma of human iNs and pyramidal neurons of the mouse brain due to nanoscale perforation of their limiting membranes. These membranes in non-neuronal cells are all completely intact, as shown by many previous studies (Vest et al., 2022; Burbidge et al., 2022; Chou et al., 2023, Preprint) as well as by the results from the experiments described here.
We have visualized the nanoscale perforations directly by volumetric FIB-SEM and indirectly by single time point live-cell spinning-disc or 3D live-cell time series lattice light sheet fluorescence microscopy using probes for endolysosomal pH as the lumen of endolysosomes will approach neutrality in the case of a perforated limiting membrane. We have detected endolysosomal perforations by monitoring the recruitment of cytosolic, soluble eGFP-galectin-3. We found galectin fluorescent spots in iNs, as others have done in iNs (Eapen et al., 2021) and more recently in human primary astrocytes (Rose et al., 2024), but very rarely in non-neuronal cells such as iPSCs and SVG-A cells, in accord with published reports on HEK293 cells (Chen et al., 2014) and fibroblasts (Vest et al., 2022). Moreover, work on human tNeurons transdifferentiated from primary fibroblasts and immunostained for endogenous galectin-3 found galectin spots in the tNeurons but not in the parental fibroblasts (Chou et al., 2023, Preprint). A similar pattern of galectin spots was seen in neurites from mouse hippocampal neurons transduced to express mCherry-galectin-3 (Polanco et al., 2021) but not in analogous primary neurons also expressing mCherry-galectin-3 (Calafate et al., 2016). Failure to find galectin-3 spots in neuroblastoma-derived SH-SHY cells (Freeman et al., 2013; Burbidge et al., 2022; Flavin et al., 2017) could have been caused by incomplete differentiation at the time of imaging possibly due to the use of a suboptimal medium (Shipley et al., 2016). Although some of the galectin fluorescence we detected could have come from the accumulation of re-internalized galectins secreted into the medium (Eapen et al., 2021), we believe that this potential additional source of fluorescent signal does not confound our conclusions because they do not appear in non-expressor neighboring iNs.
The experiments here do not define the lifetime of the nanopores we detect (though they last at least 10 min, the longest duration of our lattice light sheet microscopy time series) nor do they show whether only a specific endolysosomal subset can perforate, or whether any late endosome or lysosome can acquire a potentially transient but long-lasting leak.
Cells ordinarily avoid toxicity due to leakage from transient damage to the limiting membrane of compartments in the endolysosomal pathway by engaging the ESCRT-III–mediated membrane repair mechanism (Skowyra et al., 2018; Jia et al., 2020; Radulovic et al., 2018). It remains to be established whether the constitutive damaged endolysosomes exist because repair is deficient in neurons. When extensive, the damage triggers sequestration of the affected organelles within autophagosomes, which are taken up and degraded by intact lysosomes, through a process termed “lysophagy” (Papadopoulos et al., 2017; Maejima et al., 2013). Sporadic instances of lysosomal damage occur in special circumstances, such as xenophagy—the selective degradation of damaged, bacteria-containing vacuoles or phagosomes (Mazin et al., 1987; Boyle and Randow, 2013). Similar processes have been detected in tissue samples from individuals with specific diseases—e.g., hyperuricemic nephropathy (Maejima et al., 2013; Emmerson et al., 1990) and inclusion body myopathy associated with frontotemporal dementia (Papadopoulos et al., 2017).
A second general finding from our work is that internalized α-syn PFFs remained in late endosomes and lysosomes and that the aggregation of host α-syn and the accompanying toxicity is likewise in close association with these subcellular compartments. The early induction of PFF-mediated aggregates in iNs agrees with similar previous observations obtained by incubation with PFFs of CAD cells from a transgenic mouse model (Dilsizoglu Senol et al., 2021) and mouse brain primary neurons cells (Vasili et al., 2022), and to a lesser extent in HEK293 cells (Vasili et al., 2022). These aggregates appeared in late endosomes and lysosomes, as previously shown in CAD cells (Dilsizoglu Senol et al., 2021), and even in HeLa cells when incubated with higher concentrations of α-syn PFFs (Kakuda et al., 2024). Published accounts of PFF-induced α-syn aggregates within lysosomes associated with their damage include colocalization of ectopically expressed mCherry-galectin-3 in neuroblastoma-derived SH-SY5Y cells, human dopaminergic neurons differentiated from human induced pluripotent stem cells, rat dopaminergic–derived N27 cells, and CAD cells (Burbidge et al., 2022; Flavin et al., 2017; Freeman et al., 2013). In the absence of α-syn PFFs in the medium, diffuse galectin-3 distribution in (presumably poorly differentiated—see above) neuroblastoma-derived SH-SY5Y cells (Burbidge et al., 2022; Flavin et al., 2017; Freeman et al., 2013) or in cells of essentially non-neuronal character like neuroglioma-derived H4/V1S-SV2 cells (Jiang et al., 2017) and CAD cells (Dilsizoglu Senol et al., 2021) is consistent with the absence of leaky endolysosomes.
In their recent study, Rose and collaborators distinguished between lysosomal rupture, indicated by galectin recruitment, and nanoscale membrane perforations, marked by acidification loss and ESCRT protein recruitment for membrane repair, in response to tau PFFs in human primary astrocytes and hippocampal neurons (Rose et al., 2024). Consistent with our observations with α-syn, they found that while lysosomal rupture was already evident before tau fibril incubation, internalized tau fibrils induced nanoscale perforations without additional lysosomal rupture during tau-PFF-mediated aggregation.
PFF-mediated α-syn aggregation throughout the cytosol occurs in cells, regardless of their origin, following the introduction of PFFs (or other protein aggregates such as tau fibrils) by transfection with lipofectamine (Trinkaus et al., 2021; Chen et al., 2019). This distinction between distributed aggregation induced by transfection and late endosomal or lysosomal aggregation induced by PFFs internalized from the medium is important for understanding how such structures form and analyzing their consequences for cell physiology and cell viability. We have found spontaneous cytosolic α-syn aggregation in iNs stably expressing α-syn-YFP, even in the absence of PFFs in the medium, but not in the parental iPSCs or neuroglioma-derived SVG-A cells. These aggregates appear to be non-toxic, however, because the PFF-induced aggregation within leaky late endosomes and lysosomes is toxic but spontaneous aggregation is not. We cannot at present provide an explanation for this distinction. Because cells (e.g., iNs, primary neurons) with constitutively leaky endosomes and lysosomes are healthy in the absence of endocytosed PFFs, any toxic stress signal from those endolysosomes must be specific for those that contain the PFF-induced α-syn aggregates.
A third important finding is that inhibition of PIKfyve kinase by Apilimod or Vacuolin-1 prevented PFF-induced endolysosomal α-syn aggregation, even though we showed that the PFFs had reached these subcellular compartments. These compounds also prevented PFF-induced toxicity in iNs, although not if introduced after the onset of aggregation. They cause endosomes and lysosomes to swell into spherical, vacuole-like, compartments and interfere with proper endolysosomal traffic. A proposed mechanism by which inhibition of PIKfyve stimulates exocytosis and clearance into the medium of PFF-induced aggregates (Hung et al., 2023; Lee et al., 2013) appears to be inconsistent with our observation that incubating with Apilimod intermittently or during the last 2–4 days after initiation of the 10-day incubation period with PFFs failed to alleviate toxicity. We suggest instead that an important effect of inhibiting PIKfyve is to prevent endolysosomal damage while allowing clearance of the organelles already damaged before adding the drug. This suggestion is consistent with the marked reduction in the number of constitutively leaky endolysosomes probed with the internalized dextran pH-sensitive sensor in iNs treated with Apilimod (or Vacuolin-1), even in the absence of PFF added to the medium.
A potential alternative protective mechanism through PIKfyve inhibition may involve promoting lysosomal resilience (Chen et al., 2024), thereby reducing endolysosomal damage and limiting α-syn PFF-mediated aggregation. PIKfyve inhibition could activate the cation channel TRPML1, leading to the recruitment of ALG-2, a Ca2+ sensor that engages ESCRT machinery to protect lysosomes from rupture (Hou et al., 2023).
Why do neurons have a subset of what appear to be constitutively leaky endolysosomes? One possibility is that their luminal content is viscous, and while escaping to the cytosol, it behaves as a local physical barrier to prevent the resealing of the damaged membrane. A second possibility is simply inefficiency in the membrane damage repair mechanism, which could also provide a functional signal to accelerate autophagic recycling in these cells, which cannot dilute toxic content by cell division. Although delineating the complexities of this phenomenon is beyond the scope of the current study, we suggest that the constitutively perforated endolysosomal membranes detected in neurons could facilitate cytosolic access of endocytosed neurotoxic aggregates, including—in addition to α-syn—Huntingtin, Aβ, and tau. Substantiating this connection could advance understanding of the pathologies caused by these aggregates. Moreover, preventing endolysosomal damage and hence toxicity by inhibiting PIKfyve suggests a potential avenue for therapeutic intervention.
Materials and methods
Plasmids
Dr. Ulf Dettmer (Brigham and Women’s Hospital, Boston, MA, USA) provided the wild-type α-syn-eYFP/pCDNA3.1 construct, which we subcloned into the pENTR/TOPO vector (K240020; Thermo Fisher Scientific) through TOPO cloning; we then transferred the construct into the pLX301 lentiviral vector via Gateway LR Clonase cloning according to the supplier’s guidelines (11791100; Thermo Fisher Scientific). eGFP-galectin-3 was obtained from Addgene (pEGFP-hGal3, 73080; Addgene) and wild-type α-syn/pET21a also from Addgene (51486; Addgene; courtesy of the Michael J. Fox Foundation).
Inhibitors
Vacuolin-1 (Cerny et al., 2004) was custom synthesized; Apilimod (HY-14644) was purchased from MedChem Express; and protease and phosphatase inhibitors were purchased from Thermo Fisher Scientific, 78440.
Cells
SVG-A cells were purchased from ATCC (8621; CRL) and cultured in MEM media (10-009-CV; Corning) supplemented with 10% FBS (S11150H; Atlanta Biologicals). BR33 iPSCs, as previously described (Paull et al., 2015; Lagomarsino et al., 2021), were kindly provided by Dr. Tracy Young-Pearse (Brigham and Women’s Hospital, Boston, MA, USA). We cultured these cells in StemFlex media (A33493; Life Technologies). For plating iPSCs and iNs, tissue culture plates were coated with Growth Factor Reduced Matrigel (354320; Corning) or Matrigel (354234; Corning), respectively, according to the following protocol: 0.5 mg of Matrigel was resuspended in 5 ml cold DMEM/F12 media and filtered through a 40-μm cell strainer (352340; Corning). 6 ml Matrigel was used to coat a 10-cm tissue culture plate such that the final concentration of Matrigel was ∼8.7 μg/cm2.
For differentiation to iNs, we plated the iPSCs at a density of 100,000 cells/cm3 and co-transduced them with lentiviruses carrying pTet-O-NGN2-puro and Fudelta GW-rtTA plasmids, following the methodology outlined by Zhang et al. (2013). After 2 days of transduction, we continued to culture and expand the cells for an additional 7 days prior to cryopreserving them for future use.
We initiated differentiation by seeding thawed iPSCs on Matrigel-coated 10-cm plates at a density of 2 × 10⁶ cells using StemFlex media supplemented with 10 μM rho-associated, coiled-coil containing protein kinase (ROCK) inhibitor (72304; Stemcell Technologies). We cultured the cells to 75% confluence. On day 1, we replaced the medium with KnockOut media (10829.018; Gibco) enriched with KSR (KnockOut Serum Replacement, 10928-028; Invitrogen), 1% MEM non-essential amino acids (11140050; Thermo Fisher Scientific), 1% GlutaMAX (35050061; Thermo Fisher Scientific), 0.1% β-mercaptoethanol (BME) (21985-023; Invitrogen), and 2 μg/ml doxycycline (D9891; Sigma-Aldrich) to induce NGN2 expression. On day 2, we changed the medium to a 1:1 mixture of KSR and N2B medium (DMEM F12, 11320033; Thermo Fisher Scientific, with 1% GlutaMAX, 3% dextrose, N2-Supplement B, 07156; StemCell Technologies) supplemented with 5 μg/ml puromycin (A11138-03; Life Technologies) and 2 μg/ml doxycycline. On day 3, we replaced the medium with N2B media supplemented with B27 (1:100; 17504-044; Life Technologies), 5 μg/ml puromycin, and 2 μg/ml doxycycline. On day 4, we froze the differentiated iNs in Neurobasal media (21103-049; Gibco) supplemented with B27 (1:50), 10 ng/ml brain-derived neurotrophic factor (BDNF) (450-02; Peprotech), 10 ng/ml ciliary neurotrophic factor (CNTF) (450-13; Peprotech), 10 ng/ml glial cell line-derived neurotrophic factor (GDNF) (450-10; Peprotech), 10 μM ROCK inhibitor, 5 μg/ml puromycin, and 2 μg/ml doxycycline, termed NBM medium, with 10% DMSO. We conducted experiments on iNs between days 12–21 after thaw, culturing them in NBM.
Hippocampal neurons were isolated from embryonic day 18.5 (E18.5) rat embryos as previously described (Nie and Sahin, 2011). About 20,000 neurons were plated in an 8-well chamber and used for imaging experiments after about 14 days of maintenance in a neurobasal medium.
Lentivirus preparation and transduction
We seeded HEK293T cells at 2.5 × 10⁶ cells per 15-cm plate in DMEM (11965118; Thermo Fisher Scientific), supplemented with 10% FBS (S11150H; Atlanta Biologicals), 1X GlutaMAX (35050061; Thermo Fisher Scientific), 1X sodium pyruvate (11360070; Thermo Fisher Scientific), and 1X MEM non-essential amino acids (11140050; Thermo Fisher Scientific) to prepare HEKT media. On the next day, we transfected the cells with eGFP-galectin-3, and wild-type α-syn-eYFP/pLX301 plasmids using Lipofectamine 2000, following the manufacturer’s instructions (12566014; Thermo Fisher Scientific).
For the transfection, we mixed 24 μg of each lentiviral plasmid, 18 μg of psPAX2 gag/pol packaging plasmid (12260; Addgene), and 12 μg of pMD2.G Vesicular stomatitis virus G protein (VSV-G) envelope plasmid (12259; Addgene) with 135 μl of Lipofectamine in 6.75 ml of OptiMEM media (51985091; Thermo Fisher Scientific). After a 20-min room temperature incubation, we applied the transfection mixture dropwise to the HEK293T cells plated on 15-cm tissue culture dishes bathed with 14 ml of HEKT medium. Following a 6-h incubation, we replenished with 14 ml of HEKT media and again after another 12 h. We collected the virus-containing medium 8 h later, centrifuged it at 500 × g for 5 min at 4°C to clear debris, and stored the supernatant in 1 ml aliquots at −80°C after flash-freezing in liquid nitrogen.
For transduction, we added 1 ml of the thawed virus-containing supernatant to iPSCs or SVG-A cells (∼8 × 10⁵), seeded 18 h prior in a 6-well plate with 1 ml of mTESR1 (85850; StemCell Technologies) or MEM medium, respectively. We replaced the media with StemFlex media (for iPSC) or MEM media (for SVG-A) 12 h after transduction and added either 5 μg/ml Blasticidin or 5 μg/ml Puromycin (depending on the plasmid used), then cultured the cells for an additional 4 days. The surviving cells were grown in the same medium lacking antibiotics for seven more days, after which the cells in the same medium supplemented with 10% DMSO were frozen overnight at −80°C using a Nalgene Mr. Frosty freezing container and then kept in liquid nitrogen until future use.
Transfection of iNs
We thawed and plated 40,000 iNs into each well of an 8-chamber slide (C8-1.5H-N; Cellvis). We then transfected them using Viafect (E4981; Promega), adhering to the manufacturer’s instructions. For the transfection, we combined 0.2 μg of either α-syn-eYFP/pCDNA3.1 or pEGFP-Gal3 plasmids with 0.6 μl of Viafect reagent and 100 μl of OptiMEM. This mixture was incubated at 37°C for 20 min before being applied dropwise to the iNs bathed with 200 μl NBM media. After 24 h, we replaced the cultures with 200 μl fresh NBM media. We conducted most experiments on these cells within 18–21 days after differentiation; some experiments were started on day 11.
Preparation of α-syn PFFs
BL21(DE3) E. coli (C2527H; New England Biolabs) were transformed with wild-type α-syn/pET21a. Single colonies were selected and inoculated in Luria Broth containing 100 μg/ml ampicillin (P212121 GB-A-301-25). At an optical density (OD600) of ∼0.5, we induced protein expression with 1 μM isopropyl 1-thio-β-d-galactopyranoside (6758; Sigma-Aldrich) for 4 h. After induction, the cells were harvested and the pellet was resuspended in 5 ml of 20 mM Tris pH 8.0, 25 mM NaCl, followed by lysis via boiling for 15 min. The lysate was centrifuged at 20,000 × g for 20 min at 4°C. The supernatant was then applied to two tandem 5-ml HiTrap Q HP anion exchange columns (GE Healthcare) pre-equilibrated with 20 mM Tris pH 8.0, and 25 mM NaCl. α-Syn was eluted using a linear gradient of 25–1,000 mM NaCl in 20 mM Tris pH 8.0. Fractions containing α-syn were pooled and further purified by size-exclusion chromatography using a HiPrep Sephacryl S-200 HR 16/60 gel filtration column (GE Healthcare) in 50 mM NH4Ac pH 7.4. Peak fractions were collected, aliquoted into 20 μl volumes, lyophilized using a FreeZone −84°C lyophilizer (Labconco), and stored at −80°C. Before use, aliquots were reconstituted by adding 5 μl of 10 mM NH4Ac pH 7.4.
We used the following protocol to generate PFFs: five reconstituted aliquots were combined and centrifuged at 21,130 × g for 20 min at 4°C. The supernatant was transferred to a 1.5-ml Eppendorf tube and 70–100 μl of 1X PBS was added to achieve a final protein concentration of 5 mg/ml, determined by a BCA protein assay (A55864; Thermo Fisher Scientific). After briefly vortexing the sample for 3 s at high speed, it was placed on an orbital shaker set at 1,000 RPM and 37°C for 7 days. The resultant PFFs were then placed in an ice bath and sonicated for 60 cycles (0.5 s on, 0.5 s off) at 10% amplitude using a QSonica XL-2000 sonicator with a 1/8” tip immersed in the solution. The PFFs were aliquoted into 5 μl volumes, flash-frozen in liquid nitrogen, and stored at −80°C until use.
We prepared 4-mM stock solutions of Alexa 647 dye (A33084; Thermo Fisher Scientific) by dissolving 1 mg in milliQ water, aliquoting into 10 μl volumes, drying using a SpeedVac (Savant), and storing at −80°C. To fluorescently label PFFs, we thawed an aliquot, adjusted the protein concentration to 0.5 mg/ml by adding 85 mM NaH2CO3 (pH ∼8.3), and incubated it in the dark at room temperature for 1 h with Alexa 647 at a final concentration of 0.05 mg/ml. To remove the unbound dye, we used a Zeba 7K MWCO spin desalting column (89882; Thermo Fisher Scientific). The labeled protein was aliquoted into 5 μl volumes, flash-frozen in liquid nitrogen, and stored at −80°C.
Western blot analysis
Cells were cultured in 6-well plates to reach ∼1 × 10⁶ cells at the time of processing. Lysis was performed in 100 µl radioimmunoprecipitation assay buffer supplemented with protease and phosphatase inhibitors (78440; Thermo Fisher Scientific), followed by centrifugation at 9,000 × g for 10 min at 4°C. A 12-µl aliquot of the supernatant was combined with 4 µl of 4X loading dye, heated to 95–100°C for 10 min, and analyzed by SDS-PAGE. Proteins were transferred onto a polyvinylidene difluoride (PVDF) membrane (IB23001; Thermo Fisher Scientific) using the iBlot2 system (IB21001, program P0; Thermo Fisher Scientific). The membrane was blocked at room temperature for 1 h in 5% skim milk in TBS with 0.05% Tween-20 (TBS-T) and incubated overnight at 4°C with primary antibodies: anti-Galectin-3 (mouse; 126701; BioLegend) and anti-actin (rabbit; 8457; Cell Signaling Technology) at 1:1,000 dilution in 5% BSA in TBS-T. After TBS-T washes, the membrane was incubated for 1 h at room temperature with an Alexa Fluor Plus 555–conjugated secondary antibody (goat anti-mouse; A32727; Thermo Fisher Scientific, goat anti-rabbit; A11037; Thermo Fisher Scientific). Imaging was performed using an Amersham ImageQuant system (Cytiva) with a protein ladder (26616; Thermo Fisher Scientific) for calibration.
Immunofluorescence
Cells plated on coverslips were rinsed with 1X PBS and fixed with 4% (wt/vol) paraformaldehyde for 30 min at room temperature. After discarding the fixative, the cells were permeabilized with 0.1% (vol/vol) Triton X-100 in 1X PBS for 5 min at room temperature, followed by blocking with 5% (vol/vol) BSA in 1X PBS for 30 min. The cells were then incubated with primary antibodies, including MAP2 (1:1,000; rabbit; ab32454; Abcam), LAMP1 (1:500; mouse; ab25630; Abcam), EEA1 (1:200; goat; sc-6415; Santa Cruz), or galectin-3 (1:200; rat; 125401; Biolegend), and diluted in 1X PBS for 1 h at room temperature. After three washes with 1X PBS (10 min each), the cells were incubated with Alexa Fluor–conjugated secondary antibodies (goat anti-rabbit; A11008; Thermo Fisher Scientific, goat anti-mouse; A11004; Thermo Fisher Scientific, donkey anti-goat; A11057; Thermo Fisher Scientific, goat anti-rat; A11006; Thermo Fisher Scientific) for 1 h at room temperature, followed by three additional 10-min washes with 1X PBS. Imaging was performed immediately in 1X PBS using spinning disk confocal microscopy, or the cells were stored at 4°C in 1X PBS for imaging the next day.
pH calibration
Endosomal and lysosomal pH was estimated using pH calibration curves as described by Steinberg et al. (2010); Leung et al. (2019). Briefly, iNs or iPSCs were incubated for 2 h with 20 μg/ml each of pHrodo Green-Dextran and Dextran-AF647. After three washes with 1X PBS, cells were incubated for 15 min at room temperature with universal buffer (10 mM HEPES, 10 mM MES, 10 mM sodium acetate, 140 mM KCl, 5 mM NaCl, and 1 mM MgCl2), containing 10 μM each of Nigericin (11437; Cayman Chemicals) and Monensin (16488; Cayman Chemicals). The universal buffer was titrated to different pH values (4.4, 4.8, 5.2, 5.8, 6.0, 6.4, 6.8, 7.2, and 7.4). Each pH condition was subjected to volumetric imaging of two biological replicates using spinning-disc confocal microscopy, followed by calculation of the mean and standard deviation of the ratio values for each pH. Ratiometric quantification was performed as detailed in the Image analysis section. Calibration curves were generated using GraphPad Prism 10.0 by fitting a sigmoidal dose-response function to the mean of the ratio distribution. The error of the calibration curve (i.e., the error of the calculated pH) was estimated for each ratio value by calculating the difference between the values of the sigmoidal dose-response function fitted to the mean +standard deviation and the mean −standard deviation.
In vivo pH imaging
The pH of endosomes and lysosomes, determined at a single time point, was estimated by incubating cells at 37°C for the indicated durations with 20 μg/ml each of Dextran tagged with pHrodo Green (a pH-sensitive fluorophore with a pKa of ∼6.8, suited for quantifying pH in the neutral range) and Dextran tagged with the pH-insensitive Alexa Fluor 560 (for content normalization). After incubation, iNs or iPSCs were washed three times with 1X PBS and transferred to phenol red-free Neurobasal medium supplemented with 1% B-27, 10 ng/ml BDNF, 10 ng/ml CNTF, and 10 ng/ml GDNF, or Fluorobrite, respectively. Ratiometric imaging was performed at 37°C using spinning-disc confocal microscopy, with three biological replicates per condition, capturing the whole cell volume.
The time dependence of endosomal and lysosomal pH was monitored using ratiometric fluorescence analysis from a 3D time series obtained by lattice light sheet microscopy. iNs were incubated at 37°C for 2 h with 20 μg/ml each of dextran tagged with pHrodo Green and Dextran Alexa Fluor 647, washed three times with 1X PBS, and transferred to phenol red-free Neurobasal medium supplemented with 1% B-27, 10 ng/ml BDNF, 10 ng/ml CNTF, and 10 ng/ml GDNF. Ratiometric imaging was performed 4 h later at 37°C, capturing the whole cell volume at 2.6-s intervals using the Zeiss Lightsheet 7 microscope (Zeiss). For SVG-A cells, incubation with the same Dextran mixture was performed at 37°C for 2 h, followed by three PBS washes and transfer to Fluorobrite medium supplemented with 10% FBS and 25 mM HEPES pH 7.4. Ratiometric imaging was performed immediately, capturing the whole cell volume at 2-s intervals at 37°C using the AO-LLSM/MOSAIC.
Cell survival assay
We determined the proportion of live and dead iNs by plating ∼40,000 cells on Matrigel-coated 8-chamber glass slides (C8-1.5H-N; Cellvis) and culturing them for 11 days after differentiation, followed by incubation with or without Apilimod and PFF for up to 10 days. At the end of this step, cells in 50 μl of imaging media (phenol red-free Neurobasal medium supplemented with 1% B-27, 10 ng/ml BDNF, 10 ng/ml CNTF, and 10 ng/ml GDNF) were incubated for 15 min at room temperature with 50 μl of 2x stock solution of the LIVE/DEAD Cell Imaging Kit 488/570 (R37601; Thermo Fisher Scientific) containing Calcein AM for live cell staining and BOBO-3 Iodide for dead cell staining. Following incubation, spinning-disc confocal imaging at 40× magnification was performed, and the live and dead cells were counted.
To determine the proportion of live and dead iPSCs, we plated 10,000 cells at ∼10% confluency on Matrigel-coated 8-chamber glass slides (C8-1.5H-N; Cellvis) and cultured them for 3 days until reaching ∼90% confluency. Cells were then resuspended, counted, and replated at ∼10% confluency. This process was repeated on days 6 and 10. On day 10, the proportion of live and dead cells was determined. Cells were cultured either alone or in the presence of Apilimod and PFF.
Spinning-disc confocal imaging
We plated 40,000 cells per well on an 8-chamber slide (C8-1.5H-N; Cellvis) pre-coated with Matrigel for iNs (cultured for up to 21 days before imaging) or GFR Matrigel for iPSCs (cultured overnight before imaging). For iNs, phenol red-free Neurobasal medium (12348017; Thermo Fisher Scientific) supplemented with 1% B-27, 10 ng/ml BDNF, 10 ng/ml CNTF, and 10 ng/ml GDNF was used as the imaging medium. SVG-A cells were plated in chambers without Matrigel and, along with iPSCs, imaged in Fluorobrite medium supplemented with 10% FBS and 25 mM HEPES pH 7.4. Live cell imaging was performed within a temperature-controlled, humidified chamber with 5% CO2 at 37°C, while fixed samples were imaged at room temperature.
Images were acquired using spinning-disc confocal microscopy controlled by Slidebook 6.4 software (3I) with the following microscope configurations:
- (a)
For earlier live-cell imaging experiments, we used a Marianas system (Intelligent Imaging Innovation) consisting of a Zeiss Axio Observer Z1 microscope (Carl Zeiss) equipped with an additional 1.2× magnification lens, using 20× (NA 0.5), 40× (NA 0.75), and 63× (NA 1.4) Apochromat objectives (Carl Zeiss), a CSU-XI spinning-disc unit (Yokogawa Electric Corporation), a heated stage (20/20 Technology), and a spherical aberration correction system (Infinity Photo-Optical). Excitation was provided by solid-state lasers at 405, 488, 561, and 640 nm (100 mW; Coherent Inc.) modulated by an acoustic-optical tunable filter and linked to the spinning disc via a single-mode fiber optic. Z-stacks were acquired at 270-nm intervals with 20–100 ms exposures using an air-cooled QuantEM 512SC CCD camera (Photometrics).
- (b)
For later live-cell imaging experiments, we upgraded the Marianas system, equipped with an additional 1.2× magnification lens, a heating stage (OKO Lab), the same CSU-XI spinning-disc unit (Yokogawa Electric Corporation), a 3I spherical aberration correction system, and a LaserStack (3I) with diode lasers at 405 nm (140 mW), 488 and 560 nm (150 mW), and 640 nm (100 mW). Z-stacks were acquired at 270-nm intervals with 10-ms exposures using a sCMOS camera (Prim 95B; Teledyne Photometrics).
- (c)
A second Marianas system, used for imaging chemically fixed cells at room temperature, was based on a Zeiss Axio Invert 200 M microscope (Carl Zeiss) equipped with an additional 2× magnification lens, using a 63× Plan-Apochromat objective (NA 1.4; Carl Zeiss), a CSU-22 spinning-disc unit (Yokogawa Electric Corporation), and a heating stage (OKO Lab). Excitation was provided by solid-state lasers operating at 491, 561, and 660 nm. Z-stacks were acquired at 270-nm intervals with exposure times between 50 and 100 ms using an air-cooled QuantEM 512SC CCD camera (Photometrics).
Lattice light sheet microscopy
Live-cell 3D z-stack time series were acquired using either a home-built lattice light-sheet microscope with adaptive optics (AO/LLSM) also referred to as MOSAIC (Multimodal Optical Scope with Adaptive Imaging Correction) or a commercial version (ZEISS Lattice Lightsheet 7 microscope [Zeiss]).
For live-cell volumetric imaging, single time points were acquired at 2-s intervals for SVG-A cells using MOSAIC or at 2.6-s intervals for iNs using ZEISS Lattice Lightsheet 7, with total imaging times of 5 and 10 min, respectively. Sequential images were captured with 0.25-μm spacing between planes along the z-axis, with each time point consisting of a z-stack of 80 or 160 planes.
For MOSAIC, samples were illuminated with a dithered multi-Bessel lattice light-sheet using an annular mask with inner and outer numerical apertures (NA) of 0.50 and 0.55, respectively. Lasers emitting at 488 or 560 nm (MPB Communications Inc.) were used for illumination. A 0.65 NA objective (Special Optics) and a 1.0 NA objective (Zeiss) were used for illumination and detection, respectively, with sCMOS cameras (Hamamatsu ORCA Flash 4.0 v3) providing a resolution of 0.104 × 0.104 μm/pixel in xy for data visualization. Exposure times were 10 ms for 488 nm (pHrodo Green) and 8 ms for 560 nm (Dextran-AF560).
For ZEISS Lattice Lightsheet 7, samples were illuminated with a dithered lattice light-sheet measuring 15 μm × 0.55 μm. Lasers emitting at 488 or 560 nm were used for illumination. A 0.4 NA and a 1.0 NA objective were used for illumination and detection, respectively, with sCMOS cameras (Hamamatsu ORCA-Fusion), providing a resolution of 0.145 × 0.145 μm/pixel in xy for data visualization. Exposure times were 10 ms for both 488 nm (pHrodo Green) and 560 nm (Dextran AF560).
Image analysis
Data for determining colocalization and ratios between fluorescence signals of α-syn-YFP aggregates, eGFP-galectin-3, pH-sensitive Dextran pHrodo Green 488, pH-insensitive Dextran-AF560, and antibodies specific for EEA1 or LAMP1 were obtained using 3D spinning-disc confocal microscopy. Similarly, data for assessing the uptake of Transferrin AF647, PFF-AF647, and Dextran-AF647 was acquired using live 3D spinning-disc confocal microscopy.
Automation for data extraction and analysis (colocalization, ratio, and uptake) was facilitated using a combination of FIJI macros, MATLAB, and Python scripts, which are available upon request.
Colocalization of fluorescence signals in all experiments conducted without Apilimod treatment followed this procedure:
- (a)
Pixels above the background were identified and a 3D binary mask (0–1 values) was generated using 3D CME Analysis software (Aguet et al., 2016) with the z-axis transformed into time.
- (b)
The time axis was then converted back into the z-axis, and the binary image was rescaled to 0–255 values using the segmentation function in Fiji’s 3D suite (Ollion et al., 2013).
- (c)
Consecutive binary masks along the z-axis were linked to create 3D binary objects using the segmentation function’s labeling feature.
- (d)
The logical intersection between each 3D binary mask in one channel and the adjacent 3D binary mask in the second channel was calculated using multiplication in Fiji.
- (e)
For each object and channel, colocalization was determined by calculating the ratio between the integrated binary values within the logical intersection and the 3D binary object. Objects were considered colocalized if they had 50% or more volumetric overlap.
The ratio of fluorescence signals between the pH-sensitive Dextran pHrodo Green 488 and the pH-insensitive Dextran-AF560 was calculated both in the presence and absence of Apilimod:
- (f)
In the absence of Apilimod, the 3D binary mask for Dextran-AF560 objects was calculated following step (a).
- (g)
In the presence of Apilimod, the 3D binary mask was generated LabKit (Arzt et al., 2022) since the enlarged endosomes and lysosomes induced by Apilimod were not properly detected by 3D CME.
- (h)
The integrated fluorescence intensity for each object in the 3D binary masks was quantified using Fiji’s “quantify 3D” feature, after correcting for the global background.
- (i)
The ratio of integrated fluorescence intensities between the pH-sensitive and pH-insensitive Dextran was calculated.
- (j)
This ratio was converted to pH using a calibration curve and data were presented as a frequency distribution of pH per object, with bin sizes of 0.5 pH units.
Ratiometric fluorescence intensity traces of endolysosomes were obtained by creating a maximum Z-projection time series from 3D volumetric lattice light sheet images. Objects were identified as described in step (a), but in 2D, using 2D CME Analysis software (Mettlen and Danuser, 2014). A 4 × 4 pixel box centered on the x,y coordinates of the identified objects were generated for each time point, and the integrated fluorescence intensity within the box was calculated for both channels (pH-sensitive Dextran pHrodo Green 488 and pH-insensitive Dextran-AF560). These values were corrected for background, and the ratio of fluorescence signals from the pH-sensitive and pH-insensitive dextrans was calculated.
Endocytic uptake of molecules of interest was determined by calculating the integrated fluorescence intensity per object following step (h) and using the 3D binary mask generated as described in steps (a–c) without Apilimod or (f, b, c) with Apilimod.
- (k)
Total uptake at each time point was estimated by summing all integrated fluorescence intensities within a given 3D z-stack.
High-pressure freeze substitution
We plated ∼200,000 cells on each of the six 0.1-mm sapphire disks (616-100; Technotrade International) coated with Matrigel for iNs and GFR Matrigel for iPSCs. The disks were placed in a 24-well dish containing 0.3 ml of the appropriate medium, and the cells were cultured for 14 days for iNs and overnight for iPSCs at 37°C with 5% CO2. Cell viability, including cell spread and shape, was confirmed using phase-contrast microscopy. The sapphire disks, with cells adhered to one surface, were then sandwiched between two aluminum platelets (Cavity 0.3 mm with one side ground, 611; Technotrade International/Cavity 0.1/0.2 mm, 610; Technotrade International). The cells were subjected to high-pressure freezing using a Wohlwend Compact 2 device (Technotrade, M. Wohlwend GmbH). The frozen sapphire disks with adhered cells were immediately submerged in liquid nitrogen and placed into cryotubes on top of the frozen freeze substitution solution (2% OsO4, 0.1% uranyl acetate, and 3% water in acetone).
Freeze substitution was performed using an Advanced Freeze Substitution device (Leica Microsystems) according to the following 39-h schedule: a 2-h hold at −140°C to −90°C, a 24-h hold at −90°C, a temperature ramp from −90°C to 0°C over 12 h, and a final 1-h hold ramping from 0°C to 22°C. The remaining protocol, lasting 6 days, proceeded as follows. The cryotubes were removed at room temperature, and we performed three sequential rinses with anhydrous acetone, propylene oxide (Electron Microscopy Sciences), and a 50% resin solution (24 g Embed 812, 9 g dodecenylsuccinic anhydride [DDSA], 15 g N-methylaniline [NMA], 1.2 g dimethylbenzylamine [BDMA]; 14121; Electron Microscopy Sciences) in propylene oxide. After overnight incubation, the samples were transferred to 100% resin within molds (70900; EMS) and placed under vacuum for 1 h. This step was repeated once more with fresh 100% resin. The resin-embedded samples were polymerized in an oven at 65°C for 48 h.
The sapphire disks were released from the polymerized resin block containing the cells using a thermal shock method: first, immersing them in liquid nitrogen and then in boiling water. The released resin block was sanded and sectioned for FIB-SEM.
FIB-SEM
We mounted the resin blocks onto aluminum pin mount stubs (Ted Pella), exposing the cell-containing side and securing them with conductive silver epoxy adhesive (EPO-TEK H20S; Electron Microscopy Sciences), ensuring no adhesive contacted areas designated for imaging. The adhesive was cured for 24 h at 65°C. Prior to FIB-SEM imaging, we coated the surface of the resin block with a 20 nm layer of carbon using a high-purity carbon cord source in a Quorum Q150R ES sputter coater (Quorum Technologies).
FIB-SEM imaging typically took 2 days per sample and was conducted using a Zeiss Crossbeam 540 microscope. The stage was adjusted to minimize eccentricity and tilt (54°), with a working distance of 5 mm. After locating a cell of interest via SEM, we prepared the sample for FIB-SEM imaging by first depositing a protective platinum layer using a 30 kV/3 nA gallium ion beam, followed by coarse trench milling with a 30 kV/30 nA beam, block face polishing with a 30 kV/7 nA beam, and an alternating sequence of FIB milling at 30 kV/3 nA and SEM imaging at 1.5 kV/400 pA. The imaging was done in 5-nm increments to generate isotropic voxels with an x/y pixel size of 5 nm.
We typically etched fiducial marks into the platinum layer using a 30 kV/50 pA gallium ion beam to form a chevron pattern, which was infilled with platinum using the SEM at 1.5 kV/5 nA, followed by an additional platinum layer deposited with a 30 kV/1.5 nA gallium ion beam. FIB-SEM images were collected using Inlens and backscatter electron (ESB) detectors, with a pixel dwell time of 10 μs. Both images were averaged prior to image registration. FIB-SEM images were aligned using the Fiji plugin Register Virtual Stack Slices (https://imagej.net/plugins/register-virtual-stack-slices), applying the translation feature extraction and registration model with the shrinkage constraint option (Schroeder et al., 2021).
Preparation of mouse brain samples containing hippocampal CA1 pyramidal neurons by conventional chemical fixation, along with imaging at 8 × 8 × 20 nm resolution using the Zeiss Crossbeam 540, was previously described (Sheu et al., 2022). Additionally, we analyzed similar images collected at 5.5 × 5.5 × 15 nm resolution at Janelia Research Campus by Sheu et al. (2022). Preparation and imaging of mouse liver and P7 skin samples, collected at 8 × 8 × 8 nm resolution, are described in Parlakgül et al. (2022) and OpenOrganelle, Howard Hughes Medical Institute, respectively.
Endosome and lysosome visualization was conducted using Neuroglancer, a WebGL-based viewer for volumetric data. Cropped regions of interest containing selected endosomes and lysosomes were averaged by 3× in all three dimensions before segmenting the limiting membranes with the FIJI plugin Labkit (Arzt et al., 2022). The resulting masks were exported to Imaris (Bitplane) using the “surfaces” feature, and movies were created using the “animation” feature of Imaris.
Statistical analyses
Statistical analyses for quantification of aggregates and colocalization data were performed using a two-sided Student’s t test in GraphPad Prism 10.0. Results are presented as mean ± standard deviation. A symbol (*) indicates statistically significant differences (P < 0.005).
Cell viability data were processed using the cell counter plugin in ImageJ/FIJI, and statistical analysis was performed using two-way ANOVA with Dunnett’s post-hoc test in GraphPad Prism 10.0. Results are presented as mean ± standard deviation of the total number and percentage of live and dead cells. The symbol (*) indicates statistically significant differences (P < 0.0001).
Online supplemental material
Fig. S1 shows that the expression levels of α-syn-YFP do not correlate with PFF-mediated α-syn-YFP aggregate formation. Fig. S2 shows localization of PFF-induced α-Syn-YFP aggregates in endosomal and lysosomal compartments. Fig. S3 shows that the endogenous expression level of galectin-3 is relatively low in iNs and validation of eGFP-galectin-3 as a sensor of endolysosome damage. Fig. S4 shows representative fluorescence traces of the internalized pH sensor in endolysosomes within iNs and SVG-A cells. Fig. S5 shows visualization of perforated endolysosomes in iNs and primary mouse neurons using FIB-SEM (associated with Fig. 5). Video 1 shows perforated endolysosome from an iN. Video 2 shows perforated endolysosome from an iN. Video 3 shows intact endolysosome from an iPSC.
Data availability
The data and software developed by us are available from the corresponding author upon reasonable request.
Acknowledgments
We thank S.C. Harrison for extensive editorial help and members of the Kirchhausen laboratory for help and encouragement. We thank Whitney Gibbs (Kirby Neurobiology Center, Boston Children's Hospital, Boston, MA, USA) for kindly providing us with primary rat hippocampal neurons.
The research was supported by a National Institute of General Medical Sciences Maximizing Investigators’ Research Award GM130386, and a generous grant from IONIS to T. Kirchhausen and Novo Nordisk Foundation Center of Optimized Oligo Escape and Control of Disease to T. Kirchhausen and N.S. Hatzakis. A. Nair was supported in part by discretionary funds available to T. Kirchhausen. Acquisition of the FIB-SEM microscope was supported by a generous grant from Biogen to T. Kirchhausen, and the high-pressure freeze substitution device was made available by S.C. Harrison.
Author contributions: A. Sanyal: Conceptualization, Data curation, Formal analysis, Investigation, Methodology, Resources, Validation, Visualization, Writing - review & editing, G. Scanavachi: Data curation, Formal analysis, Investigation, Methodology, Resources, Software, Visualization, Writing - review & editing, E. Somerville: Data curation, Formal analysis, Investigation, Methodology, Visualization, Writing - review & editing, A. Saminathan: Investigation, A. Nair: Software, Visualization, R.F. Bango Da Cunha Correia: Investigation, B. Aylan: Investigation, Visualization, Writing - review & editing, E. Sitarska: Investigation, Resources, A. Oikonomou: Software, Validation, N.S. Hatzakis: Formal analysis, Funding acquisition, Supervision, Writing - review & editing, T. Kirchhausen: Conceptualization, Data curation, Formal analysis, Funding acquisition, Investigation, Methodology, Project administration, Resources, Software, Supervision, Validation, Visualization, Writing - original draft, Writing - review & editing.
References


