


Microtubules are dynamic polymers that interconvert between phases of growth and shrinkage, yet they provide structural stability to cells. Growth involves hydrolysis of GTP-tubulin to GDP-tubulin, which releases energy that is stored within the microtubule lattice and destabilizes it; a GTP cap at microtubule ends is thought to prevent GDP subunits from rapidly dissociating and causing catastrophe. Here, using in vitro reconstitution assays, we show that GDP-tubulin, usually considered inactive, can itself assemble into microtubules, preferentially at the minus end, and promote persistent growth. GDP-tubulin-assembled microtubules are highly stable, displaying no detectable spontaneous shrinkage. Strikingly, islands of GDP-tubulin within dynamic microtubules stop shrinkage events and promote rescues. Microtubules thus possess an intrinsic capacity for stability, independent of accessory proteins. This finding provides novel mechanisms to explain microtubule dynamics.

Introduction
Microtubules serve inherently contradictory demands: to allow growth and movement, they are dynamic, but to lend shape to the cell, they also possess the capacity to be stable. We know that microtubules can have varying lengths and contain lesser or greater proportions of labile (short-lived) and stable (long-lived) fractions (Akhmanova and Kapitein, 2022), but we still do not have a good understanding of their stability. A number of posttranslational modifications and accessory factors such as microtubule-associated proteins (MAPs) have been proposed to stabilize microtubules (Baas et al., 2016; Tas and Kapitein, 2018; Janke and Magiera, 2020), but the fact that multiple modifications or binding proteins can coexist on individual tubulin subunits makes their individual functions difficult to decipher. For instance, tau, long considered a microtubule-stabilizing protein, localizes to both stable and labile microtubules in neurons (Qiang et al., 2018). Along the same lines, some tubulin modifications associated with microtubule stability in cells do not induce microtubule stabilization per se but modulate the activity of regulators such as depolymerizing motors (Peris et al., 2009).
The renowned dynamic instability of microtubules (Mitchison and Kirschner, 1984) arises from their polymerization process. Microtubules grow from the head-to-tail assembly of α–β tubulin heterodimers, giving rise to a polarized tube with a fast-growing plus end and a slow-growing minus end (Desai and Mitchison, 1997; Brouhard and Rice, 2018). After incorporation of tubulin into the microtubule, the GTP associated with the β-subunit undergoes hydrolysis to GDP (Carlier, 1989; Hyman et al., 1992; Caplow et al., 1994), inducing conformational changes in the tubulin dimer that destabilize the lattice (Alushin et al., 2014; Manka and Moores, 2018). Assembly continues as long as there is a GTP “cap”; if the cap is lost, the microtubule will undergo rapid depolymerization known as catastrophe (Mitchison and Kirschner, 1984; Carlier, 1989). The released GDP-tubulin dimers exchange their GDP with a GTP, regaining their ability to assemble. The prevailing model for rescue, i.e., the transition from shrinkage to growth, is that GTP-tubulin islands in the lattice buffer against depolymerization and promote growth (Dimitrov et al., 2008; Aumeier et al., 2016; Vemu et al., 2018).
Here, we asked whether there might be something intrinsic to the microtubule that could provide stability without the polymer having to rely on extrinsic factors. Following a trail set out by several early studies (Carlier and Pantaloni, 1978; Zackroff et al., 1980; Manser and Bayley, 1985; Hamel et al., 1986), we determined conditions for growing GDP-tubulin in vitro. We found that GDP-tubulin-assembled microtubules are very stable, quite different from the microtubules formed after GTP-tubulin assembly and hydrolysis.
Results and discussion
GDP-tubulin promotes minus-end growth of non-dynamic microtubules
To investigate the ability of GDP-tubulin to assemble by itself, we compared microtubules grown from stable GMPCPP seeds in the presence of either GDP-tubulin or GTP-tubulin. As expected, microtubules assembled from low-micromolar GTP-tubulin grew rapidly at the plus end and more slowly at the minus end (Fig. 1, A and B; and Video 1), with both ends showing dynamic instability. By contrast, GDP-tubulin assembled from seeds only at high concentrations (above 100 µM), seemed to prefer one extremity, and exhibited no dynamic instability (Fig. 1 B, right panel). The behavior of GDP-tubulin-assembled microtubules was not due to the activity of stabilizing MAPs, the assembly of specific tubulin isotypes or modified tubulin (Fig. S1, A–D), or contamination from a small amount of GTP-tubulin (Fig. S1, E and F).

GDP-tubulin assembles into microtubules that preferentially grow from the minus end and do not spontaneously depolymerize. (A) Diagram of the experimental procedure (see Materials and methods). S, seed. (B) Representative kymographs of microtubules grown from red seeds and green GTP-tubulin (6 µM) or GDP-tubulin (210 µM). (C) Two-step perfusion to identify the growing end of GDP-tubulin-assembled microtubules. GDP-tubulin (210 µM) is first perfused into the chamber, then GTP-tubulin (10 µM). (D) A representative kymograph of a growing microtubule recorded during the last step is shown in C (gray square). The green band corresponds to the microtubule that has grown during the first incubation with green GDP-tubulin. The growth rates of GTP-tubulin-assembled microtubules (magenta) identify microtubule polarity (see Materials and methods). (E) Comparison of minus-end dynamics of microtubules grown from GDP-tubulin (210 µM) or GTP-tubulin-grown (6 µM). Values represent mean ± SD. n, number of events from at least three independent experiments. (F) Growth rate of microtubule minus-end as a function of GDP-tubulin (red) and GTP-tubulin concentration (blue, inset). Values represent mean ± SD of at least 31 growth events for GDP-tubulin and 156 growth events for GTP-tubulin from at least three independent experiments. Triangles represent the mean growth rate for each experiment.
GDP-tubulin assembles into microtubules that preferentially grow from the minus end and do not spontaneously depolymerize. (A) Diagram of the experimental procedure (see Materials and methods). S, seed. (B) Representative kymographs of microtubules grown from red seeds and green GTP-tubulin (6 µM) or GDP-tubulin (210 µM). (C) Two-step perfusion to identify the growing end of GDP-tubulin-assembled microtubules. GDP-tubulin (210 µM) is first perfused into the chamber, then GTP-tubulin (10 µM). (D) A representative kymograph of a growing microtubule recorded during the last step is shown in C (gray square). The green band corresponds to the microtubule that has grown during the first incubation with green GDP-tubulin. The growth rates of GTP-tubulin-assembled microtubules (magenta) identify microtubule polarity (see Materials and methods). (E) Comparison of minus-end dynamics of microtubules grown from GDP-tubulin (210 µM) or GTP-tubulin-grown (6 µM). Values represent mean ± SD. n, number of events from at least three independent experiments. (F) Growth rate of microtubule minus-end as a function of GDP-tubulin (red) and GTP-tubulin concentration (blue, inset). Values represent mean ± SD of at least 31 growth events for GDP-tubulin and 156 growth events for GTP-tubulin from at least three independent experiments. Triangles represent the mean growth rate for each experiment.
Time-lapse TIRF imaging of microtubules growing from seeds (red) in the presence of green-labeled GTP-tubulin (6 µM, left) or GDP-tubulin (210 µM, right). Images were collected every 5 s. Scale bar, 10 µm. Movie S1: Playback speed = 90 frames per second.
Time-lapse TIRF imaging of microtubules growing from seeds (red) in the presence of green-labeled GTP-tubulin (6 µM, left) or GDP-tubulin (210 µM, right). Images were collected every 5 s. Scale bar, 10 µm. Movie S1: Playback speed = 90 frames per second.
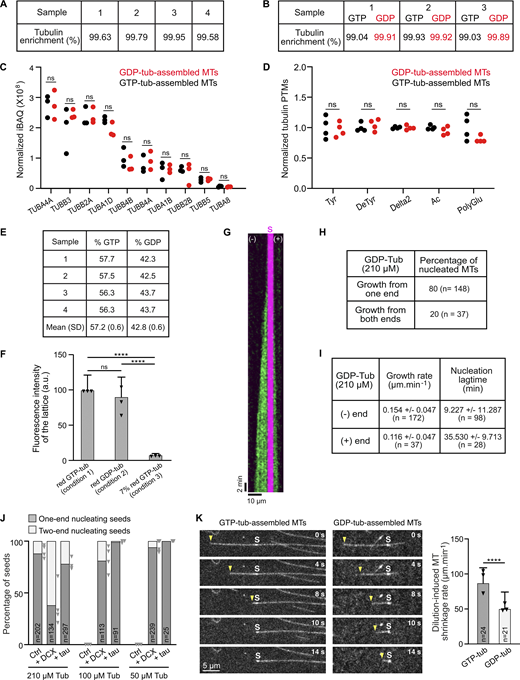
Characterization of GDP-tubulin-assembled microtubules. (A) Mass spectrometry–based proteomic analysis of tubulin batches (four independent experiments). Enrichment of tubulin over all detected proteins is indicated. (B) Mass spectrometry-based proteomic analysis of microtubules assembled from GDP-tubulin and GTP-tubulin (three independent experiments). Enrichment of tubulin over all detected proteins is indicated. No MAP was identified in either tubulin (A) or microtubule (B) samples (details in dataset PXD049371, PRIDE partner repository). (C) Relative abundance of main tubulin isotypes in GDP-and GTP-tubulin-assembled microtubules (three independent experiments) determined by mass spectrometry. ns, non-significant (non-parametric Mann–Whitney test). (D) Quantitative analysis of immunoblots of GDP- and GTP-tubulin-assembled microtubules for various posttranslational modifications of tubulin (four independent experiments). Tyr, tyrosinated; DeTyr, detyrosinated; Ac, acetylated; PolyGlu, Polyglutaminated. ns, non-significant (non-parametric Mann–Whitney test). (E) GDP and GTP nucleotide content of purified tubulin (see also Materials and methods). (F) To determine whether the 7% GTP-tubulin contamination of the GDP-tubulin stock (as determined in E) might account for our results, we tested microtubule assembly under several conditions. We combined 3.75 µM red-fluorescent GDP-tubulin with 21.25 µM GTP-tubulin with (condition 1) and without (condition 2) added GTP. The fluorescence intensity of the resulting lattices was very similar (100.00 ± 21.08 a.u. and 90.44 ± 27.73 a.u. for condition 1 and 2, respectively). Condition 3 (24.75 µM unlabeled GTP-tubulin and 0.25 µM red-fluorescent GTP-tubulin) corresponds to the intensity of the lattice if only 7% of the initial fluorescent GDP-tubulin (i.e., 7% of 3.75 µM GDP-tubulin) had been incorporated (7.90 ± 1.90 a.u). Values represent the mean ± SD of 102, 108, and 60 microtubule lattices from at least three independent experiments. Triangles represent the mean lattice intensity for each experiment normalized to condition 1. ****P < 0.001; ns, non-significant (Kruskal–Wallis ANOVA followed by post-hoc Dunn’s multiple comparison). (G) Kymograph showing the growth of GDP-tubulin (210 µM) at the two extremities of a microtubule. GDP-tubulin is in green and the GMPCPP seed is in magenta. (H) Percentages of seeds nucleating GDP-tubulin at one or both ends. n, total number of seeds from at least three independent experiments. (I) Growth rates and seeded nucleation lag times at the minus and plus ends of GDP-tubulin-assembled microtubules. Values indicate the mean ± SD. n, number of growth events from at least three independent experiments. (J) Percentages of microtubules growing from the minus end or both ends of GMPCPP seeds incubated with 210, 100, or 50 µM of GDP-tubulin with or without 0.5 µM DCX or tau. n, total number of seeds from at least three independent experiments. For control conditions with 100 and 50 µM GDP-tubulin, no nucleating seeds were observed. Triangles represent the percentage of one-end nucleating seeds for each experiment. (K) Time series showing dilution-induced depolymerization of GTP-tubulin- and GDP-tubulin-assembled microtubules. Arrowheads indicate minus ends. S, seed. Histogram shows dilution-induced shrinkage rates of microtubule minus ends. n, total number of microtubules from three independent experiments. ****P < 0.0001 (non-parametric Mann–Whitney test). Source data are available for this figure: SourceData FS1.

Characterization of GDP-tubulin-assembled microtubules. (A) Mass spectrometry–based proteomic analysis of tubulin batches (four independent experiments). Enrichment of tubulin over all detected proteins is indicated. (B) Mass spectrometry-based proteomic analysis of microtubules assembled from GDP-tubulin and GTP-tubulin (three independent experiments). Enrichment of tubulin over all detected proteins is indicated. No MAP was identified in either tubulin (A) or microtubule (B) samples (details in dataset PXD049371, PRIDE partner repository). (C) Relative abundance of main tubulin isotypes in GDP-and GTP-tubulin-assembled microtubules (three independent experiments) determined by mass spectrometry. ns, non-significant (non-parametric Mann–Whitney test). (D) Quantitative analysis of immunoblots of GDP- and GTP-tubulin-assembled microtubules for various posttranslational modifications of tubulin (four independent experiments). Tyr, tyrosinated; DeTyr, detyrosinated; Ac, acetylated; PolyGlu, Polyglutaminated. ns, non-significant (non-parametric Mann–Whitney test). (E) GDP and GTP nucleotide content of purified tubulin (see also Materials and methods). (F) To determine whether the 7% GTP-tubulin contamination of the GDP-tubulin stock (as determined in E) might account for our results, we tested microtubule assembly under several conditions. We combined 3.75 µM red-fluorescent GDP-tubulin with 21.25 µM GTP-tubulin with (condition 1) and without (condition 2) added GTP. The fluorescence intensity of the resulting lattices was very similar (100.00 ± 21.08 a.u. and 90.44 ± 27.73 a.u. for condition 1 and 2, respectively). Condition 3 (24.75 µM unlabeled GTP-tubulin and 0.25 µM red-fluorescent GTP-tubulin) corresponds to the intensity of the lattice if only 7% of the initial fluorescent GDP-tubulin (i.e., 7% of 3.75 µM GDP-tubulin) had been incorporated (7.90 ± 1.90 a.u). Values represent the mean ± SD of 102, 108, and 60 microtubule lattices from at least three independent experiments. Triangles represent the mean lattice intensity for each experiment normalized to condition 1. ****P < 0.001; ns, non-significant (Kruskal–Wallis ANOVA followed by post-hoc Dunn’s multiple comparison). (G) Kymograph showing the growth of GDP-tubulin (210 µM) at the two extremities of a microtubule. GDP-tubulin is in green and the GMPCPP seed is in magenta. (H) Percentages of seeds nucleating GDP-tubulin at one or both ends. n, total number of seeds from at least three independent experiments. (I) Growth rates and seeded nucleation lag times at the minus and plus ends of GDP-tubulin-assembled microtubules. Values indicate the mean ± SD. n, number of growth events from at least three independent experiments. (J) Percentages of microtubules growing from the minus end or both ends of GMPCPP seeds incubated with 210, 100, or 50 µM of GDP-tubulin with or without 0.5 µM DCX or tau. n, total number of seeds from at least three independent experiments. For control conditions with 100 and 50 µM GDP-tubulin, no nucleating seeds were observed. Triangles represent the percentage of one-end nucleating seeds for each experiment. (K) Time series showing dilution-induced depolymerization of GTP-tubulin- and GDP-tubulin-assembled microtubules. Arrowheads indicate minus ends. S, seed. Histogram shows dilution-induced shrinkage rates of microtubule minus ends. n, total number of microtubules from three independent experiments. ****P < 0.0001 (non-parametric Mann–Whitney test). Source data are available for this figure: SourceData FS1.
To identify the growth polarity of GDP-tubulin assembled microtubules, we performed two-step perfusion experiments: after allowing the microtubules to assemble from green-fluorescent GDP-tubulin, we exchanged the solution with red-fluorescent GTP-tubulin before recording microtubule behavior by TIRF microscopy (Fig. 1, C and D). Based on the differences in their growth rates, we identified the plus end (v = 1.09 ± 0.23 µm min−1, n = 85) and minus end (v = 0.37 ± 0.12 µm min−1, n = 39) of the newly red-fluorescent GTP-tubulin-assembled microtubules. The green GDP-tubulin-assembled microtubules grew robustly from the minus end.
We next examined minus-end behavior. As expected, the minus ends of GTP-tubulin-assembled microtubules exhibited catastrophes and rescues, while the minus ends of GDP-tubulin-assembled microtubules grew continuously with no detectable spontaneous shrinkage events, although the growth rates for both types were similar (Fig. 1 E). Plotting the mean growth rate as a function of tubulin concentration estimated 70 µM as the critical concentration for GDP-tubulin assembly versus 2 µM for GTP-tubulin assembly at the minus end (Fig. 1 F). This high critical concentration for GDP-tubulin is close to the estimated theoretical value of 100 µM (Howard, 2001). Linear regression of the curve (Strothman et al., 2019) showed the apparent minus-end on-rate of GDP-tubulin to be ∼2% that of GTP-tubulin (0.032 µM−1s−1 versus 1.453 µM−1s−1), explaining the lower propensity of GDP-tubulin to polymerize. It is worth noting that nearly one-fifth (18%) of the seeds assembled GDP-tubulin at their plus ends, albeit with a 3.8-fold longer nucleation lag-time than at minus ends (Fig. S1, G–I). These growing plus ends exhibited similar properties to those of the GDP-tubulin-assembled minus ends, i.e., a slow growth rate (about 0.1 µm min−1) and no apparent catastrophes.
We next asked whether some microtubule effectors might favor GDP-tubulin assembly in vitro. We tested DCX (doublecortin) and tau, two MAPs known to stimulate GTP-tubulin assembly (Cleveland et al., 1977; Moores et al., 2006). Tau promoted polymerization at GDP-tubulin concentrations as low as 50 µM, where no assembly was observed with GDP-tubulin alone (Fig. 2, A and B). DCX was able to stimulate assembly at an even lower concentration of 35 µM GDP-tubulin (10.63% of nucleating seeds, n = 470). Interestingly, DCX and tau stimulated GDP-tubulin assembly at both extremities (Fig. S1 J).

Interaction of GDP-tubulin-assembled microtubules with MAPs. (A) Microtubules assembled from seeds (brightest microtubule segment) and GDP-tubulin in the absence or the presence of 0.5 µM of tau or DCX. Stars (cyan) indicate non-nucleating seeds. (B) Percentages of seeds nucleating GDP-tubulin in the absence or presence of tau or DCX. n, the total number of seeds from at least three independent experiments. Triangles represent the percentage of nucleating seeds for each experiment. *P < 0.05, ****P < 0.0001 (two-sided Fisher’s test). P values were calculated relative to the control condition. (C) Microtubules assembled from seeds and 100 µM of GDP-tubulin in the presence of 0.5 µM of GFP-tau. (D) Linescan along the microtubule shown in the yellow box in C. Tau binds the microtubule lattice but is excluded from the GMPCPP seed. (E) Tau fluorescence intensity on the GDP-tubulin lattice and GMPCPP seeds. Values are means ± SD of 27 events from four independent experiments. Triangles represent the mean intensity for each experiment. ****P < 0.0001 (non-parametric Mann–Whitney test). (F) Representative kymographs of microtubules grown from seeds (S) and GTP-tubulin (8 µM) or GDP-tubulin (260 µM) in the presence of 75 nM GFP-EB1. (G) EB1 fluorescence intensity at microtubule minus end (comet) and on the lattice of both types of microtubules. Values are means ± SD of 301 (comet, GTP-tub), 124 (lattice, GTP-tub), 89 (comet, GDP-tub), and 89 (lattice, GDP-tub) events from three independent experiments. Triangles represent the mean intensity for each experiment. ****P < 0.001; ns, non-significant (Kruskal–Wallis ANOVA followed by post-hoc Dunn’s multiple comparison).
Interaction of GDP-tubulin-assembled microtubules with MAPs. (A) Microtubules assembled from seeds (brightest microtubule segment) and GDP-tubulin in the absence or the presence of 0.5 µM of tau or DCX. Stars (cyan) indicate non-nucleating seeds. (B) Percentages of seeds nucleating GDP-tubulin in the absence or presence of tau or DCX. n, the total number of seeds from at least three independent experiments. Triangles represent the percentage of nucleating seeds for each experiment. *P < 0.05, ****P < 0.0001 (two-sided Fisher’s test). P values were calculated relative to the control condition. (C) Microtubules assembled from seeds and 100 µM of GDP-tubulin in the presence of 0.5 µM of GFP-tau. (D) Linescan along the microtubule shown in the yellow box in C. Tau binds the microtubule lattice but is excluded from the GMPCPP seed. (E) Tau fluorescence intensity on the GDP-tubulin lattice and GMPCPP seeds. Values are means ± SD of 27 events from four independent experiments. Triangles represent the mean intensity for each experiment. ****P < 0.0001 (non-parametric Mann–Whitney test). (F) Representative kymographs of microtubules grown from seeds (S) and GTP-tubulin (8 µM) or GDP-tubulin (260 µM) in the presence of 75 nM GFP-EB1. (G) EB1 fluorescence intensity at microtubule minus end (comet) and on the lattice of both types of microtubules. Values are means ± SD of 301 (comet, GTP-tub), 124 (lattice, GTP-tub), 89 (comet, GDP-tub), and 89 (lattice, GDP-tub) events from three independent experiments. Triangles represent the mean intensity for each experiment. ****P < 0.001; ns, non-significant (Kruskal–Wallis ANOVA followed by post-hoc Dunn’s multiple comparison).
To characterize the lattice of GDP-tubulin-assembled microtubules, we assessed their interaction with two nucleotide-sensitive fluorescent MAPs, tau and EB1. Tau interacted with the lattice of GDP-tubulin-assembled microtubules more strongly than with GMPCPP microtubule seeds (Fig. 2, C–E), consistent with its preference for GDP-containing over GMPCPP- and GTP-containing lattices (Castle et al., 2020). EB1, which preferentially binds GTP-tubulin and displays a comet-like pattern at growing microtubule ends (Maurer et al., 2012; Strothman et al., 2019), tracked the minus ends of microtubules assembled from GTP-tubulin but did not track the minus ends of microtubules assembled from GDP-tubulin, even though they grew at a rate similar to that of GTP-tubulin (0.42 ± 0.11 µm min−1, n = 187 and 0.41 ± 0.12 µm min−1, n = 67, respectively) (Fig. 2, F and G). EB1 also failed to track the plus ends of GDP-tubulin-assembled microtubules (vgrowth = 0.25 ± 0.08 µm min−1, n = 46; Icomet(+) = 23.7 ± 6.9 a.u and Ilattice = 24.8 ± 4.8 a.u., n = 34). EB1 interacted weakly with the lattice of both types of microtubules, consistent with previous reports showing that it interacts weakly with GDP-tubulin lattices (Zanic et al., 2009; Maurer et al., 2012). Noticeably, EB1 bound half as much with the lattice of microtubules assembled from GDP- as with those assembled from GTP-tubulin (Fig. 2 G), suggesting that the GDP-lattice resulting from direct GDP-tubulin assembly differs from the GDP-lattice resulting from GTP-tubulin assembly and subsequent hydrolysis.
GDP-tubulin assembly at microtubule minus ends generates stable lattice regions
The lack of detectable spontaneous shrinkage events in microtubules grown from GDP-tubulin suggested that they are inherently stable. To test this possibility, red-fluorescent GTP-tubulin was grown at the minus end of green-fluorescent GDP-tubulin-assembled microtubules. In these cases, the dynamic GTP-tubulin-assembled lattice depolymerized only up to the junction with the GDP-tubulin-assembled lattice (Fig. 3 A, white arrows), at which point the shrinkage stopped. This contrasted with control experiments: when microtubules were successively polymerized from red- and green-fluorescent GTP-tubulin, the majority (81%) of depolymerizing microtubules kept depolymerizing past the junction between the two different fluorescently labeled lattices (Fig. 3, B and C). The GDP-tubulin-assembled lattice is therefore stable enough to stop ongoing depolymerization of a dynamic microtubule and promote rescue.

Microtubules grown from GDP-tubulin are highly stable. (A) Rescue events at the minus-end of microtubules polymerized first with GDP-tubulin (210 µM, green) then GTP-tubulin (10 µM, magenta). A representative kymograph shows the behavior of a microtubule recorded during the second step as shown above (gray square). White arrows indicate rescue events occurring at the junction between lattices grown from GDP-tubulin and GTP-tubulin. S, seed. Histogram shows the distance of rescue events from the junction (dashed vertical line, position 0) between lattices grown from GDP-tubulin (green) and GTP-tubulin (magenta). n = 122 rescue events from at least three independent experiments. Most rescue events occur at the junction between lattices grown from GDP-tubulin and GTP-tubulin. (B) Control experiment: rescue events at the minus-end of microtubules polymerized with GTP-tubulin (12 µM, green) then GTP-tubulin (10 µM, magenta). Representative kymograph and histogram as in A. The white arrowhead indicates a microtubule that depolymerizes across the junction. n = 170 rescue events from at least three independent experiments. (C) Percentages of depolymerizing microtubules that cross the junction or stop at the junction. n, the total number of events from at least three independent experiments. Triangles represent the percentage of depolymerizing microtubules that stop at the junction for each experiment. ****P < 0.0001 (two-sided Fisher’s test). (D) To assess spastin severing on microtubules constituted by segments of GDP- and GTP-tubulin-grown lattices, GDP-tubulin (210 µM, light pink) is polymerized from seed (S), then GTP-tubulin is polymerized (15 µM, magenta), before perfusing GFP-spastin. The time series shows hybrid microtubules severed by spastin, which binds along the whole lattice. Time in min:sec. (E) Fragmentation of GDP- vs. GTP-tubulin-grown microtubules. Fragmentation time is the time at which fragmentation starts. Boxes and whiskers show 25–75 and 10–90 percentiles, respectively; the solid line represents the median. n, total number of microtubules from at least three independent experiments. Triangles represent the mean fragmentation time for each experiment. ***P < 0.001 (non-parametric Mann–Whitney test). (F) Procedure to monitor the depolymerizing activity of MCAK at the end of GTP- (15 µM) or GDP- (210 µM) tubulin-grown microtubules with a time series of microtubules assembled in the presence of MCAK. Arrows, microtubule ends. Time, min:sec. (G) Distribution of GDP- versus GTP-tubulin-assembled-microtubule lengths after MCAK perfusion at two timepoints. n, total number of microtubules from at least three independent experiments.
Microtubules grown from GDP-tubulin are highly stable. (A) Rescue events at the minus-end of microtubules polymerized first with GDP-tubulin (210 µM, green) then GTP-tubulin (10 µM, magenta). A representative kymograph shows the behavior of a microtubule recorded during the second step as shown above (gray square). White arrows indicate rescue events occurring at the junction between lattices grown from GDP-tubulin and GTP-tubulin. S, seed. Histogram shows the distance of rescue events from the junction (dashed vertical line, position 0) between lattices grown from GDP-tubulin (green) and GTP-tubulin (magenta). n = 122 rescue events from at least three independent experiments. Most rescue events occur at the junction between lattices grown from GDP-tubulin and GTP-tubulin. (B) Control experiment: rescue events at the minus-end of microtubules polymerized with GTP-tubulin (12 µM, green) then GTP-tubulin (10 µM, magenta). Representative kymograph and histogram as in A. The white arrowhead indicates a microtubule that depolymerizes across the junction. n = 170 rescue events from at least three independent experiments. (C) Percentages of depolymerizing microtubules that cross the junction or stop at the junction. n, the total number of events from at least three independent experiments. Triangles represent the percentage of depolymerizing microtubules that stop at the junction for each experiment. ****P < 0.0001 (two-sided Fisher’s test). (D) To assess spastin severing on microtubules constituted by segments of GDP- and GTP-tubulin-grown lattices, GDP-tubulin (210 µM, light pink) is polymerized from seed (S), then GTP-tubulin is polymerized (15 µM, magenta), before perfusing GFP-spastin. The time series shows hybrid microtubules severed by spastin, which binds along the whole lattice. Time in min:sec. (E) Fragmentation of GDP- vs. GTP-tubulin-grown microtubules. Fragmentation time is the time at which fragmentation starts. Boxes and whiskers show 25–75 and 10–90 percentiles, respectively; the solid line represents the median. n, total number of microtubules from at least three independent experiments. Triangles represent the mean fragmentation time for each experiment. ***P < 0.001 (non-parametric Mann–Whitney test). (F) Procedure to monitor the depolymerizing activity of MCAK at the end of GTP- (15 µM) or GDP- (210 µM) tubulin-grown microtubules with a time series of microtubules assembled in the presence of MCAK. Arrows, microtubule ends. Time, min:sec. (G) Distribution of GDP- versus GTP-tubulin-assembled-microtubule lengths after MCAK perfusion at two timepoints. n, total number of microtubules from at least three independent experiments.
To further explore the stability of microtubules assembled from GDP-tubulin, we measured their shrinkage rate upon dilution-induced disassembly. They depolymerized at 58% of the rate of minus ends of microtubules assembled from GTP-tubulin (50.5 ± 23.7 µm min−1 versus 87.4 ± 21.4 µm min−1) (Fig. S1 K). We then subjected both species of microtubules to the severing protein Spastin and the depolymerizing motor MCAK. Spastin took 2.4 times longer to sever GDP-tubulin-assembled microtubules (Fig. 3, D and E). MCAK was much less active on GDP-tubulin-assembled microtubules, whose mean length decreased 37% after 40 min incubation with MCAK compared with the 77% decrease in the length of GTP-tubulin-assembled microtubules (Fig. 3, F and G). Microtubules assembled from GDP-tubulin are thus more stable than those assembled from GTP-tubulin.
GDP-tubulin islands pause activity at microtubule plus ends
To examine how a dynamic microtubule growing from GTP-tubulin behaves in a GDP-tubulin-enriched environment, we grew microtubules with red-fluorescent GTP-tubulin and then exchanged the solution with green-fluorescent GDP-tubulin. GDP-tubulin polymerized at the minus end of the GTP-tubulin-assembled microtubules, but the plus ends seemed to be frozen in a pause-like state (Fig. 4 A, star on kymograph). Such pausing has been observed in cells and in vitro in the presence of external factors (van Riel et al., 2017; van den Berg et al., 2023).

GDP-tubulin island stops shrinkage at the plus-end of GTP-tubulin-grown microtubules. (A) To monitor GDP-tubulin behavior at the plus end of microtubules assembled from GTP-tubulin, we perfused GTP-tubulin (15 µM, pink) then GDP-tubulin (210 µM, green), and then recorded with TIRF. Representative kymograph shows the behavior of a microtubule recorded after GDP-tubulin perfusion (gray square). The star indicates where the GTP-tubulin-grown microtubule paused. (B) To evaluate whether the paused plus-ends remained competent for microtubule assembly, we polymerized GTP-tubulin (15 µM, pink) from seeds, followed by GDP-tubulin (210 µM, green), then GTP-tubulin (10 µM, magenta). Kymograph shows a microtubule recorded after the last GTP-tubulin perfusion (gray square). Arrows indicate rescue events. The star indicates where the GDP-tubulin induced pausing. (C) Histogram shows the distance of rescue events at the plus end from the junction (position 0, same star as in B) where GDP-tubulin was incorporated. The frequency of rescues at the plus end in the control experiment is shown on the right; sequential perfusion of GTP-tubulin (15 µM, pink) followed by GTP-tubulin (10 µM, magenta). The locations of rescue events at the plus end from the junction where GDP-tubulin was incorporated differed from those in the control experiment. n, total number of rescue events from at least three independent experiments. (D) Percentages of depolymerizing plus-end extremities that cross the junction or stop at the junction. n, total number of events from at least three independent experiments. Triangles represent the percentage of depolymerizing microtubules that stop at the junction for each experiment. ****P < 0.0001 (two-sided Fisher’s test). (E) To reveal GDP-tubulin incorporation at microtubule plus ends, we used the same procedure as in A, except with fluorescent GDP-tubulin containing a high fraction of green-labeled tubulin. Tubulin polymerization was stopped 15 and 40 min after GDP-tubulin perfusion, shown in representative kymographs. (F) Length of GDP-tubulin green segments at the plus (top) and minus (bottom) ends. Values represent means ± SD of at least 84 events from three independent experiments. Triangles represent the mean length for each experiment. ns, non-significant; ****P < 0.0001 (Kruskal–Wallis ANOVA followed by post-hoc Dunn’s multiple comparison).
GDP-tubulin island stops shrinkage at the plus-end of GTP-tubulin-grown microtubules. (A) To monitor GDP-tubulin behavior at the plus end of microtubules assembled from GTP-tubulin, we perfused GTP-tubulin (15 µM, pink) then GDP-tubulin (210 µM, green), and then recorded with TIRF. Representative kymograph shows the behavior of a microtubule recorded after GDP-tubulin perfusion (gray square). The star indicates where the GTP-tubulin-grown microtubule paused. (B) To evaluate whether the paused plus-ends remained competent for microtubule assembly, we polymerized GTP-tubulin (15 µM, pink) from seeds, followed by GDP-tubulin (210 µM, green), then GTP-tubulin (10 µM, magenta). Kymograph shows a microtubule recorded after the last GTP-tubulin perfusion (gray square). Arrows indicate rescue events. The star indicates where the GDP-tubulin induced pausing. (C) Histogram shows the distance of rescue events at the plus end from the junction (position 0, same star as in B) where GDP-tubulin was incorporated. The frequency of rescues at the plus end in the control experiment is shown on the right; sequential perfusion of GTP-tubulin (15 µM, pink) followed by GTP-tubulin (10 µM, magenta). The locations of rescue events at the plus end from the junction where GDP-tubulin was incorporated differed from those in the control experiment. n, total number of rescue events from at least three independent experiments. (D) Percentages of depolymerizing plus-end extremities that cross the junction or stop at the junction. n, total number of events from at least three independent experiments. Triangles represent the percentage of depolymerizing microtubules that stop at the junction for each experiment. ****P < 0.0001 (two-sided Fisher’s test). (E) To reveal GDP-tubulin incorporation at microtubule plus ends, we used the same procedure as in A, except with fluorescent GDP-tubulin containing a high fraction of green-labeled tubulin. Tubulin polymerization was stopped 15 and 40 min after GDP-tubulin perfusion, shown in representative kymographs. (F) Length of GDP-tubulin green segments at the plus (top) and minus (bottom) ends. Values represent means ± SD of at least 84 events from three independent experiments. Triangles represent the mean length for each experiment. ns, non-significant; ****P < 0.0001 (Kruskal–Wallis ANOVA followed by post-hoc Dunn’s multiple comparison).
To determine whether the plus ends were merely paused or rendered unable to resume growth (“poisoned”), we performed a third perfusion with GTP-tubulin (Fig. 4 B). When GTP-tubulin was reintroduced into the chamber following GDP-tubulin perfusion, the microtubules resumed plus-end growth. Strikingly, these newly grown microtubules underwent depolymerization that stopped where the GDP-tubulin had induced pausing (Fig. 4 B, star on the kymograph); the majority of rescues happened at this position (Fig. 4, C and D). In other words, most dynamic microtubules stopped depolymerizing at the junction where GDP-tubulin was incorporated. The situation was quite different in the control experiment: without GDP-tubulin, microtubule rescues occurred at random positions.
These results strongly suggest that GDP-tubulin might have modified the microtubule plus ends by creating a short stable region or island within the polymer. In support of this notion, two-step perfusion experiments using fluorescent GDP-tubulin containing a high fraction of green-labeled tubulin showed that GDP-tubulin forms a region of roughly 350 nm (Fig. 4, E and F) that remains stable through 40 min of incubation. After 75 min of incubation with GDP-tubulin, this region lengthened, showing assembly at the plus ends. As expected, GDP-tubulin grew persistently at the minus end (Fig. 4 F). GDP-tubulin can thus stop polymerization at the plus end of microtubules assembled from GTP-tubulin.
Properties of microtubules assembled from mixtures of GDP- and GTP-tubulin
To study the behavior of microtubules grown in the presence of both GDP- and GTP-tubulin, we mixed 25 µM unlabeled GTP-tubulin with increasing concentrations of red-fluorescent GDP-tubulin (5–80 µM) in the absence of free nucleotide (Fig. 5 A and Video 2). Measurements of microtubule lattice fluorescence intensity indicated a linear increase of GDP-tubulin incorporation as a function of the initial soluble GDP-tubulin pool (Fig. S2 A). Microtubules assembled from GTP-tubulin alone exhibited a fast-growing plus end and a slow-growing minus end, but the addition of GDP-tubulin affected the behavior of both ends, depending on the GDP-/GTP-tubulin ratio. As little as 5 µM GDP-tubulin added to 25 µM GTP-tubulin increased the frequency of catastrophes and decreased the growth rate at the plus end (Fig. 5 B, top row). As the ratio of GDP- to GTP-tubulin increased, assembly at the plus end was progressively inhibited, such that 40% of seeds no longer nucleated microtubules at the highest GDP-tubulin concentration (80 µM:25 µM) (Fig. 5 A and Fig. S2 B). This inhibition was associated with a sharp reduction in the time the plus ends spent in polymerization (Fig. S2 C). The increase in catastrophes at the plus ends in the presence of GDP-tubulin might be due to the capping effect of GDP-tubulin at this extremity (Fig. 4 F). This capping activity would impede tubulin incorporation, reducing the growth rate along with an increase in the catastrophe frequency (Walker et al., 1988). Another possibility is that GDP-tubulin could interfere with microtubule assembly without being incorporated into the polymer if it transiently binds the microtubule plus end, where it would block GTP-tubulin incorporation until it is removed. These data are reminiscent of previous studies reporting an inhibitory effect of GDP on microtubule plus end growth (Caplow and Shanks, 1995; McCormick et al., 2024). At the highest GDP-/GTP-tubulin ratios, the decrease in the shrinkage rate and the increase in rescues indicate greater lattice stability. This stabilization likely reflects greater incorporation of GDP-tubulin, in accord with the stability of microtubules grown with GDP-tubulin alone (Fig. 1 and Fig. S1 G).

Co-incorporation of GDP-tubulin and GTP-tubulin in microtubules favors minus-end survival and hinders growth at the plus-end. (A) Representative kymographs of hybrid microtubules polymerized from 25 µM GTP-tubulin alone or with increasing concentrations of GDP-tubulin as noted. In GDP-/GTP-tubulin mixtures, microtubules are assembled from unlabeled GTP-tubulin and fluorescently labeled GDP-tubulin. S, seed. (B) Growth rate, shrinkage rate, catastrophe frequency, and rescue frequency of microtubule plus and minus ends assembled with different GTP-/GDP-tubulin ratios. Data are represented as the mean ± SD of at least 209 (growth rate), 146 (shrinkage rate), 125 (catastrophe frequency), and 30 (rescue frequency) events from at least three independent experiments (detailed values of parameters are given in Table S1). Triangles represent the mean of each experiment. *P < 0.5, **P < 0.01, ****P < 0.0001 (Kruskal–Wallis ANOVA followed by post-hoc Dunn’s multiple comparison). P values were calculated relative to the condition with no GDP-tubulin (0:1 GDP-tubulin/GTP-tubulin ratio). (C) Microtubule depolymerization length before a rescue is a function of tubulin content. Data are represented as the mean ± SD of 93 (0:1 ratio), 166 (1:5 ratio), 123 (1:2 ratio), 156 (1:1 ratio), 252 (2:1 ratio), and 294 (3:1 ratio) from at least three independent experiments. Triangles represent the mean of microtubule depolymerization length for each experiment. ***P < 0.001, ****P < 0.0001 (Kruskal–Wallis ANOVA followed by post-hoc Dunn’s multiple comparison). P values were calculated relative to the condition with no GDP-tubulin (0:1 GDP-tubulin/GTP-tubulin ratio). (D) Diagram showing how persistent and non-persistent growth were defined. The proportion of microtubules with persistent growth at the minus end increased with the ratio of GDP-tubulin to GTP-tubulin. n, total number of events from at least three independent experiments. Triangles represent the proportion of persistent growth for each experiment. *P < 0.05, **P < 0.01, ***P < 0.001 (two-sided Fisher’s test). P values were calculated relative to the condition with no GDP-tubulin (0:1 GDP-tubulin/GTP-tubulin ratio).
Co-incorporation of GDP-tubulin and GTP-tubulin in microtubules favors minus-end survival and hinders growth at the plus-end. (A) Representative kymographs of hybrid microtubules polymerized from 25 µM GTP-tubulin alone or with increasing concentrations of GDP-tubulin as noted. In GDP-/GTP-tubulin mixtures, microtubules are assembled from unlabeled GTP-tubulin and fluorescently labeled GDP-tubulin. S, seed. (B) Growth rate, shrinkage rate, catastrophe frequency, and rescue frequency of microtubule plus and minus ends assembled with different GTP-/GDP-tubulin ratios. Data are represented as the mean ± SD of at least 209 (growth rate), 146 (shrinkage rate), 125 (catastrophe frequency), and 30 (rescue frequency) events from at least three independent experiments (detailed values of parameters are given in Table S1). Triangles represent the mean of each experiment. *P < 0.5, **P < 0.01, ****P < 0.0001 (Kruskal–Wallis ANOVA followed by post-hoc Dunn’s multiple comparison). P values were calculated relative to the condition with no GDP-tubulin (0:1 GDP-tubulin/GTP-tubulin ratio). (C) Microtubule depolymerization length before a rescue is a function of tubulin content. Data are represented as the mean ± SD of 93 (0:1 ratio), 166 (1:5 ratio), 123 (1:2 ratio), 156 (1:1 ratio), 252 (2:1 ratio), and 294 (3:1 ratio) from at least three independent experiments. Triangles represent the mean of microtubule depolymerization length for each experiment. ***P < 0.001, ****P < 0.0001 (Kruskal–Wallis ANOVA followed by post-hoc Dunn’s multiple comparison). P values were calculated relative to the condition with no GDP-tubulin (0:1 GDP-tubulin/GTP-tubulin ratio). (D) Diagram showing how persistent and non-persistent growth were defined. The proportion of microtubules with persistent growth at the minus end increased with the ratio of GDP-tubulin to GTP-tubulin. n, total number of events from at least three independent experiments. Triangles represent the proportion of persistent growth for each experiment. *P < 0.05, **P < 0.01, ***P < 0.001 (two-sided Fisher’s test). P values were calculated relative to the condition with no GDP-tubulin (0:1 GDP-tubulin/GTP-tubulin ratio).
Time-lapse TIRF imaging of microtubules growing from seeds in the presence of various ratios of GTP- and GDP-tubulin. Left: 25 µM GTP-tubulin. Middle: 25 µM GTP-tubulin/25 µM GDP-tubulin. Right: 25 µM GTP-tubulin/80 µM GDP-tubulin. Images were collected every 2 s. Scale bar, 5 µm. Movie S2: Playback speed = 60 frames per second.
Time-lapse TIRF imaging of microtubules growing from seeds in the presence of various ratios of GTP- and GDP-tubulin. Left: 25 µM GTP-tubulin. Middle: 25 µM GTP-tubulin/25 µM GDP-tubulin. Right: 25 µM GTP-tubulin/80 µM GDP-tubulin. Images were collected every 2 s. Scale bar, 5 µm. Movie S2: Playback speed = 60 frames per second.

Increasing GDP-/GTP-tubulin ratios favor growth at the minus end. (A) Estimation of GDP-tubulin incorporation in microtubules assembled from 25 µM unlabeled GTP-tubulin and increasing concentrations of red-fluorescent GDP-tubulin. Values represent mean ± SD of 30 lattice intensities from three independent experiments and are fitted with a linear regression model (R2 = 0.96). Triangles represent the mean intensity for each experiment. (B) Percentages of seeds elongating at both ends or only at the minus ends in the presence of increasing ratios of GDP-/GTP-tubulin. n, total number of seeds from at least three independent experiments. Triangles represent the percentage of seeds elongating at both ends for each experiment. ****P < 0.001; ns, non-significant (two-sided Fisher’s test). P values were calculated relative to the control condition (0:1). (C) Violin plot of the percentage of polymerizing time at the plus end of microtubules assembled with increasing GDP-/GTP-tubulin ratios. The central line represents the median and the dashed lines represent the quartiles. At least 47 microtubules from at least three independent experiments have been analyzed for each condition. Triangles represent the mean polymerizing time of each experiment. ****P < 0.001; ns, non-significant (Kruskal–Wallis ANOVA followed by post-hoc Dunn’s multiple comparison). P values were calculated relative to the control condition (0:1). (D) Two-step perfusion experiment (left) to evaluate the stability of microtubules assembled from 80 µM GDP-tubulin and 25 µM GTP-tubulin, with a representative kymograph (right). Microtubules were first assembled from seeds (S) in the presence of a mixture of GDP-/GTP-tubulin in a 3:1 ratio (light pink). After 15 min of elongation, free tubulin was replaced by GTP-tubulin (magenta). White arrows in kymograph indicate rescue events at the junction between the two lattices (star). (E) Percentages of depolymerizing microtubules that cross the junction (gray bar) or stop at the junction (black bar). n, total number of events from at least three independent experiments. Triangles represent the percentage of depolymerizing microtubules that stop at the junction for each experiment. ****P < 0.0001 (two-sided Fisher’s test).

Increasing GDP-/GTP-tubulin ratios favor growth at the minus end. (A) Estimation of GDP-tubulin incorporation in microtubules assembled from 25 µM unlabeled GTP-tubulin and increasing concentrations of red-fluorescent GDP-tubulin. Values represent mean ± SD of 30 lattice intensities from three independent experiments and are fitted with a linear regression model (R2 = 0.96). Triangles represent the mean intensity for each experiment. (B) Percentages of seeds elongating at both ends or only at the minus ends in the presence of increasing ratios of GDP-/GTP-tubulin. n, total number of seeds from at least three independent experiments. Triangles represent the percentage of seeds elongating at both ends for each experiment. ****P < 0.001; ns, non-significant (two-sided Fisher’s test). P values were calculated relative to the control condition (0:1). (C) Violin plot of the percentage of polymerizing time at the plus end of microtubules assembled with increasing GDP-/GTP-tubulin ratios. The central line represents the median and the dashed lines represent the quartiles. At least 47 microtubules from at least three independent experiments have been analyzed for each condition. Triangles represent the mean polymerizing time of each experiment. ****P < 0.001; ns, non-significant (Kruskal–Wallis ANOVA followed by post-hoc Dunn’s multiple comparison). P values were calculated relative to the control condition (0:1). (D) Two-step perfusion experiment (left) to evaluate the stability of microtubules assembled from 80 µM GDP-tubulin and 25 µM GTP-tubulin, with a representative kymograph (right). Microtubules were first assembled from seeds (S) in the presence of a mixture of GDP-/GTP-tubulin in a 3:1 ratio (light pink). After 15 min of elongation, free tubulin was replaced by GTP-tubulin (magenta). White arrows in kymograph indicate rescue events at the junction between the two lattices (star). (E) Percentages of depolymerizing microtubules that cross the junction (gray bar) or stop at the junction (black bar). n, total number of events from at least three independent experiments. Triangles represent the percentage of depolymerizing microtubules that stop at the junction for each experiment. ****P < 0.0001 (two-sided Fisher’s test).
GDP-tubulin did not affect the dynamic parameters of the minus end until it reached a 1:1 ratio with GTP-tubulin (25 µM each) (Fig. 5 B, bottom row). At this concentration, GDP-tubulin started to inhibit depolymerization and promote rescues. Raising the GDP-tubulin concentration shortened depolymerization events, which, in association with the increase in rescues, led to persistent growth starting at a 1:2 ratio (12.5 µM:25 µM; Fig. 5, C and D). Accordingly, in two-step perfusion experiments in which microtubules were assembled in the highest GDP-tubulin concentration (80 µM:25 µM) before assembly with GTP-tubulin, almost all depolymerizing GTP-tubulin-assembled microtubules were rescued at the junction with the hybrid GTP-/GDP-tubulin microtubule (Fig. S2, D and E).
Concluding remarks and perspectives
Our study suggests that two distinct GDP-tubulin lattices exist: the classic, unstable post-hydrolyzed GDP-tubulin lattice prone to depolymerize, and a stable GDP-tubulin lattice resulting from direct assembly of GDP-tubulin that accounts for rescues and persistent growth. This work may thus resolve a question raised 15 years ago in the context of chemical kinetic and structural plasticity approaches to microtubule dynamics (Kueh and Mitchison, 2009). Dimitrov and colleagues (Dimitrov et al., 2008) had identified short stable segments in the middle of microtubules in vivo, and Kueh and Mitchison noted that it remained to be determined whether those stable segments contained GTP-tubulin (chemical kinetic model) or GDP-tubulin in an alternative state (structural plasticity model). Our data support the latter view.
GDP-tubulin’s ability to elongate is consistent with the fact that its high-resolution structure and curved conformation in solution are similar to those of GTP-tubulin (Buey et al., 2006; Gebremichael et al., 2008; Rice et al., 2008; Grafmüller and Voth, 2011; Nawrotek et al., 2011). In fact, several earlier studies suggested that GDP-tubulin might participate in microtubule elongation (Carlier and Pantaloni, 1978; Hamel et al., 1986; Tanaka-Takiguchi et al., 1998; Moores et al., 2006; Valiron et al., 2010). GDP-tubulin’s weaker propensity for polymerization might be due to structural variations in regions involved in protofilament contacts or differences in tubulin dimer flexibility (Grafmüller and Voth, 2011; Igaev and Grubmüller, 2018). It remains unclear why the minus end would have a greater capacity to incorporate GDP-tubulin than the plus end; it could be because of differences in the terminal subunit (α at the minus end versus β at the plus end), the nucleotide associated with the last subunit (non-hydrolyzable GTP for the minus end versus a mixture of GTP and GDP for the plus end), distinctive lateral interactions between the last subunits (α–α at the minus end versus β–β at the plus end), or different protofilament conformations (Tran et al., 1997; Nogales et al., 1999; Nogales and Zhang, 2016; Akhmanova and Steinmetz, 2019; McCormick et al., 2024).
It is rather remarkable that GDP-tubulin, even at concentrations as low as 5 µM or one-fifth the concentration of GTP-tubulin (Fig. 5 and Fig. S1 G), can readily incorporate into growing microtubules. In cells, GDP-tubulin might thus be incorporated within microtubules as soon as GDP-tubulin is available in the environment. To our knowledge, there is no available data about the relative concentrations of GDP- and GTP-tubulin in cells. Early studies observed GDP/GTP ratios ranging from 1:3 to 1:13 (Angelastro and Purich, 1992; Traut, 1994) depending on cell type. The affinity of soluble tubulin for the two nucleotides is comparable, with dissociation constants within the same order of magnitude: 2.2× 10⁻⁸ M for GTP binding to the E site of the tubulin dimer versus 6.1 × 10⁻⁸ M for GDP (Zeeberg and Caplow, 1979). Moreover, the incorporation of GDP-tubulin in microtubules might be facilitated by cellular factors such as MAPs (e.g., tau and DCX, this study) or by local increases in tubulin concentration within phase-separated condensates (Hernández-Vega et al., 2017; Baumgart et al., 2019; King and Petry, 2020).
The stability of microtubules assembled from GDP-tubulin might be a corollary of the lack of GTP hydrolysis that destabilizes microtubules (Alushin et al., 2014), just as the lack of GTP hydrolysis in GMPCPP-tubulin-assembled microtubules suppresses catastrophes (Hyman et al., 1992). Yet the GMPCPP-microtubule shrinkage rate upon dilution is much slower (0.12 µm h−1) (Strothman et al., 2019), and GMPCPP-tubulin has a strong capacity to nucleate spontaneously, whereas GDP-tubulin is not able to self-assemble (in the concentration range used in this study; see also [Valiron et al., 2010]). One explanation for these differences is weaker tubulin–tubulin contacts in the GDP-tubulin-assembled microtubules. High-resolution structural analysis will be required to understand the organization of the GDP-tubulin lattice and reveal differences with the GDP-tubulin lattice resulting from GTP-tubulin assembly and subsequent hydrolysis.
Our data shed light on several phenomena that have never been completely understood. First, GDP-tubulin incorporation provides a mechanism intrinsic to the microtubule itself to support stable microtubule arrays in differentiated cells, where most microtubule minus ends are unanchored (Akhmanova and Steinmetz, 2019). Second, there is the phenomenon of pausing, which has been observed in cells but not in vitro in the absence of external factors (Lieuvin et al., 1994; van Riel et al., 2017): our experiments show that GDP-tubulin incorporation at the plus end is sufficient to cause pauses. Third, GDP-tubulin islands could favor rescues or repairing damaged sites, as has been proposed for GTP-tubulin islands (Dimitrov et al., 2008; Schaedel et al., 2015; de Forges et al., 2016; Vemu et al., 2018; Andreu-Carbó et al., 2022). To our knowledge, none of these studies tested whether GDP-tubulin might also repair damaged lattice sites. In the future, developing probes that can discriminate between GDP-tubulin- and GTP-tubulin-assembled lattices will be essential to uncover the role of GDP-tubulin incorporation in microtubule dynamics.
Materials and methods
All reagents were purchased from Sigma-Aldrich unless specified.
Protein purification and tubulin preparation
Recombinant mouse EGFP-spastin was kindly provided by Jérémie Gaillard (LPCV/IRIG, Grenoble, France) and Marilyn Vantard (GIN, Grenoble, France). Plasmid encoding human Kif2C/MCAK (Kif2C-(sN+M), 36-amino acid extension N-terminal + motor domain) was kindly provided by Benoit Gigant (I2BC-B3S, Gif-sur-Yvette, France) and purified as previously described (Wang et al., 2012). Human tau1N4R-sfGFP and DCX-sfGFP (mouse, isoform 3) were cloned in pET28 plasmid (RRID:Addgene_26096) (Novagen) and expressed in E. coli strain BL21-DE3 (Invitrogen) under 0.2 mM IPTG induction overnight at 18°C. Cells were lysed in lysis buffer (40 mM Tris-HCl pH7, 0.25 M NaCl, protease inhibitor cocktail [Roche]) by three freeze/thaw cycles and sonication. The lysate was clarified by centrifugation (30 min, 4°C, 100,000 × g) and diluted in 40 mM Tris-HCl buffer pH 7.0 to adjust the salt content in the lysate to 100 mM NaCl. The recombinant protein was then purified first on a prepacked cation exchanger SP Sepharose (HiTrap SP XL, Cytiva) column with an increasing NaCl gradient (100–500 mM) and then by size exclusion in BRB80 buffer (80 mM Pipes, 1 mM EGTA, 1 mM MgCl2, and pH 6.74) supplemented with 50 mM KCl. Human EB1-GFP was cloned in pET28 plasmid (Novagen) and purified as previously described (Ramirez-Rios et al., 2017). Purified recombinant proteins were stored in liquid nitrogen. Proteins were centrifuged before use and the concentration was determined by a Bradford assay against a BSA standard.
Tubulin was purified from fresh bovine brain by two cycles of polymerization and depolymerization followed by cation-exchange chromatography and an additional polymerization/depolymerization cycle (Ramirez-Rios et al., 2017). GDP-tubulin was obtained by depolymerizing the microtubule pellet recovered from the last cycle and then stored in liquid nitrogen.
Tubulin was fluorescently labeled with ATTO 488 NHS-ester (AD 488) or ATTO 565 NHS-ester (AD 565) (ATTO-TEC GmbH), or biotinylated as described in Hyman et al. (1991), and the obtained modified GDP-tubulin was stored in liquid nitrogen.
GTP-tubulin was prepared by incubating GDP-tubulin with 1 mM GTP (Sigma-Aldrich) in BRB80 for 10 min at 4°C. Free GTP was removed by filtration on a Biogel P30 column and centrifugation for 3 min at 624 × g, 4°C as described before (Valiron et al., 2010). Eluted GTP-tubulin was stored in liquid nitrogen.
Isolation of microtubules assembled from GDP-tubulin or GTP-tubulin for biochemical analyses
Short GMPCPP microtubules were generated by incubating 30 µM tubulin in BRB80 supplemented with 0.5 mM guanosine-5’-[(alpha,beta)-methyleno] triphosphate (GMPCPP) (Jena Bioscience) at 37°C for 3 min. The solution was diluted 10-fold with prewarmed BRB80 and centrifuged twice (90,000 × g, 5 min, 35°C). The pelleted seeds were resuspended in prewarmed BRB80 and frozen as small aliquots in liquid nitrogen. Seed concentration was measured at 280 nm after depolymerization in 1 M CaCl2 for 10 min at 4°C. Microtubules were assembled from 1 µM seeds with 25 µM tubulin and 1 mM GTP or with 230 µM tubulin in the absence of added GTP. After 60 min at 37°C, samples were centrifuged (200,000 × g, 5 min) to pellet microtubules. Microtubules were depolymerized by dilution in prewarmed BRB80 for 5 min before centrifugation (200,000 × g, 15 min) to pellet seeds. Supernatants were analyzed by mass spectrometry and Western blots.
Mass spectrometry-based proteomic analyses
Tubulin samples were solubilized in Laemmli buffer and stacked on top of a 4–12% NuPAGE gel (Invitrogen). After staining with R-250 Coomassie Blue (Biorad), proteins were digested in-gel using trypsin (modified, sequencing purity, Promega) as previously described (Zafirov et al., 2023). The resulting peptides were analyzed by online nanoliquid chromatography coupled to MS/MS (Ultimate 3000 RSLCnano and Q-Exactive HF, Thermo Fisher Scientific). For this purpose, the peptides were sampled on a precolumn (300 μm × 5 mm PepMap C18, Thermo Fisher Scientific) and separated in a 75 μm × 250 mm C18 column (Aurora Generation 3, 1.7 μm, IonOpticks) using a 60-min gradient. The MS and MS/MS data were acquired by Thermo Xcalibur (RRID:SCR_014593) version 2.9.
Peptides and proteins were identified by Mascot (version 2.8.0, Matrix Science) through concomitant searches against the Uniprot database (Bos taurus taxonomy, 202305 download) and a homemade database containing the sequences of classical contaminant proteins found in proteomic analyses (keratins, trypsin, etc.). Trypsin/P was chosen as the enzyme, and two missed cleavages were allowed. Precursor and fragment mass error tolerances were set at respectively at 10 and 20 ppm. Peptide modifications allowed during the search were: carbamidomethyl (C, fixed), acetyl (Protein N-term, variable), and oxidation (M, variable). The Proline software (Bouyssié et al., 2020) was used for the compilation, grouping, and filtering of the results (conservation of rank 1 peptides, peptide length ≥6 amino acids, false discovery rate of peptide-spectrum-match identifications <1% [Couté et al., 2020], and minimum of one specific peptide per identified protein group). Proline was then used to perform an MS1-based label-free quantification of the identified protein groups. For each protein group, intensity-based absolute quantification (iBAQ, [Schwanhäusser et al., 2011]) values were calculated from MS1 intensities of specific peptides and part of shared peptides. Shared peptide intensities were allocated to the corresponding protein groups based on the proportion of iBAQ values calculated using only specific peptides.
To compare the relative abundance of tubulin isoforms in the different analyzed samples, iBAQ values of individual tubulins in each sample were normalized by the sum of the iBAQ values of all tubulins in the sample.
Analysis of tubulin posttranslational modifications by Western blot
Tubulin samples were resuspended in Laemmli SDS sample buffer and boiled for 5 min. Tubulin samples (300 ng) were separated on 10% SDS-PAGE and electrotransferred to LF PVDF membrane (Biorad). Membranes were blocked with 5% fat milk in PBS containing 0.1% Tween 20 (PBST) for 45 min at room temperature and probed for 1 h 30 min with primary antibodies (1/2,000 in PBST). Primary antibodies were used to detect posttranslational modifications: rabbit polyclonal anti-delta2-tubulin (Aillaud et al., 2016), rabbit polyclonal anti-acetyl-tubulin (ABT241; Millipore), rat monoclonal anti-Tyr-tubulin (clone YL1/2) (Wehland and Willingham, 1983), guinea pig polyclonal anti-deTyr-tubulin (Aillaud et al., 2016), and monoclonal anti-polyglutamylated-tubulin (clone GT335, AG-20B-0020; AdipoGen). Total tubulin was detected using mouse monoclonal anti-tubulin (clone alpha3A1) (Erck et al., 2005) or rabbit polyclonal anti-tubulin (11224-1-AP; Proteintech) depending on the primary antibodies. Membranes were washed three times with PBST and incubated for 1 h in PBST containing secondary antibodies (dilution 1/1,000): anti-mouse (RRID: AB_2338902) or -rabbit (RRID: AB_2338072) AF647-coupled secondary antibodies for total tubulin and anti-rabbit (RRID: AB_2313584) or -rat (RRID: AB_2338351) or -guinea pig (RRID: AB_2337438) or -mouse (RRID: AB_2338840) AF488-coupled secondary antibodies (Jackson ImmunoResearch) for tubulin posttranslational modifications. After three additional washes with PBST and one with PBS, signals were recorded on a ChemiDoc imaging system (Biorad) and quantified using ImageJ (RRID:SCR_003070) (Schneider et al., 2012). Signals were normalized relative to the signal for total tubulin on the same blot. For representation (Fig. S1 D), the mean of values for GTP-tubulin-assembled microtubules was set to 1 for each posttranslational modification.
Determination of nucleotide content of purified unlabeled tubulin
Tubulin nucleotide content was determined as described previously (Ceballos-Picot et al., 2015). Briefly, nucleotides were extracted from tubulin dimers by incubation of 35 μl aliquot in 300 μl of EtOH/Hepes 20 mM pH 7.2 (8/2) solution for 3 min at room temperature, followed by evaporation at 25°C. Pellets were resuspended in nuclease- and phosphatase-free molecular biology grade water (#10977015; Invitrogen). Samples were clarified by centrifugation (20,000 × g) at 4°C for 15 min followed by a second centrifugation (20,000 × g) at 4°C for 45 min. Nucleotides from the supernatant were separated by High-Performance Ionic Chromatography (HPIC; ICS3000, Dionex/Thermo Fisher Scientific) and detected by their absorbance at 260 nm using a Diode Array Detector (DAD-3000(RS), Dionex/Thermo Fisher Scientific). Guanylic nucleotide concentrations were inferred from standard curves using pure compounds. Results indicate that 7.2% of purified tubulin is associated with a GTP molecule on its E-site (Fig. S1 E), which might be because of incomplete GTP hydrolysis during assembly (Dimitrov et al., 2008). These results are in agreement with previous analyses of the nucleotide content of purified tubulin (Roostalu et al., 2020).
GDP- and GTP-tubulin assembly in TIRF-based assays
Reactions were performed in perfusion chambers where stable biotinylated microtubule seeds were attached to the coverslip before tubulin solution was perfused. Microtubule growth was then recorded by TIRF microscopy.
Red microtubule seeds were obtained by polymerizing 10 µM tubulin (50% ATTO-565 labeled tubulin and 50% biotinylated tubulin) with 1 mM GMPCPP in BRB80 at 35°C for 1 h. The seeds were centrifuged for 5 min at 90,000 × g, resuspended in an equal BRB80 volume containing 1 mM GMPCPP, and stored in liquid nitrogen.
Perfusion chambers were prepared with functionalized mPEG-silane (Creative PEGWorks) and biotin-PEG-silane (Laysan BIO) coverslips as previously described (Ramirez-Rios et al., 2017). The flow cell was perfused successively with neutravidin (25 µg/ml in 1% BSA in BRB80) (Pierce), PLL-PEG (2 kD, 0.1 mg/ml in 10 mM Hepes, pH 7.4) (Jenkem), and microtubule seeds diluted in BRB80. Various concentrations of GDP-tubulin (containing 5–10% ATTO-488- or ATTO-565-labeled GDP-tubulin) in the TIRF assay buffer (4 mM DTT, 1% BSA, 1 mg/ml glucose, 70 µg/ml catalase, 580 µg/ml glucose oxidase, 0.1% methylcellulose [4000 centipoise], in BRB80), in the absence of added nucleotide, were injected into the chamber. Experiments performed with 3 mM GDP nucleotide in the solution gave similar results. For the assembly of classic dynamic microtubules, GDP-tubulin (containing 5–10% ATTO-488- or ATTO-565-labeled GDP-tubulin) was prepared at various concentrations in TIRF buffer complemented with 1 mM GTP. The use of 210 µM GDP-tubulin and 6 µM GTP-tubulin to analyze the dynamic parameters of microtubule minus end (Fig. 1 E) was dictated by the need to compare microtubules growing at the same rate, as there is an inverse relationship between catastrophe frequency and growth rate (Walker et al., 1988).
Time-lapse images were recorded using an inverted Eclipse Ti microscope (Nikon) with an Apochromat 60 × 1.49 N.A or 100 × 1.49 N.A oil immersion objective (Nikon) equipped with an iLas2 TIRF system (Roper Scientific), a cooled charge-coupled device camera (EMCCD Evolve 512, Photometrics) or a Prime 95B sCMOS (Photometrics), and a warm stage controller (LINKAM MC60) controlled by MetaMorph Microscopy Automation and Image Analysis Software (RRID:SCR_002368) 7.10.3.279 version (Molecular Devices). 491-nm and 561-nm lasers were used to excite the fluorescent molecules and time-lapse images were acquired at a rate of one frame per 2 or 5 s with an exposure time of 100 ms at 35°C. All experiments described below were recorded at 35°C.
Quantification of GDP- and GTP-tubulin incorporation in growing microtubules
To evaluate the incorporation of fluorescent GDP- or GTP-tubulin in growing microtubules (Fig. S1 F), microtubules were assembled in TIRF buffer in different conditions: 3.75 µM red-fluorescent GDP-tubulin and 21.25 µM GTP-tubulin with (condition 1) and without (condition 2) 1 mM GTP, 0.25 µM red-fluorescent GDP-tubulin, and 21.25 µM GTP-tubulin with 1 mM GTP (condition 3). Images were acquired by TIRF microscopy every 2 s for 30 min with the same acquisition setup and laser intensity. The fluorescence intensity of the microtubule lattice in the different conditions was measured on movies using ImageJ by calculating the average intensity of a 1-pixel-thick line trace along the microtubule. The same region was used to estimate the background contribution, which was then subtracted from the initial signal. Lattice intensities of microtubules growing from the plus and minus ends of the seeds were similar and thus pooled. Signal intensities were normalized to the mean intensity of condition 1.
Dilution-induced microtubule minus-end depolymerization assay
GDP-tubulin-assembled microtubules were grown in a perfusion chamber from red microtubule seeds with 260 µM ATTO-565-labeled (5–10%) GDP-tubulin (i.e., 260 µM GDP-tubulin containing 5–10% ATTO-565-labeled GDP-tubulin) in TIRF buffer. Unsealed chambers were incubated in a warm, humid atmosphere (over a water-bath at 37°C) for 45 min. Similarly, GTP-tubulin-assembled microtubules were polymerized from 25 µM ATTO-565-labeled (5–10%) GDP-tubulin in the presence of 1 mM GTP for 15 min. The chambers were then placed on the TIRF microscope stage and microtubule dynamics began to be recorded. Microtubule depolymerization was induced by perfusing warmed TIRF buffer.
Minus ends on microtubules grown from GTP-tubulin grow more slowly and are thus the shorter end (Fig. 5 B); minus ends grown from GDP-tubulin are either the only ones growing from the seed or the longest ones due to a shorter nucleation lag-time than the plus ends (Fig. 1 B and Fig. S1, G–I). We therefore used this length asymmetry to identify the minus ends and quantified their depolymerization rate using ImageJ. For representation (Fig. S1 K), a Gaussian filter was applied to improve the image contrast.
Incorporation of GTP-tubulin at the ends of GDP-tubulin-assembled microtubules
To determine the polarity of microtubules assembled from GDP-tubulin (Fig. 1, C and D) and to evaluate the stability of the GDP-tubulin-assembled lattice (Fig. 3, A and B), we first allowed microtubules to polymerize with 210 µM ATTO-488-labeled (5–10%) GDP-tubulin (i.e., 210 µM GDP-tubulin containing 5–10% ATTO-488-labeled GDP-tubulin) in the TIRF assay buffer. Unsealed chambers were incubated in a warm, humid atmosphere (over a water-bath at 37°C) for 1 h 00. The chambers were then injected with a solution containing 10 µM ATTO-565-labeled (15–20%) GDP-tubulin and 1 mM GTP in the TIRF buffer, sealed, and placed on the warm microscope stage. Time-lapse images were taken at a rate of one frame per 5 s for 1 h. Control experiments were performed using a similar procedure, by first perfusing 12 µM ATTO-488-labeled GDP-tubulin with 1 mM GTP followed by 10 µM ATTO-565-labeled GDP-tubulin with 1 mM GTP.
For analysis, we selected seeds that nucleated a distinguishable green GDP-tubulin region at only one end (first perfusion). Microtubule polarity was identified by measuring the growth speeds at both ends of the microtubules newly assembled from GTP-tubulin (second perfusion with GTP in solution).
Incorporation of GDP-tubulin at the plus end of GTP-tubulin-assembled microtubules
To observe the behavior of GDP-tubulin at the ends of GTP-tubulin-grown microtubules (Fig. 4 A), microtubules were polymerized in a perfusion chamber with 15 µM ATTO-565-labeled (10–15%) GDP-tubulin in TIRF buffer containing 250 µM GTP for 20 min over a water-bath at 37°C. We then injected 210 µM ATTO-565-labeled (5–10%) GDP-tubulin, sealed the chamber, and placed it on the microscope stage. Time-lapse images were acquired at a rate of one frame per 5 s for 60 min.
To evaluate whether the paused plus-ends of GTP-tubulin-grown microtubules remained competent for microtubule assembly (Fig. 4 B), microtubules were polymerized in a perfusion chamber with 15 µM ATTO-565-labeled (10–15%) GDP-tubulin in the TIRF buffer containing 250 µM GTP for 15–20 min over a water bath at 37°C. We then injected 210 µM ATTO-488-labeled (5–10%) GDP-tubulin into the chamber and left it over the water bath at 37°C for 45 min before injecting a solution of 10 µM ATTO-565-labeled (25–30%) GDP-tubulin in TIRF buffer containing 250 µM GTP. The chamber was then sealed and placed on the warm microscope stage. Time-lapse images were acquired at a rate of one frame per 2 s for 10 min. Control experiments were performed similarly by perfusing a solution containing 15 µM of ATTO-565 labeled GDP-tubulin and 1 mM GTP, followed by a solution containing 10 µM of ATTO-565 labeled GDP-tubulin and 1 mM GTP.
To visualize GDP-tubulin incorporation at the plus ends of GTP-tubulin-assembled microtubules (Fig. 4, E and F), we injected 15 µM ATTO-565-labeled (10–15%) GDP-tubulin in TIRF buffer containing 250 µM GTP into the chamber, which was then incubated over a water bath at 37°C for 15–20 min. The chamber was then washed with 210 µM unlabeled GDP-tubulin and perfused with 210 µM ATTO-488-labeled (50%) GDP-tubulin before being left to polymerize on top of the water bath at 37°C for 15, 25, 40, or 75 min. We washed out the excess fluorescent tubulin with freshly prepared 40% glycerol in TIRF buffer without added nucleotides. This wash improves contrast during recording. Glycerol prevents dilution-induced depolymerization of microtubules. The perfusion chamber was sealed and placed on the warm microscope stage, and time-lapse images were recorded every 2 s for 3 min.
Assembly of microtubules from mixtures of GDP-tubulin and GTP-tubulin
with Ilattice = average pixel intensity measured along microtubules assembled from GDP-/GTP-tubulin mixtures; [GDP-tubtotal] = total GDP-tubulin concentration in GDP-/GTP-tubulin mixtures; [GDP-tubred] = labeled-GDP-tubulin concentration in GDP-/GTP-tubulin mixtures; and Iseed = average pixel intensity of seeds.
Lattice intensities of microtubules growing from the plus and minus ends of the seeds were similar and thus pooled.
To evaluate the stability of GDP-/GTP-tubulin-assembled lattices (Fig. S2, D and E), microtubules were first polymerized from 25 µM GTP-tubulin and 80 µM GDP-tubulin (containing 10–15% ATTO-565-labeled GDP-tubulin) in TIRF buffer without added nucleotide. After 15 min incubation over a 37°C water bath, the chamber was perfused with a solution of 14 µM ATTO-565-labeled (25–30%) GDP-tubulin with 1 mM GTP in the TIRF buffer before sealing and observation.
Assessing the effect of DCX and tau on GDP-tubulin assembly
Experiments were conducted in perfusion chambers containing GMPCPP seeds, as described above. We injected 50, 100, or 210 µM of unlabeled GDP-tubulin in the presence of 500 nM DCX-sfGFP or 500 nM tau-sfGFP in TIRF buffer into the chamber and sealed it. For control conditions, microtubules were assembled from 50, 100, or 210 µM ATTO-565-labeled (5–10%) GDP-tubulin. Time-lapse images were taken at a rate of one frame per 5 s for 1 h as described above. The intensity of the tau-sfGFP signal on the microtubule lattice and the GMPCPP seeds was calculated from the average intensity of a five-pixel-thick line traced along the microtubule after subtraction with the average intensity of a five-pixel-thick line traced in the background.
Spastin-induced severing assay
We created hybrid microtubules by first perfusing 210 µM ATTO-565 labeled (5–10%) GDP-tubulin in TIRF buffer and incubating the chamber for 1 h over the water bath at 37°C. We next perfused a solution of 15 µM ATTO-565-labeled (25–30%) GDP-tubulin in TIRF buffer containing 1 mM GTP and further incubated the chamber over the water bath at 37°C for 10 min. The chamber was then placed on the TIRF microscope and perfused with 2 µM EGFP-spastin (TIRF buffer with 30% glycerol, 2.5 mM ATP, 3 mM MgCl2, and 20 mM KCl). Glycerol was used to protect microtubules from dilution-induced depolymerization. Time-lapse images were acquired every 2 s for at least 20 min.
We analyzed microtubule fragmentation by determining the time at which the first severing event occurred, normalized to the length of the segment grown from GTP-tubulin or GDP-tubulin of the microtubule minus end.
MCAK-induced depolymerization assay
Microtubules were polymerized by perfusing 210 µM ATTO-565 labeled (5–10%) GDP-tubulin in TIRF buffer in a perfusion chamber for 50 min over a water bath at 37°C. We placed the chamber on the microscope stage (35°C) and washed out free tubulin with TIRF buffer containing 30% glycerol and 50 mM KCl. We then injected a solution containing 1 µM MCAK in TIRF buffer (with 1 mM ATP, 50 mM KCl) containing 30% glycerol and sealed the chamber. We acquired time-lapse images at a rate of one frame every 5 s.
For the control condition, we perfused 15 µM ATTO-565 labeled (15–20%) GDP-tubulin in TIRF buffer with 1 mM GTP and left it to polymerize on the microscope stage (35°C) for 3–5 min. We adapted the polymerization time so that the microtubules would have a similar length as that of GDP-tubulin-assembled microtubules. Once the proper length was reached, we stabilized the microtubules with 30% glycerol and 50 mM KCl (in TIRF buffer), then perfused them with a solution of 1 µM MCAK in TIRF buffer containing 1 mM ATP, and 50 mM KCl before sealing the chamber. Time-lapse images were acquired at a rate of one frame every 5 s. We assessed microtubule depolymerization by measuring the length of GDP-tubulin or GTP-tubulin-assembled microtubules in the first and last frames of the movie.
EB1 interaction with GDP-tubulin assembled microtubules
Experiments were carried out in perfusion chambers containing stable red GMPCPP seeds and observed using TIRF microscopy, as described above. GDP-tubulin- or GTP-tubulin-assembled microtubules were polymerized by injecting 260 µM or 8 µM ATTO-565 labeled (5–10%) tubulin respectively, in the presence of 75 nM GFP-EB1 in a modified TIRF assay buffer (TIRF buffer with 0.15% methylcellulose and supplemented with 0.1% Tween-20). 1 mM GTP was added for GTP-tubulin-assembled microtubules. In these conditions, the minus end of GDP-tubulin- and GTP-tubulin-assembled microtubules grow at a similar rate and fast enough for the EB1 comets to be detected. Samples were observed for 30 min with time-lapse images taken every 2 s. Fluorescence intensity was measured on kymographs using ImageJ software and an in-house KymoTool, as previously described (Serre et al., 2019). The fluorescence intensity of GFP-EB1 comets was calculated from the average intensity of a five-pixel-thick line traced along microtubule growing ends. The same region was used to estimate the background contribution, which was then subtracted from the initial signal. A similar procedure was used to estimate the fluorescence intensity of GFP-EB1 on the lattice. Signal intensities were normalized to the mean intensity of the background. Comparisons of EB fluorescence intensities for comets and lattices of GDP-tubulin- and GTP-tubulin-assembled microtubules were calculated from experiments performed with the same acquisition setup and laser intensity.
Image analysis and microtubule dynamics
All images were analyzed using ImageJ (Schneider et al., 2012). Movies were processed using background subtraction (rolling ball 50 pixels). With high GDP-tubulin concentrations, we averaged two to five frames to improve contrast.
We extracted parameters of microtubule dynamics from kymographs using our own KymoTool macros (Ramirez-Rios et al., 2017). We calculated growth and shrinkage rates from the slopes of growth and shrinkage events. Rescue and catastrophe frequencies were obtained, respectively, by dividing the number of events observed by the time spent in growth or shrinkage per microtubule. Because the seed’s strong fluorescence obscures the microtubule next to it, a rescue event had to be at least three pixels away from the seed for it to be recognized. In some experiments, the use of high concentrations of GDP-tubulin generates a sufficiently low signal-to-noise ratio that we might not have been able to detect very short-lived depolymerization events.
For microtubules grown sequentially from GDP-tubulin then GTP-tubulin (Fig. 3 A), or from GTP-tubulin/GDP-tubulin/GTP-tubulin (Fig. 4 B), the position of rescue events was measured with respect to the junction between GDP-tubulin-assembled- and GTP-tubulin-assembled lattices (position 0 on the graphs). For control conditions, the position of rescues was measured with respect to the junction between the two differently labeled GTP-tubulin-assembled lattices (Fig. 3 B and Fig. 4 C).
The seeded-nucleation lag time of GDP-tubulin was measured on kymographs. To evaluate the effect of tau and DCX on GDP-tubulin assembly, we measured nucleation as the percentage of seeds that elongated at least one microtubule from one end during 1 h of recording. We then calculated the percentage of seeds nucleating microtubules from one or both ends relative to the total number of nucleating seeds.
The microtubule depolymerization length before a rescue (Fig. 5 C) was measured on kymographs as the distance between a catastrophe and the following rescue. To evaluate growth persistence (Fig. 5 D), we compared the positions of two successive rescues by subtracting the position of a given rescue (relative to the seed) from the position of the previous one. A positive difference indicates persistent growth.
The percentage of polymerizing time (Fig. S2 C) was determined on kymographs by dividing the time spent in the growth phase by the total recording time.
Statistics
All data were collected from at least three independent experiments using different protein preparations. All statistical analyses were performed using GraphPad Prism (RRID:SCR_002798) version 7.0 (GraphPad Software). Values are represented as mean ± SD. Data were analyzed using two-sided Fisher’s test (Figs. 2 B, 3 C, 4 D, and 5 D; and Fig. S2, B and E), non-parametric Mann-Whitney test (Fig. 2 E and Fig. 3 E; and Fig. S1, C, D, and K), or Kruskal-Wallis ANOVA followed by post-hoc Dunn’s multiple comparison test (Figs. 2 G, 3, G and H, 4 F, 5, B and C, S1 F, and S2 C). Statistical significance was ****P < 0.0001, ***P < 0.001, **P < 0.01, *P < 0.05, ns, non-significant. The specific statistical tests used in each experiment are specified in the figure legend.
Online supplemental material
Fig. S1 (related to Figs. 1, 2, and 3) presents the characterization of GDP-tubulin-assembled microtubules. Fig. S2 (related to Fig. 5) shows that increasing GDP-/GTP-tubulin ratios favor growth at the microtubule minus end. Table S1 (related to Fig. 5) presents the dynamic parameters of microtubules assembled from various GDP-/GTP-tubulin mixtures. Video 1 (related to Fig. 1) shows the growth of microtubules assembled from seeds with GTP- and GDP-tubulin. Video 2 (related to Fig. 5) shows microtubules growing from seeds in the presence of various ratios of GTP- and GDP-tubulin.
Data availability
All data needed to evaluate the conclusions in the paper are present in the paper and/or the Supplementary Materials. The mass spectrometry proteomics data have been deposited to the ProteomeXchange Consortium via the PRIDE (Perez-Riverol et al., 2022) partner repository with the dataset identifier PXD049371. Any additional datasets, analysis details, and material recipes are available from the corresponding authors upon reasonable request.
Acknowledgments
We thank V. Barros for helping with DCX purification, C. Baverez for helping with data analysis, F. Senger for substantive input on the manuscript, V.L. Brandt for critical reading, and O. Valiron, D. Job, and J. Howard for their generous and provocative discussions. We thank Y. Saoudi and E. Denarier for their assistance in imaging at the Photonic Imaging Center of GIN (Université Grenoble Alpes, Institut National de la Santé et de la Recherche Médicale U1216) which is part of iSdV core facility certified by IBiSA label. We thank the SAM platform staff from the TBMCore unit (University of Bordeaux, CNRS UAR 3427, INSERM US005) for nucleotide quantification.
This work was supported by Centre National de la Recherche Scientifique/Institut National de la Santé et de la Recherche Médicale Défi Santé Numérique 2019 (V.S. Stoppin-Mellet) and ANR (2017-CE11-0026, I. Arnal, A. Andrieux). Proteomic experiments were partially supported by ANR under ProFI (Proteomics French Infrastructure, ANR-10-INBS-08) and GRAL, a program from the Chemistry Biology Health Graduate School of UGA (ANR-17-EURE-0003). N. Bagdadi was supported by ANR (2017-CE11-0026) and Fondation pour la Recherche Médicale (FDT202012010621), and J. Wu by the French MESR Ministry.
Author contributions: N. Bagdadi: Conceptualization, Formal analysis, Investigation, Visualization, Writing—original draft, Writing—review & editing, J. Wu: Formal analysis, Investigation, Writing—review & editing, J. Delaroche: Formal analysis, Investigation, Writing—review & editing, L. Serre: Formal analysis, Investigation, Writing—review & editing, C. Delphin: Formal analysis, Investigation, Supervision, Writing—review & editing, M. De Andrade: Formal analysis, Investigation, Writing—review & editing, M. Carcel: Formal analysis, Investigation, Writing—review & editing, H. Nawabi: Resources, Writing—review & editing, B. Pinson: Formal analysis, C. Verin: Investigation, Y. Couté: Formal analysis, Investigation, Methodology, Writing—review & editing, S. Gory-Faure: Data curation, Formal analysis, Writing—review & editing, A. Andrieux: Conceptualization, Formal analysis, Funding acquisition, Project administration, Supervision, Writing—original draft, Writing—review & editing, V. Stoppin-Mellet: Conceptualization, Data curation, Formal analysis, Funding acquisition, Investigation, Methodology, Project administration, Supervision, Validation, Visualization, Writing—original draft, Writing—review & editing, and I. Arnal: Conceptualization, Data curation, Formal analysis, Funding acquisition, Investigation, Methodology, Project administration, Supervision, Validation, Visualization, Writing—original draft, Writing—review & editing.

