


Metastasis initiates when cancer cells escape from the primary tumor, which requires changes to intercellular junctions. Claudins are transmembrane proteins that form the tight junction, and their expression is reduced in aggressive breast tumors. However, claudins’ roles during breast cancer metastasis remain unclear. We used gain- and loss-of-function genetics in organoids isolated from murine breast cancer models to establish that Cldn7 suppresses invasion and metastasis. Transcriptomic analysis revealed that Cldn7 knockdown induced smooth muscle actin (SMA)–related genes and a broader mesenchymal phenotype. We validated our results in human cell lines, fresh human tumor tissue, bulk RNA-seq, and public single-cell RNA-seq data. We consistently observed an inverse relationship between Cldn7 expression and expression of SMA-related genes. Furthermore, knockdown and overexpression of SMA-related genes demonstrated that they promote breast cancer invasion. Our data reveal that Cldn7 suppresses breast cancer invasion and metastasis through negative regulation of SMA-related and mesenchymal gene expression.
Introduction
Metastasis is the process by which tumors spread through the body and is the major driver of deaths from cancer. Escape from the primary tumor requires cancer cells to change their intercellular adhesion to detach and travel to distant organs. Since cancer cells can disseminate as clusters, adhesion need not be lost completely (Aceto et al., 2014; Cheung et al., 2016; Maddipati and Stanger, 2015). The claudins (Cldn) are a family of integral membrane proteins that connect cells to form a tight junction. Claudins create barriers with distinct properties based on tissue-specific expression of different family members with different biochemical properties (Günzel and Yu, 2013). The role of claudins in tumor growth and metastasis is complex (Martin, 2014; Martin and Jiang, 2013; Martin et al., 2011). In the colon, upregulation of Cldn1 promotes invasive and metastatic behaviors, while, in the pancreas, Cldn4 loss is associated with increased invasive and metastatic potential (de Oliveira et al., 2005; Dhawan et al., 2005; Michl et al., 2003).
Our interest in claudins is motivated by the highly aggressive nature of the “claudin-low” subtype of breast cancer. As the name suggests, a conserved feature of this form of breast cancer is the transcriptional downregulation of three claudin proteins: Cldn3, Cldn4, and Cldn7 (Herschkowitz et al., 2007; Kominsky et al., 2003). Additionally, claudin-low tumors exhibit broader changes in molecular phenotype, identified by hierarchical clustering of transcriptomic data (Herschkowitz et al., 2007). This molecular phenotype includes decreased differentiation, increased immune cell signatures, and increased mesenchymal gene expression (Pommier et al., 2020; Prat et al., 2010). Claudin-low breast tumors exhibit low mutational burden, high levels of invasion and metastasis, and worse patient outcomes (Dias et al., 2017; Fougner et al., 2019, 2020; Rädler et al., 2021; Sabatier et al., 2014). However, it remains unclear whether loss of claudin gene expression is causally related to the unique cellular and molecular features of claudin-low breast tumors.
Claudin-low tumors can be observed in any of the intrinsic breast cancer subtypes (Normal-like, Luminal A, Luminal B, and Basal-like) (Herschkowitz et al., 2007; Prat et al., 2010), with the majority being Basal-like followed by Luminal A and Normal-like (Pommier et al., 2020). It is therefore debated whether claudin-low tumors should be considered a distinct breast cancer subtype or a molecular phenotype that can be observed in any breast cancer subtype (Fougner et al., 2020). A better understanding of the molecular drivers of claudin-low breast cancer will help resolve complexities in tumor subtyping and could lead to improved diagnosis and clinical management of cancer patients.
In this study, we tested the functional consequences of knockdown of Cldn7 in genetically engineered mouse models (GEMMs) of luminal breast cancer (Guy et al., 1992a, 1992b), with validation of key conclusions in a human luminal breast cancer cell line. We discovered that Cldn7 knockdown is sufficient to increase invasion in 3D culture and metastasis in vivo. Transcriptomic analyses revealed that Cldn7 knockdown induces upregulation of several molecular signatures that are also upregulated in claudin-low breast cancer, including upregulation of smooth muscle actin (SMA)–related genes. We then demonstrated that human breast tumors exhibit an inverse relationship between Cldn7 and SMA protein levels and that both pharmacological and genetic knockdown of these SMA-related proteins inhibit cancer invasion.
Results and discussion
Cldn7 knockdown increases orthotopic metastasis in luminal breast cancer GEMMs
Since claudin-low breast cancer is highly invasive and metastatic, we hypothesized that claudins (Cldn3, Cldn4, and Cldn7) suppress these aggressive cancer cell behaviors (Rädler et al., 2021). To test this hypothesis, we used a 3D organotypic invasion assay, which assesses the invasive potential of cancer cells by embedding primary tumor organoids into a 3D matrix composed of collagen I (Fig. 1 A) (Padmanaban et al., 2020). In this assay, invasion is defined by cells migrating away from the core of the organoid via collective or disseminative modes of invasion. We previously observed that tumor organoids derived from the MMTV-Neu GEMM of Luminal A breast cancer display modest collective and disseminative invasion in this assay (Cheung et al., 2013). Immunofluorescent staining of these organoids revealed that Cldn7 expression is reduced in invading cells, relative to non-invasive cells in the organoid core (Fig. 1 B). We tested whether this phenomenon is conserved in a Luminal B model of breast cancer, MMTV-PyMT, which displays higher baseline levels of invasion (Cheung et al., 2013). We observed a similar spontaneous reduction of Cldn7 levels in invading MMTV-PyMT cancer cells in the collagen I invasion assay (Fig. 1 B). Quantification of fluorescence intensity revealed a 5.3- and 4-fold decrease in Cldn7 fluorescence intensity in invasive cells in MMTV-Neu and MMTV-PyMT organoids, respectively, relative to non-invasive cells in the organoid core (Fig. 1, C and D). In contrast, we did not observe any obvious differences between Cldn3 or Cldn4 expression and localization in invading versus non-invading cells in both GEMMs of breast cancer (Fig. S1, B and C) Therefore, the cancer cells leading collective invasion specifically reduce Cldn7 expression in both Luminal A and Luminal B GEMMs, which led us to focus on studying its role in metastasis.

Cldn7 knockdown induces invasion and metastasis in GEMMs of luminal breast cancer. (A) Schematic of in vitro 3D collagen I invasion using organoids derived from either MMTV-Neu or MMTV-PyMT GEMMs of breast cancer. Created with https://biorender.com. (B) Representative confocal images acquired at the end of the in vitro invasion assay. Organoids were stained for F-actin (phalloidin), DAPI, and immunostained for Cldn7. (C and D) Quantification of Cldn7 fluorescence intensity in the core versus invasive compartments of invading organoids for MMTV-Neu (C, n = 15, r = 3) derived organoids and MMTV-PyMT (D, n = 20, r = 3) derived organoids. ***P = 0.0002, ****P < 0.0001. (E) Schematic of spontaneous in vivo metastasis assay using organoids derived from the MMTV-Neu GEMM of breast cancer. Created with https://biorender.com. (F) Lung sections from host mice harboring tumors expressing control (non-targeting) or Cldn7 targeting shRNA constructs. Sections were immunostained for zsGreen (green), Her2/Neu (red), and DAPI (blue). Metastases are highlighted with arrows. (G) Quantification of lung metastases. Each condition contains 10 mice (n = 10) and three independent biological replicates (r = 3). *P < 0.05 (top), *P = 0.0256 (bottom). MacroMets were quantified per lung, and MicroMets were quantified as a sum of 10 lung sections per mouse. (H) Representative confocal images from control and Cldn7 knockdown organoids derived from MMTV-Neu (top) and MMTV-PyMT (bottom) GEMMs of breast cancer and cultured in the 3D collagen I invasion assay. White arrows indicate collective invasion events and magenta arrows indicate dissemination events. (I and J) Inverse circularity (1/circularity) quantification of control (non-target) sh and Cldn7 sh treated organoids from MMTV-Neu (I; control sh: n = 48, r = 3; Cldn7 sh1: n = 47, r = 3; Cldn7 sh2: n = 69, r = 3) and MMTV-PyMT (J; control sh: n = 288, r = 4; Cldn7 sh1: n = 197, r = 4; Cldn7 sh2: n = 189, r = 4). **** = P < 0.0001, **P < 0.01, *P < 0.05. (K) Representative confocal images from empty vector (FLAG) control and Cldn7-FLAG overexpressing organoids derived from MMTV-PyMT breast cancer GEMM. (L) Inverse circularity (1/circularity) quantification of organoids in K. FLAG: n = 142, r = 3 Cldn7-FLAG: n = 107, r = 3. ****P < 0.0001. Individual measurements were normalized to the mean of control values.
Cldn7 knockdown induces invasion and metastasis in GEMMs of luminal breast cancer. (A) Schematic of in vitro 3D collagen I invasion using organoids derived from either MMTV-Neu or MMTV-PyMT GEMMs of breast cancer. Created with https://biorender.com. (B) Representative confocal images acquired at the end of the in vitro invasion assay. Organoids were stained for F-actin (phalloidin), DAPI, and immunostained for Cldn7. (C and D) Quantification of Cldn7 fluorescence intensity in the core versus invasive compartments of invading organoids for MMTV-Neu (C, n = 15, r = 3) derived organoids and MMTV-PyMT (D, n = 20, r = 3) derived organoids. ***P = 0.0002, ****P < 0.0001. (E) Schematic of spontaneous in vivo metastasis assay using organoids derived from the MMTV-Neu GEMM of breast cancer. Created with https://biorender.com. (F) Lung sections from host mice harboring tumors expressing control (non-targeting) or Cldn7 targeting shRNA constructs. Sections were immunostained for zsGreen (green), Her2/Neu (red), and DAPI (blue). Metastases are highlighted with arrows. (G) Quantification of lung metastases. Each condition contains 10 mice (n = 10) and three independent biological replicates (r = 3). *P < 0.05 (top), *P = 0.0256 (bottom). MacroMets were quantified per lung, and MicroMets were quantified as a sum of 10 lung sections per mouse. (H) Representative confocal images from control and Cldn7 knockdown organoids derived from MMTV-Neu (top) and MMTV-PyMT (bottom) GEMMs of breast cancer and cultured in the 3D collagen I invasion assay. White arrows indicate collective invasion events and magenta arrows indicate dissemination events. (I and J) Inverse circularity (1/circularity) quantification of control (non-target) sh and Cldn7 sh treated organoids from MMTV-Neu (I; control sh: n = 48, r = 3; Cldn7 sh1: n = 47, r = 3; Cldn7 sh2: n = 69, r = 3) and MMTV-PyMT (J; control sh: n = 288, r = 4; Cldn7 sh1: n = 197, r = 4; Cldn7 sh2: n = 189, r = 4). **** = P < 0.0001, **P < 0.01, *P < 0.05. (K) Representative confocal images from empty vector (FLAG) control and Cldn7-FLAG overexpressing organoids derived from MMTV-PyMT breast cancer GEMM. (L) Inverse circularity (1/circularity) quantification of organoids in K. FLAG: n = 142, r = 3 Cldn7-FLAG: n = 107, r = 3. ****P < 0.0001. Individual measurements were normalized to the mean of control values.
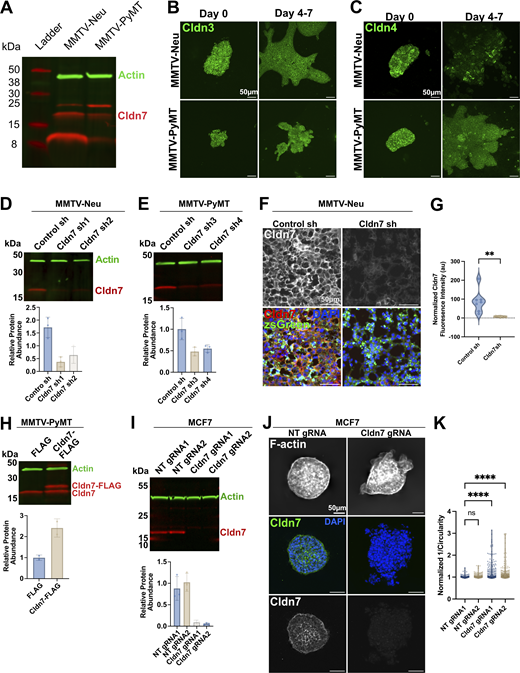
Claudin expression and genetic perturbation in luminal models of breast cancer. (A) Western blot of protein lysate isolated from MMTV-Neu and MMTV-PyMT derived tumor organoids. (B) Representative images of organoids derived from the MMTV-Neu (top) and MMTV-PyMT (bottom) GEMMs of breast cancer before (left) and after the invasion (right). Organoids were immunostained for Cldn3. (C) Representative images of organoids derived from the MMTV-Neu (top) and MMTV-PyMT (bottom) GEMMs of breast cancer before invasion (left) and after invasion (right). Organoids were immunostained for Cldn4. (D) Western blot (top) depicting knockdown efficiency of lentiviral shRNA constructs. Protein lysates were isolated from organoids after transduction with lentivirus and puromycin selection. Quantification (bottom) of blots was carried out on three independent replicates. (E) Western blot of protein lysate isolated from MMTV-PyMT organoids expressing either control (non-target) or Cldn7 targeting shRNA (top) and quantification of protein levels (bottom). (F) Representative images of tumor tissue sections obtain from tumors generated by orthotopic transplant of control (non-targeted) shRNA or Cldn7 shRNA MMTV-Neu organoids. Tumors displayed heterogenous zsGreen expression, therefore zsGreen positive regions were used for analysis. Tumor sections were immunostained for Cldn7 and zsGreen. (G) Quantification of Cldn7 fluorescence intensity. Control, n = 7, r = 3; Cldn7 sh, n = 9, r = 3, **P = 0.0011. (H) Western blot (top) of MMTV-PyMT derived organoids transduced with either empty vector (FLAG) control or Cldn7-FLAG constructs. Quantification (bottom) of western blots using two biological replicates (r = 2). (I) Western blot of protein lysate obtained from control and Cldn7 knockout cell lines. NT = non-target gRNA (top). Quantification of western blot (bottom). (J) Representative images of MCF7 spheroids cultured in the 3D collagen I invasion assay stained for F-actin (phalloidin) and Cldn7. (K) Inverse circularity quantification of control and Cldn7 knockout MCF7 spheroids. NTgRNA1, n = 292, r = 4; NTgRNA2, n = 335, r = 4; Cldn7 gRNA1, n = 288, r = 4; Cldn7 gRNA2, n = 335, r = 4. ****P < 0.0001. Source data are available for this figure: SourceData FS1.
Claudin expression and genetic perturbation in luminal models of breast cancer. (A) Western blot of protein lysate isolated from MMTV-Neu and MMTV-PyMT derived tumor organoids. (B) Representative images of organoids derived from the MMTV-Neu (top) and MMTV-PyMT (bottom) GEMMs of breast cancer before (left) and after the invasion (right). Organoids were immunostained for Cldn3. (C) Representative images of organoids derived from the MMTV-Neu (top) and MMTV-PyMT (bottom) GEMMs of breast cancer before invasion (left) and after invasion (right). Organoids were immunostained for Cldn4. (D) Western blot (top) depicting knockdown efficiency of lentiviral shRNA constructs. Protein lysates were isolated from organoids after transduction with lentivirus and puromycin selection. Quantification (bottom) of blots was carried out on three independent replicates. (E) Western blot of protein lysate isolated from MMTV-PyMT organoids expressing either control (non-target) or Cldn7 targeting shRNA (top) and quantification of protein levels (bottom). (F) Representative images of tumor tissue sections obtain from tumors generated by orthotopic transplant of control (non-targeted) shRNA or Cldn7 shRNA MMTV-Neu organoids. Tumors displayed heterogenous zsGreen expression, therefore zsGreen positive regions were used for analysis. Tumor sections were immunostained for Cldn7 and zsGreen. (G) Quantification of Cldn7 fluorescence intensity. Control, n = 7, r = 3; Cldn7 sh, n = 9, r = 3, **P = 0.0011. (H) Western blot (top) of MMTV-PyMT derived organoids transduced with either empty vector (FLAG) control or Cldn7-FLAG constructs. Quantification (bottom) of western blots using two biological replicates (r = 2). (I) Western blot of protein lysate obtained from control and Cldn7 knockout cell lines. NT = non-target gRNA (top). Quantification of western blot (bottom). (J) Representative images of MCF7 spheroids cultured in the 3D collagen I invasion assay stained for F-actin (phalloidin) and Cldn7. (K) Inverse circularity quantification of control and Cldn7 knockout MCF7 spheroids. NTgRNA1, n = 292, r = 4; NTgRNA2, n = 335, r = 4; Cldn7 gRNA1, n = 288, r = 4; Cldn7 gRNA2, n = 335, r = 4. ****P < 0.0001. Source data are available for this figure: SourceData FS1.
We first sought to test the effect of Cldn7 knockdown on spontaneous metastasis of luminal breast tumors (Guy et al., 1992a, 1992b). We chose the MMTV-Neu GEMM because it displays limited invasive and metastatic potential, thereby providing ample room to observe increases in invasion and metastasis in response to experimental intervention (Cheung et al., 2013; Guy et al., 1992a, 1992b). Briefly, we isolated organoids from primary tumors, treated them with lentivirally delivered non-targeted or Cldn7-targeted shRNA, selected with puromycin, and transplanted the organoids into cleared mammary fat pads of 4-wk-old mice (Fig. 1 E). We verified that Cldn7 was expressed at baseline in MMTV-Neu tumors, and analysis of organoids before orthotopic transplantation revealed robust knockdown of Cldn7 protein in vitro (Fig. S1 D). Dissection of the resulting primary tumors revealed substantial zsGreen positivity, indicating retention of viral gene expression, and reduced Cldn7 protein abundance in vivo (Fig. S1, F and G). We did not observe a significant difference in primary tumor growth between control or Cldn7 knockdown tumors. Next, we assessed the effects of Cldn7 knockdown on spontaneous metastasis by quantifying the number of zsGreen+ macrometastases visible on the surface of the lungs using a dissecting microscope. We observed a fourfold increase in lung metastases in mice that harbored Cldn7 knockdown primary tumors compared with control (Fig. 1, F and G). We also quantified the number of micrometastases present in lung sections stained for zsGreen and Neu/Her2 and observed a similar scale of increase in the Cldn7 knockdown group (Fig. 1 G). Cldn7 expression therefore suppresses breast cancer metastasis to the lungs.
Cldn7 restricts invasion in multiple models of luminal breast cancer
For successful metastasis, cancer cells must first invade into the surrounding extracellular matrix. To test directly whether Cldn7 restricts invasion, we infected organoids with lentiviruses coding for either non-targeted or Cldn7-targeted shRNA and then cultured them in our 3D organotypic invasion assay. Depletion of Cldn7 in MMTV-Neu–derived organoids increased collective invasion when compared with control (Fig. 1 H). Using circularity as a metric to quantify invasion, we observed a ∼2.7-fold increase in invasion of Cldn7 depleted organoids (Fig. 1 I). We also observed a ∼1.5-fold increase in invasion of MMTV-PyMT organoids, relative to a higher baseline level of invasion (Fig. 1, H and J). We then tested whether this function of Cldn7 is conserved in human cells in the well-characterized MCF7 breast cancer cell line using CRISPR/Cas9 to generate a Cldn7 knockout cell line (Fig. S1, I–K). We generated spheroids from control or Cldn7 knockout cells and then embedded them in 3D collagen I matrices. Control MCF7 spheroids displayed no invasion and remained spherical over 5–7 days of culture (Fig. S1 J). In contrast, Cldn7 knockout spheroids frequently displayed collective invasion events (Fig. S1 J). Inverse circularity measurements revealed a significant increase in the invasion of Cldn7 knockout spheroids (Fig. S1 K). Therefore, Cldn7 expression restrains invasion in murine and human models of breast cancer.
We next tested whether Cldn7 overexpression is sufficient to restrict cancer cell invasion. Overexpression of a FLAG-tagged Cldn7 construct (Cldn7-FLAG) was achieved by lentiviral transduction of organoids derived from the more invasive MMTV-PyMT GEMM. We observed robust overexpression of the Cldn7-FLAG construct (Fig. S1 H) and observed a significant decrease in invasion compared with control (Fig. 1, K and L). Taken together, these results demonstrate that Cldn7 suppresses invasion across three models of luminal breast cancer.
Cldn7 knockdown induces molecular signatures associated with claudin-low breast cancer
To determine molecular signatures that are associated with Cldn7 loss, we performed transcriptomic analyses (RNA sequencing [RNA-seq]) on MMTV-Neu Cldn7 knockdown organoids, relative to control organoids (Fig. 2 A). Principal component analysis (PCA) of bulk RNA-seq datasets revealed distinct transcriptional signatures characterizing each condition (Fig. 2 B). Differential gene expression analysis using DeSeq2 revealed 190 differentially expressed genes with an adjusted P value <0.05 and a log2fold change (FC) >0.5 (Fig. 2, B and C; and Fig. S2, A and B). In accordance with our experimental conditions, Cldn7 was the most downregulated gene in our RNA-seq datasets (Fig. S2 B). Using Hallmark datasets available in the MSigDB database (Liberzon et al., 2015), we identified four molecular signatures that are significantly (adjusted P < 0.05) enriched in Cldn7 knockdown organoids: Epithelial-to-mesenchymal transition (EMT), apical junction, myogenesis, and complement (Fig. 2 D). Previous studies identified the enrichment of all four of these pathways in transcriptomic analysis of human claudin-low tumors (Pommier et al., 2020). Therefore, our pathway-level analysis reveals that Cldn7 is negatively associated with a broader molecular phenotype similar to that observed in human claudin-low breast cancer.

Transcriptomic analysis of Cldn7 knockdown organoids reveals induction of SMA interacting genes. (A) Schematic representation of bulk RNA-seq of Cldn7 knockdown organoids. Created with https://biorender.com. (B) PCA plot of RNA-seq data. (C) Volcano plot of differentially expressed genes in Cldn7 knockdown organoids. Significance was determined by P < 0.05 and log2FC <0.5 thresholds. See Fig. S2 B for plot with Cldn7 included. (D) EnrichR was used to perform gene ontology analysis using MSigDB. (E) Expression of genes related to the SMA cytoskeleton.
Transcriptomic analysis of Cldn7 knockdown organoids reveals induction of SMA interacting genes. (A) Schematic representation of bulk RNA-seq of Cldn7 knockdown organoids. Created with https://biorender.com. (B) PCA plot of RNA-seq data. (C) Volcano plot of differentially expressed genes in Cldn7 knockdown organoids. Significance was determined by P < 0.05 and log2FC <0.5 thresholds. See Fig. S2 B for plot with Cldn7 included. (D) EnrichR was used to perform gene ontology analysis using MSigDB. (E) Expression of genes related to the SMA cytoskeleton.

Identifying reciprocal expression patterns of Cldn7 and SMA-related genes in murine and human breast cancer patient transcriptomic datasets. (A) Heatmap displaying hierarchical clustering of differentially expressed genes. (B) Volcano plot of differentially expressed genes with significance cutoff of P value <0.05, and Log2FC >0.5. (C) RT-qPCR validation of select SMA-related genes. (D–K) Transcriptomic data from the METABRIC database displaying an expression of Cldn7 (D) and SMA-related genes (E–K) in Cldn7-high and Cldn7-low tumors. ****P < 0.0001.
Identifying reciprocal expression patterns of Cldn7 and SMA-related genes in murine and human breast cancer patient transcriptomic datasets. (A) Heatmap displaying hierarchical clustering of differentially expressed genes. (B) Volcano plot of differentially expressed genes with significance cutoff of P value <0.05, and Log2FC >0.5. (C) RT-qPCR validation of select SMA-related genes. (D–K) Transcriptomic data from the METABRIC database displaying an expression of Cldn7 (D) and SMA-related genes (E–K) in Cldn7-high and Cldn7-low tumors. ****P < 0.0001.
SMA-related genes are induced upon Cldn7 depletion
We next sought to identify underlying molecular features that were induced upon Cldn7 knockdown and may contribute to increased cancer cell invasion. One of these features included upregulation of several genes associated with smooth muscle–specific actin cytoskeletal networks. The third most highly upregulated gene in our dataset was calponin1 (Cnn1), a well-characterized SMA-binding protein (Liu and Jin, 2016). We identified 62 proteins that interact with Cnn1 using the STRING protein–protein interaction database, seven of which were upregulated in our RNA-seq dataset (Fig. 2 E). These included additional SMA-binding proteins (Cnn1, Myh11, Flnc, Tagln, and Tpm2), SMA subunits (Actg2), and a TGFβ ligand (Tgfb1i1). We validated the expression of several of these genes by quantitative RT-PCR (RT-qPCR) (Fig. S2 C). Therefore, increased invasion observed in Cldn7 knockdown organoids is associated with an induction of the SMA cytoskeleton.
CLDN7 gene expression inversely correlates with SMA-related gene expression in publicly available transcriptomic datasets
Our observations in GEMMs led us to test for an association between CLDN7 deficiency and induction of SMA cytoskeletal networks in human breast tumor samples. We made use of a publicly available single-cell breast tumor atlas that aggregates single-cell RNA-seq data from 88 patients and over 230,000 cells from all clinical subtypes of breast cancer (Xu et al., 2024). We used the cell type coordinates identified by Xu et al. (2024) (Fig. 3 A) to isolate the “Cancer Epithelial Cells” population (75,883 total cells) (Fig. 3 B). We observed heterogeneous levels of CLDN7, ACTA2, ACTG2, MYH11, CNN1, TAGLN, TGFB1I1, and TPM2 expression in the cancer epithelial cell population; we did not detect FLNC expression in the epithelial cancer cells. Among expressed genes, there was a visually apparent inverse correlation between CLDN7 gene expression and SMA-related gene expression in the cancer epithelial cells (Fig. 3, D–K). To quantify this observation, we defined subpopulations of “CLDN7-high” and “CLDN7-low” cancer epithelial cells based on cells being in the >90th or <10th percentile of CLDN7 expression, respectively, with ∼3,300 cells in each group. For all SMA-related genes, except FLNC, we observed a significant increase in their gene expression in CLDN7-low cancer cells, relative to CLDN7-high cancer cells (Fig. 3 L). We also performed a parallel analysis using the METABRIC database, which contains bulk transcriptomic data from human primary breast tumors. We similarly grouped tumors into CLDN7-high and CLDN7-low groups (>90th and <10th percentile, respectively) and compared the expression of SMA-related genes in these two groups. We observed a significantly higher (P < 0.001) expression of all SMA-related genes that we measured in the CLDN7-low group compared with the CLDN7-high group (Fig. S2, D–K). We therefore consistently observed an inverse correlation between the expression of CLDN7 and the expression of SMA-related genes in human breast cancer cells and tumors.

Cldn7 and SMA interacting genes display reciprocal expression patterns in the human breast cancer single-cell tumor atlas. (A) Uniform Manifold Approximation and Projection (UMAP) dimensionality reduction analysis of single-cell data from the single-cell human breast tumor atlas (Xu et al., 2024). (B) Cancer epithelial cell subset of a single-cell human breast tumor atlas. (C) Transposition of CLDN7 expression onto the cancer epithelial cell population. (D–K) Transposition of SMA-related gene expression onto the cancer epithelial cell population. (L) Quantification of expression levels of Cldn7 and SMA-related genes in Cldn7-high- and Cldn7-low-expressing cancer epithelial cells. ****P < 0.0001, *P < 0.05, ns = not significant.
Cldn7 and SMA interacting genes display reciprocal expression patterns in the human breast cancer single-cell tumor atlas. (A) Uniform Manifold Approximation and Projection (UMAP) dimensionality reduction analysis of single-cell data from the single-cell human breast tumor atlas (Xu et al., 2024). (B) Cancer epithelial cell subset of a single-cell human breast tumor atlas. (C) Transposition of CLDN7 expression onto the cancer epithelial cell population. (D–K) Transposition of SMA-related gene expression onto the cancer epithelial cell population. (L) Quantification of expression levels of Cldn7 and SMA-related genes in Cldn7-high- and Cldn7-low-expressing cancer epithelial cells. ****P < 0.0001, *P < 0.05, ns = not significant.
Expression of Cldn7 and SMA inversely correlate in human breast tumors
We next analyzed protein levels of Cldn7 and SMA in both murine and human organoids during invasion into 3D collagen I matrices. SMA was higher in Cldn7 knockdown MMTV-Neu organoids, relative to control organoids, with the highest SMA levels in invasive and disseminated cells (Fig. 4 A). We next analyzed Cldn7 and SMA in commercially available patient-derived xenograft (PDX) models of triple-negative breast cancer (TNBC). Organoids from PDX-A express elevated levels of Cldn7 compared with PDX-B and PDX-C by western blot (Fig. S3 D). Consistent with our functional data in GEMMs, tumors from PDX-A localized Cldn7 to the plasma membrane and were negative for SMA staining, while tumors from PDX-B and PDX-C lacked plasma membrane localization of Cldn7 and stained positive for SMA (Fig. 4 B). We verified that the differences in SMA staining were specific to the cancer cells using co-staining for markers of the cancer cells (human leukocyte antigen [HLA] for PDX models and SV40 for C3(1)-Tag; Fig. S3, A and B). We observed similar results in 3D culture of organoids from these models, in which invasive cells were Cldn7 low or negative and SMA positive (Fig. 4 C). Fresh 3D culture of human breast tumor organoids recapitulated what we observed in both our murine and PDX models of breast cancer; invasive cells that lacked Cldn7 expression frequently displayed robust SMA expression (Fig. 4 D). Therefore, reciprocal expression of Cldn7 and SMA proteins is a conserved feature of both murine and human breast cancer models.

Induction of the SMA cytoskeleton in invasive Cldn7-deficient cells occurs in both mouse models and human breast cancer samples. (A) Representative confocal images of MMTV-Neu derived organoids expressing control-sh or Cldn7-sh and cultured in the 3D collagen I invasion assay. Organoids were stained with a SMA/Acta2 antibody and DAPI. (B) Representative images of tumor tissue sections obtained from PDX tumors. Tumor sections were stained with antibodies that recognize SMA/Acta2 and Cldn7. PDX-A = TM00098, PDX-B = TM00096, PDX-C = TM00089. (C) Representative confocal images of PDX derived tumor organoids cultured in the 3D collagen I invasion assay and immunostained for SMA/Acta2 and Cldn7. (D) Representative confocal images of organoids derived directly from human breast tumor specimens and grown in the 3D collagen I invasion assay. Organoids were immunostained for SMA/Acta2 (magenta) and Cldn7 (green). Arrows highlight examples of invasive cells lacking Cldn7 with SMA enrichment. Tumor #1 = invasive lobular carcinoma (ILC), tumor #2 = malignant phyllodes (MP), tumor #3 = invasive ductal carcinoma (IDC).
Induction of the SMA cytoskeleton in invasive Cldn7-deficient cells occurs in both mouse models and human breast cancer samples. (A) Representative confocal images of MMTV-Neu derived organoids expressing control-sh or Cldn7-sh and cultured in the 3D collagen I invasion assay. Organoids were stained with a SMA/Acta2 antibody and DAPI. (B) Representative images of tumor tissue sections obtained from PDX tumors. Tumor sections were stained with antibodies that recognize SMA/Acta2 and Cldn7. PDX-A = TM00098, PDX-B = TM00096, PDX-C = TM00089. (C) Representative confocal images of PDX derived tumor organoids cultured in the 3D collagen I invasion assay and immunostained for SMA/Acta2 and Cldn7. (D) Representative confocal images of organoids derived directly from human breast tumor specimens and grown in the 3D collagen I invasion assay. Organoids were immunostained for SMA/Acta2 (magenta) and Cldn7 (green). Arrows highlight examples of invasive cells lacking Cldn7 with SMA enrichment. Tumor #1 = invasive lobular carcinoma (ILC), tumor #2 = malignant phyllodes (MP), tumor #3 = invasive ductal carcinoma (IDC).
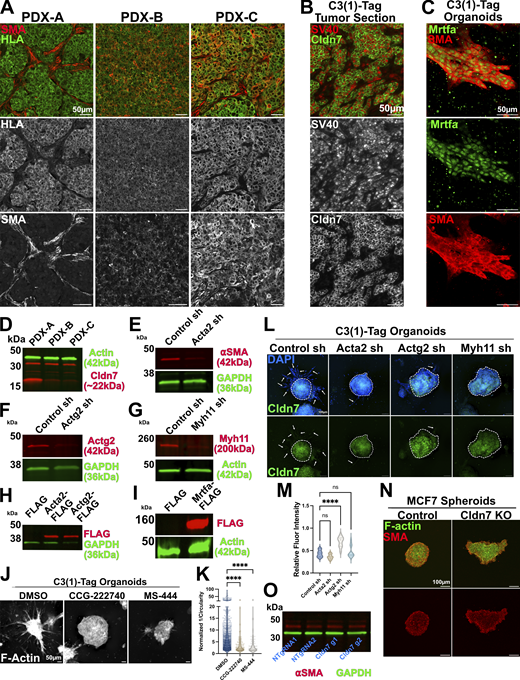
Expression and genetic perturbation of SMA-related genes. (A) Representative images of tumor tissue sections obtained from PDX tumors. Tumor sections were stained with antibodies that recognize HLA to identify cancer cells and antibodies for SMA/Acta2. PDX-A = TM00098, PDX-B = TM00096, PDX-C = TM00089. (B) Representative images of a tumor section from the C3(1)-Tag GEMM of breast cancer that was stained with antibodies that recognize SV40 to identify cancer cells and antibodies for Cldn7. (C) Representative image of an invasive organoid from the C3(1)-Tag GEMM of breast cancer stained for the myocardin-related transcription factor a (Mrtfa) and αSMA. (D) Western blot of protein lysates isolated from PDX-derived organoids. (E–G) Western blot of organoids derived from C3(1)-Tag organoids transduced with Control shRNA, Acta2 targeting shRNA (E), Actg2 targeting shRNA (F), and Myh11 targeting shRNA (G). (H) Western blot of protein lysates isolated from MMTV-Neu organoids expressing control (FLAG), Acta2-FLAG, and Actg2-FLAG constructs. (I) Western blot of protein lysates isolated from MMTV-Neu organoids expressing control (FLAG) or Mrtfa-FLAG constructs. (J) Representative images of organoids derived from the C3(1)-Tag GEMM of breast cancer and treated with the indicated inhibitors at a concentration of 33 µM. Organoids were stained for F-actin (phalloidin). (K) Inverse circularity (1/circularity) quantification of organoids treated with SMA inhibitors. DMSO n = 942, r = 2; CCG-222740 n = 138, r = 2; MS-444, n = 94, r = 2. Ordinary one-way ANOVA was used to determine significance **** = P < 0.0001. (L) Representative images of C3(1)-Tag derived organoids expressing Control (non-targeting) shRNA, or shRNA targeting Acta2, Actg2, or Myh11. These organoids were immunostained for Cldn7. Core of organoids outlined with dashed line. Arrows indicate invasive cells. (M) Quantification of Cldn7 immunofluorescence intensity relative to DAPI fluorescence intensity in organoids from L. For all conditions n = 10. Ordinary one-way ANOVA was used to determine significance **** = P < 0.0001. (N) Representative images of control and CLDN7 knockout (KO) spheroids derive from MCF7 cells. Spheroids were immunostained for SMA and stained with phalloidin (F-actin). (O) Western blot of protein lysate from control and CLDN7 KO MCF7 cell lines. Membranes were probed with ⍺SMA and GAPDH. Source data are available for this figure: SourceData FS3.
Expression and genetic perturbation of SMA-related genes. (A) Representative images of tumor tissue sections obtained from PDX tumors. Tumor sections were stained with antibodies that recognize HLA to identify cancer cells and antibodies for SMA/Acta2. PDX-A = TM00098, PDX-B = TM00096, PDX-C = TM00089. (B) Representative images of a tumor section from the C3(1)-Tag GEMM of breast cancer that was stained with antibodies that recognize SV40 to identify cancer cells and antibodies for Cldn7. (C) Representative image of an invasive organoid from the C3(1)-Tag GEMM of breast cancer stained for the myocardin-related transcription factor a (Mrtfa) and αSMA. (D) Western blot of protein lysates isolated from PDX-derived organoids. (E–G) Western blot of organoids derived from C3(1)-Tag organoids transduced with Control shRNA, Acta2 targeting shRNA (E), Actg2 targeting shRNA (F), and Myh11 targeting shRNA (G). (H) Western blot of protein lysates isolated from MMTV-Neu organoids expressing control (FLAG), Acta2-FLAG, and Actg2-FLAG constructs. (I) Western blot of protein lysates isolated from MMTV-Neu organoids expressing control (FLAG) or Mrtfa-FLAG constructs. (J) Representative images of organoids derived from the C3(1)-Tag GEMM of breast cancer and treated with the indicated inhibitors at a concentration of 33 µM. Organoids were stained for F-actin (phalloidin). (K) Inverse circularity (1/circularity) quantification of organoids treated with SMA inhibitors. DMSO n = 942, r = 2; CCG-222740 n = 138, r = 2; MS-444, n = 94, r = 2. Ordinary one-way ANOVA was used to determine significance **** = P < 0.0001. (L) Representative images of C3(1)-Tag derived organoids expressing Control (non-targeting) shRNA, or shRNA targeting Acta2, Actg2, or Myh11. These organoids were immunostained for Cldn7. Core of organoids outlined with dashed line. Arrows indicate invasive cells. (M) Quantification of Cldn7 immunofluorescence intensity relative to DAPI fluorescence intensity in organoids from L. For all conditions n = 10. Ordinary one-way ANOVA was used to determine significance **** = P < 0.0001. (N) Representative images of control and CLDN7 knockout (KO) spheroids derive from MCF7 cells. Spheroids were immunostained for SMA and stained with phalloidin (F-actin). (O) Western blot of protein lysate from control and CLDN7 KO MCF7 cell lines. Membranes were probed with ⍺SMA and GAPDH. Source data are available for this figure: SourceData FS3.
SMA-related genes regulate breast cancer invasion
We next sought to test whether expression of SMA-related genes is required for cancer invasion. Our analysis was motivated by the fact that myocardin-related transcription factors (MRTFs) can broadly regulate SMA-related genes (Olson and Nordheim, 2010) and that immunostaining for Mrtfa in C3(1)-Tag organoids revealed nuclear localization in invasive, SMA-positive cells (Fig. S3 C). First, we treated C3(1)-Tag organoids with two inhibitors of SMA cytoskeletal networks: CCG-222740 and MS-444. CCG-222740 inhibits ⍺SMA expression by restricting nuclear localization of MRTF (Haak et al., 2017; Leal et al., 2019; Wang et al., 2003), and MS-444 indirectly inhibits SMA networks by targeting smooth muscle myosin light chain kinase (Aotani and Saitoh, 1995; Nakanishi et al., 1995). Treatment with CCG-222740 and MS-444 decreased invasion by 2.1 (±0.65)- and 1.90 (±0.78)-fold, respectively (Fig. S3, J and K). Next, we used shRNA to knock down Myh11, Acta2, or Actg2 in C3(1)-Tag organoids (Fig. S3, E–G) and observed a significant decrease in invasion, as measured by inverse circularity, upon knockdown of all three genes (Fig. 5, A and C). We observed no significant effect on Cldn7 protein abundance upon knockdown of SMA-related genes, except that Actg2 showed a modest increase in Cldn7 levels (Fig. S3, L and M). Myh11, Acta2, and Actg2 are therefore required for invasion of C3(1)-Tag cancer cells. We next overexpressed Acta2, Actg2, or Mrtfa in organoids from the Cldn7-expressing MMTV-Neu GEMM (Fig. S3, H and I). Overexpression of any of Acta2, Actg2, or Mrtfa increased invasion (Fig. 5, B, D, and E). Taken together, our data revealed that SMA-related genes are required for invasion in the highly invasive C3(1)-Tag GEMM and that their forced expression is sufficient to increase invasion in the minimally invasive MMTV-Neu GEMM.

Induction of SMA-related genes promotes breast cancer cell invasion. (A) Representative images of organoids derived from C3(1)-Tag GEMM of breast cancer treated with shRNA targeting SMA-related genes (Acta2, Actg2, Myh11). zsGreen expression indicates successful transduction of organoids. (B) Representative images of organoids derived from MMTV-NEU GEMM of breast cancer overexpressing SMA-related genes (Mrtfa-FLAG, Acta2-FLAG, and Actg2-FLAG). Organoids were stained for F-actin (phalloidin). (C) Inverse circularity (1/circularity) quantification of organoids treated with shRNA. Control sh n = 163, r = 3; Myh11 sh n = 110, r = 3; Acta2 sh n = 83, r = 3; Actg2 sh n = 117, r = 3. (D) Inverse circularity (1/circularity) quantification of organoids overexpressing Mrtfa. FLAG n = 154, r = 3; Mrtfa-FLAG n = 213, r = 3. (E) Inverse circularity (1/circularity) quantification of organoids overexpressing SMA-related genes. FLAG n = 106, r = 3; Acta2-FLAG n = 144, r = 3; Actg2-FLAG n = 154, r = 3. ****P < 0.0001, ***P < 0.001, **P < 0.01. Individual measurements were normalized to the mean of control values.
Induction of SMA-related genes promotes breast cancer cell invasion. (A) Representative images of organoids derived from C3(1)-Tag GEMM of breast cancer treated with shRNA targeting SMA-related genes (Acta2, Actg2, Myh11). zsGreen expression indicates successful transduction of organoids. (B) Representative images of organoids derived from MMTV-NEU GEMM of breast cancer overexpressing SMA-related genes (Mrtfa-FLAG, Acta2-FLAG, and Actg2-FLAG). Organoids were stained for F-actin (phalloidin). (C) Inverse circularity (1/circularity) quantification of organoids treated with shRNA. Control sh n = 163, r = 3; Myh11 sh n = 110, r = 3; Acta2 sh n = 83, r = 3; Actg2 sh n = 117, r = 3. (D) Inverse circularity (1/circularity) quantification of organoids overexpressing Mrtfa. FLAG n = 154, r = 3; Mrtfa-FLAG n = 213, r = 3. (E) Inverse circularity (1/circularity) quantification of organoids overexpressing SMA-related genes. FLAG n = 106, r = 3; Acta2-FLAG n = 144, r = 3; Actg2-FLAG n = 154, r = 3. ****P < 0.0001, ***P < 0.001, **P < 0.01. Individual measurements were normalized to the mean of control values.
In this study, we demonstrated that Cldn7 suppresses luminal breast cancer invasion and metastasis. We first observed that Cldn7 protein levels were spontaneously low in the cancer cells leading to the invasion in two luminal breast cancer GEMMs. We also observed either global loss of Cldn7 across the tumor, or specific reductions in protein levels in invasive cells, in TNBC PDX models of human breast cancer. Analysis in 3D culture revealed that Cldn7 knockdown increased invasion and Cldn7 overexpression reduced invasion. We then characterized gene expression changes following Cldn7 knockdown. We observed increased expression of EMT genes, apical junction genes, and SMA-interacting genes, each of which is also upregulated in human claudin-low breast tumors. Validating our RNA-seq data, we observed reciprocal expression of SMA and Cldn7 RNA and proteins across murine and human breast tumor samples. We next established that knockdown of Myh11, Acta2, or Actg2 is sufficient to reduce invasion, and the overexpression of Mrtfa, Acta2, or Actg2 is sufficient to increase invasion, thereby establishing a functional role for these genes as invasion promoters in luminal breast cancer. Our data reveal that Cldn7 normally functions as a suppressor of invasion and metastasis through negative regulation of proinvasive gene expression, such as EMT- and SMA-related genes. Since the downregulation of a single claudin, Cldn7, was sufficient to increase metastasis, we speculate that its loss disrupts cell adhesion sufficiently to facilitate escape from primary tumors without sacrificing the cell survival benefits of epithelial organization.
The mechanisms by which cancer cells reduce Cldn7 protein levels remain an open question. One clue comes from genomic and transcriptomic profiling of claudin-low tumors, which display unique transcriptomic signatures but lack corresponding mutations that drive this subtype (Fougner et al., 2019). Their findings strongly suggest that disruptions to claudin gene expression in breast cancer are instead controlled by transcription factor activity and epigenetic mechanisms. We anticipate that Cldn7 could inhibit invasion and repress proinvasive molecular programs, through either structural or signaling mechanisms. Given that the primary function of claudins in normal cells is to establish tight junctions, our data suggest that loss of barrier function could be critical to cancer invasion. Barrier function typically relies on the cooperation of several claudin family members (Otani et al., 2019), yet we observe significant effects on invasion and metastasis following the depletion of a single claudin. Consistent with our findings, previous studies have shown that Cldn7 knockdown promotes primary tumor growth in salivary, lung, and colorectal cancers (Bhat et al., 2015; Ji et al., 2020; Lu et al., 2015; Wang et al., 2019), though its effects on metastasis were not evaluated in those studies. Our results suggest that cancer cells may not require complete destruction of tight junction-mediated barrier function to escape the primary tumor. Alternatively, Cldn7 may regulate the epithelial phenotype through direct effects on signal transduction, through several possible mechanisms. First, claudins contain a C-terminal PDZ binding motif that binds multiple adaptor proteins and transcription factors (Zihni et al., 2016). Second, claudin proteins have been detected in the nucleus (French et al., 2009), and Cldn7 may therefore directly or indirectly relay signals into the nucleus to affect gene expression.
Taken together, our study reveals a causal role for Cldn7 in suppressing breast cancer invasion and metastasis and suggests a key role for SMA-interacting proteins in promoting invasion in claudin-low breast cancer. Our work provides evidence for the concept of claudin-low breast cancer as a molecular phenotype that results directly from a reduction in claudin expression levels.
Materials and methods
Mice
Mouse husbandry and procedures were in accordance with protocols approved by the Johns Hopkins Medicine Animal Care and Use Committee. MMTV-Neu (JAX#002376) (Guy et al., 1992b), MMTV-PyMT (JAX#002374) (Guy et al., 1992a), and C3(1)-Tag (JAX#013591) (Maroulakou et al., 1994) mouse strains were obtained from the Jackson Laboratory and maintained on a FVB/n background. Three PDX models were obtained from the Jackson Laboratory (PDX-A = TM00098, PDX-B = TM00096, PDX-C = TM00089) and maintained by serial subcutaneous passaging in NOD.Cg-Prkdcscid Il2rgtm1Wjl/SzJ mice, also obtained from the Jackson Laboratory (JAX#005557). The clinical definition and tumor characteristics for the PDXs are as follows: PDX-A = triple negative (ER−/PR−/HER2−), grade 3 invasive ductal carcinoma primary malignancy sampled form the breast; PDX-B = triple negative (ER−/PR−/HER2−), AURKA, NRAS, and TP53 mutant, grade 3 invasive ductal carcinoma, metastatic tumor sampled from the lung; PDX-C = triple negative (ER−/PR−/HER2−), grade 3 invasive ductal carcinoma, primary malignancy sampled from the breast. Littermates were randomly assigned to different treatment groups and no statistical tests were used to predetermine sample size because the direction and magnitude of effect was unknown. None of the animal studies were blinded.
Human breast cancer patient samples
Tissue samples were provided by the National Cancer Institute–funded Cooperative Human Tissue Network. The clinical characteristics of tumors obtained directly from the clinic are as follows: Human tumor #1 = ER+/PR+/HER2−, grade 2 invasive lobular carcinoma, primary tumor sampled from the breast; human tumor #2 = malignant phyllodes tumor primary tumor sampled from the breast; and human tumor #3 = ER−/PR−/HER−, invasive ductal carcinoma primary tumor sampled from the breast.
Organoid isolation and 3D culture
Primary tumor organoids were isolated in accordance with published protocols (Padmanaban et al., 2020). Briefly, tumors were dissected from mice at the appropriate time point and were minced with a scalpel ∼50 times. Tumor tissue was then incubated in a 50-ml Falcon tube containing a collagenase solution for 1 h at 37°C while shaking at 180 RPM. Collagenase solution for tumors from mouse models (MMTV-Neu, MMTV-PyMT, C3(1)-Tag) was composed of DMEM-F12 (10565-018; Gibco), 5% FBS (F0926; Sigma-Aldrich), 50 μg/ml gentamicin (15750-060; Gibco), 5 μg/ml insulin (I9278; Sigma-Aldrich), 2 mg/ml collagenase (C2139; Sigma-Aldrich), and 2 mg/ml trypsin (27250-018; Gibco). Collagenase solution for tumors of human origin (PDXs, freshly isolated human tumors) was composed of DMEM (11965118; Gibco), 2 mg/ml collagenase (C2139; Sigma-Aldrich), penicillin-streptomycin 1% (P4333; Sigma-Aldrich), FBS 5% (F0926; Sigma-Aldrich), and GlutaMAX 1% (35050061; Gibco). The digested tumors were then centrifuged at 400 × g for 10 min, the pellet was resuspended in a 2 U/μl DNAse (D4263; Sigma-Aldrich) solution, and incubated at room temperature for 3 min. DNAse activity was quenched with the addition of surplus media and the solution was centrifuged 400 × g for 10 min. The pellet was resuspended in media, large tumor fragments were allowed to settle to the bottom of the tube, and the supernatant was collected into a new BSA-coated tube. The organoid fraction was separated from the immune and stromal fractions through a series of differential centrifugations at 400 × g for 3 s each. Final differential centrifugation at 100 × g for 3 s separated the large (∼200–500 cells) tumor organoids from the small (∼100 cells) tumor organoids. Large tumor organoids were then embedded in a neutralized 3D fibrillar rat tail collagen I matrix (3 mg/ml, 354236; Corning) at a density of one organoid per μl and plated in a 24-well glass bottom plate (662892; Greiner Bio One). Collagen gels were allowed to polymerize for 0.5–1 h at 37°C, after which organoid growth media was added to each well. For murine-derived organoids, organoid growth media contained DMEM-F12 (10565-018; Gibco), 1% penicillin–streptomycin (P4333; Sigma-Aldrich), 1% insulin–transferrin–selenium–ethanolamine (51500-056; Gibco), and 2.5 nM FGF2 (F0291; Sigma-Aldrich). For human-derived organoids, organoid growth media contained DMEM (11965118; Gibco), penicillin–streptomycin 1% (P4333; Sigma-Aldrich), FBS 2% (F0926; Sigma-Aldrich), GlutaMAX 1% (35050061; Gibco), insulin 5 µg/ml (I9278; Sigma-Aldrich), HEPES 10 mM (15630130; Gibco), BSA 0.057% (A9576; Sigma-Aldrich), cholera toxin 10 ng/ml (C8052; Sigma-Aldrich), hydrocortisone 0.5 µg/ml (H4001; Sigma-Aldrich), and epidermal growth factor 5 µg/ml (E9644; Sigma-Aldrich).
shRNA and cDNA lentivirus transduction
For shRNA knockdown, lentiviral plasmids encoding the pZIP-mCMV-ZsGreen-Puro vector expressing shERWOOD UltramiR shRNA were purchased from TransOmic technologies. For Cldn7, Acta2, Actg2, and Mrtfa overexpression, CLDN7 cDNA (NCBI reference #: NM_001185022.2), Acta2 cDNA (NCBI reference #: NM_007392.3), Actg2 cDNA (NCBI reference #: NM_009610.2), and Mrtfa cDNA (NCBI reference #: NM001082536.2) were independently cloned into a pGenLenti expression vector that was obtained from GeneScript. Lentivirial particles were produced in-house using the LV-MAX production system (A35684; Gibco). Lentiviral transduction was performed as described in our previous protocols (Padmanaban et al., 2020). Briefly, the virus at a multiplicity of infection of 20 was mixed with 3 μl of ViroMag R/L (RL41000; OZ Biosciences) in a final volume of 50 μl and was incubated for 30 min at ambient temperature. This solution was then mixed with 1,000 organoids and allocated into one well of a non-adherent 96-well plate (655970; Greiner BioOne). The plate was placed on a magnetic plate (MF10096; OZ Biosciences) for 90 min at 37°C and 5% CO2. After 24 h, 50 μl of virus-containing media was removed and 200 μl of fresh organoid media was added. The next day, 200 μl of media was replaced with fresh organoid media containing 3 μg/ml of puromycin (A1113803; Gibco). After 3 days of puromycin selection, the organoids were either plated in 3D fibrillar collagen I gels or used for orthotropic transplantation. shRNA that were used in this study are as follows:
Control (Non-targeting) sh (TLNSU4420): 5′-TGCTGTTGACAGTGAGCGAAGGCAGAAGTATGCAAAGCATTAGTGAAGCCACAGATGTAATGCTTTGCATACTTCTGCCTGTGCCTACTGCCTCGGA-3′.
Cldn7 sh1 (ULTRA-3339831): 5′-TGCTGTTGACAGTGAGCGAGCATGATGAGCTGCAAAATGATAGTGAAGCCACAGATGTATCATTTTGCAGCTCATCATGCCTGCCTACTGCCTCGGA-3′.
Cldn7 sh2 (ULTRA-3339833): 5′-TGCTGTTGACAGTGAGCGATGTCCAGGCAGTGAAAGCAAATAGTGAAGCCACAGATGTATTTGCTTTCACTGCCTGGACAGTGCCTACTGCCTCGGA-3′.
Acta2 sh minipool (TLMVU1410.14).
Actg2 sh minipool (TLMVU1410.15).
Myh11 sh minipool (TLMVU1410.16).
Cell culture
MCF7 cells were purchased from ATCC (HTB-22) and cultured in DMEM (11965118; Gibco) supplemented with 10% FBS (F0926; Sigma-Aldrich). Cells were cultured at 37°C and 5% CO2.
Generating Cldn7 knockout cells
Knockout cells were generated by using the CRISPR/Cas9 Gene Knockout Kit v2, which was purchased from Synthego. Guide RNAs obtained from Synthego (sequences below) were electroporated into MCF7 cells using an Amaxa Cell Line Nucleofector kit v (VCA-1003; Lonza). Cells were expanded after electroporation and clonal cell lines were generated by limiting dilution. Knockout was verified using Sanger sequencing of individual MCF7 clones.
Sequences:
Non-target sgRNA: 5′-GCACUACCAGAGCUAACUCA-3′.
Cldn7 sgRNA1: 5′-GAAAAUUAUGCCUCCACCCA-3′.
Cldn7 sgRNA2: 5′-AUGAAGUGCACGCGCUGUGG-3′.
Cldn7 sgRNA3: 5′-UAGGGCUCGAGUGGCCUGCA-3′.
Cldn7 PCR primers: Forward—5′-ACCAGGAGCAAGCTACCAAG-3′; Reverse—5′-CGCTTGGCCCAGGTCTT-3′.
Cldn7 sequencing primer: 5′-GAGACAGAATGAGGGTTTCAGTATAGTGAG-3′.
Pharmacological inhibitors
Pharmacological inhibitors were dissolved in DMSO, which was also used as a vehicle control. Inhibitors were added to the culture on day 1 at the indicated doses. The pharmacological inhibitors used were as follows: CCG-222740 (HY-121750; MedChem Express) and MS-444 (HY-100685; MedChem Express).
Immunofluorescence
Organoids in 3D collagen gels were fixed after 5–7 days in culture using 4% paraformaldehyde (PFA, 15714; Electron Microscopy Sciences) for 10 min at ambient temperature. After three PBS washes, the gels were permeabilized using 0.5% Triton X-100 (X100; Sigma-Aldrich) for 1 h at ambient temperature with gentle shaking (∼10 rpm). The samples were then blocked with 0.1% Triton X-100, 10% FBS (F0926; Sigma-Aldrich), and 1% BSA (A1595; Sigma-Aldrich) in PBS for 2 h at ambient temperature with gentle shaking. Primary antibodies were incubated overnight at 4°C in antibody dilution buffer (0.1% Triton X-100, 1% FBS, 1% BSA in PBS) with gentle shaking. After three PBS washes, the samples were incubated with secondary antibodies in antibody dilution buffer for 2 h at room temperature with gentle shaking. The samples were then washed three times with PBS and stored at 4°C until imaging.
Primary tumors used in this study were fixed in 4% PFA overnight at 4°C. After three washes in PBS, tumors were embedded in optimal cutting temperature compound (OCT; 4583; Tissue-TEK), frozen in the vapor phase of liquid nitrogen, and stored at −80°C. The tissue was sectioned at 5 µm thickness. Lung tissue was fixed in 1% PFA for 4 h, at 4°C, transferred into 25% sucrose in PBS overnight at 4°C, embedded in OCT compound, frozen in the vapor phase of liquid nitrogen, and sectioned at 20 μm thickness onto Superfrost Plus Gold Microscope slides (15-188-48; Thermo Fisher Scientific) at −20°C using a cryostat. OCT compound was removed from these slides by washing in PBS three times, 5 min each. Sections of lungs or primary tumors were next permeabilized for 1 h with 0.5% Triton X-100 in PBS, then blocked for 2 h with 10% FBS, and 1% BSA in PBS at room temperature. Primary antibodies diluted in 1% FBS, 1% BSA, and 0.1% Triton X-100 in PBS were incubated overnight at 4°C. After three washes of 10 min each using PBS, secondary antibodies were added diluted in 1% FBS, 1% BSA, 0.2% Triton X-100 in PBS and incubated for 2 h at room temperature. Samples were washed three times with PBS and mounted with Fluoromount Aqueous Mounted Medium (F4680; Sigma-Aldrich) and covered with precision coverslips (0107222; Marienfeld).
Primary antibodies used in this study for immunofluorescence were as follows: Her2/Neu (1:100, M100P; Thermo Fisher Scientific), zsGreen (1:100, 632474; Takara), Cldn7 (1:100, ab207300; Abcam), SMA/Acta2 (1:250, 14-9760-82; Thermo Fisher Scientific), Mrtfa/Mkl1 (1:100, PA5-56557; Thermo Fisher Scientific), HLA Class I ABC (1:100, 15240-1-AP; Proteintech), and SV40 (1:100, ab16879; Abcam). Secondary antibodies were conjugated with Alexa Fluor (1:200; Invitrogen). F-actin was stained with Alexa Fluor conjugated phalloidin (1:400; Thermo Fisher Scientific) and nuclei were stained with DAPI (10236276001; Roche).
Confocal microscopy and inverse circularity quantification
Confocal images were acquired using a Nikon AX R laser scanning microscope with a tunable DUX-VB gas detector (Nikon) and a 20X Plan Apo λD objective with a numerical aperture (NA) of 0.8 and an 800-µm working distance (Nikon). Images were acquired using the NIS Elements software. Individual organoid images were taken as z-stacks of 200 μm with a z-step of 5 μm. Images of the entire collagen gel were acquired with a 4x Plan Apo λD objective with a NA of 0.2 and 20,000-µm working distance (Nikon) with a z-depth of 800 µm and z-step of 30 µm. Images were analyzed with Fiji software using previously described image analysis macros (Hanley et al., 2020). Briefly, maximum intensity projections of organoids were segmented by thresholding the F-actin stained or mTomato fluorescent channel. This generated a binary image with each organoid being represented as a particle, which defined a region of interest (ROI) for each organoid. The “Analyze Particles” tool was used to measure the shape descriptors of these ROIs, which includes circularity measurements. Individual inverse circularity measurements were normalized to the mean of the control values for each biological replicate before combining data from all biological replicates. This normalization was performed to account for variability in invasion between biological replicates. For presentation purposes, noise was removed from images used in figures using the DenoiseAi function in NIS Elements (Nikon).
Protein isolation
Organoids in suspension were collected in a 1.5-ml Eppendorf tube and centrifuged at 400 × g for 5 min. Organoid pellets were washed once with PBS and then resuspended in ice-cold radioimmunopecipitation assay (RIPA) lysis buffer (1X RIPA buffer, 20–188; Millipore; 5% glycerol, G5516; Sigma-Aldrich; 0.1% SDS L3771; Sigma-Aldrich) with protease and phosphatase inhibitors (CompleteMini tablets, 11836153001; Sigma-Aldrich); PhosphoSTOP tablets, 4906837001; Sigma-Aldrich. Samples were incubated on ice for 10 min, passed through a 28-gauge syringe, then incubated a second time for 10 min on ice. Lysates were then centrifuged in a refrigerated tabletop centrifuge at 14,000 rpm for 10 min at 4°C. The supernatant was then moved to a new 1.5-ml Eppendorf tube and stored at −80°C.
Western blot
Protein lysates were quantified using a standard BCA assay kit (23227; Thermo Fisher Scientific), and equal amounts of protein were mixed with Laemmli (1610747; Bio-Rad) and β-mercaptoethanol (M3148; Sigma-Aldrich), followed by incubation at 95°C for 5 min. Samples were loaded into 4–20% Mini-PROTEAN TGX gels (4561094; Bio-Rad) and run at 120 V until the migration front reached the bottom of the gel (roughly 1 h). Gels were transferred onto polyvinylidene fluoride (PVDF) membranes (IPFL07810; Millipore) at 100 V for 1 h on ice. Membranes were then blocked with Intercept blocking buffer (927–60001; LI-COR) for 1 h at room temperature, and primary antibodies were incubated overnight at 4°C in Intercept blocking buffer. The following antibodies were used for western blotting in this study: Cldn7 (1:100, 34-9100; Thermo Fisher Scientific), Actin (1:1,000, A5441; Sigma-Aldrich), Actg2 (1:250, PA5-118926; Thermo Fisher Scientific), Myh11 (1:500, MA5-42845; Thermo Fisher Scientific), GAPDH (mouse, 1:1,000, ab8245; Abcam), GAPDH (rabbit, 1:1,000, ab181602; Abcam), and FLAG (1:500, M185-3L; MBL Lifescience). Membranes were washed three times in TBS-Tween 0.1% and then incubated with secondary antibodies for 1 h at ambient temperature. The following secondary antibodies were used: anti-mouse IRDye 680RD (926–68070; Li-cor) and anti-rabbit IRDye 800CW (926–32211; Li-Cor). Membranes were washed three times in TBS-Tween 0.1% and scanned with the Odyssey CLx imaging system. Band intensities were quantified using Fiji.
RT-qPCR
After 3D culture in the collagen I invasion assay, organoids were treated with a 2 mg/ml collagenase-PBS solution at 37°C for 10 min, with shaking at 180 rpm to release organoids from collagen gels. Organoid pellets were then dissolved in TRIzol, and RNA was isolated using the TRIzol Plus RNA purification Kit (12183555; Thermo Fisher Scientific). DNAse digestion and cDNA synthesis were carried out using SuperScript IV VILO Master Mix with ezDNase Enzyme (11766050; Thermo Fisher Scientific). 5 ng of cDNA template was mixed with primers (500 nM each) and SsoAdvanced Universal SYBR Green Supermix (1725271; BioRad) for qPCR reactions. PCR was carried out on a C1000 Thermal Cycler (CFX384 Real-Time System; BioRad) using the following conditions: 95°C for 2 min, 95°C for 5 s + 60°C for 30 s (X39), 95°C for 5 s, 65°C for 5 s, and 95°C for 5 s. Primer sequences used for qPCR are as follows:
Rplp0: Forward—5′-AGATTCGGGATATGCTGTTGGC-3′; Reverse—5′-TCGGGTCCTAGACCAGTGTTC-3′.
Acta2: Forward—5′-GTCCCAGAGATCAGGGAGTAA-3′; Reverse—5′-TCGGATACTTCAGCGTCAGGA-3′.
Actg2: Forward—5′-CCGCCCTAGACATCAGGGT-3′; Reverse—5′-TCTTCTGGTGCTACTCGAAGC-3′.
Myh11: Forward—5′-AAGCTGCGGCTAGAGGTCA-3′; Reverse—5′-CCCTCCCTTTGATGGCTGAG-3′.
Flnc: Forward—5′-GAAGGCCAACATCCGAGACAA-3′; Reverse—5′-AGGGCGAGTAAGGGATCTCAT-3′.
Tagln: Forward—5′-CAACAAGGGTCCATCCTACGG-3′; Reverse—5′-ATCTGGGCGGCCTACATCA-3′.
Orthotopic transplantation of primary tumor organoids
Organoids transduced with shRNA constructs (see shRNA lentivirus transduction section) were resuspended in a 1:1 solution of DMEM/F12:Cultrex BME (3433-010-01P; R&D Systems) at a concentration of 2 organoids/μl. 20 μl of the organoid suspension (∼40 organoids) was loaded into a microsyringe (702RN-7636-01; Hamilton). Organoids were injected into the residual portion of the fat pad of surgically cleared right #4 mammary glands in anesthetized host 4-wk-old FVB/n mice (2.5% isofluorane). Primary tumors were measured twice a week. Mice were euthanized once the experimental tumor reached 20 mm in diameter and both the primary tumor and lungs were collected.
RNA-seq library preparation and data analysis
RNA from invading organoids treated with NT-sh, Cldn7-sh1, and Cldn7-sh2 were extracted using TRIzol Plus RNA purification Kit (12183555; Thermo Fisher Scientific) followed by DNAse treatment (Cat# 79254). RNA integrity was measured using the bioanalyzer at the Johns Hopkins Experimental and Computational Genomics Core. High-quality RNA samples were sent to Genewiz from Azenta Life Sciences for mRNA library preparation using poly(A) selection and sequencing. The quality of the sequenced reads was assessed using FastQC with default parameters (Wingett and Andrews, 2018). Illumina adapter sequences were removed using Trimmomatic (Bolger et al., 2014) by performing an initial ILLUMINACLIP step and an average read quality of 20. The sequences were then mapped to the mm10 genome using RNAStar (Dobin et al., 2013) in paired-end mode and default parameters with over 90% uniquely mapped reads for all conditions. Mapped reads were then converted to gene counts using featureCounts (Liao et al., 2014) with the following parameters: unstranded, paired-end, and a minimum mapping quality per read of 10. Differential expression analysis was performed using DeSeq2_1.34.0 (Love et al., 2014) with a multifactor design accounting for all experimental groups and experimental batches. Log2FC values were then shrunk using lfcShrink with default parameters. Significant differentially expressed genes were defined using a P value cutoff of <0.05 and log2FC of |0.5|. EnrichR (Kuleshov et al., 2016) was used to perform gene ontology analysis of the differentially expressed genes using the Gene Set Enrichment Analysis molecular signatures database (MSigDB_Hallmark_2020).
Single-cell RNA-seq data processing and isolating epithelial subpopulation
To validate the inverse correlation between Cldn7 and SMA-related genes of interest at the single-cell resolution, we utilized the publicly available single-cell primary breast tumor atlas generated by Xu et al. (2024). Raw single-cell expression data was processed using the standard Seurat (v.5.1.0) R package preprocessing workflow. Cells with <200 features and genes expressed in <10 cells were omitted from analyses. Count matrices were then log normalized and scaled using the NormalizeData() function in Seurat with default settings.
METABRIC RNA-seq data analysis and stratification of datasets by Cldn7 expression
To assess the relationship between Cldn7 and SMA-related genes in patient tumors, we utilized the Molecular Taxonomy of Breast Cancer International Consortium (METABRIC) cohort datasets including 2,509 primary breast tumors (Pereira et al., 2016). cBioPortal was used to access the 2,509 datasets, and samples were stratified by Cldn7 expression into Cldn7-high and Cldn7-low subgroups using the 90th and 10th percentile as the cutoff for Cldn7 expression, respectively (Cerami et al., 2012; de Bruijn et al., 2023; Gao et al., 2013). This classification resulted in 495 patient data for each of the categories. We then assessed the normalized mRNA expression of the SMA-related genes across the patient cohort for Cldn7-high and Cldn7-low groups. To determine the significance of expression, we used the Wilcoxon signed-rank test.
Lung metastasis analysis
After fixation, lungs were visualized with a SteREO Discovery.V12 dissecting microscope (Zeiss), and the number of zsGreen positive foci visible on the surface of the lung tissue was counted manually. After freezing and cryosectioning, 10 alternating lung sections per mouse were stained with zsGreen and Her2 antibodies, and slides were imaged on an Axio Scan.Z1 microscope (Zeiss) using Zen Blue 2.1 software, a Plan-Apochromat 20x/0.80NA M27 objective, Hamamatsu Orca Flash 4.0 (fluorescence) camera for image capture, and Colibri 7 VIS-LED fluorescent light source. The resulting images were analyzed using QuPath software, where micrometastases from each mouse were counted manually and combined to obtain a measurement/10 lung sections.
Fluorescence intensity measurements
Cldn7 protein levels were measured at the cell cortex of organoids, tissue sections, and whole organoids using FIJI. For cortical measurements, the circle selection tool was used to draw a circle of 10 pixels in diameter. This circle was used to manually select cortical and cytoplasmic regions of individual cells and to measure the mean Cldn7 and DAPI fluorescence of these regions. Background subtraction was achieved by subtracting the cytoplasmic Cldn7 measurement from the cortical Cldn7 measurement. The resulting value was normalized by dividing it by the DAPI measurement. For cortical measurements, 10 individual cells were measured for each organoid or tissue section and the values were averaged to obtain per organoid or per tissue segment values. For whole organoid measurements, maximum intensity projection images of whole organoids were traced by hand, and the mean fluorescence intensity of the organoids was measured and normalized to the corresponding DAPI measurement.
Statistical analysis
All statistical tests, except the ones performed for RNA-seq analysis, were performed using GraphPad’s Prism software. To test the normality of all samples, we performed a normality and lognormality test on all of the data. For data that were distributed normally, t tests were used to compare two datasets, and ordinary one-way ANOVA followed by Dunnett’s multiple comparison test was used to compare three or more datasets. For data that were not normally distributed, we used the two-tailed Mann–Whitney test to compare two datasets and the Kruskal–Wallis test followed by Dunnetts multiple comparison tests to compare three or more datasets. The number of replicates (r) and number of measurements (n) are indicated in the figure legends.
Online supplemental material
Fig. S1 shows claudin expression and genetic perturbation in luminal models of breast cancer. Fig. S2 shows identifying reciprocal expression patterns of Cldn7 and SMA-related genes in murine and human breast cancer patient transcriptomic datasets. Fig. S3 shows expression and genetic perturbation of SMA-related genes.
Data availability
RNA-seq data generated in this study are available in the Gene Expression Omnibus (GEO accession number: GSE273512). Datasets used in Fig. 3 are publicly available through Xu et al. (2024). All other data are available upon reasonable request to the corresponding author.
Acknowledgments
We thank all members of the Ewald Laboratory for critical discussions. We acknowledge the Cooperative Human Tissue Network for the provision of deidentified human breast tumor samples.
J.J. West was supported by a Burroughs Wellcome PDEP award and a Black in Cancer/Emerald Foundation Fellowship. A.J. Ewald was supported by grants from the Breast Cancer Research Foundation (BCRF-23-048), the Jayne Koskinas Ted Giovanis Foundation, and the Giovanis Institute for Translational Cell Biology. A.J. Ewald, P. Stevenson, and G. Stein-O’Brien received support from the National Institutes of Health (NIH)/National Cancer Institute (NCI) (U01CA284090). A.J. Ewald and E.J. Fertig received support from NIH/NCI (U54CA268083 and 3P30CA006973). G. Stein-O’Brien received support from the NIH/National Institute of Neurological Disorders and Stroke (R00NS122085). P. Stevenson received support from the NIH/National Institute of General Medical Sciences (T32GM144272). E.J. Fertig received support from the Maryland Cancer Moonshot Research Grant to the Johns Hopkins Medical Institutions (FY24).
Author contributions: J.J. West: Conceptualization, Data curation, Formal analysis, Funding acquisition, Investigation, Methodology, Project administration, Resources, Supervision, Validation, Visualization, Writing—original draft, Writing—review & editing, R. Golloshi: Conceptualization, Data curation, Formal analysis, Investigation, Methodology, Validation, Visualization, Writing—original draft, Writing—review & editing, C.Y. Cho: Data curation, Investigation, Writing—review & editing, Y. Wang: Formal analysis, Investigation, Validation, Visualization, Writing—review & editing, P. Stevenson: Formal analysis, Visualization, Writing—original draft, Writing—review & editing, G. Stein-O’Brien: Formal analysis, Project administration, Writing—review & editing, E.J. Fertig: Data curation, Formal analysis, Supervision, Writing—review & editing, A.J. Ewald: Conceptualization, Funding acquisition, Methodology, Project administration, Resources, Supervision, Writing—original draft, Writing—review & editing.

