


The cell cortex of syncytial Drosophila embryos is patterned into cap and intercap regions by centrosomes, specific sets of proteins that are restricted to their respective regions by unknown mechanisms. Here, we found that Kinesin-1 is required for the restriction of plus- and minus-ends of centrosomal and non-centrosomal microtubules to the cap region, marked by EB1 and Patronin/Shot, respectively. Kinesin-1 also directly or indirectly restricts proteins and Rho signaling to the intercap, including the RhoGEF Pebble, Dia, Myosin II, Capping protein-α, and the polarity protein Par-1. Furthermore, we found that Par-1 is required for cap restriction of Patronin/Shot, and vice versa Patronin, for Par-1 enrichment at the intercap. In summary, our data support a model that Kinesin-1 would mediate the restriction of centrosomal and non-centrosomal microtubules to a region close to the centrosomes and exclude Rho signaling and Par-1. In addition, mutual antagonistic interactions would refine and maintain the boundary between cap and intercap and thus generate a distinct cortical pattern.
Introduction
Centrosomes act as organizers of the cell cortex. In Drosophila syncytial embryos, centrosomes trigger pole cell formation, pattern the cortex, and organize the site of membrane ingression during cellularization (Raff and Glover 1989; Postner et al., 1992; Acharya et al., 2014). As nucleators of microtubule asters, centrosomes likely act on the cell cortex via microtubules (Nance and Zallen 2011). Centrosomes also act on cortical actin (Warn et al., 1985; Stevenson et al., 2001) and promote actin nucleation through Wasp and the Arp2/3 complex (Hubert et al., 2011; Farina et al., 2016). The centrosomes also organize pericentrosomal recycling endosomes. Rab11 and its regulator Nuclear-fallout affect distribution of F-actin (Rothwell et al., 1998; Riggs et al., 2003) and have been implicated in cortical organization and apical–basal polarity (Cao et al., 2008; Calero-Cuenca et al., 2016). In Caenorhabditis elegans zygotes, centrosomes constitute the signal for anterior–posterior polarity (O’Connell et al., 2000; Colombo et al., 2003; Cowan and Hyman, 2004a, 2004b; Motegi and Sugimoto, 2006; Goehring et al., 2011). The sperm’s centrosome leads to inhibition of cortical acto-myosin contractility in the vicinity of its entry site and thus defines the prospective posterior pole. Disrupted posterior contractility triggers an anterior cortical flow dragging with the anterior determinant Partition (Par)-3, while the posterior polarity protein Par-1 accumulates at the posterior cortex. Despite these insights, the mechanistic link between centrosomes and Rho signaling, and cortical patterning has remained unclear.
Microtubules and cortex interact by diverse mechanisms. On the one hand, microtubules originating with their minus-ends at the centrosomes may inhibit or promote cortical actin nucleation via their plus-ends, including associated proteins such as EB1 (Henty-Ridilla et al., 2016). On the other hand, non-centrosomal microtubules affect the cortex via their minus-ends. For example, the minus-end binding protein Patronin binds to the linker protein Shortstop (Shot)/ACF-7 and in this way links microtubules to the F-actin cortex (Goodwin and Vale, 2010; Khanal et al., 2016; Nashchekin et al., 2016; Takeda et al., 2018). Cortical interactions of centrosomal and non-centrosomal microtubules may involve the motor proteins Dynein and Kinesins. Both types of microtubule motors have been implicated in polarization of the Drosophila oocyte and anterior–posterior patterning (Brendza et al., 2000; Schnorrer et al., 2000; Brendza et al., 2002). For example, Kinesin-1 as well as its activator Ensconsin have been implicated in oocyte polarization, cytoplasmic streaming, as well as posterior restriction of oskar mRNA (Zimyanin et al., 2008; Sung et al., 2008).
Starting as a syncytium, Drosophila embryos form cells and the first epithelium only in interphase 14 about 3 h after fertilization in a process termed cellularization (Sokac et al., 2023). A feature of the syncytial–cellular transition is the change in cortical patterning and organization (Schmidt and Großhans, 2018). The cortex contains prominent caps rich in Arp2/3-dependent branched F-actin above centrosomes (Warn et al., 1985; Karr and Alberts, 1986; Zallen et al., 2002) and intercap regions rich in Myosin II during syncytial interphases 10 to 13 (Royou et al., 2002), which transform into metaphase furrows during mitosis. Although the function of the cortical pattern of cap and intercap regions and their associated actin structures are unknown, they may be important for defining sites of metaphase furrows, separating mitotic spindles, and serving as a template for the cortical patterning later in development. The syncytial pattern changes within minutes in interphase 14, into a pattern with apical, subapical, lateral, and basal domains (Schmidt and Großhans, 2018). The syncytial–cellular transition is linked to the onset of zygotic gene expression and involves a reorganization of multiple cellular processes (Schmidt et al. 2022). The peculiar nature of the transition manifests itself in the phenotypes of several mutants such as slow as molasses (slam) or Kinesin-1 (Lecuit et al., 2002; Stein et al., 2002; Acharya et al., 2014; Winkler et al., 2015). slam and Kinesin-1 mutants develop with apparent normal morphology and nuclear divisions, including metaphase furrows during syncytial stage, but fail to cellularize. In syncytial embryos, both Dynein and Kinesin-1 are detected at the cap region with cortical but not centrosomal localization of Dynein depending on Kinesin-1 (Cytrynbaum et al., 2005; Winkler et al., 2015). We hypothesize that loss of Kinesin-1 leads to a misorganized cortical cytoskeleton, impaired cortical domains in syncytial embryos, and consequently a complete failure in cellularization. To test this hypothesis, we analyzed the dependence of Rho signaling, Par-1, and Patronin on Kinesin-1 in early Drosophila embryos.
Results
Cellularization and cortical organization depend on Kinesin-1
Kinesin-1 is essential for cellularization (Winkler et al., 2015). To define its function in detail, we reassessed the phenotype in Kinesin-1–depleted embryos derived from germline-specific RNAi (Fig. S1, B–E) or from germline clones of the Kinesin heavy chain (Khc)27 amorphic allele (Fig. S1, A and G). RNAi-mediated depletion of Kinesin-1 is effective as demonstrated by imaging and western blotting (Fig. S1, B–E) and consistent with previous reports (Veeranan-Karmegam et al., 2016; Lu et al., 2016). Confirming our previous report, both mutant and RNAi embryos pass through syncytial nuclear cycles with apparently normal morphology but completely lack furrow ingression during cellularization in interphase 14 (Fig. 1, A, B, and H; and Fig. S1, A, F, and G). For technical reasons, we conducted our following experiments with Kinesin-1 RNAi embryos.

Cellularization during interphase 14 depends on Kinesin-1. (A) Images from movies of embryos with indicated genotypes in widefield optics. Kin1 germline indicates embryos from Khc27 germline clones. Arrows in yellow point to the basal tip of the ingressing plasma membrane (cellularization furrows). Kin1-GFP are embryos expressing Kinesin-1-GFP in addition to endogenous Kinesin-1. T = 0 when new nuclei appear during interphase 14/cellularization. (B and C) Living embryos with indicated genotypes expressing Kinesin-1-mKate during interphase 13. (B) Position and range of axial projections as indicated. (C) Total fluorescence of Kinesin-1-mKate. Eight embryos for each genotype. Mann-Whitney test, ***P < 0.001. (D and E) Extracts from embryos with indicated genotypes analyzed by western blotting for content of Kinesin-1 protein and α-Tubulin as loading control. (E) Signals in western blots normalized to α-Tubulin. Three (wild-type) and four (Kinesin1 RNAi) biological replicates. Unpaired t-test, **P < 0.01. (F and G) Fixed embryos of indicated genotypes stained for (F) Dlg (green, gray) and Slam (red) (sagittal section) or (G) Canoe (red, gray), Slam (green, gray), and DNA (blue). Whiskers indicate SD, scale bars 10 µm. Source data are available for this figure: SourceData FS1.

Cellularization during interphase 14 depends on Kinesin-1. (A) Images from movies of embryos with indicated genotypes in widefield optics. Kin1 germline indicates embryos from Khc27 germline clones. Arrows in yellow point to the basal tip of the ingressing plasma membrane (cellularization furrows). Kin1-GFP are embryos expressing Kinesin-1-GFP in addition to endogenous Kinesin-1. T = 0 when new nuclei appear during interphase 14/cellularization. (B and C) Living embryos with indicated genotypes expressing Kinesin-1-mKate during interphase 13. (B) Position and range of axial projections as indicated. (C) Total fluorescence of Kinesin-1-mKate. Eight embryos for each genotype. Mann-Whitney test, ***P < 0.001. (D and E) Extracts from embryos with indicated genotypes analyzed by western blotting for content of Kinesin-1 protein and α-Tubulin as loading control. (E) Signals in western blots normalized to α-Tubulin. Three (wild-type) and four (Kinesin1 RNAi) biological replicates. Unpaired t-test, **P < 0.01. (F and G) Fixed embryos of indicated genotypes stained for (F) Dlg (green, gray) and Slam (red) (sagittal section) or (G) Canoe (red, gray), Slam (green, gray), and DNA (blue). Whiskers indicate SD, scale bars 10 µm. Source data are available for this figure: SourceData FS1.

Dynamics of cortical markers and Rho sensor during cellularization depend on Kinesin-1. (A) Images from movies with widefield optics during interphase 14/cellularization. Wild type or embryos depleted for slam or Kinesin-1 by maternal RNAi. Arrows in yellow point to the tip of the cellularization furrow. T = 0 when new nuclei appear during interphase 14/cellularization. (B) Ingression of the cellularization furrow. 20 furrows in four embryos for each genotype. Whiskers indicate SD. (C–G) Images from movies with fluorescence of indicated GFP markers during the onset of cellularization. T = 0 when new furrows appear between daughter nuclei. Arrows in yellow point to new furrows. Range of axial position as indicated. Maximal intensity projection. (C) GFP-Slam labels the tip of the furrow (basal domain). (D) Dia-GFP labels furrow tip (basal domain). (E) Rho sensor. (F) Canoe-YFP labels the emergent subapical domain in interphase 14. (G) Resille-GFP labels the plasma membrane. (H) Images of fixed embryos stained for Canoe (red), Slam (green), and DNA (blue) during interphase 12 and interphase 14. Genotype as indicated. Surface view and sagittal view. (I) Schematic drawing of cortical dynamics during mitosis 13 and interphase 14 in wild-type and Kinesin-1 RNAi. Scale bars 10 µm.
Dynamics of cortical markers and Rho sensor during cellularization depend on Kinesin-1. (A) Images from movies with widefield optics during interphase 14/cellularization. Wild type or embryos depleted for slam or Kinesin-1 by maternal RNAi. Arrows in yellow point to the tip of the cellularization furrow. T = 0 when new nuclei appear during interphase 14/cellularization. (B) Ingression of the cellularization furrow. 20 furrows in four embryos for each genotype. Whiskers indicate SD. (C–G) Images from movies with fluorescence of indicated GFP markers during the onset of cellularization. T = 0 when new furrows appear between daughter nuclei. Arrows in yellow point to new furrows. Range of axial position as indicated. Maximal intensity projection. (C) GFP-Slam labels the tip of the furrow (basal domain). (D) Dia-GFP labels furrow tip (basal domain). (E) Rho sensor. (F) Canoe-YFP labels the emergent subapical domain in interphase 14. (G) Resille-GFP labels the plasma membrane. (H) Images of fixed embryos stained for Canoe (red), Slam (green), and DNA (blue) during interphase 12 and interphase 14. Genotype as indicated. Surface view and sagittal view. (I) Schematic drawing of cortical dynamics during mitosis 13 and interphase 14 in wild-type and Kinesin-1 RNAi. Scale bars 10 µm.
To define the stage when Kinesin-1 RNAi embryos deviate from normal development, we analyzed the dynamics of cortical domains in comparison with slam-depleted embryos, which show a comparable lack of cellularization (Acharya et al., 2014). The furrows in cellularization derive either from retracting metaphase furrows from the preceding mitosis (cycle 13, surrounding both daughter nuclei) or “new” furrows emerging between respective daughter nuclei in telophase (Fig. 1 I). Both the basal tips of the metaphase furrow and the cellularization furrow (the furrow canal) are labeled by Slam, Diaphanous (Dia), and Rho1 activity sensors, as previously reported (Wenzl et al., 2010; Jiang and Harris 2019; Schmidt et al., 2021). In contrast to these three basal markers, Canoe labels the subapical region (Choi et al., 2013; Schmidt et al., 2017). Both basal and subapical markers label new furrows as soon as they emerge (Fig. 1 I). We recorded movies with basal markers GFP-Slam, Dia-GFP, Rho-GFP-sensors, the subapical marker Canoe-YFP, and the general membrane marker Resille-GFP, comparing Kinesin-1 RNAi and slam RNAi embryos with wild type (Fig. 1, C–G). We defined t = 0 as the time when we first detected the new furrow after mitosis 13. For all five markers, we detected a relatively normal distribution in wild-type, slam RNAi, and Kinesin-1 RNAi embryos until the end of mitosis 13. At the onset of interphase 14 (t = 0), the basal and subapical markers, as well as the generic membrane marker failed to acquire their specific pattern at the position between daughter nuclei in Kinesin-1 RNAi embryos. At the same time, the markers lost their specific localization pattern also at the “old” furrows, whereas they normally marked the preceding metaphase furrows. In the following, the markers became widely distributed at the cortex in Kinesin-1 RNAi embryos (Fig. 1, C–G).
Impaired cortical polarization in Kinesin-1 RNAi embryos may be a consequence of failed cellularization. We compared Kinesin-1’s phenotype to slam, the prototypic cellularization mutant (Lecuit et al., 2002; Stein et al., 2002; Wenzl et al., 2010; Acharya et al., 2014). Consistent with previous reports, the cortical markers initially segregated in slam RNAi embryos (Fig. 1, C–G). We validated these observations in fixed embryos including the lateral domain marker Discs large (Dlg) (Fig. 1 H and Fig. S1 F). These data indicate that failed cellularization does not necessarily lead to defects in cortical polarization. Despite the similar morphological mutant phenotypes, Kinesin-1 has an impact on both subapical and basal markers, whereas slam specifically controls basal markers (Acharya et al., 2014). Since cortical segregation precedes the morphological defects (Fig. 1 I), the failed segregation of cortical markers is not a simple consequence of the lack of cellularization furrow.
Kinesin-1 controls Rho signaling in the intercap domain
To avoid the complication of secondary phenotypes caused by abnormal morphology during cellularization, we turned to the syncytial blastoderm stage some minutes earlier in development, which displays normal morphology after depletion of Kinesin-1. Embryos during syncytial cycles pattern their cortex into two domains, the cap and intercap regions. Caps are rich in branched F-actin, whereas the intercap region is marked by Rho signaling, acto-myosin, and capping protein (Schmidt et al., 2021; Fig. 1 H and Fig. 2 A).

Rho sensor dynamics in interphase 13 depend on Kinesin-1. (A) Images from movies of Utrophin-GFP during interphase 13. T = 0 when new actin caps formed during interphase 13 . Genotypes as indicated. (B) Images from movies for Rho sensor during mitosis 12 and interphase 13. Arrows in yellow point to intercap region. (C) Total cortical fluorescence of the Rho sensor intensity. Six embryos for each genotype. (D) Orthogonal view from reconstructions of axial image stacks. Selected nuclei marked by dashed lines. (E) Fluorescence of Rho sensor at the intercap region. 52 intercap regions in four embryos for each genotype. T = 0 when Rho sensor signal appears between daughter nuclei. Whiskers indicate SD, Mann-Whitney test, **P < 0.01, ****P < 0.0001, scale bars 10 µm.
Rho sensor dynamics in interphase 13 depend on Kinesin-1. (A) Images from movies of Utrophin-GFP during interphase 13. T = 0 when new actin caps formed during interphase 13 . Genotypes as indicated. (B) Images from movies for Rho sensor during mitosis 12 and interphase 13. Arrows in yellow point to intercap region. (C) Total cortical fluorescence of the Rho sensor intensity. Six embryos for each genotype. (D) Orthogonal view from reconstructions of axial image stacks. Selected nuclei marked by dashed lines. (E) Fluorescence of Rho sensor at the intercap region. 52 intercap regions in four embryos for each genotype. T = 0 when Rho sensor signal appears between daughter nuclei. Whiskers indicate SD, Mann-Whitney test, **P < 0.01, ****P < 0.0001, scale bars 10 µm.
We first assessed the distribution and dynamics of activated Rho with a GFP live sensor. The Rho sensor was restricted to the intercap region throughout interphase 13 in wild type forming punctae as reported previously (Jiang and Harris, 2019; Fig. 2 B and Video 1). In contrast, the sensor signal was reduced by almost half in Kinesin-1 RNAi embryos (Fig. 2, C–E; and Fig S2 B). In addition, the intercap region was widened in Kinesin-1 RNAi embryos (Fig. S2 A).
Rho sensor on the cortex in wild-type and Kinesin-1 RNAi. Rho sensor distribution during syncytial interphase in wild-type and Kinesin-1 RNAi. The movies for tracking of Rho sensor were recorded with a frame rate of 2/min. T = 0 when Rho sensor signal appears during interphase 13. Scale bars 10 µm. See Fig. 2 B for stills.
Rho sensor on the cortex in wild-type and Kinesin-1 RNAi. Rho sensor distribution during syncytial interphase in wild-type and Kinesin-1 RNAi. The movies for tracking of Rho sensor were recorded with a frame rate of 2/min. T = 0 when Rho sensor signal appears during interphase 13. Scale bars 10 µm. See Fig. 2 B for stills.
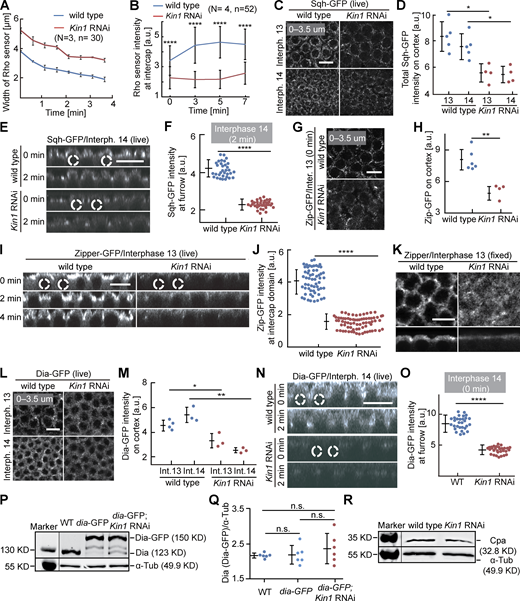
Cortical Myosin II and Dia depend on Kinesin-1. (A and B) Living embryos with indicated genotypes expressing the Rho1 sensor in interphase 13. (A) Dynamics of the width of the region with Rho sensor. 30 regions in three embryos of each genotype. (B) Fluorescence of the Rho sensor. 52 regions in four embryos of each genotype. (C–J and L–O) Living embryos of indicated genotype expressing Sqh-GFP (Myosin II regulatory light chain), Zipper-GFP (Myosin II heavy chain), or Dia-GFP during interphase 13 and interphase 14 as indicated. Sagittal views are from reconstructions of axial stacks. Position and range of axial projections as indicated. (D) Total fluorescence of Sqh-GFP. (E) Sagittal reconstructions. Selected nuclei are indicated by dashed lines. (F) Sqh-GFP fluorescence at the tip of the furrow. 33 regions in three embryos for each genotype. (G–J) Zipper-GFP during interphase 13. (H) Total fluorescence. Six (wild-type) and four (Kinesin-1 RNAi) embryos were scored. (I) Sagittal reconstructions from movies. Selected nuclei indicated by dashed lines. (J) Fluorescence at intercap regions. 60 regions in three embryos (wild type) and 72 regions in four embryos (Kinesin-1 RNAi) were scored at T = 2 min of interphase 13. (K) Fixed embryos of indicated genotype stained for Zipper. Surface and sagittal sections. (L–O) Dia-GFP fluorescence in interphase 13 and 14. (M) Total fluorescence. Interphase 13: four (wild type), three (Kinesin-1 RNAi). Interphase 14: three embryos for each genotype. (N) Sagittal reconstructions. Dashed lines indicated selected nuclei. (O) Dia-GFP fluorescence at the tip of furrows. 30 furrow tips in three embryos for each genotype at T = 0, interphase 14. (P–R) Western blots with extracts from embryos of indicated genotypes for (P and Q) Dia or (R) Cpa with α-Tubulin as loading control. T = 0 when Rho sensor, Sqh-GFP, Zipper-GFP, and Dia-GFP signal appears between daughter nuclei. Whiskers indicate SD. For M, unpaired t test, *P < 0.05, **P < 0.01, for others, Mann-Whitney test, *P < 0.05, **P < 0.01, ****P < 0.0001, scale bars 10 µm. Source data are available for this figure: SourceData FS2.

Cortical Myosin II and Dia depend on Kinesin-1. (A and B) Living embryos with indicated genotypes expressing the Rho1 sensor in interphase 13. (A) Dynamics of the width of the region with Rho sensor. 30 regions in three embryos of each genotype. (B) Fluorescence of the Rho sensor. 52 regions in four embryos of each genotype. (C–J and L–O) Living embryos of indicated genotype expressing Sqh-GFP (Myosin II regulatory light chain), Zipper-GFP (Myosin II heavy chain), or Dia-GFP during interphase 13 and interphase 14 as indicated. Sagittal views are from reconstructions of axial stacks. Position and range of axial projections as indicated. (D) Total fluorescence of Sqh-GFP. (E) Sagittal reconstructions. Selected nuclei are indicated by dashed lines. (F) Sqh-GFP fluorescence at the tip of the furrow. 33 regions in three embryos for each genotype. (G–J) Zipper-GFP during interphase 13. (H) Total fluorescence. Six (wild-type) and four (Kinesin-1 RNAi) embryos were scored. (I) Sagittal reconstructions from movies. Selected nuclei indicated by dashed lines. (J) Fluorescence at intercap regions. 60 regions in three embryos (wild type) and 72 regions in four embryos (Kinesin-1 RNAi) were scored at T = 2 min of interphase 13. (K) Fixed embryos of indicated genotype stained for Zipper. Surface and sagittal sections. (L–O) Dia-GFP fluorescence in interphase 13 and 14. (M) Total fluorescence. Interphase 13: four (wild type), three (Kinesin-1 RNAi). Interphase 14: three embryos for each genotype. (N) Sagittal reconstructions. Dashed lines indicated selected nuclei. (O) Dia-GFP fluorescence at the tip of furrows. 30 furrow tips in three embryos for each genotype at T = 0, interphase 14. (P–R) Western blots with extracts from embryos of indicated genotypes for (P and Q) Dia or (R) Cpa with α-Tubulin as loading control. T = 0 when Rho sensor, Sqh-GFP, Zipper-GFP, and Dia-GFP signal appears between daughter nuclei. Whiskers indicate SD. For M, unpaired t test, *P < 0.05, **P < 0.01, for others, Mann-Whitney test, *P < 0.05, **P < 0.01, ****P < 0.0001, scale bars 10 µm. Source data are available for this figure: SourceData FS2.
If reduced Rho signaling following Kinesin-1 depletion is relevant, a corresponding effect will be expected on Rho targets. We compared the distribution and dynamics of three direct and indirect targets, namely Dia, Myosin II/Spaghetti squash (Sqh), and Capping protein α (Cpa) in wild-type and Kinesin-1 RNAi embryos (Fig. 3 A; Schmidt et al., 2021). We measured a striking reduction of cortical Sqh-GFP fluorescence in the intercap region in Kinesin-1 RNAi during interphase 13 and early interphase 14 (Fig. 3, B and C; and Fig. S2, C–F). Consistently, we observed a ≈50% reduction of GFP-tagged Myosin II heavy chain (Zipper; Fig. S2, G–J). Correspondingly, immunostaining for Zipper was reduced in fixed Kinesin-1 RNAi embryos (Fig. S2 K).

Myosin II and Dia accumulation at the intercap region partially depend on Kinesin-1. (A) Scheme of Rho signaling with Myosin II, Dia, and Cpa as direct and indirect targets. (B and D) Orthogonal view from reconstructions of axial image stacks with indicated genotype and markers: Sqh-GFP/Myosin II (B), Dia-GFP (D). Selected nuclei indicated by dashed lines. (C and E) Fluorescence of Sqh-GFP (C) and Dia-GFP (E) within the intercap domain; 33 intercap regions in three embryos for each genotype (C), 30 intercap regions in three embryos for each genotype (E). T = 0 when Sqh-GFP and Dia-GFP signal appears between daughter nuclei. Whiskers indicate SD, Mann-Whitney test, ****P < 0.0001, scale bars 10 µm.
Myosin II and Dia accumulation at the intercap region partially depend on Kinesin-1. (A) Scheme of Rho signaling with Myosin II, Dia, and Cpa as direct and indirect targets. (B and D) Orthogonal view from reconstructions of axial image stacks with indicated genotype and markers: Sqh-GFP/Myosin II (B), Dia-GFP (D). Selected nuclei indicated by dashed lines. (C and E) Fluorescence of Sqh-GFP (C) and Dia-GFP (E) within the intercap domain; 33 intercap regions in three embryos for each genotype (C), 30 intercap regions in three embryos for each genotype (E). T = 0 when Sqh-GFP and Dia-GFP signal appears between daughter nuclei. Whiskers indicate SD, Mann-Whitney test, ****P < 0.0001, scale bars 10 µm.
The formin Dia is a direct target of active Rho1-GTP (Fig. 3 A). We analyzed dynamics and fluorescence signal of Dia-GFP. The total fluorescence of Dia-GFP at the cortex was reduced during interphase 13 and early interphase 14 in Kinesin-1 RNAi embryos (Fig. 3, D and E; and Fig. S2, L–O). The reduced signal in intercaps was obvious in surface views as well as in sagittal sections of axial reconstructed image stacks. The reduced signal is due to impaired distribution or activation of Dia, since we detected no obvious change in total Dia protein levels by western blot (Fig. S2, P and Q).
As a third, indirect target of Rho signaling, we analyzed the distribution of Cpa in fixed embryos. We observed reduced intercap restriction of Cpa during syncytial interphases (Fig. 4, A–D). In sagittal sections, Cpa is detected between the actin caps in wild type (Fig. 4 A) but uniformly distributed in the cap region in Kinesin-1 RNAi embryos (Fig. 4 B) during both interphase 11 and 13. Given the curved morphology of caps, we quantified the Cpa distribution with line profiles in images in surface view starting in the intercap region at the edges of the caps (Fig. 4 C) as well as total fluorescence (Fig. 4 D). While no significant difference was detected for F-actin, the Cpa signal was more uniform between cap and intercap in Kinesin-1 RNAi embryos. In accordance, total fluorescence was reduced for Cpa but not F-actin in Kinesin-1 RANi embryos (Fig. 4 D).

Cpa accumulation at intercap regions depends on Kinesin-1. (A and B) Images from fixed embryos stained for Cpa (green, gray) and F-actin (red, gray). Wild-type embryos were labeled with coexpression of Histon2Av-GFP. Stage and genotype as indicated. Surface view and sagittal sections. Line in yellow indicates positioning of line profiles. (C) Normalized line profiles from intercap region toward caps (interphase 13) for indicated genotypes. The solid line indicates average, band, and standard error of the mean (SEM). 20 line profiles in four embryos for each genotype. (D) Relative total fluorescence at the cortex for F-actin and Cpa. F-actin: 20 (wild type) and 24 (Kinesin-1 RNAi) regions in four embryos. Cpa, 16 measurements in four embryos of each genotype. Whiskers indicate SD, Mann-Whitney test, n.s., statistically not significant, ****P < 0.0001, scale bar 10 µm.
Cpa accumulation at intercap regions depends on Kinesin-1. (A and B) Images from fixed embryos stained for Cpa (green, gray) and F-actin (red, gray). Wild-type embryos were labeled with coexpression of Histon2Av-GFP. Stage and genotype as indicated. Surface view and sagittal sections. Line in yellow indicates positioning of line profiles. (C) Normalized line profiles from intercap region toward caps (interphase 13) for indicated genotypes. The solid line indicates average, band, and standard error of the mean (SEM). 20 line profiles in four embryos for each genotype. (D) Relative total fluorescence at the cortex for F-actin and Cpa. F-actin: 20 (wild type) and 24 (Kinesin-1 RNAi) regions in four embryos. Cpa, 16 measurements in four embryos of each genotype. Whiskers indicate SD, Mann-Whitney test, n.s., statistically not significant, ****P < 0.0001, scale bar 10 µm.
In summary, our data show that Kinesin-1 contributes to Rho signaling in the intercap region and correspondingly in actomyosin activation.
Kinesin-1 regulates Rho signaling via Pebble
Rho1 is activated by guanyl nucleotide exchange factors (RhoGEFs) and inhibited by GTPase-activating proteins (RhoGAPs). Following screening a library of tagged RhoGEFs/GAPs (di Pietro et al., 2022, Preprint), we decided to focus on the RhoGEF Pebble (Pbl). Pebble is best known for its function in cytokinesis, where it positions the cytokinetic furrow in response to a signal from microtubules (Somers and Saint, 2003; Zavortink et al., 2005; Lehner, 1992, Hime and Saint, 1992; Propopenko et al., 1999). Beside mitosis, Pebble also functions during interphase, such as in mesoderm spreading (van Impel et al., 2009). Pebble function in syncytial embryos has remained unclear (Crest et al., 2012). With a pebble allele GFP-tagged at its endogenous locus, we detected a signal at the cortex in intercap region beside the prominent nuclear localization in interphase (Fig. 5 A and Fig. S3, A–C). The signal is focused to a single sharp line in the middle of the intercap region, which was double labeled by Myosin II/Spaghetti squash (Sqh) (Fig. S3 B). The specific intercap signal was lost after Kinesin-1 depletion as revealed by reduced fluorescence and line profiles across the intercap region, whereas the signal in the nucleus was not affected (Fig. 5, A–C). Thus, in addition to Rho1 signaling, Kinesin-1 controls, at least partially, enrichment of the RhoGEF Pebble in the intercap region and thus defines Pebble as a candidate for activating Rho1 and mediating the function of Kinesin-1 on Rho1 activation.

Rho signaling via Pebble depends on Kinesin-1. (A–E) Living embryos with indicated genotypes expressing Pebble-GFP (A–C) or Rho sensor (D and E). (A) Images from movies in interphase 13. The rectangle in red indicates an exemplary position of a line profile across the intercap region. (B) 30 line profiles in three embryos for each genotype. Average (solid line) and SEM (band). Normalized and positioned to peak in wild type. (C) Pebble-GFP fluorescence within the intercap region. 52 measurements in four embryos for each genotype. (D) Orthogonal view from reconstructions of axial image stacks with indicated genotype at indicated time. Dashed lines indicated selected nuclei. (E) Fluorescence of Rho sensor within intercap region. 40 measurements in four embryos for each genotype. T = 0 when Rho sensor signal appears between daughter nuclei. Whiskers indicate SD, Mann-Whitney test, ****P < 0.0001, scale bars 10 µm.
Rho signaling via Pebble depends on Kinesin-1. (A–E) Living embryos with indicated genotypes expressing Pebble-GFP (A–C) or Rho sensor (D and E). (A) Images from movies in interphase 13. The rectangle in red indicates an exemplary position of a line profile across the intercap region. (B) 30 line profiles in three embryos for each genotype. Average (solid line) and SEM (band). Normalized and positioned to peak in wild type. (C) Pebble-GFP fluorescence within the intercap region. 52 measurements in four embryos for each genotype. (D) Orthogonal view from reconstructions of axial image stacks with indicated genotype at indicated time. Dashed lines indicated selected nuclei. (E) Fluorescence of Rho sensor within intercap region. 40 measurements in four embryos for each genotype. T = 0 when Rho sensor signal appears between daughter nuclei. Whiskers indicate SD, Mann-Whitney test, ****P < 0.0001, scale bars 10 µm.
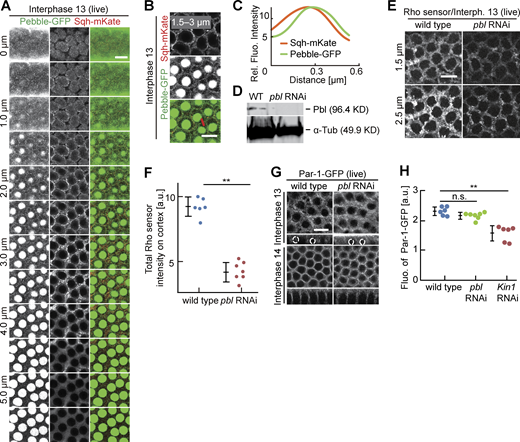
Rho signaling and Par-1 at the intercap region. (A–C) Living embryos expressing Pebble-GFP (green, gray) and Sqh-mKate (red, gray) during interphase 13. Position and range of projections as indicated. (A) Axial image stack. (B) Axial projections as indicated. The line in red indicates an exemplary position of line profiles across the intercap region. (C) Averaged line profiles positioned by maximum of Pebble-GFP profiles. (D) Western blotting for Pebble with extracts from embryos with indicated genotypes. α-Tubulin, loading control. (E and F) Living embryos with indicated genotypes expressing Rho-GFP sensor. Position of focus as indicated. (F) Total fluorescence of Rho sensor scored in six wild-type and seven pebble RNAi embryos. (G–H) Living embryos of indicated genotypes in indicated stage expressing Par-1-GFP. (G) Surface view and reconstructed axial section with selected nuclei marked by dashed lines. To compare the effect of pebble and Kinesin-1 on Par-1-GFP accumulation, wild-type images were used in both Fig. 7 A and here. (H) Par-1-GFP fluorescence scored in six wild-type, six Kinesin-1 RNAi, and seven pebble RNAi embryos. Whiskers indicate SD, Mann-Whitney test, **P < 0.01, statistically not significant, n.s., scale bars 10 µm. Source data are available for this figure: SourceData FS3.

Rho signaling and Par-1 at the intercap region. (A–C) Living embryos expressing Pebble-GFP (green, gray) and Sqh-mKate (red, gray) during interphase 13. Position and range of projections as indicated. (A) Axial image stack. (B) Axial projections as indicated. The line in red indicates an exemplary position of line profiles across the intercap region. (C) Averaged line profiles positioned by maximum of Pebble-GFP profiles. (D) Western blotting for Pebble with extracts from embryos with indicated genotypes. α-Tubulin, loading control. (E and F) Living embryos with indicated genotypes expressing Rho-GFP sensor. Position of focus as indicated. (F) Total fluorescence of Rho sensor scored in six wild-type and seven pebble RNAi embryos. (G–H) Living embryos of indicated genotypes in indicated stage expressing Par-1-GFP. (G) Surface view and reconstructed axial section with selected nuclei marked by dashed lines. To compare the effect of pebble and Kinesin-1 on Par-1-GFP accumulation, wild-type images were used in both Fig. 7 A and here. (H) Par-1-GFP fluorescence scored in six wild-type, six Kinesin-1 RNAi, and seven pebble RNAi embryos. Whiskers indicate SD, Mann-Whitney test, **P < 0.01, statistically not significant, n.s., scale bars 10 µm. Source data are available for this figure: SourceData FS3.
We tested the relevance of Pebble’s intercap localization for Rho1 signaling by depleting pebble by RNAi. Expression of pebble RNAi in the female germline leads to strongly reduced total Pebble protein levels (Fig. S3 D), indicating the suitability of the RNAi approach. We compared the Rho sensor dynamics and intensity in wild type to pebble RNAi embryos (Fig. 5, D and E; and Fig. S3, E and F). Throughout syncytial interphase, total intensity of the Rho sensor on the cortex and its accumulation at the intercap domain were reduced by half in pebble RNAi embryos (Fig. 5, D and E; and Fig. S3, E and F). These data indicate that pebble contributes to Rho activation in the intercap region. Since the depletion of pebble did not completely abolish the activation of Rho, it is likely that pebble acts in concert with other RhoGEFs.
Kinesin-1 promotes Patronin and EB1 localization in the cap region
Kinesin-1 may directly function on Pebble. For example, Kinesin-1 could transport cargo out of the cap to the intercap region. Alternatively, Kinesin-1 could indirectly control Pebble localization. An indirect mechanism is supported by the observation that Kinesin-1 is enriched at the cap region (Winkler et al., 2015). Additionally, Kinesin-1 interacts with cortical microtubules in other contexts (Lu et al., 2016, 2018, 2020). As the overall microtubule distribution does not obviously depend on Kinesin-1 as assayed in living and fixed embryos (Fig. S5 B; Winkler et al., 2015), we hypothesized that Kinesin-1 may organize cortical microtubules. Two types of microtubules are present at the cortex, microtubules originating from the centrosomes with their plus-ends at the cortex and non-centrosomal microtubules with both ends at the cortex. The minus-end marker Patronin forms a complex with Shot, which links microtubules and cortical F-actin and also labels non-centrosomal microtubules (Fig. 6 A; Nashchekin et al., 2016; Takeda et al., 2018). Presence of both non-centrosomal and centrosomal microtubules at the cortex is consistent with the cortical localization of both plus- and minus-end directed motors, Kinesin-1 and Dynein, seen in other contexts (Carminati and Stearns, 1997; Cytrynbaum et al., 2005; Winkler et al., 2015).

Cortical Patronin, Shot, and EB1 depend on Kinesin-1. (A) Centrosomal and non-centrosomal microtubules at the cortex during syncytial interphase. (B, C, F, and G) Living embryos of indicated genotypes expressing the F-actin label Moesin-RFP and Patronin-YFP (B and C) or EB1-GFP (F and G). (B) Yellow arrows point to Patronin clusters. (C) Patronin-YFP clusters within the cap region. 21 caps in three embryos for each genotype. (D and E) Fixed embryos stained for Shot (green, gray) and F-actin (red, gray). (E) Ratio of number of Shot clusters in cap versus intercap region. Four (wild-type) or five (Kinesin-1 RNAi) embryos were scored. (F) Arrows in yellow point to EB1 signal within the intercap domain. Axial position and ranges of projections as indicated. These are projection images from the time-lapse series shown in Fig. S4 D. (G) Fluorescence within intercap region normalized to total fluorescence. 24 regions in four embryos for each genotype. Whiskers indicate SD, Mann-Whitney test, statistically not significant, n. s. *P < 0.05, ****P < 0.0001, scale bars 10 µm.
Cortical Patronin, Shot, and EB1 depend on Kinesin-1. (A) Centrosomal and non-centrosomal microtubules at the cortex during syncytial interphase. (B, C, F, and G) Living embryos of indicated genotypes expressing the F-actin label Moesin-RFP and Patronin-YFP (B and C) or EB1-GFP (F and G). (B) Yellow arrows point to Patronin clusters. (C) Patronin-YFP clusters within the cap region. 21 caps in three embryos for each genotype. (D and E) Fixed embryos stained for Shot (green, gray) and F-actin (red, gray). (E) Ratio of number of Shot clusters in cap versus intercap region. Four (wild-type) or five (Kinesin-1 RNAi) embryos were scored. (F) Arrows in yellow point to EB1 signal within the intercap domain. Axial position and ranges of projections as indicated. These are projection images from the time-lapse series shown in Fig. S4 D. (G) Fluorescence within intercap region normalized to total fluorescence. 24 regions in four embryos for each genotype. Whiskers indicate SD, Mann-Whitney test, statistically not significant, n. s. *P < 0.05, ****P < 0.0001, scale bars 10 µm.
We recorded the dynamics, levels, and distribution of markers for plus- and minus-ends of microtubules, EB1 and Patronin, respectively. We detected prominent Patronin-YFP punctae, which were largely restricted to the cap region, labeled by Moesin-RFP in live, and F-actin in fixed wild type. In contrast, less staining and prominent punctae were observed following Kinesin-1 RNAi depletion (Fig. 6, B and C; and Fig. S5 A). Consistently, we observed punctae of Shot in the cap region of fixed wild-type embryos. In Kinesin-1 RNAi embryos, Shot staining was less intense and more widely distributed (Fig. 6, D and E).
We also analyzed the dynamics and distribution of the plus-end marker EB1. In wild-type embryos, the majority of EB1-GFP signal overlapped with Moesin-RFP as a marker for caps. In contrast to wild type, EB1-GFP was more uniformly distributed between cap and intercap regions in Kinesin-1 RNAi embryos, whereas Moesin-RFP remained unchanged (Fig. 6, F and G; and Fig. S4 D). The general structure of microtubules did not depend on Kinesin-1. Beside, the general pattern, turnover and growth rate did not depend on Kinesin-1 as assayed by fluorescence recovery after photobleaching (FRAP; Fig. S5, B and C) and tracking of EB1-labeled microtubules (Fig. S5, D and E). Thus, our analysis revealed a function of Kinesin-1 for the organization of cortical microtubules in the cap region.

Cortical accumulation of Par-1 depends on Kinesin1. (A–D) Living embryos with indicated genotypes expressing (A–C) Par-1-GFP or (D) EB1-GFP and Moesin-RFP. Arrays of images from movies with axial position, range, and time/stage as indicated. (C) Images from axial stacks to demonstrate the phenotypic variation in Kinesin-1 RNAi embryos. (D) Images from axial stacks in early interphase 13. Scale bars 10 µm.

Cortical accumulation of Par-1 depends on Kinesin1. (A–D) Living embryos with indicated genotypes expressing (A–C) Par-1-GFP or (D) EB1-GFP and Moesin-RFP. Arrays of images from movies with axial position, range, and time/stage as indicated. (C) Images from axial stacks to demonstrate the phenotypic variation in Kinesin-1 RNAi embryos. (D) Images from axial stacks in early interphase 13. Scale bars 10 µm.

Mutual interactions between Par-1 and Patronin. (A) Fixed embryos with indicated genotypes and stage stained for Patronin-YFP (green, gray) and F-actin (red, gray). Arrows in yellow point to Patronin clusters. (B and C) Turnover of α-Tubulin assayed by FRAP in embryos of indicated genotypes. Photobleached areas are indicated by circles in yellow. (B) Exemplary series of images from movies. (C) Fluorescence within bleached areas normalized to last pre-bleaching value. Average (solid line) and SD (band) from six embryos for each genotype. (D and E) Microtubule dynamics assayed by tracking of growing plus-ends (EB1-GFP) in embryos of indicated genotypes. (D) Exemplary images from movies. Arrows in red point to growing end. (E) Velocities calculated from tracking growing ends. 22 measurements for each genotype. Whiskers indicate SD. Mann-Whitney test, statistically not significant, n.s. (F and H) Exemplary images from movies in widefield optics of embryos with indicated genotypes during interphase 14/cellularization. Arrows in yellow point to the tip of the ingressing furrow. Arrows in red point to nuclei. T = 0 when new nuclei appear during interphase 14/cellularization. (G) Living embryos with indicated genotypes expressing EB1-GFP. Exemplary images from movies, position, and range of axial projections as indicated. Arrows in yellow point to ectopic EB1-GFP signal in the intercap region. (I and J) Fixed embryos of indicated genotypes in interphase 14/cellularization stained for (I) Bazooka (green, gray) and Slam (red, gray), sagittal sections or (J) Canoe (red, gray) and Par-1-GFP (green, gray). Position and range of axial projections as indicated. Images from two exemplary patronin RNAi embryos to show phenotypic variation. Scale bars 10 µm.

Mutual interactions between Par-1 and Patronin. (A) Fixed embryos with indicated genotypes and stage stained for Patronin-YFP (green, gray) and F-actin (red, gray). Arrows in yellow point to Patronin clusters. (B and C) Turnover of α-Tubulin assayed by FRAP in embryos of indicated genotypes. Photobleached areas are indicated by circles in yellow. (B) Exemplary series of images from movies. (C) Fluorescence within bleached areas normalized to last pre-bleaching value. Average (solid line) and SD (band) from six embryos for each genotype. (D and E) Microtubule dynamics assayed by tracking of growing plus-ends (EB1-GFP) in embryos of indicated genotypes. (D) Exemplary images from movies. Arrows in red point to growing end. (E) Velocities calculated from tracking growing ends. 22 measurements for each genotype. Whiskers indicate SD. Mann-Whitney test, statistically not significant, n.s. (F and H) Exemplary images from movies in widefield optics of embryos with indicated genotypes during interphase 14/cellularization. Arrows in yellow point to the tip of the ingressing furrow. Arrows in red point to nuclei. T = 0 when new nuclei appear during interphase 14/cellularization. (G) Living embryos with indicated genotypes expressing EB1-GFP. Exemplary images from movies, position, and range of axial projections as indicated. Arrows in yellow point to ectopic EB1-GFP signal in the intercap region. (I and J) Fixed embryos of indicated genotypes in interphase 14/cellularization stained for (I) Bazooka (green, gray) and Slam (red, gray), sagittal sections or (J) Canoe (red, gray) and Par-1-GFP (green, gray). Position and range of axial projections as indicated. Images from two exemplary patronin RNAi embryos to show phenotypic variation. Scale bars 10 µm.
Mutual antagonism between Par-1 and Patronin during syncytial interphase
Par proteins are evolutionarily conserved polarity proteins, which determine the identity of cortical domains in many systems. Among these, Par-1 has been previously shown to label and function at the metaphase furrow of syncytial embryos (Zhang et al., 2018; Jiang and Harris, 2019). Being expressed in the syncytial stage, we hypothesized that Par-1 may have a function also during interphase. Careful 3D live imaging with GFP-tagged Par-1 substituting endogenous Par-1 revealed a specific and Kinesin-1–dependent signal enriched at the intercap region, as well as the lateral furrow during cellularization (Fig. 7, A–D; and Fig. S4, A–C). In contrast with wild type, we detected a uniform distribution, as indicated by a reduced variance of line profiles and reduced total fluorescence of Par-1-GFP in Kinesin-1 RNAi embryos. Par-1 intercap enrichment seems not to depend on pebble as we measured no reduced Par-1-GFP fluorescence in pebble RNAi embryos (Fig. S3, G and H). Our data demonstrate that Kinesin-1 controls cortical distribution and intercap enrichment of the polarity protein Par-1, beside Rho signaling.

Par-1-GFP in intercaps depends on Kinesin-1. Living embryos with indicated genotype and stage expressing Par-1-GFP. (A) Images from movies. Rectangles in yellow mark the position of insets in higher magnification. Orthogonal view from reconstructions of axial image stacks. Dashed circles in white indicate selected nuclei. These are projection images from the time-lapse series shown in Fig. S4, A and B. (B) Intercap fluorescence of Par-1-GFP. 40 intercap regions in five embryos for each genotype. (C) Exemplary line profiles of Par-1-GFP in intercap regions. (D) Variance of line profiles. 52 lines in four embryos for each genotype. Whiskers indicate SD, Mann-Whitney test, ****P < 0.0001, scale bars 10 µm.
Par-1-GFP in intercaps depends on Kinesin-1. Living embryos with indicated genotype and stage expressing Par-1-GFP. (A) Images from movies. Rectangles in yellow mark the position of insets in higher magnification. Orthogonal view from reconstructions of axial image stacks. Dashed circles in white indicate selected nuclei. These are projection images from the time-lapse series shown in Fig. S4, A and B. (B) Intercap fluorescence of Par-1-GFP. 40 intercap regions in five embryos for each genotype. (C) Exemplary line profiles of Par-1-GFP in intercap regions. (D) Variance of line profiles. 52 lines in four embryos for each genotype. Whiskers indicate SD, Mann-Whitney test, ****P < 0.0001, scale bars 10 µm.
Par-1 excludes Patronin from the posterior cortex of oocytes (Nashchekin et al., 2016) and the lateral cortex in the dorsal epidermis of gastrulating embryos (Takeda et al., 2018). We hypothesized that a similar functional antagonism may also pattern the intercap and cap regions in syncytial embryos given the segregation of Patronin and Par-1 to caps and intercaps. We tested this hypothesis with embryos depleted for par-1 by maternal RNAi. For technical reasons, we employed Shot as a proxy for Patronin localization. Shot forms a complex and colocalizes with Patronin (Nashchekin et al., 2016). We detected Shot enriched at caps in wild type. In contrast, Shot was enriched in the intercap region in par-1 RNAi embryos (Fig. 8, A and B). Meanwhile, the spreading of EB1-GFP to the intercap region can be observed following par-1 depletion (Fig. S5 G). Thus, our data support a model that Par-1 functionally antagonizes cortical microtubules in syncytial embryos.

Mutual antagonism between Par-1 and Patronin/Shot. (A) Fixed embryos of indicated genotypes and stage stained for Shot (green, gray) and F-actin (red, gray). (B) Distribution of Shot between cap and intercap regions. Five embryos for each genotype. Whiskers indicate SD. Mann-Whitney test, **P < 0.01. (C) Fixed embryos of indicated genotype stained for Canoe (red, gray) and Par-1-GFP (green, gray). Two exemplary par-1 RNAi embryos are shown to indicate phenotypic variation. Position and range of axial projections as indicated. Lines in red indicate exemplary positions of line profiles. (D) Normalized line profiles from intercap region toward caps (interphase 13) for indicated genotypes. 60 line profiles in five embryos for each genotype. The solid line indicates average, band, and SD. Scale bars 10 µm.
Mutual antagonism between Par-1 and Patronin/Shot. (A) Fixed embryos of indicated genotypes and stage stained for Shot (green, gray) and F-actin (red, gray). (B) Distribution of Shot between cap and intercap regions. Five embryos for each genotype. Whiskers indicate SD. Mann-Whitney test, **P < 0.01. (C) Fixed embryos of indicated genotype stained for Canoe (red, gray) and Par-1-GFP (green, gray). Two exemplary par-1 RNAi embryos are shown to indicate phenotypic variation. Position and range of axial projections as indicated. Lines in red indicate exemplary positions of line profiles. (D) Normalized line profiles from intercap region toward caps (interphase 13) for indicated genotypes. 60 line profiles in five embryos for each genotype. The solid line indicates average, band, and SD. Scale bars 10 µm.
Next, we tested for an antagonism in reverse direction by detecting Par-1-GFP in embryos maternally depleted for patronin. patronin RNAi embryos undergo cellularization with irregular cell shapes, as reported previously (Takeda et al., 2018; Fig. S5, H–J). Whereas Par-1-GFP was restricted to the intercap region in wild-type embryos, we detected a spreading of Par-1-GFP into the cap region in patronin RNAi embryos as quantified by line profiles (Fig. 8, C and D). In a fraction of about one in five embryos, we even observed cap labeling (Fig. 8 C). Thus, we observed a mutual antagonism between Patronin/Shot and Par-1 at the cortex of syncytial embryos beside the Kinesin-1-dependent localization to caps and intercaps.
Discussion
Centrosomes possess organizer activity in syncytial Drosophila embryos involving microtubules and cortical F-actin (Raff and Glover, 1989). Though components have been identified that mediate F-actin remodeling and contractility, SCAR/Arp2/3-dependent branched F-actin in the caps and Dia- and Myosin II–dependent linear and contractile actomyosin in the intercaps (Zallen et al., 2002; Royou et al., 2002; Postner et al., 1992; Schmidt and Großhans, 2018), the mechanism and function have remained elusive for cortical polarization in syncytial stage and following cellularization when proper epithelial domains are set up for the first time. It has also remained unclear whether the same mechanisms remain active despite the transition from syncytial to cellular development. Analysis of Kinesin-1 function and mutant phenotypes has provided an entry point to these questions.
Based on our previous studies on Rho signaling in the intercap region (Schmidt et al., 2021), we investigated the spatial pattern of Rho activation in this study and identified Pebble and Kinesin-1 as upstream components. The partial phenotypes may be due to incomplete loss of function. We find it more likely, however, that additional RhoGEFs or RhoGAPs beside Pebble are involved in activation of Rho signaling in intercaps. Systematic screening for such Rho GEF/GAP regulators is feasible now, given the genome-wide library of endogenously tagged RhoGEFs and RhoGAPs (di Pietro et al., 2022 Preprint). We expect RhoGEFs are restricted to the intercap region to promote Rho activation in intercap; RhoGAPs are restricted to the cap region. Our preliminary data from screening that collection indicate a diversity of localization patterns of RhoGEFs and RhoGAPs in syncytial and cellularizing embryos, respectively.
The microtubule motors Dynein and Kinesin-1 both localize to the cortex in syncytial embryos with cortical localization of Dynein depending on Kinesin-1 (Cytrynbaum et al., 2005; Winkler et al., 2015). Kinesin-1 is essential for the transition from syncytial to cellular development, in that polarity factors, such as Canoe or Slam, do not segregate in Kinesin-1 RNAi embryos, and cellularization completely fails (Winkler et al., 2015). It remains open, however, to which extent the function of Kinesin-1 during syncytial interphases, contributes or leads to cortical patterning in interphase 14 and facilitates cellularization. It is conceivable that Kinesin-1 controls two distinct processes by independent mechanisms: cortical organization in syncytial and cellularizing embryos. Alternatively, Kinesin-1 may function in the same single mechanism during both stages. We favor the alternative option since we observed cortical patterning defects at the onset of cellularization that are related to the defects in syncytial interphases. For example, live imaging indicates failed spatial restriction of Canoe-YFP or GFP-Slam during the first few minutes of interphase 14 prior to morphological defects of cellularization.
Our study focuses on functional relationships. We did not address the detailed molecular mechanisms for how Kinesin-1 restricts Pebble and Rho signaling to the intercap region during Drosophila syncytial interphase. Exclusion of Pebble from the cap may be caused by an F-actin–based mechanism, in that Pebble prefers a cortex with contractile and linear actin filaments and with high tension, whereas Pebble would be rejected by branched F-actin since Pebble does not accumulate in the intercap region in Kinesin-1 RNAi embryos despite the normal actin caps. Pebble may be cortically positioned at maximal distance from the centrosomes by a microtubule-based mechanism, similar to its positioning at the prospective cytokinetic ring during mitosis by cortical microtubules (Somers and Saint, 2003). We favor this option. Kinesin-1 may be involved in such a microtubule-dependent mechanism directly or indirectly. For instance, Kinesin-1 may transport cargo including Pebble toward microtubule plus-ends away from the centrosome. However, it would not suffice for Pebble exclusion from the cap region. Kinesin-1 may control Pebble localization indirectly via promoting cortical interactions of centrosomal as well as non-centrosomal microtubules via their plus- and minus-ends and their binding proteins EB1 and Patronin (Somers and Saint, 2003; Zavortink et al., 2005). Such cortical interactions of microtubules may antagonize cortical localization of Pebble.
Beside controlling Rho activation, Kinesin-1 directly or indirectly promotes the enrichment of Par-1 in the intercap region. We do not know yet whether Par-1 enrichment depends on Rho signaling and its targets, such as Myosin II. Epistasis experiments will be required to resolve this issue. What we tested in this study is the functional relationship of Par-1 and Patronin/Shot. In one direction, we found that Patronin excludes Par-1 from the cap region. In the reverse direction, we found that Par-1 excludes Patronin/Shot from the intercap region, as we detected Shot accumulation in the intercap region in par-1 RNAi embryos. We have not yet conducted epistasis experiments to clarify the role of Kinesin-1 in the mutual interaction of Patronin/Shot and Par-1.
Informative for understanding the interactions leading to cortical polarization in the syncytial blastoderm may be a comparison to cortical polarization in the Drosophila oocyte and epithelial cells during gastrulation as striking mechanistic similarities exist. Par-1 excludes Patronin/Shot and microtubule ends from the posterior cortex of the oocyte and lateral plasma membrane in epithelial cells (Nashchekin et al., 2016; Takeda et al., 2018). Both intercap and posterior regions are rich in Myosin II.
Despite these similarities, there are interesting differences, which are worth a closer look. First, the timing of the processes is very different, minutes in the embryo versus many hours in the oocyte. Second, whereas the centrosomes provide the initial signal for symmetry breaking in the syncytial embryo, a signal from the posterior border cells activates Myosin II and restricts posterior Par-1 without Rho signaling in the oocycte (Doerflinger et al., 2022). Third, Kinesin-1 together with Ensconsin is engaged in posterior transport of oskar mRNA rather than Par-1 restriction (Brendza et al., 2000; Sung et al., 2008; Januschke et al., 2002). Fourth, a mutual antagonism of Bazooka (Baz)/Par-6/atypical protein kinase C (aPKC) versus Par-1 sets up a boundary in the oocyte (Doerflinger et al., 2010), whereas Baz gets involved in embryonic cortical polarization only during the course of cellularization (Schmidt et al., 2022).
However, one would expect a mutual antagonism for boundary formation. In addition to Par-1–induced exclusion of Patronin/Shot from the intercap region, we found an exclusion of Par-1 from the cap region by Patronin. Though we do not know the molecular mechanism of the mutual antagonisms, Par-1 likely acts as a protein kinase. A potential molecular link may be presented by Ensconsin, which shares with Kinesin-1 its functions for oocyte polarization and the syncytial–cellular transition (Sung et al., 2008; Winkler et al., 2015). In oocytes, Par-1 excludes Ensconsin protein from the posterior cortex by phosphorylation at conserved sites (Sung et al., 2008). Correspondingly, we may speculate that the antagonism of Par-1 on Patronin/Shot in syncytial embryos may be mediated in part by phosphorylation of Ensconsin and following loss of Kinesin-1 activity.
We revealed three functions of Kinesin-1 in this study: organization of cortical microtubules, Rho activation in intercaps, and enrichment of Par-1 in intercaps. To reconcile these three functions, we propose a speculative model with an initiation phase and a maintenance phase (Fig. 9). In the initiation phase, Kinesin-1 facilitates the initial symmetry-breaking signal from centrosomes on cortical microtubules organization, involving both centrosomal and non-centrosomal microtubules. Kinesin-1 also directly or indirectly triggers Rho signaling in the intercap region by restricting Pebble, among other GEFs. Beside the Rho targets, Dia and Myosin II, Par-1 is restricted to the intercap region. In the maintenance phase, which would be self-maintaining and independent of the signal from centrosomes, a mutual antagonism between Par-1 and Patronin/Shot takes over and stabilizes segregation of Par-1 and Patronin/Shot into two distinct domains. The molecular mechanism of the mutual inhibitions may or may not involve Kinesin-1.

Speculative model of Kinesin-1–regulated formation of cortical domains in syncytial embryos. Initially, Kinesin-1 functions in the organization of centrosomal (black line) and non-centrosomal microtubules (red lines) together with end-binding proteins EB1 and Patronin/Shot in a region closest to the centrosome, the cap region (blue). Either directly in a positive manner or indirectly via microtubules, the RhoGEF Pebble becomes restricted to the intercap region (green), where Rho signaling is activated, including Rho targets. In addition, Par-1 becomes enriched in intercap region. For maintenance, Par-1 and Patronin/Shot set up a mutual antagonism, in which Kinesin-1 and Rho signaling may or may not be involved.
Speculative model of Kinesin-1–regulated formation of cortical domains in syncytial embryos. Initially, Kinesin-1 functions in the organization of centrosomal (black line) and non-centrosomal microtubules (red lines) together with end-binding proteins EB1 and Patronin/Shot in a region closest to the centrosome, the cap region (blue). Either directly in a positive manner or indirectly via microtubules, the RhoGEF Pebble becomes restricted to the intercap region (green), where Rho signaling is activated, including Rho targets. In addition, Par-1 becomes enriched in intercap region. For maintenance, Par-1 and Patronin/Shot set up a mutual antagonism, in which Kinesin-1 and Rho signaling may or may not be involved.
It will be interesting to investigate how the interplay of different cortex structures, including F-actin and microtubules, contribute to cortical polarization and how these cortical regions contribute to proper epithelial domains that emerge during cellularization and onset of gastrulation. Future studies are needed to better define to which degree the formation of the posterior domain in oocytes, and cap and intercaps in syncytial embryos represent variations of a theme.
Materials and methods
Genetics
Fly stocks were provided by the Drosophila Stock Center, Bloomington (Whitworth, 2019), if not stated differently. Genetic markers, mutations, and annotations are described in Flybase (http://flybase.org; Thurmond et al., 2019). An attP loxP site was introduced into the pebble locus deleting the sequence between intron 8 (nt 11,380 with respect to the pebble start codon) and within the 3′ untranslated region in exon 14 (nt 15,350) by CRISPR/Cas9, generating a pebble truncation allele (pebbleattP). The two guide RNAs target sequences at positions 11,920 and 15,000. The pebble-GFP allele was generated by reinserting into the attP site the deleted genomic sequence (nt 11,380 to nt 15,350) with GFP inserted in front of the stop codon by PhiC31-mediated transgenesis following standard protocols. The obtained stock, pebble-GFP, is homozygous viable and fertile. Fly strains, antibodies, and materials used in this study are listed in Table 1.
Fly stocks
| Genetic element/strain/transgene | Notes, stock numbers, Flybase referencea | Reference |
|---|---|---|
| Oregon R | Wild-type strain | |
| Histone-2Av-GFP | Ubiquitously expressed chromatin marker | Clarkson and Saint (1999) |
| Rho1 sensor | Rho binding domain from Anillin (aa748–1,239) fused with GFP and expressed from the ubiquitin63E promoter | Munjal et al. (2015) |
| MTD-GAL4 | Maternal triple driver for high levels of GAL4 in the female germline and eggs. B-#31777 | Mazzalupo and Cooley (2006) |
| sqh-moesin-RFP | F-actin binding domain of moesin fused to mRFP and ubiquitously expressed from the Sqh promoter | Kiehart et al. (2000) |
| Patronin-YFP | YFP inserted at the stop codon of the patronin sequence at the endogenous locus | Nashchekin et al. (2016) |
| Khc-mKate | Kinesin-1 heavy chain tagged at the C-terminus with mKate2 in the endogenous locus. B-#67406, FBti0186504 | Gáspár et al. (2017) |
| Khc RNAi | shRNA for Kinesin-1 (TRiP.GL00330 attP2) expressed under control of UAS, B-#35409, FBti0144412 | Perkins et al. (2015), Winkler et al. (2015) |
| UASp-EB1-GFP | Plus-end marker of microtubules expressed from UASp | Jankovics and Brunner (2006) |
| UASp-GFP-slam | Marker for the intercap region in syncytial interphases and basal domains during cellularization | Wenzl et al. (2010) |
| UASp-Utrophin-GFP | F-actin binding domain of human Utrophin tagged with GFP and ubiquitously expressed from the Sqh promoter | Rauzi et al. (2010) |
| sqh-GFP | Myosin regulatory light chain (Sqh) tagged with GFP and expressed as a transgene by its own promoter | Royou et al. (2002) |
| sqh-mKate | Myosin regulatory light chain (Sqh) tagged with mKate and expressed as a transgene by its own promoter | Garcia De Las Bayonas et al. (2019) |
| pebble-GFP | Pebble tagged with GFP at the C-terminus at the endogenous pebble locus | This paper |
| pebble RNAi | shRNAi for pebble (TRiP.GL01092), B-#36841, FBti0146622 | Das et al. (2016) |
| dia-GFP | Dia tagged with GFP at the C-terminus at the endogenous dia locus | Schmidt et al. (2021) |
| zipper-GFP | GFP trap of zipper/Myosin II. (CC01626), B-#51564, FBti0099952 | Buszczak et al. (2007) |
| canoe-YFP | Protein trap of Canoe, CPTI000590, Kyoto stock center, #115111, FBti0144020 | Lowe et al. (2014) |
| par-1-GFP | GFP trap of Par-1 (CC01981), FBti0130199 | Lighthouse et al. (2008), Jiang and Harris (2019) |
| par-1 RNAi | shRNAi for par-1 (TRiP.GL00253), B-#35342, FBti0144338 | Jiang and Harris (2019), Perkins et al. (2015) |
| patronin RNAi | shRNAi for patronin (TRiP.HMS01547), FBti0146670 | Takeda et al. (2018) |
| Resille-GFP | GFP trap in CG8668, FBti0141278 | Takeda et al. (2018) |
| Khc27 | Amorphic allele of Kinesin-1. Recombined with Frt2R for generation of germline clones. B-# 67409, FBal0101625 | Sung et al. (2008) |
| UAS-Khc-GFP | UAS driven expression of Kinesin-1-GFP, B-#9648, FBti0076674 | BDSC cat# 9648 |
| UAS-Kif3c-HA | UAS driven expression of Kif3c, B-#93846, FBti0146622 | Mattie et al. (2010) |
| UAS-mCherry-α-Tubulin | UAS driven expression of mCherry-α-Tubulin, B-#25774, FBti0114317 | Thukral et al. (2020) |
Stock numbers according to February 2023.
Embryo fixation and immunostaining
Embryos were fixed and stained as previously described (Liu et al., 2019). For staining with Phalloidin, embryos were fixed with 8% formaldehyde, and for staining with Myosin II by heat-fixation. Embryos were incubated with primary antibodies overnight at 4°C and with secondary antibodies for 2 h at room temperature. After DNA staining (DAPI at 0.2 µg/ml), embryos were mounted in Aquapolymount (Polysciences). Reagents used in immunostainings are presented in Table 2.
Antibodies, stains
| Reagents | Source | Dilution (immunostaining) | Reference/source/identifier |
|---|---|---|---|
| Rabbit anti-Dia | Großhans lab, Philipps University of Marburg, Germany | 1:1,000; 1:5,000 for western blot | Großhans et al. (2005) |
| Rabbit anti-Slam | Großhans lab, Philipps University of Marburg, Germany | 1:5,000 | Brandt et al. (2006) |
| Mouse anti-Dlg | DSHCa, #4F3 | 1:100 | Acharya et al. (2014) |
| Rabbit anti-Cpa | Großhans lab, Philipps University of Marburg, Germany | 1:1,000; 1:5,000 for western blot | Amândio et al. (2014), Schmidt et al. (2021) |
| Rabbit anti-Zipper | Großhans lab, Philipps University of Marburg, Germany; Thomas lab, Texas Tech University Health Sciences Center, USA | 1:200 | Chougule et al. (2016) |
| Guinea pig anti-Shot | St Johnston lab, Gurdon Institute, University of Cambridge, UK | 1:1,000 | Nashchekin et al. (2016) |
| Rabbit anti-Canoe | Peifer lab, University of North Carolina at Chapel Hill, USA | 1:1,000 | Choi et al. (2013) |
| Rat anti-Pebble | Müller lab, University of Kassel, Germany | 1:350; 1:5,000 for western blot | van Impel et al. (2009) |
| Guinea pig anti-Lamin Dmo | Krohne lab, University of Wurzburg, Germany | 1:1,000 | Polychronidou et al. (2010) |
| Rabbit anti-Bazooka | Wodarz lab, University of Cologne, Germany | 1:1,000 | Wodarz et al. (1999) |
| Rabbit anti-mKate | Origene | 1:2,000 for western blot | Cat# TA150072 |
| Mouse anti-α-Tubulin | Sigma-Aldrich B512 | 1:50,000 for western blot | Cat# T6199 |
| Phalloidin Alexa Fluor 568 | Thermo Fisher Scientific | 1:1,000 | Cat# A12380 |
| GFP-booster Atto488 | Chromotek | 1:500 | Cat# gba488 |
| Goat anti-rabbit Alex Fluor 488 | Invitrogen | 1:500 | Cat# A-11034 |
| Goat anti-rabbit Alex Fluor 568 | Invitrogen | 1:500 | Cat# A-11036 |
| Goat anti-mouse Alex Fluor 647 | Invitrogen | 1:500 | Cat# A-21235 |
| Goat anti-mouse/rabbit IgG-680 | LI-COR | 1:20,000 | Cat# D00804-13/D10603-11 |
| Goat anti-rat/mouse/rabbit IgG-800 | LI-COR | 1:20,000 | Cat#D00225-03/D10603-01/D00804-07 |
Developmental Studies Hybridoma Center.
Western blot
Embryonic extracts were analyzed by western blotting as previously described (Liu et al., 2019). In brief, staged embryos were dechorionated, homogenized with a pistil in a 1.5 ml reaction vial in 1× Laemmli buffer, and boiled for 5 min. Samples were analyzed by SDS polyacrylamide gel electrophoresis and blotted to nitrocellulose membrane with the semi-dry method. Following incubation with primary and secondary antibodies, signals were detected with an Odyssey Infrared Imaging System. Reagents used in western blots are presented in below Table 2.
Live imaging
Living embryos were mounted and movies were recorded as previously described (Lv et al., 2020). In brief, we recorded time-lapse movies in wide-field/Differential Interference Contrast (DIC) optics at a Zeiss Axioscope microscope with a computer-controlled stage and with fluorescent label with a Zeiss LSM980 confocal microscope equipped with Airyscan II (63×, NA 1.4/oil) or a Zeiss spinning disc microscope (63×, NA 1.4/oil). Mutant and wild-type embryos that contain the same gene copy number of tagged proteins were recorded side by side with the same imaging parameters. The axial step size was 0.5 µm for wild type/slam RNAi/Kinesin-1 RNAi, 0.25 µm for EB1-GFP and Patronin-YFP with a frame rate of 2/min. The movies for the tracking of EB1-GFP were recorded with a frame rate of 0.5/s. FRAP experiments with Cherry-α-tubulin were conducted with the following parameters: bleaching with 80% laser power output for 1 s and recording for 20 s with a rate of 314.57 ms/frame. Time course of fluorescence within the region of interest was quantified with Fiji/ImageJ and normalized to the fluorescence prior to bleaching.
Image processing and quantification
Images were processed with Fiji/ImageJ (Schindelin et al., 2012). Quantifications were conducted with sum projections of indicated range in the following experiments: Khc-mKate (Fig. S1 C), Rho sensor (Fig. 2 C and Fig. S3 F), Sqh-GFP (Fig. S2 D), Zipper-GFP (Fig. S2 H), Dia-GFP (Fig. S2 M), and Par-1-GFP (Fig. S3 H). Fluorescence was quantified at the intercap region/cellularization furrow in reconstructed orthogonal views of image stacks and for the following experiments: Rho sensor (Fig. 2 E; Fig. 5 E; and Fig. S2 B), Sqh-GFP (Fig. 3 C and Fig. S2 F), Dia-GFP (Fig. 3 E and Fig. S2 O), Zipper-GFP (Fig. S2 J), and Par-1-GFP (Fig. 7 B).
Par-1-GFP (Fig. 7, C and D): The pattern of Par-1-GFP within the intercap region was quantified by the variance of line profiles (thickness = 51 pixel, length = 240 pixel). Spreading of Par-1-GFP (Fig. 8, C and D) was quantified in images of fixed embryos by line profiles from the intercap toward the cap region. The line profiles were aligned to their peaks (Schmidt et al., 2021).
EB1-GFP distribution and movement (Fig. 6 G and Fig. S5 E): Moesin-RFP defined the cap region. Total fluorescence (Ftotal) of Moesin-RFP and EB1 was measured in 0–5 µm projections (sum) excluding centrosomal EB1-GFP. Fluorescence at the cap region (Fcap) was quantified in 0–2 µm projections (sum). The ratio of EB1-GFP or Moesin-RFP fluorescence at the intercap domain was calculated as (Ftotal – Fcap)/Ftotal. Movement of EB1-GFP punctae was quantified by the trajectories in movies with a frame rate of 1 in 2 s and averaged over 12 s.
Cpa distribution (Fig. 4 C): Embryos from wild type, labeled with His-GFP, and Kinesin-1 RNAi embryos were stained together in the same tube. Line profiles were applied to embryos from the edge to the cap domain at the same interphase stage. The line profiles were aligned to their peaks (Schmidt et al., 2021). Total fluorescence was measured in sagittal images.
Patronin-GFP and Shot distribution (Fig. 6, C and E; and Fig. 8 B): Projections of image stacks from living embryos (Patronin-YFP, 0–4 µm, Moesin-RFP, 0–2 µm) or fixed embryos (Shot, 0–4 µm, Phalloidin, 0–2 µm) were scored for particles with Fiji’s tools for threshold tool and particle counting. The number of punctae was scored separately for cap domain (Ncap) and intercap domain (Nintercap). The area of cap (Acap) and intercap (Ainter) regions was defined by Mosein-RFP/F-actin staining. The density was calculated as density = N/A.
Statistical analyses were performed using GraphPad Prism 6. The average of individual data was represented on the y axis of the graph, with the SD represented as an error bar. For two-way comparisons, t test (two-tailed unpaired) or Mann-Whitney test was used. The results were considered statistically significant if P < 0.05. Statistically significant results were indicated with asterisks, where * represents P < 0.05, ** represents P < 0.01, *** represents P < 0.001, and **** represents P < 0.0001. Software used in the result analysis is listed in Table 3.
Online supplemental material
Fig. S1 shows the disruption of Kinesin-1 expression and cortical protein distribution in Kinesin-1 RNAi during cellularization. Fig. S2 shows the function of Kinesin-1 in distribution of Rho sensor and downstream Myosin II and Dia during interphase 13 and cellularization. Fig. S3 shows the distribution and function of Pebble in interphase 13. Fig. S4 shows the role of Kinesin-1 in Par-1 and EB1 distributions. Fig. S5 shows antagonism between components at the cap (Patronin and EB1) and intercap (Par-1) domains. Video 1 shows Rho sensor on the cortex in wild-type and Kinesin-1 RNAi.
Data availability
Further information and requests for resources and data should be addressed to Jӧrg Großhans ([email protected]).
Acknowledgments
We are grateful to A. Ephrussi, D. Johnston, H. Knaut, T. Lecuit, Eurico Morais-de-Sá, J. Thomas, and Mariana Osswald for materials or discussions.
We acknowledge service support from the Developmental Studies Hybridoma Bank created by the National Institute of Child Health and Human Development of the National Institutes of Health (NIH)/USA and maintained by the University of Iowa, the Bloomington Drosophila Stock Center (supported by NIH P40OD018537). This work was in part supported by the Deutsche Forschungsgemeinschaft (GR1945/15-1 and equipment grant INST160/718-1 FUGG).
Author contributions: Conceptualization: L. Li and J. Großhans; Methodology, formal analysis, and data curation: L. Li; Investigation: L. Li; Validation: L. Li and N. Zhang; Resources: L. Li, S.A.H. Beati, J. De las heras chanes, F. di Pietro, Y. Bellaiche, H.-A.J. Müller, and J. Großhans; Writing and editing: L. Li and J. Großhans; Visualization: L. Li and J. Großhans; Supervision, project administration and funding acquisition: J. Großhans.

