


A balance between self-renewal and differentiation is critical for the regenerative capacity of tissue-resident stem cells. In skeletal muscle, successful regeneration requires the orchestrated activation, proliferation, and differentiation of muscle satellite cells (MuSCs) that are normally quiescent. A subset of MuSCs undergoes self-renewal to replenish the stem cell pool, but the features that identify and define self-renewing MuSCs remain to be elucidated. Here, through single-cell chromatin accessibility analysis, we reveal the self-renewal versus differentiation trajectories of MuSCs over the course of regeneration in vivo. We identify Betaglycan as a unique marker of self-renewing MuSCs that can be purified and efficiently contributes to regeneration after transplantation. We also show that SMAD4 and downstream genes are genetically required for self-renewal in vivo by restricting differentiation. Our study unveils the identity and mechanisms of self-renewing MuSCs, while providing a key resource for comprehensive analysis of muscle regeneration.
Introduction
In vertebrates, skeletal muscle has robust regenerative ability due to a unique population of resident stem cells, also called muscle satellite cells (MuSCs; Brack and Rando, 2012; Buckingham and Relaix, 2007; Murphy and Kardon, 2011; Collins et al., 2005; Yin et al., 2013). In mice, MuSCs originate from Pax3/Pax7-positive progenitor cells in the dermomyotome of the developing embryo, and they start to occupy their niche between the basal lamina and sarcolemma of myofibers around E16.5 (Kassar-Duchossoy et al., 2005; Relaix et al., 2005). After birth, juvenile MuSCs, which remain Pax7+, are proliferative and contribute to postnatal muscle growth. By postnatal day 21, most of these cells become quiescent but can be reactivated upon muscle injury (Tajbakhsh, 2009). During this process, they first exit quiescence to become activated MuSCs (or ASCs), re-enter the cell cycle to proliferate, and generate numerous muscle progenitor cells (MPCs; Dumont et al., 2015). Studies have shown that the activated and proliferative MPCs are heterogeneous in homeostatic and regenerating muscle; while some activated and proliferative cells are committed to myogenic differentiation and fuse to form new myofibers, a subpopulation of MPCs is resistant to differentiation cues and has the potential to replenish the MuSCs pool, a process known as self-renewal (Pawlikowski et al., 2009). However, despite the significance of self-renewal for regeneration, the molecular and cellular features that identify and define the self-renewal state in MuSCs have not been elucidated. This critical knowledge gap reduces our comprehensive understanding of the biology of muscle regeneration and the potential deployment of self-renewing MuSCs for cell-based therapy.
Transplantation experiments have established that freshly isolated quiescence MuSCs from uninjured skeletal muscle have a higher capacity to repopulate the stem cell pool in vivo than most activated MPCs or committed myoblasts (Quarta et al., 2016). However, due to the intrinsic “quiescence” of satellite cells, a key portion of the population is not expected to proliferate, making it extremely challenging to expand or manipulate them without impacting their self-renewal properties. As soon as the quiescent MuSC are isolated from their in vivo niche, they immediately lose their stem cell potency and are committed to differentiate (Feige and Rudnicki, 2020; Beauchamp et al., 1999; Qu et al., 1998; Machado et al., 2017; van Velthoven et al., 2017; van den Brink et al., 2017; Quarta et al., 2016; Machado et al., 2021). The committed muscle precursors can contribute to new myofibers but are unable to repopulate the in vivo stem cell pool or support long-term muscle homeostasis and regeneration (Quarta et al., 2016). It is therefore important, in particular for the purpose of therapeutic strategies, to understand how to identify and isolate self-renewing cells from regenerating muscle in vivo. Recent single-cell studies of muscle regeneration at both the transcriptomic and proteomic levels have detailed some mechanisms key for MuSC quiescence, stress response, proliferation, and differentiation (Oprescu et al., 2020; De Micheli et al., 2020; Dell’Orso et al., 2019; Barruet et al., 2020). Yet, the precise molecular features and functions of self-renewing MuSCs, as well as the mechanisms controlling these features and functions, were not fully explored.
Here, we use single-nuclei ATAC-seq (snATAC-seq) to analyze the accessible cis-regulatory elements (cREs) sequences of large numbers of MuSCs cells before and at multiple times after injury during the process of muscle regeneration in adult mice. The cREs, such as enhancers, play a critical role in regulating spatial-temporal gene expression and fine-tuning cellular states (Preissl et al., 2022). Using our rich datasets, we have resolved two distinct trajectories for the descendants of quiescent MuSCs, namely, myogenic differentiation and self-renewal. By integrating these data with transcriptomic and protein expression analysis, we identify Betaglycan protein as a specific marker for a population of proliferative MuSCs that is less committed to myogenic differentiation in regenerating skeletal muscle. These Betaglycan+ cells exhibit more efficient self-renewal capacity compared to Betaglycan− cells, enabling us to purify and utilize them for in vivo functional transplantation studies. Furthermore, we find that the transcription factor (TF) Smad4 and its downstream genes play a critical role in controlling MuSC self-renewal by preventing an alternative differentiation pathway.
Results
Temporally resolved single-cell chromatin accessibility atlas of mouse skeletal muscle regeneration
To determine the spatiotemporal changes of gene regulatory mechanisms key for skeletal muscle regeneration, we carried out snATAC-seq analysis using intact nuclei collected from mice lower hind limb muscles before and after BaCl2-induced acute injury at intervals from 6 h post-injury (hpi) until 7 d post-injury (dpi; Fig. 1 A). We also collected cells from the contralateral uninjured muscle at 6 and 12 hpi to capture the early “alert” states of MuSCs (Rodgers et al., 2014). All the nuclei were isolated from snap-frozen muscle tissue, thus preserving their in vivo chromatin states without being exposed to stress from tissue dissociation (Machado et al., 2021, 2017; van Velthoven et al., 2017; van den Brink et al., 2017). A total of 114,004 high-quality nuclei were recovered for downstream analysis (Fig. S1 A; Transcription start site (TSS) enrichment >8, unique fragments per cell >1,000). Using ArchR (Granja et al., 2021), we identified 14 major cell types, namely, mature myofibers (Fig. S1, B and C), pericytes, fibro-adipogenic progenitor cells (FAPs), endothelial cells, adipocytes, tenocytes, myocytes, MuSCs, and MuSCs-derived MPCs (Fig. 1 B), and the immune cell populations that can be further classified into macrophages, neutrophils, T cells, B cells, natural killer cells, mast cells, and dendritic cell populations (Fig. S1, D and E).

Overview of single-nuclei chromatin accessibility analysis of muscle regeneration. (A) Schematic of snATAC-seq experiments. The nuclei were isolated from the snap-frozen intact muscle tissue of lower-hind limb of mice before and after acute injury at the indicated times. Mice for each indicated time: n = 2. (B) Identification of eight major mononuclear cell types of skeletal muscle before and after injury. After removing the mature myofiber nuclei (Fig. S1, B and C), we recovered 54,294 high-quality nuclei (transcription start site enrichment >8, unique fragments per nuclei >1,000) from snATAC-seq analysis. (C) Genome browser view of chromatin accessibility at selected marker gene loci for each cell type defined in B. (D) Heatmap of cell-type specific, highly accessible gene loci quantified by gene scores (FDR ≤ 0.01, Log2 fold change ≥ 0.5). Color: scaled gene scores. (E) Heatmap of cell-type specific accessible cis-regulatory elements (cREs; FDR ≤ 0.01, Log2FC ≥ 0.5). Color: Z scores of cRE accessibility. (F) UMAP showing the gene scores patterns of known marker genes for each cell type. (G) In the cell-type specific accessible cREs, transcription factor (TF) motif enrichment was calculated. The significantly enriched TF motif were plotted (FDR ≤ 0.1, Log2FC ≥ 0.5). (H) TF footprint of Mef2b (left) and Myod1 (right) centered around the accessible cREs in distinct cell types. Top: Motif logo.
Overview of single-nuclei chromatin accessibility analysis of muscle regeneration. (A) Schematic of snATAC-seq experiments. The nuclei were isolated from the snap-frozen intact muscle tissue of lower-hind limb of mice before and after acute injury at the indicated times. Mice for each indicated time: n = 2. (B) Identification of eight major mononuclear cell types of skeletal muscle before and after injury. After removing the mature myofiber nuclei (Fig. S1, B and C), we recovered 54,294 high-quality nuclei (transcription start site enrichment >8, unique fragments per nuclei >1,000) from snATAC-seq analysis. (C) Genome browser view of chromatin accessibility at selected marker gene loci for each cell type defined in B. (D) Heatmap of cell-type specific, highly accessible gene loci quantified by gene scores (FDR ≤ 0.01, Log2 fold change ≥ 0.5). Color: scaled gene scores. (E) Heatmap of cell-type specific accessible cis-regulatory elements (cREs; FDR ≤ 0.01, Log2FC ≥ 0.5). Color: Z scores of cRE accessibility. (F) UMAP showing the gene scores patterns of known marker genes for each cell type. (G) In the cell-type specific accessible cREs, transcription factor (TF) motif enrichment was calculated. The significantly enriched TF motif were plotted (FDR ≤ 0.1, Log2FC ≥ 0.5). (H) TF footprint of Mef2b (left) and Myod1 (right) centered around the accessible cREs in distinct cell types. Top: Motif logo.

Single-nuclei ATAC-seq analysis of mouse skeletal muscle before and after multiple times of acute injury. (A) Scatter plot of the number of unique accessible fragments (x axis, log10 transformed) and Tn5-insertion enrichment at transcription start sites (TSS, y axis). A TSS enrichment threshold of 8 (horizontal dashed line) and a unique fragment number threshold of 1,000 (vertical dashed line) were used for filtering nuclei resulting in 114,004 high-quality nuclei. (B) UMAP highlights the mature muscle fiber nuclei in yellow alongside nuclei from mononuclear cells of the muscle, including MPCs. (C) On the UMAP including all 114,004 nuclei, the nuclei show very high gene scores of mature muscle fiber genes (the myosin heavy chain genes Acta1 and Ckm) are defined as mature myofiber nuclei. (D) UMAP plot distinguishes sub-populations of all the immune cells shown as cluster four in Fig. 1 B. (E) UMAP of sub-clustered immune cells are highlighted by the gene score of the marker genes of the various immune cell types identified in Fig. S1 D. (F) Heatmap of the global gene-to-gene Spearman’s correlation coefficient between major cell types identified from our in-house snATAC-seq data versus major cell types identified from an external single-cell RNA-seq dataset (De Micheli et al., 2020). (G) Heatmap of identified marker genes (based on gene scores) of immune cells (Wilcoxon Rank Sum test, FDR ≤ 0.01 and Log2(Fold Change) ≥ 0.5). Gene scores are scaled across cell types and cell types are clustered (hierarchical clustering).
Single-nuclei ATAC-seq analysis of mouse skeletal muscle before and after multiple times of acute injury. (A) Scatter plot of the number of unique accessible fragments (x axis, log10 transformed) and Tn5-insertion enrichment at transcription start sites (TSS, y axis). A TSS enrichment threshold of 8 (horizontal dashed line) and a unique fragment number threshold of 1,000 (vertical dashed line) were used for filtering nuclei resulting in 114,004 high-quality nuclei. (B) UMAP highlights the mature muscle fiber nuclei in yellow alongside nuclei from mononuclear cells of the muscle, including MPCs. (C) On the UMAP including all 114,004 nuclei, the nuclei show very high gene scores of mature muscle fiber genes (the myosin heavy chain genes Acta1 and Ckm) are defined as mature myofiber nuclei. (D) UMAP plot distinguishes sub-populations of all the immune cells shown as cluster four in Fig. 1 B. (E) UMAP of sub-clustered immune cells are highlighted by the gene score of the marker genes of the various immune cell types identified in Fig. S1 D. (F) Heatmap of the global gene-to-gene Spearman’s correlation coefficient between major cell types identified from our in-house snATAC-seq data versus major cell types identified from an external single-cell RNA-seq dataset (De Micheli et al., 2020). (G) Heatmap of identified marker genes (based on gene scores) of immune cells (Wilcoxon Rank Sum test, FDR ≤ 0.01 and Log2(Fold Change) ≥ 0.5). Gene scores are scaled across cell types and cell types are clustered (hierarchical clustering).
Because errors in cell assignment may arise in profiling experiments, we assessed chromatin accessibility patterns at specific marker genes known to define each cell type, finding indicators of open chromatin as expected (Fig. 1 C). We also quantified the accessibility of each gene locus as “gene score” (Granja et al., 2021), finding that the gene scores of each cell type strongly correlated with mRNA levels of the matched cell types obtained from published scRNA-seq data of muscle regeneration (De Micheli et al., 2020; Fig. S1 F). Finally, we identified all cell type–specific genes based on gene scores, accessible cis-regulatory elements (cRE), and the TF motifs that are significantly enriched on the cREs of specific cell types (Fig. 1, D–G, Fig. S1 G; and Tables S1, S2, and S3). In total, we cataloged 100,298 accessible cREs across 14 cell types before and after injury at different times of regeneration (Table S2). Our data were concordant; for example, the motifs of MEF2B and MYOD1 are most significantly enriched in myocytes and MuSC/MPCs, respectively (Fig. 1 H). Thus, our datasets enable a temporally resolved atlas of chromatin accessibility of MuSCs and their niche populations during regeneration.
Identification of a self-renewing MuSC population from snATAC-seq analysis of MuSC/MPC
To reveal the dynamic changes of MuSC and MuSC-derived MPCs after injury, we next performed a sub-clustering analysis of MuSC/MPCs on a new UMAP (uniform manifold approximation and projection) space with increased resolution (Fig. 2 A). We were able to identify five sub-clusters of MuSC/MPCs (Fig. 2 A), including (1) Clusters 1 and 2 exhibiting high gene scores for Pax7, Cd34, Spry1, Myf5, Foxo1, Foxo3, Notch2, Notch3, and Hey1 (Fig. 2 B; Gopinath et al., 2014; Mourikis et al., 2012; Shea et al., 2010; Almada and Wagers, 2016; Bjornson et al., 2012); (2) Clusters 4 and 5 showing high gene scores of differentiation makers such as MyoG, Mymk, and Ckm (Fig. 2 B); and (3) Clusters 1 and 3 that are highly proliferative (Fig. 2 C), based on their high chromatin accessibility of a gene list representing features of the G2M phase of the cell cycle (Giotti et al., 2019). Therefore, we define the Pax7-high, non-cycling Cluster 2 cells as quiescent MuSCs (QSCs); clusters 4 and 5 as two populations of differentiating myoblasts; and Cluster 3 as activated/proliferating MPCs that are committed to differentiation due to their low accessibility of Pax7, Spry1, Notch3, etc. (Fig. 2, A and B).

snATAC-seq analysis of MuSC/MPC reveals self-renewal and myogenic differentiation trajectories. (A) Five sub-clusters of MuSCs and MuSC-derived MPCs were plotted on UMAP. (B) UMAP plots exhibiting the indicated gene scores across the sub-clusters of MuSC/MPC. (C) UMAP plot of cell cycling index across the sub-clusters of MuSC/MPC. The high cell cycling index indicates high proliferative potency. (D) The MuSC/MPCs collected at indicated times were plotted as red dots on the UMAP. hpi, hours post-injury; dpi, days post-injury. (E) The proportion of the each of the five sub-clusters of MuSC/MPC shown in A before and after injury at indicated time points. (F) All the MuSC/MPC nuclei are ordered in a pseudotime continuum (x axis) based on their Euclidean distances in a reduced dimension space. The heatmap shows top-ranked genes co-varying with the pseudotime trajectory (genes as rows and cells as columns). At the top of the heatmap is a violin plot showing the distribution of cells along the pseudotime for each sub-clusters of MuSC/MPC. Color key: gene scores. (G) We set the quiescent MuSC as the cell of origin and starting point of trajectory, and carried out supervised pseudotime trajectory analysis to reveal the myogenic differentiation trajectory (top) and the self-renewal trajectory (bottom). (H) Dynamic changes of Pax7 (top) and Myod1 (middle) gene scores, and cell cycling index (bottom) along the self-renewal (left) and the differentiation (right) trajectories. Dashed line indicates the peak of the cycling index for each trajectory.
snATAC-seq analysis of MuSC/MPC reveals self-renewal and myogenic differentiation trajectories. (A) Five sub-clusters of MuSCs and MuSC-derived MPCs were plotted on UMAP. (B) UMAP plots exhibiting the indicated gene scores across the sub-clusters of MuSC/MPC. (C) UMAP plot of cell cycling index across the sub-clusters of MuSC/MPC. The high cell cycling index indicates high proliferative potency. (D) The MuSC/MPCs collected at indicated times were plotted as red dots on the UMAP. hpi, hours post-injury; dpi, days post-injury. (E) The proportion of the each of the five sub-clusters of MuSC/MPC shown in A before and after injury at indicated time points. (F) All the MuSC/MPC nuclei are ordered in a pseudotime continuum (x axis) based on their Euclidean distances in a reduced dimension space. The heatmap shows top-ranked genes co-varying with the pseudotime trajectory (genes as rows and cells as columns). At the top of the heatmap is a violin plot showing the distribution of cells along the pseudotime for each sub-clusters of MuSC/MPC. Color key: gene scores. (G) We set the quiescent MuSC as the cell of origin and starting point of trajectory, and carried out supervised pseudotime trajectory analysis to reveal the myogenic differentiation trajectory (top) and the self-renewal trajectory (bottom). (H) Dynamic changes of Pax7 (top) and Myod1 (middle) gene scores, and cell cycling index (bottom) along the self-renewal (left) and the differentiation (right) trajectories. Dashed line indicates the peak of the cycling index for each trajectory.
What is the cellular state of the cells in Cluster 1? The Cluster 1 cells, together with those activated/proliferating cells in Cluster 3, are more abundant in the injured samples (Fig. 2, D and E), highly proliferative (Fig. 2 C), but exhibit distinct chromatin accessibility patterns (Fig. 2 B), indicating heterogeneity of MuSC/MPC in the injured muscle. We postulate that the Cluster 1 cells are the candidate self-renewing MuSCs (SRSCs), because they are proliferative and high for Pax7/Spry1 gene scores but low for that of MyoD/MyoG. This idea is further supported by the fact that the number of these cycling cells in Cluster 1 are increased in late injury timepoint (Fig. 2, D and E, 48 hpi, 72 hpi, 7 d), but less represented in samples of uninjured, “Alert,” and early injury timepoints (Fig. 2, D and E, “uninjured,” “alert,” 6 hpi, 12 hpi, and 24 hpi). Taking all these observations into consideration, the cells in Cluster 1 are different from those quiescent ones, or those committed to myogenic differentiation, and likely to be the candidate self-renewing MuSCs.
To delineate the lineage relationship of MuSC/MPCs during regeneration, we carried out trajectory analysis using ArchR, in which nuclei are ordered in a pseudotime continuum based on their Euclidean distances in a reduced dimension space (Fig. 2 F; Granja et al., 2021). This analysis revealed that all cells align along the continuum of the regeneration process, with quiescence-related genes exhibiting the highest accessibility in the early pseudotime stages (Fig. 2 F, gene names in red). By contrast, genes and microRNAs (Chen et al., 2006) implicated in myogenic differentiation are more accessible at late pseudotimes (Fig. 2 F, gene names in blue text). Cells ranked along the pseudotime trajectory are clearly separable into two modules based on gene scores, that we name “self-renewal” and “differentiation” (Fig. 2 F). The self-renewal module mainly consists of quiescent and self-renewal clusters, while cells in the differentiation module are well-represented by differentiating myoblasts in Clusters 4 and 5 (Fig. 2 F, top). Notably, the activated/proliferating MuSCs population is ranked in the intermediate “bridge” position connecting the two modules (Fig. 2 F), suggesting that these cells are transitioning from the high stemness, undifferentiated state toward myogenic differentiation.
Given the fact that all the MuSC/MPCs along the pseudotime were derived from QSC, to align this trajectory with stages of regeneration, we designated QSCs as the starting population. This approach identified a myogenic differentiation trajectory and a self-renewing trajectory, both starting from the quiescent MuSCs population (Fig. 2 G). Interestingly, the Pax7 gene score progressively increases along the self-renewing trajectory but rapidly decreases during differentiation (Fig. 2 H, top). Conversely, while Myod1 gene score remains low through self-renewal, it increases sharply during myogenic differentiation (Fig. 2 H, middle). We also examined changes in cell cycling indices along the two trajectories (Fig. 2 H, bottom). Our data indicate that both self-renewing and differentiating cells enter cell cycle upon injury and undergo a transient amplification phase (Fig. 2 H, bottom). These results support the notion that our snATAC-seq analysis of MuSC/MPCs reveals their self-renewal and myogenic differentiation fates during skeletal muscle regeneration.
Identification of self-renewing MuSCs population from single-cell RNA-seq analysis
To determine if similar conclusions would emerge from assessment of transcriptome data, we carried out independent single-cell RNA-seq (scRNA-seq) analysis using samples of regenerating skeletal muscle. We selected a timepoint of 3 dpi, as our snATAC-seq data indicated the presence of abundant self-renewing MuSCs at this time (Fig. 2 D, 72 dpi). To enrich the MuSC-derived cells away from endothelial and immune cells that are dominant in the injured muscle, we partially depleted CD31+ and CD45+ cells using FACS before scRNA-seq analysis of 3 dpi sample (Liu et al., 2015). The cells prepared from the uninjured muscle were also included in the analysis. We identified 15 major cell types from our scRNA-seq data (Fig. S2, A and B), including a population of MuSC/MPCs that can be further classified into four sub-clusters on a new UMAP space (Fig. 3 A). The four sub-populations show distinct expression patterns of Pax7, MyoD1, proliferation marker Mki67 (Cluster 3), and differentiation marker Myog (Cluster 4; Fig. 3 B). We reasoned that the 3 dpi, Pax7-high, MyoD-low, and cycling cells in Cluster 3 cells (Fig. 3, B and C, the green population) are the candidate self-renewing population. Following the same rationale of our snATAC-seq analysis, we defined the Myog-expressing Cluster 4 cells as differentiating myoblasts, and the 3 dpi cells in Cluster 1 as activated MPCs committed to differentiation (activated/committed, Fig. 3 C, bottom, dark red) because they are Myod1-high but Pax7-low (Fig. 3.D). Taken together, using independent scRNA-seq data, we are able to identify the candidate self-renewing versus committed MuSC/MPCs in the injured muscle at 3 dpi.

sc RNA-seq analysis of the whole-cell isolates obtained from the lower hind limb muscle of uninjured and 3 dpi mice. (A) UMAP shows major cell types identified from scRNA-seq analysis including both uninjured and injured (3 dpi) cells. (B) The expression pattern of the known marker genes of major cell types identified in Fig. S2 A. The MuSC/MPC cells were used for sub-clustering analysis shown in Fig. 3 A. (C) RNA velocity analyses of 3 dpi cells shows that the Betaglycan+ cells can potentially give rise to the Pax7−/Myod1+ cells committed to myogenic differentiation. The color coating of each cluster is same as that of Fig. 3 C (bottom). (D and E) GSEA results comparing QSCPax7/Cd34-high versus self-renewing MuSCs (D) and activated/committed MPCs versus self-renewing MuSCs (E). (F–H) Specific GSEA plots. NES is normalized enrichment score.
sc RNA-seq analysis of the whole-cell isolates obtained from the lower hind limb muscle of uninjured and 3 dpi mice. (A) UMAP shows major cell types identified from scRNA-seq analysis including both uninjured and injured (3 dpi) cells. (B) The expression pattern of the known marker genes of major cell types identified in Fig. S2 A. The MuSC/MPC cells were used for sub-clustering analysis shown in Fig. 3 A. (C) RNA velocity analyses of 3 dpi cells shows that the Betaglycan+ cells can potentially give rise to the Pax7−/Myod1+ cells committed to myogenic differentiation. The color coating of each cluster is same as that of Fig. 3 C (bottom). (D and E) GSEA results comparing QSCPax7/Cd34-high versus self-renewing MuSCs (D) and activated/committed MPCs versus self-renewing MuSCs (E). (F–H) Specific GSEA plots. NES is normalized enrichment score.

Self-renewing MuSCs exhibit a distinct gene expression pattern compared to the quiescent or committed MuSC/MPCs. (A) The MuSC/MPC identified from scRNA-seq analysis of uninjured and 3 dpi injured muscle (Fig. S2, A and B) were plotted on the UMAP. Four major sub-clusters of MuSC/MPC were identified and plotted in different colors. (B) The expression levels of Pax7, Myod1, Myog, and Mki67 mRNAs (log10-normalized) were plotted on the UMAP. Color key: dark color indicates high expression level. (C) The MuSC/MPCs shown in A were separated as uninjured (top) and 3 dpi (bottom) and plotted separately on the same UMPA space shown in A. For each time, the cells were annotated in different colors based on the four major clusters defined in A. The number of MuSC/MPC for each group: QSCPax7/Cd34-low: 1,181; QSCPax7/Cd34-high: 612; activated/committed: 533; QSClike: 362; self-renewing: 366; differentiating: 36. (D) Violin plots showing the mRNA expression levels of the indicated genes across the six sub-clusters defined in C. (E and F) GSEA plots comparing self-renewing MuSCs versus QSCPax7/Cd34-high or activated/committed MPCs. The log2FoldChange for each pairwise differential analysis was used as the rank for GSEA analysis. FDR Q value and Normalized Enrichment Scores (NES) are written on top of each plot. The core stress genes used (F) were obtained from Machado et al. (2021).
Self-renewing MuSCs exhibit a distinct gene expression pattern compared to the quiescent or committed MuSC/MPCs. (A) The MuSC/MPC identified from scRNA-seq analysis of uninjured and 3 dpi injured muscle (Fig. S2, A and B) were plotted on the UMAP. Four major sub-clusters of MuSC/MPC were identified and plotted in different colors. (B) The expression levels of Pax7, Myod1, Myog, and Mki67 mRNAs (log10-normalized) were plotted on the UMAP. Color key: dark color indicates high expression level. (C) The MuSC/MPCs shown in A were separated as uninjured (top) and 3 dpi (bottom) and plotted separately on the same UMPA space shown in A. For each time, the cells were annotated in different colors based on the four major clusters defined in A. The number of MuSC/MPC for each group: QSCPax7/Cd34-low: 1,181; QSCPax7/Cd34-high: 612; activated/committed: 533; QSClike: 362; self-renewing: 366; differentiating: 36. (D) Violin plots showing the mRNA expression levels of the indicated genes across the six sub-clusters defined in C. (E and F) GSEA plots comparing self-renewing MuSCs versus QSCPax7/Cd34-high or activated/committed MPCs. The log2FoldChange for each pairwise differential analysis was used as the rank for GSEA analysis. FDR Q value and Normalized Enrichment Scores (NES) are written on top of each plot. The core stress genes used (F) were obtained from Machado et al. (2021).
Notably, the 1,793 uninjured quiescent MuSCs are separated into two sub-clusters from our scRNA-seq analysis (Fig. 3 C, top). A recent study reported that the quiescent MuSC population is composed of “primed” versus “genuine quiescent” MuSCs (García-Prat et al., 2020), with the latter expressing higher levels of CD34 and Pax7. In support of this observation, we found significantly higher levels of Cd34 expression in one of the uninjured sub-clusters expressing higher levels of Pax7 (Fig. 3, C and D, pink). Therefore, we classified the quiescent MuSCs into two sub-populations, QSCPax7/Cd34-high (Fig. 3, C and D, pink) versus QSCPax7/Cd34-low (Fig. 3, C and D, light blue). Recent studies also indicated that Myod1 transcripts are present at high levels in quiescent MuSCs, despite no detectable MYOD1 protein expression (de Morrée et al., 2017; Yue et al., 2020). Consistent with these studies, all the uninjured quiescent MuSCs express high levels of Myod1 RNA (Fig. 3 D, Myod1). Compared to QSCPax7/Cd34-high, the self-renewing MuSCs (SRSC, Fig. 3 D, green) express low levels of Cd34, Myod1, and Spry1; and high levels of cell cycle genes, including Mki67, Cdk6, and Ccnd1 (Fig. 3 D). These differences argue against the possibility that the Pax7+ SRSC are residual QSC remaining from incomplete muscle injury.
We also identify 3 dpi cells in Cluster 2 that we refer to as “QSC-like” MuSCs (QSClike; Fig. 3 C, dark blue). We postulate that these cells are likely self-renewing cells as well, because they express high levels of cell cycling genes (Fig. 3 D, Cdk6 and Ccnd1, despite not expressing Mki67) as well as genes preventing the myogenic differentiation fate (Fig. 3 D, Pax7, Notch3, and Fgfr4), but low levels of genes that are expressed in QSC such as Myod1, Cd34, and Spry1 (Fig. 3 D). We speculate that the observed differences between the QSClike and SRSC clusters are due at least in part to the fact that the two populations of cells are at different stages of the dynamic self-renewal process. To test this idea, we took the 3 dpi cells for RNA velocity analysis, a method to both construct trajectory of single cells and infer the directionality of cell state transitions based on the ratio of spliced mRNA and unspliced pre-mRNA (La Manno et al., 2018; Bergen et al., 2020). We found that the QSClike cells indeed represent an intermediate state and can give rise to both self-renewing cells (SRSCs) as well as the MyoD1+/Pax7− committed cells (Fig. S2 C). These data support the model that Betaglycan+ cells exist in a less committed state for myogenic differentiation and lie on the continuum of regeneration rather than representing an alternate fate.
To further reveal global differences of transcriptome among the sub-populations of MuSC/MPCs, we conducted differential gene expression analysis (Table S4) and Gene Set Enrichment Analysis (GSEA; Table S5; and Fig. S2, D and E). We found that the genes related to the G2M cell cycle phase are significantly upregulated in both self-renewing (SRSC) and activated/committed MPCs compared to QSCPax7/Cd34-high (Fig. 3 E, and Fig. S2 F), suggesting their proliferative states at 3 dpi upon injury. Furthermore, GSEA results suggest other biological processes, such as extracellular matrix (ECM) degradation and organization, RNA translation, and MAPK signaling, can also distinguish SRSCs from both QSCPax7/Cd34-high and activated/committed MPCs (Fig. S2, D–H). Notably, a recent study had shown that tissue damage induces a conserved cellular stress response that initiates quiescent muscle stem cell activation (Machado et al., 2021). Intriguingly, the expression of these “tissue damage stress response gene sets” (Machado et al., 2021) remains significantly lower in the 3 dpi SRSC populations compared to the QSCPax7/Cd34-high and 3 dpi activated/committed MPCs (Fig. 3 F). Together, these data indicate that the SRSC identified from our scRNA-seq analysis is a unique cycling cell state exhibiting distinct gene expression patterns compared to the “quiescence” and the previously defined “activation” state committed to myogenic differentiation.
In total, our observations from scRNA-seq analysis implicate a population of proliferating MuSC/MPCs that are Pax7-high, Myod1-low, and less committed to myogenic differentiation compared to these activated cells expressing Myod1 mRNA. We reason that these cells represent a population that can more efficiently self-renew and return quiescence than differentiate during regeneration. Importantly, besides having high levels of Pax7 mRNA and proliferative tendencies, these candidates’ self-renewing MuSCs also exhibit a distinct global gene expression pattern compared to the quiescent MuSCs and the activated/proliferative MPCs committed to differentiation.
Betaglycan protein expression identifies self-renewing MuSCs that contribute to the in vivo MuSC pool in regeneration
An important goal in the field of muscle regeneration is to identify and isolate the most effective and self-renewable MuSC populations that can support long-term muscle homeostasis and regeneration (Quarta et al., 2016; Motohashi and Asakura, 2014; Sincennes et al., 2016). To identify cell surface markers that enable isolation of self-renewing MuSCs, we reasoned that their expression would correlate with that of Pax7, the best-defined MuSC “stemness” marker. We calculated the Pearson’s correlation coefficient (PCC) of mRNA levels and gene scores of all the genes versus Pax7 across all the MuSC/MPCs. Notably, we found that Betaglycan, which encodes a type III co-receptor of the TGFβ superfamily and is expressed on the cell surface (Vander Ark et al., 2018), showed a very strong correlation with nascent Pax7 mRNA and Pax7 chromatin accessibility levels (Fig. 4, A and B). It should be noted that unlike type I and type II receptors of TGFβ superfamily, Betaglycan possesses no kinase activity (Lowery and de Caestecker, 2013; Pawlak and Blobe, 2022). We found that Betaglycan gene is highly expressed and highly accessible in the self-renewing MuSC/MPC populations identified from both scRNA-seq and snATAC-seq analysis (Fig. 4, C and D).

Betaglycan protein expression identifies self-renewing MuSCs that contribute to the in vivo stem cell pool in muscle regeneration. (A and B) Pairwise Pearson correlation coefficient (PCC) was calculated using (A) mRNA and (B) gene score of all the genes against that of Pax7 across all the single cells of MuSC/MPCs. The top-ranked genes with the most robust and significant PCC with Pax7 were plotted. (C) Violin plot showing Betaglycan mRNA expression across the six sub-clusters of MuSC/MPCs defined in Fig. 2 C. (D) Genome browser view of chromatin accessibility at the indicated gene loci of Betaglycan, Pax7, Myod1, and Myog within the five sub-clusters of MuSC/MPC defined by snATAC-seq shown in Fig. 2 A. The height of each tracks normalized against sequencing depth. (E) Acute muscle injury was induced in TA muscle by intramuscular injection of BaCl2. At 3 dpi (top) or 4.5 dpi (bottom), EdU solution was injected intraperitoneally to label the proliferating cells in vivo. TA muscle was collected at 4 h post EdU injection for cross-sections, followed by immuno-fluorescence staining. Arrowhead: the Pax7+/EdU+/Betaglycan+ cells, N = 3. (F) The lower hind limb muscle of Pax7/eGFP mice was used to prepare the single-cell suspensions for FACS analysis. Cells were prepared from uninjured muscle (top row), and the muscle at 3 d post injury (dpi; second row), 4.5 dpi (third row), 7 dpi (fourth row) and 14 dpi (fifth row), respectively. The cells were stained with APC-Cy7–conjugated Betaglycan antibody prior to FACS. Pink bar highlights the fraction of Betaglycan+ cells (right panels) within the eGFP+ populations (left panels). (G) The TA muscle of uninjured Pax7/eGFP reporter mice was collected for immunostaining analysis. N = 3. (H, I, and J) Following the same FACS condition described in F, using 3 dpi mice, the eGFP+/Betaglycan+ and the eGFP+/Betaglycan− cells were freshly sorted separately. An equal amount of eGFP+ cells were transplanted into TA muscle of recipient mice (10,000 cells per TA) that do not express eGFP transgene. The TA muscle of recipient mice was pre-injured 1 d prior to the transplantation. 30 d post-transplantation, the TA muscle was collected for analysis. (H and I) The immunostaining of TA muscle cross-sections. Arrowheads point to the eGFP+/Pax7+ mononuclear MuSCs surrounding newly formed eGFP+ myofibers. (H) A close-up view of the dash-line boxed region in (G, bottom row, Betaglycan+) for further visualization of PAX7 and Laminin staining on TA muscle cross-section. (I) Quantification of eGFP+ MuSCs on 20 cross-section slides of TA muscle collected from 6 mice (three for each genotype). Error bars represent the SD of the data. **: t test P < 0.01.
Betaglycan protein expression identifies self-renewing MuSCs that contribute to the in vivo stem cell pool in muscle regeneration. (A and B) Pairwise Pearson correlation coefficient (PCC) was calculated using (A) mRNA and (B) gene score of all the genes against that of Pax7 across all the single cells of MuSC/MPCs. The top-ranked genes with the most robust and significant PCC with Pax7 were plotted. (C) Violin plot showing Betaglycan mRNA expression across the six sub-clusters of MuSC/MPCs defined in Fig. 2 C. (D) Genome browser view of chromatin accessibility at the indicated gene loci of Betaglycan, Pax7, Myod1, and Myog within the five sub-clusters of MuSC/MPC defined by snATAC-seq shown in Fig. 2 A. The height of each tracks normalized against sequencing depth. (E) Acute muscle injury was induced in TA muscle by intramuscular injection of BaCl2. At 3 dpi (top) or 4.5 dpi (bottom), EdU solution was injected intraperitoneally to label the proliferating cells in vivo. TA muscle was collected at 4 h post EdU injection for cross-sections, followed by immuno-fluorescence staining. Arrowhead: the Pax7+/EdU+/Betaglycan+ cells, N = 3. (F) The lower hind limb muscle of Pax7/eGFP mice was used to prepare the single-cell suspensions for FACS analysis. Cells were prepared from uninjured muscle (top row), and the muscle at 3 d post injury (dpi; second row), 4.5 dpi (third row), 7 dpi (fourth row) and 14 dpi (fifth row), respectively. The cells were stained with APC-Cy7–conjugated Betaglycan antibody prior to FACS. Pink bar highlights the fraction of Betaglycan+ cells (right panels) within the eGFP+ populations (left panels). (G) The TA muscle of uninjured Pax7/eGFP reporter mice was collected for immunostaining analysis. N = 3. (H, I, and J) Following the same FACS condition described in F, using 3 dpi mice, the eGFP+/Betaglycan+ and the eGFP+/Betaglycan− cells were freshly sorted separately. An equal amount of eGFP+ cells were transplanted into TA muscle of recipient mice (10,000 cells per TA) that do not express eGFP transgene. The TA muscle of recipient mice was pre-injured 1 d prior to the transplantation. 30 d post-transplantation, the TA muscle was collected for analysis. (H and I) The immunostaining of TA muscle cross-sections. Arrowheads point to the eGFP+/Pax7+ mononuclear MuSCs surrounding newly formed eGFP+ myofibers. (H) A close-up view of the dash-line boxed region in (G, bottom row, Betaglycan+) for further visualization of PAX7 and Laminin staining on TA muscle cross-section. (I) Quantification of eGFP+ MuSCs on 20 cross-section slides of TA muscle collected from 6 mice (three for each genotype). Error bars represent the SD of the data. **: t test P < 0.01.
To visually assess the expression of Betaglycan protein in MuSC/MPCs in regenerating muscle in situ, we focused on 3 and 4.5 dpi muscle, which is about the times we observed the most abundant self-renewing MuSCs from our snATAC-seq analyses (Fig. 2 D). We injected 5-ethynyl-2′-deoxyuridine (EdU) intraperitoneally (IP) to label cycling cells in vivo 4 h before tissue collection. At both 3 dpi and 4.5 dpi, we detected PAX7+ and EdU+ double-positive MuSCs expressing Betaglycan protein (Fig. 4 E, arrowhead). Particularly, at 4.5 dpi, we found that many MuSC/MPC clusters comprise Pax7+/EdU + double-positive cells, suggesting that they are clonally expanded MuSC/MPCs. To further assess the temporal dynamics of Betaglycan protein expression in MuSC/MPC during muscle regeneration, we permanently marked MuSC/MPCs with a Pax7-CreER-based tagging strategy. 2 wk after tamoxifen injection (once per day for a total of five consecutive days), we induced acute injury of Tibialis anterior (TA) muscle by BaCl2 injection, followed by FACS analysis of Betaglycan expression in the eGFP + MuSC/MPCs before and after injury at days 3, 4.5, 7, and 14 (Fig. 4 F). We found that the Betaglycan + MuSC/MPCs account for ∼3.0, 5.1, and 0.9% of eGFP+ cells at 3, 4.5, and 7 dpi, respectively. In the fully repaired muscle at 14 dpi, we detected very few eGFP+ cells expressing Betaglycan protein (0.06%; Fig. 4 F). By contrast, the eGFP-labeled quiescent MuSCs in uninjured muscle did not express measurable Betaglycan protein, as indicated by both FACS analysis (Fig. 4 F, top row) and immunostaining (Fig. 4 G). These results indicate that Betaglycan protein is preferentially expressed in a minor population of MuSC/MPCs that are undergoing self-renewing process during active regeneration, but not in those either in quiescent or have completed the process. Previous studies reported that Betaglycan mRNA is highly expressed in the quiescent MuSCs (Liu et al., 2013; Pallafacchina et al., 2010; García-Prat et al., 2016; García-Prat et al., 2020). However, Betaglycan protein is not measurably present in quiescent MuSCs, even though they express Betaglycan transcripts (Fig. 4 C, discussed further in the Discussion section).
Cell transplantation is the gold standard to assess the self-renewal capacity of MuSC/MPCs in vivo. To determine whether the Betaglycan+/eGFP+ double-positive MuSCs are the bonafide self-renewing MuSCs, we followed an established protocol to transplant the freshly isolated MuSCs into mice for in vivo lineage tracing in regenerating muscle (Feige and Rudnicki, 2020). About 10,000 Betaglycan+/eGFP+ double-positive cells were freshly sorted from 3 dpi muscle (Fig. 4 F, 3 dpi), and the same number of Betaglycan−/eGFP+ cells were collected as control. We induced acute TA muscle injury by injecting BaCl2 into the recipient mice that do not express eGFP transgene. The FACS-sorted eGFP+ cells were injected into the injury site 1 d later. At 30 dpi, the fully repaired TA muscles were collected for analysis of eGFP+ satellite cells and muscle fibers. At the cross-section of TA muscle, we found that both Betaglycan+ and Betaglycan− cells contributed eGFP+ myofibers (Fig. 4, G and H). However, compared to the Betaglycan− cells, the Betaglycan+ cells were ∼4.8-fold more efficient to repopulate the Pax7+ cells surrounding the eGFP+ myofiber in vivo (Fig. 4, G and H, arrowheads; Fig. 4 I, quantification). Notably, these graft-derived, eGFP+ mononuclear cells express PAX7 and are located in the periphery of the myofiber inside the basal lamina, the known anatomical position of self-renewed MuSC (Fig. 4 H).
Previous studies showed that the freshly isolated, uninjured quiescent MuSCs can potently contribute to newly formed muscle fibers and to repopulate the in vivo MuSC pool (Feige and Rudnicki, 2020; Beauchamp et al., 1999; Qu et al., 1998; Machado et al., 2017; van Velthoven et al., 2017; van den Brink et al., 2017; Quarta et al., 2016; Machado et al., 2021). Because the uninjured quiescent MuSCs do not express Betaglycan protein, in our transplantation experiments, we concluded that the transplanted Betaglycan+/eGFP+ cells had very few if any quiescent MuSCs that may remain due to incomplete injury. Therefore, the self-renewed eGFP+ MuSCs and the green myofibers observed in the repaired muscle are derived from the Betaglycan+/eGFP+ self-renewing MuSCs and do not represent the remaining quiescent MuSCs due to incomplete injury. Taking all the results into consideration, we conclude that Betaglycan is a unique marker of the self-renewing state of MuSCs, allowing their isolation and transplantation to injured muscle. Importantly, engrafted, Betaglycan+ self-renewing MuSCs potently contribute to new myofibers as well as repopulate the stem cell niche (discussed further in the Discussion section).
SMAD4 is a crucial TF required for MuSCs self-renewal in vivo
From our snATAC-seq data, we noticed changes in related sequences acquiring open chromatin structure in MuSC/MPCs undergoing both self-renewal and differentiation fates (Fig. 5 A). Following the self-renewal trajectory defined by snATAC-seq analysis, we found that the Smad2/3 binding motif is enriched in sequences acquiring open chromatin during regeneration, and then depleted from such regions as quiescent MuSCs transition to the self-renewal state (Fig. 5 A, top left). Interestingly, the enrichment of Smad1/5 motifs in the open chromatin sequences follows a complementary pattern: it is gradually decreased in accessible regions of quiescent MuSCs as regeneration progresses, then slightly increased in self-renewing cells (Fig. 5 A, bottom left). Similarly, we also observed dynamic and complementary changes of enrichment of binding motifs of Smad2/3 and Smad1/5 in the DNA sequences acquiring accessibility in the MuSCs/MPCs following the differentiation trajectory (Fig. 5 A, right). In addition to these chromatin accessibility dynamics, transcriptomic evidence also suggests the differential regulation of TGFβ superfamily signaling (Fig. 5 B and Table S6, Gene Ontology analysis), as well as the R-Smads and their transcriptional targets (Table S5 and Fig. S2, C–G) in SRSCs compared to the activated/committed MPCs and quiescent MuSCs. Together, these results strongly support the idea that the fate choice of MuSCs to undergo self-renewal versus commitment to differentiation during regeneration is partly regulated by the Smad TFs.

SMAD4 is a crucial TF required for MuSC self-renewal in vivo during regeneration. (A) Scatter plot showing the enrichment score (y axis) of the binding motifs for Smad2/3 (top), and Smad1/5 (bottom) of each single cell aligned along the MuSC self-renewal trajectory (left, x axis) and the myogenic differentiation trajectory (right, x axis). Both trajectories are defined by snATAC-seq analysis shown in Fig. 2, G and H. Color key: pseudotime. The dashed line separates the quiescent, self-renewing, activation, and differentiation sub-clusters. (B) The significantly enriched gene ontology (GO) terms (P value <0.05) were identified using the differentially expressed genes in the genuine quiescent versus self-renewing MuSCs defined by scRNA-seq in Fig. 3 C. Differentially expressed genes: FDR < 0.05 (Wilcoxon rank-sum test) and absolute Log2 (fold change) > 0.6. (C) Schematic of the experimental design for self-renewal assay. Hind limb muscles of Pax7/YFP mice, after tamoxifen administration (descripted in Fig. S3 B), were injured by cardiotoxin (CTX) injection and collected after 4 wk for further experiments described in D–H. (D) 4 wk after CTX injury, MuSCs were sorted from Ctrl and Smad4 iKO mice, and the cell numbers were recorded. (E and F) 4 wk after CTX injury, EDL fibers (n > 30) were isolated from Ctrl and Smad4 iKO mice and subjected to immunostaining for Pax7. The nuclei were counterstained with DAPI. The images are representative of multiple fibers. Scale bars, 50 µm. (F) Quantification of Pax7+ MuSC number from E. (G and H) 4 wk after CTX injury, TA cross-sections of Ctrl and Smad4 iKO mice were subjected to immunostaining for Pax7 and Laminin. The nuclei were counterstained with DAPI. The images are representative of multiple sections. Scale bars, 50 µm. (H) Quantification of Pax7+ cell number per 100 myofibers on TA sections in G. (I) Schematic of the experimental design for self-renewal assay using repeated injury. After tamoxifen administration (descripted in Fig. S3 B), the lower hind limb muscles of Pax7/YFP mice were injured by CTX twice with 4-wk interval. Mice were sacrificed 4 wk after the second CTX injury, hind limb muscles were collected and subjected to further assays described in J–N. (J) 4 wk after the second CTX injury, TA cross-sections were subjected to H&E staining. The images are representative of multiple TA cross-sections from three pairs of littermates. Scale bars, 50 µm. (K and L) EDL fibers (n > 30) were isolated from the same mice in J and subjected to immunostaining for Pax7. The nuclei were counterstained with DAPI. The images are representative of multiple fibers. Scale bars, 50 µm. (L) Quantification of Pax7+ MuSC number in K. (M and N) Twice-injured TA cross-sections were subjected to immunostaining for Pax7 and Laminin. The nuclei were counterstained with DAPI. The images are representative of multiple sections. Scale bars, 50 µm. (N) Quantification of Pax7+ cell number per 100 myofibers on TA cross-sections in M. All the results from D to N are presented as mean ± SD (error bars). Statistical tests are paired (D) and unpaired t test (F, H, L, and M). *P < 0.05, **P < 0.01, ***P < 0.001, ****P < 0.0001. The number of biological replicates are N = 3 in D–N.
SMAD4 is a crucial TF required for MuSC self-renewal in vivo during regeneration. (A) Scatter plot showing the enrichment score (y axis) of the binding motifs for Smad2/3 (top), and Smad1/5 (bottom) of each single cell aligned along the MuSC self-renewal trajectory (left, x axis) and the myogenic differentiation trajectory (right, x axis). Both trajectories are defined by snATAC-seq analysis shown in Fig. 2, G and H. Color key: pseudotime. The dashed line separates the quiescent, self-renewing, activation, and differentiation sub-clusters. (B) The significantly enriched gene ontology (GO) terms (P value <0.05) were identified using the differentially expressed genes in the genuine quiescent versus self-renewing MuSCs defined by scRNA-seq in Fig. 3 C. Differentially expressed genes: FDR < 0.05 (Wilcoxon rank-sum test) and absolute Log2 (fold change) > 0.6. (C) Schematic of the experimental design for self-renewal assay. Hind limb muscles of Pax7/YFP mice, after tamoxifen administration (descripted in Fig. S3 B), were injured by cardiotoxin (CTX) injection and collected after 4 wk for further experiments described in D–H. (D) 4 wk after CTX injury, MuSCs were sorted from Ctrl and Smad4 iKO mice, and the cell numbers were recorded. (E and F) 4 wk after CTX injury, EDL fibers (n > 30) were isolated from Ctrl and Smad4 iKO mice and subjected to immunostaining for Pax7. The nuclei were counterstained with DAPI. The images are representative of multiple fibers. Scale bars, 50 µm. (F) Quantification of Pax7+ MuSC number from E. (G and H) 4 wk after CTX injury, TA cross-sections of Ctrl and Smad4 iKO mice were subjected to immunostaining for Pax7 and Laminin. The nuclei were counterstained with DAPI. The images are representative of multiple sections. Scale bars, 50 µm. (H) Quantification of Pax7+ cell number per 100 myofibers on TA sections in G. (I) Schematic of the experimental design for self-renewal assay using repeated injury. After tamoxifen administration (descripted in Fig. S3 B), the lower hind limb muscles of Pax7/YFP mice were injured by CTX twice with 4-wk interval. Mice were sacrificed 4 wk after the second CTX injury, hind limb muscles were collected and subjected to further assays described in J–N. (J) 4 wk after the second CTX injury, TA cross-sections were subjected to H&E staining. The images are representative of multiple TA cross-sections from three pairs of littermates. Scale bars, 50 µm. (K and L) EDL fibers (n > 30) were isolated from the same mice in J and subjected to immunostaining for Pax7. The nuclei were counterstained with DAPI. The images are representative of multiple fibers. Scale bars, 50 µm. (L) Quantification of Pax7+ MuSC number in K. (M and N) Twice-injured TA cross-sections were subjected to immunostaining for Pax7 and Laminin. The nuclei were counterstained with DAPI. The images are representative of multiple sections. Scale bars, 50 µm. (N) Quantification of Pax7+ cell number per 100 myofibers on TA cross-sections in M. All the results from D to N are presented as mean ± SD (error bars). Statistical tests are paired (D) and unpaired t test (F, H, L, and M). *P < 0.05, **P < 0.01, ***P < 0.001, ****P < 0.0001. The number of biological replicates are N = 3 in D–N.
To test this hypothesis, we disrupted Smad4, the Co-Smad required for the activity of all the R-Smads (Smad2/3 and Smad1/5/8), using mice with Loxp-flanked Smad4 exons. We crossed Smad4flox/flox (“f/f” thereafter) mice with Pax7CreER/CreER: Rosa26YFP/YFP (Pax7/YFP) mice (i.e., Smad4 iKO), enabling the use of YFP as a reporter to mark MuSCs (Fig. S3, A–C). The KO efficiency of SMAD4 in MuSCs is validated by Western blot at the protein level (Fig. S3 D, top) and by RNA-seq at the RNA level as indicated by lacking of transcripts mapped to Smad4 exon 8 (Fig. S3 D, bottom). 4 wk after acute muscle injury (Fig. 5 C), we noticed a 50% reduction in the number of YFP+ MuSCs in Smad4 iKO samples compared to that from heterozygous mice (Fig. 5 D). A similar decrease was detected by quantification of self-renewed MuSCs in isolated myofibers (Fig. 5, E and F) and TA muscle cross-sections (Fig. 5, G and H). The observed reduction of MuSCs in the fully repaired muscle suggests self-renewal defect of SMAD4 mutant MuSCs. Given these observations and based on findings by others (Shea et al., 2010; Robinson et al., 2021), we hypothesized that a second injury might induce a more severe regeneration defect and even fewer self-renewed MuSCs. Indeed, following a sequential injury scheme (Fig. 5 I), we found that TA muscle regeneration in Smad4 iKO mice was much less efficient than in heterozygous mice (Fig. 5 J). Notably, the freshly isolated single myofibers or TA muscle cross-sections from Smad4 iKO mice had few if any detectable Pax7+ cells (Fig. 5, K and L for myofiber and Fig. 5, M and N for TA sections). Taken together, we conclude that Smad4 is essential in adult MuSCs for satellite stem cell self-renewal during regeneration.
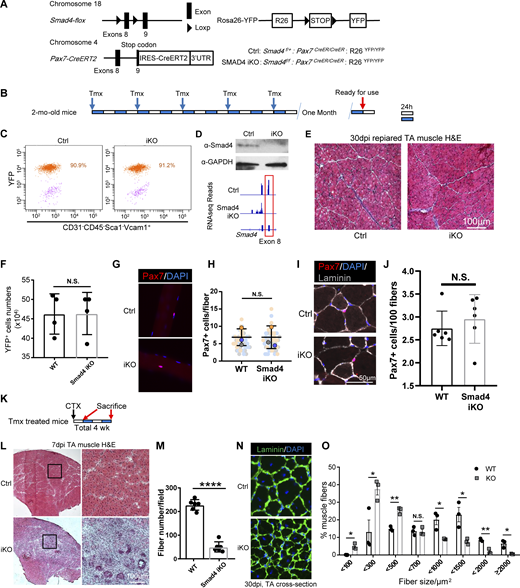
MuSC-specific SMAD4 KO does not affect adult MuSC maintenance but disrupts skeletal muscle regeneration. (A) Scheme of generation of Smad4 MuSCs specific KO mice. (B) Scheme of Tamoxifen treatment of adult mice. Each white or blue bar represents 24 h. (C) MuSCs from Tmx treated Ctrl and Smad4 KO mice were sorted by FACS. The percentage of YFP+ cells in the MuSCs (CD31−CD45−Sca1−Vcam1+ cells) were counted, indicating the Cre recombination efficiency. (D) MuSCs sorted from Tmx treated Ctrl and KO mice were subjected to Western blot analysis (top). Bottom: 40 h post CTX induced injury, the YFP+ MuSC/MPCs were FACS sorted from the injured lower hind limb muscle of control and SMAD4 iKO mice. The collected cells were subjected to RNA-seq analysis. Representative RNA-seq profiles at the Smad4 locus in MuSCs from four pairs of Ctrl and Smad4 KO mice. The exons boxed in red at the Smad4 locus were flanked by loxP and deleted in Tmx treated KO mice. (E) 30 d after tamoxifen (Tmx) administration, TA sections were subjected to H&E staining. The images are representative of multiple sections from three pairs of littermates. Scale bars, 100 µm. (F) MuSCs were sorted from Tmx-treated Ctrl and KO mice and the cell numbers were recorded. n = 4. (G) Freshly isolated EDL fibers (n > 30) from three pairs of mice were subjected to immunostaining for Pax7. The nuclei were counterstained with DAPI. The images are representative of multiple fibers. Scale bars, 50 µm. (H) Quantification of Pax7+ MuSCs number from G. n = 3. (I) Adult TA sections were subjected to immunostaining for Pax7 and Laminin. The nuclei were counterstained with DAPI. The images are representative of multiple sections from three pairs of littermates. Scale bars, 50 µm. (J) Quantification of Pax7+ cell number/100 myofibers from TA sections from three pairs of littermates in I. (K) Schematic of the experimental design for muscle regeneration assay. Long-range Tmx treated mice were injured by CTX at TA muscles. TAs were collected after 7 d or 30 d, respectively, and subjected to further experiments. (L) 7 d after CTX injury, TA sections were subjected to H&E staining. The images are representative of multiple sections from six pairs of mice. Scale bars, 100 µm. (M) Quantification of central nuclear fibers numbers from L. n = 6. The regenerated fiber numbers were counted on section images taken by a 20× microscope. (N) 30 d after CTX injury, TA sections were subjected to immunostaining for laminin. The nuclei were counterstained with DAPI. The images are representative of multiple sections from three pairs of littermates. Scale bars, 50 µm. (O) Quantification of the cross-section area (CSA) of individual myofibers from N. The percentage of myofibers with a defined range of CSA over the total myofibers was calculated. Myofibers from three pairs of littermates were counted and >500 fibers from each pair of mice. All the results are presented as mean ± SD. T test was used for all statistical inferences: *P < 0.05, **P < 0.01, ***P < 0.001, ****P < 0.0001. Source data are available for this figure: SourceData FS3.
MuSC-specific SMAD4 KO does not affect adult MuSC maintenance but disrupts skeletal muscle regeneration. (A) Scheme of generation of Smad4 MuSCs specific KO mice. (B) Scheme of Tamoxifen treatment of adult mice. Each white or blue bar represents 24 h. (C) MuSCs from Tmx treated Ctrl and Smad4 KO mice were sorted by FACS. The percentage of YFP+ cells in the MuSCs (CD31−CD45−Sca1−Vcam1+ cells) were counted, indicating the Cre recombination efficiency. (D) MuSCs sorted from Tmx treated Ctrl and KO mice were subjected to Western blot analysis (top). Bottom: 40 h post CTX induced injury, the YFP+ MuSC/MPCs were FACS sorted from the injured lower hind limb muscle of control and SMAD4 iKO mice. The collected cells were subjected to RNA-seq analysis. Representative RNA-seq profiles at the Smad4 locus in MuSCs from four pairs of Ctrl and Smad4 KO mice. The exons boxed in red at the Smad4 locus were flanked by loxP and deleted in Tmx treated KO mice. (E) 30 d after tamoxifen (Tmx) administration, TA sections were subjected to H&E staining. The images are representative of multiple sections from three pairs of littermates. Scale bars, 100 µm. (F) MuSCs were sorted from Tmx-treated Ctrl and KO mice and the cell numbers were recorded. n = 4. (G) Freshly isolated EDL fibers (n > 30) from three pairs of mice were subjected to immunostaining for Pax7. The nuclei were counterstained with DAPI. The images are representative of multiple fibers. Scale bars, 50 µm. (H) Quantification of Pax7+ MuSCs number from G. n = 3. (I) Adult TA sections were subjected to immunostaining for Pax7 and Laminin. The nuclei were counterstained with DAPI. The images are representative of multiple sections from three pairs of littermates. Scale bars, 50 µm. (J) Quantification of Pax7+ cell number/100 myofibers from TA sections from three pairs of littermates in I. (K) Schematic of the experimental design for muscle regeneration assay. Long-range Tmx treated mice were injured by CTX at TA muscles. TAs were collected after 7 d or 30 d, respectively, and subjected to further experiments. (L) 7 d after CTX injury, TA sections were subjected to H&E staining. The images are representative of multiple sections from six pairs of mice. Scale bars, 100 µm. (M) Quantification of central nuclear fibers numbers from L. n = 6. The regenerated fiber numbers were counted on section images taken by a 20× microscope. (N) 30 d after CTX injury, TA sections were subjected to immunostaining for laminin. The nuclei were counterstained with DAPI. The images are representative of multiple sections from three pairs of littermates. Scale bars, 50 µm. (O) Quantification of the cross-section area (CSA) of individual myofibers from N. The percentage of myofibers with a defined range of CSA over the total myofibers was calculated. Myofibers from three pairs of littermates were counted and >500 fibers from each pair of mice. All the results are presented as mean ± SD. T test was used for all statistical inferences: *P < 0.05, **P < 0.01, ***P < 0.001, ****P < 0.0001. Source data are available for this figure: SourceData FS3.
Mechanisms of control of muscle stem cell self-renewal by Smad4
To identify potential mechanisms by which Smad4 regulates MuSCs, we carried out a series of analysis of Smad4 iKO mice. We found that SMAD4 ablation in adult MuSCs does not measurably affect stem cell maintenance (Fig. S3, D–J), exit from quiescence and cell cycle re-entry (Fig. 6, A and B), or the early phases of cell proliferation (Fig. 6, C and D). Importantly, in both isolated primary MuSCs and cultured myofibers under proliferation conditions, we did not observe a reduction in cell numbers for SMAD4 iKO MuSCs during the stages of quiescent cell activation, cell cycle re-entry, and early stage proliferation (Fig. 6, A–D). These data suggest no significant cell death of SMAD4 iKO MuSCs. Interestingly, we found that SMAD4 is required for prolonged proliferation of MPCs (Fig. 6, C and D). Therefore, we hypothesized that SMAD4 plays a critical role in the early activated and proliferating MuSC/MPCs by controlling the balance between self-renewal versus myogenic differentiation fate.

SMAD4 promotes self-renewal by restricting the alternative differentiation fate of MuSCs. (A and B) Equal number of YFP+ MuSCs were FACS-sorted from Ctrl versus SMAD4 iKO mice and cultured in the growth media supplemented with EdU. After 40 h of in vitro culture, the cells were subjected to staining for EdU. Nuclei were counterstained with DAPI. Scale bars, 50 µm. (B) Quantification of the percentage of EdU+ cells in A. (C) Myofibers were isolated from EDL muscle of Ctrl and Smad4 iKO mice, respectively. The myofiber were cultured for 0 , 1 , 2 , and 3 d before fixation. The number of YFP+ cells per fiber was quantified and shown. (D) The YFP+ MuSCs were isolated from lower hind limb muscles of Ctrl and Smad4 iKO mice, respectively at indicated times post CTX injury. The numbers of MuSCs were recorded by FACS. (E−H) 40 h post CTX induced injury, the YFP+ MuSC/MPCs were FACS sorted from the injured lower hind limb muscle of control and SMAD4 iKO mice. The collected cells were subjected to RNA-seq analysis. N = 4. (E, G, and H) Bar plots represent the normalized reads counts (mean FPKM values) for (E) Myogenin; (G) Myomaker and Myomixer; and (H) Id1, Id2, Id3, and Cdkn1c in MuSCs from four pairs of littermates. Error bars were calculated by Cuffdiff 2. (F) GSEA results showing MyoD and MEF2 target genes are significantly enriched in SMAD4 iKO samples. (I and J) Equal number of FACS-isolated uninjured MuSCs were cultured for 18 h before: (I) treatment of adenovirus to overexpress RFP, Id1, Id2, and Id3 cDNA for 6 h; or (J) transfection of siRNAs against control GFP and Cdkn1c. After another 36 h, the cells were fixed and subjected to immunostaining for MyHC (red). The nuclei were counterstained with DAPI (blue). Scale bars, 100 µm. (K) Schematic illustration showing the expression of the indicated genes at the protein levels at different states of MuSCs/MPCs during muscle regeneration. After injury, the quiescent MuSCs (Pax7+, Cd34+, MyoD1−, Betaglycan−) gave rise to a heterogeneous population of activated and proliferative MuSC/MPCs. A minor population of cells express Betaglycan protein, exist in a less committed state to myogenic differentiation, and can return to quiescence and self-renewal more efficiently than those Betaglycan-activated/proliferative cells. SMAD4 plays a critical role in regulating the cell fate decision of these activated/proliferative MPCs by targeting Ids and Cdkn1c genes. Specifically, SMAD4 restricts the precocious differentiation fate and promotes self-renewal, which is marked by BETAGLYCAN protein expression. All the results are presented (error bars) as mean ± SD (B–D) or SEM (E–H). Statistical inference was done by t test (B–D) or by comparing the estimated sample distributions for each condition using the Cuffdiff method (E, G, and H) and see Materials and methods for a broader explanation). *P < 0.05, **P < 0.01, ***P < 0.001, ****P < 0.0001. Numbers of biological replicates are: N = 3 in A–D, N = 4 in E–H, and N = 3 in I and J.
SMAD4 promotes self-renewal by restricting the alternative differentiation fate of MuSCs. (A and B) Equal number of YFP+ MuSCs were FACS-sorted from Ctrl versus SMAD4 iKO mice and cultured in the growth media supplemented with EdU. After 40 h of in vitro culture, the cells were subjected to staining for EdU. Nuclei were counterstained with DAPI. Scale bars, 50 µm. (B) Quantification of the percentage of EdU+ cells in A. (C) Myofibers were isolated from EDL muscle of Ctrl and Smad4 iKO mice, respectively. The myofiber were cultured for 0 , 1 , 2 , and 3 d before fixation. The number of YFP+ cells per fiber was quantified and shown. (D) The YFP+ MuSCs were isolated from lower hind limb muscles of Ctrl and Smad4 iKO mice, respectively at indicated times post CTX injury. The numbers of MuSCs were recorded by FACS. (E−H) 40 h post CTX induced injury, the YFP+ MuSC/MPCs were FACS sorted from the injured lower hind limb muscle of control and SMAD4 iKO mice. The collected cells were subjected to RNA-seq analysis. N = 4. (E, G, and H) Bar plots represent the normalized reads counts (mean FPKM values) for (E) Myogenin; (G) Myomaker and Myomixer; and (H) Id1, Id2, Id3, and Cdkn1c in MuSCs from four pairs of littermates. Error bars were calculated by Cuffdiff 2. (F) GSEA results showing MyoD and MEF2 target genes are significantly enriched in SMAD4 iKO samples. (I and J) Equal number of FACS-isolated uninjured MuSCs were cultured for 18 h before: (I) treatment of adenovirus to overexpress RFP, Id1, Id2, and Id3 cDNA for 6 h; or (J) transfection of siRNAs against control GFP and Cdkn1c. After another 36 h, the cells were fixed and subjected to immunostaining for MyHC (red). The nuclei were counterstained with DAPI (blue). Scale bars, 100 µm. (K) Schematic illustration showing the expression of the indicated genes at the protein levels at different states of MuSCs/MPCs during muscle regeneration. After injury, the quiescent MuSCs (Pax7+, Cd34+, MyoD1−, Betaglycan−) gave rise to a heterogeneous population of activated and proliferative MuSC/MPCs. A minor population of cells express Betaglycan protein, exist in a less committed state to myogenic differentiation, and can return to quiescence and self-renewal more efficiently than those Betaglycan-activated/proliferative cells. SMAD4 plays a critical role in regulating the cell fate decision of these activated/proliferative MPCs by targeting Ids and Cdkn1c genes. Specifically, SMAD4 restricts the precocious differentiation fate and promotes self-renewal, which is marked by BETAGLYCAN protein expression. All the results are presented (error bars) as mean ± SD (B–D) or SEM (E–H). Statistical inference was done by t test (B–D) or by comparing the estimated sample distributions for each condition using the Cuffdiff method (E, G, and H) and see Materials and methods for a broader explanation). *P < 0.05, **P < 0.01, ***P < 0.001, ****P < 0.0001. Numbers of biological replicates are: N = 3 in A–D, N = 4 in E–H, and N = 3 in I and J.
To test this idea, we assessed sorted MuSC/MPCs from hind limbs of control and SMAD4 iKO mice by RNA-seq analysis at 40 hpi, the time when the activated MuSC/MPCs are poised to enter their first cell cycle for either self-renewal or differentiation (Fig. 2 D). Unexpectedly, at 40 hpi, the Myog mRNA levels in Smad4-null MuSCs were ∼2.8 times higher than those in control samples (Fig. 6 E). The GSEA analysis revealed that the myogenic commitment/differentiation-related genes, including MyoD1 and Mef2a target genes, were significantly enriched in the differentially expressed genes in Smad4-null MPCs compared to the wild-type control MPCs (Fig. 6 F). Moreover, Myomaker and Myomixer, two genes essential for myoblast fusion and expressed in the terminally differentiated myocytes (Bi et al., 2017; Millay et al., 2013), were also present at higher levels in Smad4-null MPCs at 40 hpi (Fig. 6 G). These results indicate that Smad4-null MuSCs prematurely commit to myogenic differentiation as early as 40 hpi, a time point during which the control activated MuSCs are predominantly proliferating. Collectively, these findings support the model that due to precocious differentiation, the MPCs that could have otherwise returned to quiescence and are depleted, leading to a MuSC self-renewal defect.
In Smad4-null MuSCs, we also found that the mRNA levels of the Id family genes are lower than those of controls, whereas Cdkn1c (p57Kip1) levels are higher (Fig. 6 H). Ids are well-characterized negative regulators for myogenic differentiation, as they prevent MyoD1/Myf5 from binding to DNA by complexing with either MyoD1/Myf5 or E2A proteins (Lingbeck et al., 2008). By contrast, p57Kip1, a cell cycle inhibitor, promotes cell cycle exit at the onset of myogenic differentiation. Strikingly, we found that the re-expression of individual members of Id genes (Fig. 6 I), or knockdown of p57Kip1 (Fig. 6 J), effectively prevented precocious differentiation of primary cultures of freshly isolated Smad4-null MPCs. These results indicate that Id family genes and Cdkn1c are key downstream targets of Smad4 that function to prevent precocious myogenic differentiation of activated/proliferative MuSCs.
In summary, we propose that Smad4 is key to control the balance between self-renewal versus differentiation fate of activated MuSCs at early timepoint of regeneration. Mechanistically, Ids and p57Kip1, the downstream target genes regulated by SMAD4, play a critical role in restricting the onset of a precocious myogenic differentiation process. This crucial mechanism enables a subset of activated/proliferative MPCs to enter the self-renewal state marked by Betaglycan (Fig. 6 K).
Discussion
The potential for tissue-resident stem cells to be used in regenerative therapies is currently limited by our incomplete understanding of stem cell identity and self-renewal mechanisms. In this study, we have identified a population of Betaglycan+ self-renewing MuSCs and the transcriptional program governing their regenerative potential through single-cell chromatin accessibility and single-cell transcriptome profiling. This discovery has practical implications for transplantation therapeutics, as self-renewing MuSC/MPCs exhibit higher engraftment efficiency than most proliferating MPCs. Importantly, results from single-cell genomics analyses, MuSCs engraftment, and SMAD4 iKO mice suggest that the proliferative Betaglycan+ cells are in a less committed state to myogenic differentiation, allowing them to return to a quiescent state more efficiently than committed toward myogenic differentiation. These less committed Betaglycan+ cells are still able to complete the differentiation program to form myofibers in response to environmental cues such as transplantation into regenerating skeletal muscle and genetic perturbations such as SMAD4 KO. These observations collectively suggest the MuSC self-renewal process involves a less committed state to differentiation, and these cells lie on the continuum of the regeneration trajectory.
By the definition of stem cell self-renewal, we expect self-renewing MuSCs to be similar to quiescent MuSCs molecularly and cellularly and in a less-committed cell state. Quiescent MuSCs give rise to both self-renewed stem cells and newly formed fibers during regeneration and in transplantation (Feige and Rudnicki, 2020; Beauchamp et al., 1999; Qu et al., 1998; Machado et al., 2017; van Velthoven et al., 2017; van den Brink et al., 2017; Quarta et al., 2016; Machado et al., 2021). Indeed, in the engraftment experiments, the Betaglycan+ cells exhibit high regenerative capacity than cells not expressing Betaglycan and generate more self-renewed MuSCs, confirming their greater self-renewal potency. Intriguingly, why do these Betaglycan+ cells also generate new myofibers more efficiently than those Betaglycan− cells? It is important to note that the recipient muscles were injured 1 d prior. Therefore, isolating and transplanting of MuSCs into injured muscle may disrupt their niche environment and signaling activity, resulting in myogenic differentiation of these Betaglycan+ cells. Moreover, Betaglycan+ cells are more proliferative than the cells committed to differentiation. Thus, even when transplanting the same number of cells, Betaglycan+ cells may expand more efficiently before committing to differentiation, explaining their greater contribution to muscle fibers.
Interestingly, previous studies reported high Betaglycan mRNA expression in uninjured quiescent MuSCs (Liu et al., 2013; Pallafacchina et al., 2010; García-Prat et al., 2016; García-Prat et al., 2020), which aligns with our scRNA-seq data showing its highest expression in the Pax7+ quiescent MuSCs. Importantly, our study advances this knowledge by revealing that Betaglycan protein is exclusively expressed in a subset of less committed MuSCs but are absent in uninjured quiescent cells. It is known that many RNA transcripts in quiescent MuSCs, including MyoD1, are not translated into proteins (de Morrée et al., 2017; Yue et al., 2020). It would be interesting in future studies to investigate whether Betaglycan plays a causal role in regulating MuSCs fate and, if so, elucidate the mechanism controlling Betaglycan protein expression in quiescent versus self-renewing MuSCs.
Notably, our findings show more Myog-accessible MuSCs during early muscle injury stages compared to scRNA-seq data. A recent study (Ma et al., 2020) revealed that cell states marked by chromatin accessibility and gene expression are related but distinct. Chromatin accessibility often precedes gene expression in lineage-determining genes, indicating an upcoming lineage switch. This “chromatin potential” predicts cell fate decisions. Our data suggest that MuSCs with high MyoG chromatin accessibility in early regeneration stages represent a committed population with strong chromatin potential for later MyoG mRNA expression and myogenic differentiation. Additionally, we observed that the proportion of self-renewing cells estimated by snATAC-seq and scRNA-seq is higher than the Betaglycan+ cells purified from FACS. We reasoned that such discrepancy could be due to “chromatin potential,” translational regulation of Betaglycan protein expression, and limitations in our single-cell genomics approaches. Specifically, Betaglycan mRNA levels may not accurately reflect protein levels, as MuSCs expressing Betaglycan mRNA may not produce its protein. Furthermore, RNA velocity analysis of 3 dpi MuSC/MPCs reveals that the Betaglycan mRNA-expressing cells lie on a continuum trajectory (Fig. S2 C). Consequently, the separation of Clusters 2 and 3 may be arbitrarily determined by computational algorithms due to the lack of well-established gold standards for defining transcriptome signatures of self-renewing MuSCs. All these factors could contribute to an overestimation of the proportion of self-renewing cells from scRNA-seq and snATAC-seq data.
Our results indicate that SMAD4 is a crucial TF controlling the cell fate choice of early activated/proliferative MuSC for self-renewal versus differentiation. Among the eight known Smad proteins in mammals, SMAD4 is unique in that it functions as an indispensable Co-Smad for five R-Smads (receptor-regulated Smads, namely Smad1, 2, 3, 5, and 8). Upon activation of their receptors by members of the TGFβ superfamily, Smad4 forms heterodimers with one of the five R-Smads in the cytosol and together they are translocated to the nucleus to bind to their target genes (Massagué, 2008). The function of SMADs, including SMAD4, has been studied in the processes of myoblast proliferation and differentiation (Yanagisawa et al., 2011; Ono et al., 2011; Cohen et al., 2015; Lamarche et al., 2020; Paris et al., 2016; Stantzou et al., 2017). Nevertheless, whether and how the SMADs proteins causally regulate MuSC self-renewal was unknown. Recently, Chakkalakal and his colleagues induced Smad4 ablation in adult MuSCs and showed that injury-induced muscle regeneration was compromised due to precocious differentiation of the mutant MuSCs (Paris et al., 2016). Our study further demonstrates that SMAD4 not only plays a critical role in regulating myogenic differentiation but also serves as a key regulator for MuSC self-renewal in regeneration. Interestingly, a recent study revealed that genetical depletion of NELFB in MuSCs (NELFB iKO), similar to SMAD4 iKO, results in defects in muscle regeneration and MuSCs self-renewal (Robinson et al., 2021). Neither NELFB nor SMAD4 is required for quiescent MuSC activation, cell cycle entry, or early stage proliferation. Instead, both genes are crucial for late-stage proliferation of MPCs and for preventing their premature differentiation. These findings support our model that the self-renewal process involves a less committed cell state allowing for Betaglycan+ cells efficient return to quiescence compared to committed cells. Due to precocious differentiation of MuSCs in both NELFB iKO and SMAD4 iKO mice, these less committed progenitor cells that could have otherwise returned to quiescence and self-renewal are depleted due to premature myogenic differentiation, thereby leading to exhibit a MuSC self-renewal defect. Despite similar phenotype, however, the molecular mechanisms underlying SMAD4 and NELFB functions are distinct. SMAD4 regulates Cdkn1c and Id genes, while NELFB stabilizes RNA Pol II during transcriptional pausing. These differences underscore the complexity of MuSC self-renewal, which is tightly controlled by various signaling pathways, TFs, and transcription machinery.
In conclusion, with time-resolved single-cell atlas of chromatin accessibility of skeletal muscle regeneration, we have delineated the self-renewal versus myogenic differentiation trajectories of MuSC upon injury. Our results identify Betaglycan protein as a unique marker of self-renewing MuSCs and uncover the critical role of SMAD4 for MuSC self-renewal and in controlling the fate choice of early activated/proliferative MuSCs.
Materials and methods
Animals
All WT and transgenic animals were on the C57BL6 background strain and were between 3 and 6 mo of age. Pax7CreERT2/+ (#017763; Strain), NuTRAP/+ (#029899; Strain), and Rosa26-YFP (#006148; Strain) mice were purchased from Jackson Laboratory, and Smad4 flox/flox mice were kindly provided by Prof. Huiyao Lan (Department of Medicine and Therapeutics, The Chinese University of Hong Kong, Hong Kong), and Pax7CreERT2/+; NuTRAP/+, Pax7CreERT2/+; ROSA26 YFP/+ and Pax7CreERT2/+; ROSA26YFP/+; Smad4 flox/flox were generated by crossing Pax7CreERT2/+ mice with NuTRAP/+ or ROSA26YFP/+ mice or Smad4 flox/flox crossed with Pax7CreERT2/+; ROSA26YFP/+. Tamoxifen is used to activate Cre in mice. Tamoxifen was dissolved (T5648; Sigma-Aldrich) in corn oil at a concentration of 20 mg/ml, and mice received ∼75 mg tamoxifen/kg body weight via intraperitoneal injection for five consecutive days. All the experiments with animals were approved by the Institutional Animal Care and Use Committee (IACUC) at Duke University or the Animal Ethics Committee at Hong Kong University of Science & Technology (HKUST).
Muscle injury using BaCl2 and CTX
To activate MuSC in vivo, 1.2% BaCl2 (wt/vol in H2O) or 10 μM Cardiotoxin (CTX) was used to induce acute injury. Mice were injured by injecting 30 μl of BaCl2 or CTX to TA muscles for immunofluorescence staining or 50 μl of BaCl2 or CTX into the lower hind-limb muscles (below the knee) for flow cytometry to isolate single-nucleus suspension, single-cell suspension, and MuSCs.
snATAC-seq experiment
Injury and no injury lower hind-limb muscles were snap-frozen and sectioned on dry ice and then homogenized on a gentleMACS Octo Dissociator (Miltenyi) using the “Protein_01_01” protocol with MACS buffer (5 mM CaCl2, 2 mM EDTA, 1× protease inhibitor [Roche; 05-892-970-001], 3 mM MgAc, 10 mM Tris-HCl, pH 8, 0.6 mM DTT) and went through 30 μM CellTrics filter (04-004-2326; Sysmex) into 15-ml tubes. After 500 × g, 5 min, 4°C centrifuge, the pellet was resuspended in 3 ml Nuclear Permeabilization Buffer (1× PBS, 5% BSA, 0.2% IGEPAL CA-630 [Sigma-Aldrich], 1 mM DTT, 1× protease inhibitor) and were rotated at 4°C for 5 min. The supernatant was centrifuged and removed, and the permeabilized nuclei were resuspended in 500 μl high salt tagmentation buffer (36.3 mM Tris-acetate [pH = 7.8], 72.6 mM potassium-acetate, 11 mM Mg-acetate, 17.6% DMF) and counted using a hemocytometer. Concentration was adjusted to 1,000 nuclei/9 μl, and 1,000 nuclei were dispensed all four 96-well plates (in total of 384 wells). For tagmentation, 1 μl barcoded Tn5 transposomes (Table S7) were added using a BenchSmart 96 (Mettler Toledo) and incubated for 90 min at 37°C with shaking (900 rpm). To inhibit the Tn5 reaction, 2.5 μl of 100 mM EDTA (final 20 mM) were added to each well with a BenchSmart 96, and the plate was incubated at 37°C for 15 min with shaking (900 rpm). Next, 6 μl of 3× sort buffer (3% BSA, 3 mM EDTA in PBS) were added using a BenchSmart 96. All 384 wells were combined into a separate FACS tube and stained with Draq7 at 1:500 dilution (Cell Signaling). We used a Sony SH800 Sorter (Sony) to sort each well containing 80 nuclei per well into new four 96-well plates (in total of 384 wells) containing 8-μl primer dilution buffers (15 pmol primer i7, 15 pmol primer i5, 200 ng BSA [Sigma-Aldrich], 0.027% SDS; Table S7). The 96-well plate was incubated at 65°C for 25 min in the PCR and 4 μl 1.33% Triton X-100 was added to each well to quench the SDS. Subsequently, 11 μl Q5 mix (5 μl 5 X Q5 buffer, 0.5 μl 10 mM dNTP, 0.25 μl Q5 polymerase, 5.25 μl H2O) were added to each well, and samples were PCR-amplified (72°C 4 min, 98°C 30 s, 98°C 10 s, 60°C 30 s, 72°C 45 s × 12 cycles, held at 4°C). After PCR amplification, all wells were pooled to purify DNA products using the Zymo DNA Clean & Concentrator-5 kit (Cat #11-303; Zymo) according to manufacturer’s protocols. Purifying DNA products was ran in the 1.5% Argo gel and 200∼600 bp DNA library was collected, and the resulting DNA libraries were purified according to the Zymo clean Gel DNA Recovery Kit (Cat #11-300; Zymo) according to manufacturer’s protocols. Final libraries were quantified using a Qubit 1X dsDNA HS Assay Kit (Q33231; Invitrogen) and a nucleosomal pattern of fragment size distribution was verified using a High Sensitivity D1000 Tapestation (5067-5582; Agilent).
FACS sorting of single-cell suspension for MuSC
Isolation of single cell and MuSC by physical dissociation and enzymatic digestion was followed as previously described (Liu et al., 2015). In brief, we dissected the hind limb muscles from the mouse and digested the minced muscles with collagenase II (800 U/ml [LS004177; Worthington,]) in wash medium (F10, 10% horse serum, 1% P/S) for 90 min. The tissue was further digested by collagenase II (100 U/ml) and dispase (1.1 U/ml) in wash medium for 30 min and passed 10 times through a 20-gauge needle, resuspended with wash medium, and went through a 40 μm filter to get single-cell suspension for cell sorting. Single-cell suspensions from WT mice were stained with Propidium Iodide (PI, 1:1,000), and then was sorted on a Sony SH800 sorter equipped with 405-, 488-, 561-, and 633-nm lasers. PI− single cell from WT mice was sorted to single-cell RNAseq. GPF+; PI− or YFP+; PI− single cell from reporter mice was used to isolate MuSC. For MuSCs transplantation, single-cell suspension was stained with BETAGLYCAN antibody (MA5-17187; 1:200; Invitrogen) and stained with APC/Cy7 Goat anti-mouse IgG (405316; 1:500; BioLegend). APC/Cy7 Goat anti-mouse IgG Purified Mouse IgG2b, κ Isotype Ctrl Antibody (400302; 1:500; BioLegend) or secondary single-stained was used as control, the BETAGLYCAN+; GPF+; PI− and BETAGLYCAN−; GPF+; PI− were sorted to transplant, respectively.
scRNA-seq experiment
16 k cells were counted using a hemocytometer and loaded onto a 10× Genomics Chromium chip per manufacturer’s recommendations. Reverse transcription and library preparation was performed using the Chromium Next GEM Single-Cell 3ʹ Reagent Kits v3.1 (10× Gemomis, CG000204) according to manufacturer’s protocols. After a cleanup with SPRIselect Reagent Kit (C10640; Beckman), final libraries were quantified using a Qubit 1X dsDNA HS Assay Kit (Q33231; Invitrogen) and fragment size distribution was verified using a High Sensitivity D1000 Tapestation (5067-5582; Agilent).
MuSC transplantation assay
After tamoxifen activating cre in Pax7creER/+;NuTRAP/+ mice, BaCl2 induced hind limb injury after 3 d, and freshly isolated MuSCs were collected by FACS sorting. EGFP+ MuSCs that were either Betaglycan+ or Betaglycan− were collected for transplantation. The Betaglycan antibody used (Cat #MA5-17187; Thermo Fisher Scientific) for sorting cells was generated from a mouse host. Recipient TA muscles of C57BL6/WT mice were injured with BaCl2 24 h ahead of the transplantation. 10,000 Betaglycan+ and Betaglycan− MuSC cells were injected into the injured recipient TA muscles. 1 mo later, the recipient TA muscle was collected for fixation and cryosection. Sectioned 10-μm slices were collected every 200 μm and subjected to immunostaining. All slices with GFP-positive cells around GFP-positive fibers were regarded as a self-renewed MuSC and quantified and three maximum numbers in each TA muscle were used for statistical analysis. All experimental data were assumed to be normal, and thus a formal test for normality was not carried out.
Isolation of single myofiber
Extensor digitorum longus (EDL) muscles were isolated and digested with Collagenase II (800 units/ml) in the wash medium at 37°C for 75 min. Gentle trituration was performed to release single myofibers from the scattered EDL bundles in the wash medium. Healthy fibers were picked out and cultured in the wash medium for immunostaining. All experimental data were assumed to be normal, and thus a formal test for normality was not carried out.
Bulk RNA-seq experiment
Four pairs of control and Smad4 iKO mice with the same age were injected with Tamoxifen to induce genetic recombination as described above. 40 h after the CTX injury, MuSCs were isolated from the digested gaskin muscles using FACS and then underwent RNA extraction using the NucleoSpin RNA XS kit from Macherey-Nagel. 1 ng high-quality RNA per sample was reverse-transcribed and amplified into cDNA following Smart-seq2 library preparation protocol. Thereafter, amplified cDNA was fragmented by sonication with a Covaris S220 Focused-ultrasonicator. Nugen Ovation Ultralow Library System was the kit used for sample end repair, adaptor ligation, and amplification, in which eight different barcodes were attributed to the eight samples for identification. RNA and DNA qualities were verified with Agilent 2100 Electrophoresis Bioanalyzer Instrument. Finally, after preparation of a high-quality DNA library, pair-end RNA sequencing was done with Illumina Nextseq 500 system in Biosciences Central Research Facility in HKUST.
Bulk RNA-seq data analysis
Upon acquiring the raw sequencing reads, the STAR aligner was applied to map the raw sequencing reads to the mouse genome assembly (mm10). Two-pass STAR alignment was conducted and then subjected to the gene differential expression analysis with Cuffdiff2, in which the significance cutoff was set at 0.05 (false discovery rate [FDR]–adjusted P value). Aligned bam files were converted into bigwig files that could facilitte the visualization of sequencing data in the genome browser. GSEA was performed with the data set generated from the cuffdiff output.
EdU labeling assay
In vitro, freshly sorted MuSCs were cultured in Ham’s F10 media with 10% horse serum (35-030-CV; Corning,) and constantly supplied with 10 mM EdU (A10044; Invitrogen) at the planned time points. For EdU incorporation assay in vivo, TA muscles of C57BL6/WT and Pax7creER/+; NuTRAP/+ mice were injured with BaCl2 after 3 or 4.5 d, and EdU was administered through intracellular injection at a concentration of 150 μg/g of body weight. Mice were sacrificed after 4 h or 1 mo, MuSCs were then fixed, and TA muscles were collected to prepare cryosection and stained using the Click-iT EdU Imaging Kit (C10337; Invitrogen) according to the manufacturer’s instructions.
Histology and immunostaining of muscle cross-section
TA muscles were embedded into Neg-50 medium (6502; Thermo Fisher Scientific) and put into liquid nitrogen for freezing immediately after dissection. The TA muscles were sliced into 10-μm sections. For the hematoxylin-eosin staining, sections were stained with hematoxylin (S3309; Agilent) and eosin (HT110216; Sigma-Aldrich) and photographed using a Leica DM5500B microscope (Leica). For immunostaining, cells and single fiber sections were fixed with 1% PFA for 10 min and permeabilized (0.3% Triton X-100, 0.1 M glycine, PBS) for 30 min, and were blocked with blocking buffer (4% BSA [BSA50, NC9418785; Rockland Immunochemicals]) and 1% goat serum (PCN5000; Gibco). For Pax7 staining, sections were washed in PBS and then antigen retrieved with sodium citrate buffer (10 mM, 0.05% Tween in PBS) at 95°C for 30 min and were washed and blocked with M.O.M. blocking reagent (MKB-2213-1; Vector Laboratories) according to the instruction. Incubations with primary antibodies (Pax7 [AB_528428; 1:200, DSHB]), Betaglycan (SAB4502962; 1:200, Sigma-Aldrich), Laminin (L9393; 1:500, Sigma-Aldrich), GFP (ab13970; Abcam), and MyHC (AB_528352; 1:200; DSHB) were performed overnight at 4°C. Incubation with secondary antibodies conjugated to Alexa Fluor (Life Technologies) was performed for 1 h at room temperature. For section, 0.1% sudan black was used to block the autofluorescence. After several washes with PBS, sections were stained with mounting medium with DAPI (ab104139; Abcam). Some immunofluorescence microscopy (Fig. 4) was performed using a Zeiss 880 Axios Examiner microscope with a 34-channel confocal detector (with GaAsP high QE 32 channel spectral array). With this microsope, imaging data acquisition was performed using the Zeiss ZEN software (version 2.3 SP1 [blue edition]). The Nikon fluorescent microscope (Ni-U) with a SPOT RT3 CCD Camera and a Nikon DS-Qi2 Camera were also used for fluorescence microscopy (Figs. 5, 6, and S3). The Nikon fluorescent microscope was used with the NIS-Elements data. All images were taken at room temperature using the following objective lenses: 20×/1.0 Water Zeiss W Plan-Apochromat 421452-9800 WD 1.8 mm (Fig. 4 G), 63×/1.4 Oil Zeiss Plan-Apochromat 44 07 62 (02) WD 0.19 mm (Fig. 4 E) of the confocal microscope. Other objective lenses used are the 20×, (Figs. 5, E, G, K, and M; Fig. 6 A; and Fig. S3, G, I, and N), 4× (Fig. 5 J and Fig. S3 L left), and 40× (Figs. 6, I and J; and Fig. S3, E and L right) objective lenses of the Nikon fluorescent microscope. All quantifications from microscopy data were assumed to be normal and thus a formal test for normality was not carried out. ImageJ software was used for post-acquisition processing.
snATAC-seq data preprocessing
Raw read sequences were demultiplexed using cutadapt (https://cutadapt.readthedocs.io/en/stable/) and aligned to the 10-mm build of the mouse genome using snaptools (https://github.com/r3fang/SnapTools). Aligned bam files were converted to snap file format and then to sorted fragment files using snaptools’ snap-pre and dump-fragment functions, respectively.
Quality control for snATAC-seq data
Using ArchR (https://www.archrproject.com/index.html), a pipeline tool for the analysis of single-cell ATAC-seq data, arrow files were created for each sample only taking into account cells that had a minimum average transcription start site enrichment of 8 and a minimum of 1,000 unique fragments. Doublet scores were added and doublets filtered based on default ArchR parameters. We created a gene score matrix based on a gene score model (using model 42 in this study; Granja et al., 2021) that best correlated with gene-level chromatin accessibility to gene expression.
Dimensionality reduction and initial analyses of snATAC-seq data
Dimensionality reduction of the snATAC-seq data was carried out using ArchR’s addIterativeLSI functions with batch correction done using ArchR’s implementation of Harmony (Korsunsky et al., 2019), using default parameters in both functions. Following batch correction, nuclei from all samples were clustered using ArchR’s addClusters function with default parameters. The batch-corrected reduced dimensions were further projected for visualization on two dimensions via UMAP using ArchR’s addUMAP function with default parameters. Due to the large global differences between muscle fiber nuclei and mononuclear cell nuclei (compared to the differences among the mononuclear cells), it was difficult to further separate the different mononuclear cell types with fine resolution, on the same UMAP. Thus, we embedded the mononuclear cells on a new UMAP plane without the muscle fiber nuclei.
For downstream analysis, we focused on 54,000 nuclei from mononuclear cells. For these, we performed dimensionality reduction, sample and batch correction, and clustering using the same functions as above, with default parameters. We further projected the reduced dimension to two dimensions using ArchR’s addUMAP function, with a minimum distance of 0.3. Following UMAP projection, we annotated cell types based on the clusters which had maximum accessibility (based on calculated gene scores), for corresponding cell-type specific genes. Genome view of gene accessibility was done using ArchR’s ArchRBrowser function. Wilcoxon test was used to find differentially accessible genes.
TF enrichment analysis
TFs from the Cisbp database (http://cisbp.ccbr.utoronto.ca/) were used for motif annotations. For motif enrichment, we used cell type–specific cREs and, using the one-sided Fisher’s exact test (implemented in ArchR), identified enriched TF motifs. An FDR cutoff of 0.1 and a log2FoldChange of 0.5 were used to identify significantly enriched TF motifs. Footprint and heatmap plots were generated using ArchR’s corresponding functions with default options; however, the smoothWindow parameter for the plotFootprints function was set to 40.
Trajectory analysis of snATAC-seq
Trajectory construction was done using ArchR’s AddTrajectory function, guided by previously identified clusters, biological time points and chromatin accessibility patterns for quiescence-associated and muscle differentiation-associated genes.
Computing cell cycling index
The gene list for calculating cell cycle index was obtained from a recent robust study by Giotti and colleagues (Giotti et al., 2019). We obtained an initial list of 701 identified cell-cycle regulating genes, sorted them based on three criteria: (1) their relevance in the G2M stage of the cell cycle, (2) genes previously known (before the Giotti et al. [2019] study) to play a role in cell cycle regulation, and (3) the number of previous studies citing the gene’s role in cell cycle regulation (selecting genes with previous citations of nine and above). This resulted in a smaller set of 119 high-confidence G2M regulating genes which was used to calculate the cell cycle index using ArchR’s AddModuleScore function.
scRNA-seq data analysis
The fastq files for the external dataset from De Micheli et al. (2020) were obtained from the sequence read archive (accession no. SRR10870296, SRR10870297, and SRR10870298). CellRanger (version 6.0.1) was used for generating count matrices from fastq files (both internally generated and external) and the filtered feature-barcode matrix was used to create a seurat object using Seurat (version 4.0.0). Counts were normalized using the SCTransform function while regressing out mitochondrial genes. Harmony was used to correct the source (external dataset versus internally generated) and sample effects, and subsequent downstream analyses were done using the Harmony-generated reduced dimension. The Pax7-expressing cluster was isolated and re-analyzed with logarithm normalization and similar batch correction approach using Harmony. Subsequent analysis (clustering etc.) was done using the batch-corrected reduced dimension. Wilcoxon test was used to find differentially expressed gene genes.
Statistical analysis
A normal distribution was assumed for all experimental non-omics data and there was no formal test for normality. Test for statistical significance was done using unpaired or paired t test (all non-omics experiments), Wilcoxon test (single cell/nuclei sequence data), and by comparison the distribution of the Cuffdiff-generated samples for each condition. In Cuffdiff (Trapnell et al., 2010, 2012), the estimated posterior samples for each condition were generated by Bayesian inference using a non-negative linear distribution as the likelihood. FDR was used for correction for multiple testing, and graphs are displayed as mean and standard deviation (SD) or standard error of mean (SEM); specific ones used are described in the figure legends. P values are depicted as follows: *P < 0.05, **P < 0.01, ***P < 0.001, ****P <0.0001.
Online supplemental materials
Fig. S1 shows single-nuclei ATAC-seq analysis of mouse skeletal muscle before and after multiple times of acute injury. Fig. S2 shows scRNA-seq analysis of the whole-cell isolates obtained from the lower hind limb muscle of uninjured and 3 dpi mice. Fig. S3 shows MuSC-specific SMAD4 KO does not affect adult MuSC maintenance but disrupts skeletal muscle regeneration. Table S1 lists temporally resolved cell type–specific gene score across muscle regeneration times (related to Fig. 1 D). Table S2 shows temporally resolved cell type–specific cRE accessibility across muscle regeneration times (related to Fig. 1 E). Table S3 shows temporally resolved cell type–specific motif across muscle regeneration times (related to Fig. 1 G). Table S4 shows differentially expressed genes per MuSC/MPC sub-type in muscle regeneration (related to Fig. 5). Table S5 shows significant GSEA terms of each sub-cluster of MuSC/MPCs (related to Fig. 3). Table S6 shows significantly enriched biological terms self-renewing versus genuine quiescent MuSCs in muscle regeneration (related to Fig. 5 B). Table S7 shows DNA oligos used in this study for snATAC-seq and PCR.
Data availability
Sequencing data have been deposited to the NCBI Gene Expression Omnibus (GEO) under accession number GSE199499. The publicly available scRNA-seq data used have the accession numbers SRR10870296, SRR10870297, and SRR10870298. The raw data have been made publicly available on Dryad (https://doi.org/10.5061/dryad.j0zpc86kr). Additional materials and associated protocols are available upon request.
Acknowledgments
We thank Drs. Brigid Hogan and Kenneth Poss for feedback on previous versions of the manuscript and Dr. Sharyn Endow for helping with Tn5 purification.
This work is supported by a new lab startup fund from Duke Regeneration Center (to Y. Diao), Duke Whitehead Scholarship (to Y. Diao), and the Glenn Foundation for Medical Research and AFAR Grants for Junior Faculty (to Y. Diao).
Author contributions: Conceptualization: A.E. Okafor; X. Lin; Y. Diao. Data curation: Y. Xiang, A. E. Okafor, X. Lin. Formal analysis: A. E. Okafor (omics data), X. Lin, and C. Situ (other experimental data). Funding acquisition: Y. Diao. Investigation: A.E. Okafor, X. Lin, C. Situ, X. Wei, Y. Xiang, X. Wei, Z. Wu, Y. Diao. Methodology: A.E. Okafor, X. Lin, C. Situ, X. Wei, Y. Xiang. Project administration: Z. Wu, Y. Diao. Supervision: Z. Wu, Y. Diao. Validation: X. Lin. Visualization: A.E. Okafor, X. Lin, C. Situ. Writing—original draft: A.E. Okafor, X. Lin, C. Situ, Z. Wu, Y. Diao. Writing—review & editing: A.E. Okafor, X. Lin, Y. Diao.

