


β-coronaviruses reshape host cell endomembranes to form double-membrane vesicles (DMVs) for genome replication and transcription. Ectopically expressed viral nonstructural proteins nsp3 and nsp4 interact to zipper and bend the ER for DMV biogenesis. Genome-wide screens revealed the autophagy proteins VMP1 and TMEM41B as important host factors for SARS-CoV-2 infection. Here, we demonstrated that DMV biogenesis, induced by virus infection or expression of nsp3/4, is impaired in the VMP1 KO or TMEM41B KO cells. In VMP1 KO cells, the nsp3/4 complex forms normally, but the zippered ER fails to close into DMVs. In TMEM41B KO cells, the nsp3–nsp4 interaction is reduced and DMV formation is suppressed. Thus, VMP1 and TMEM41B function at different steps during DMV formation. VMP1 was shown to regulate cross-membrane phosphatidylserine (PS) distribution. Inhibiting PS synthesis partially rescues the DMV defects in VMP1 KO cells, suggesting that PS participates in DMV formation. We provide molecular insights into the collaboration of host factors with viral proteins to remodel host organelles.
Introduction
The β-coronavirus family of positive-strand RNA viruses includes severe acute respiratory syndrome coronavirus 2 (SARS-CoV-2), SARS-CoV, Middle East Respiratory Syndrome Coronavirus (MERS-CoV), and four seasonal coronaviruses (HCoV-OC43, HCoV-NL63, HCoV-HKU1, and HCoV-229E). After entering host cells, the genomic RNA of β-coronaviruses is translated into two large polyproteins which are then cleaved into 16 mature viral proteins, namely nonstructural proteins (nsps) 1–16 (Prentice et al., 2004; Thiel et al., 2003). Some of the nsps drive the rearrangement of host membranes to form viral replication organelles (ROs) that anchor the viral replication transcription complexes (RTCs). The most prominent ROs induced by β-coronavirus infection are double-membrane vesicles (DMVs; Knoops et al., 2008; Miao et al., 2021; Snijder et al., 2020; Cortese et al., 2020; Mohan and Wollert, 2021). The DMVs provide a favorable microenvironment for protecting newly synthesized viral products from innate immune surveillance of the host cells.
Previous studies demonstrated that the ectopic expression of β-coronaviruses nsp3 and nsp4 is sufficient to induce DMVs and convoluted membranes (CMs; Oudshoorn et al., 2017; Wolff et al., 2020; Twu et al., 2021). Like autophagosomes, DMVs are double-membrane structures with a relatively smaller size of ∼200–400 nm in diameter, and their generation is closely linked with the ER. Furthermore, DMVs of mouse hepatitis virus (MHV), another β-coronavirus family member, are labeled with the autophagy marker LC3-I (Reggiori et al., 2010). Phosphatidylinositol 3-kinase (PI3K) complex, which is required for autophagy, is also involved in DMV generation in SARS-CoV-2-infected cells; however, many essential autophagy genes, such as those involved in conjugation systems, are dispensable for virus replication (Twu et al., 2021). Overall, the underlying molecular mechanism of DMV formation and the role of host factors in this process remain largely unknown.
Genetic screens to identify the host proteins required for SARS-CoV-2 infection revealed that TMEM41B and VMP1 are important for virus infection (Schneider et al., 2021). Both VMP1 and TMEM41B are integral ER-localized proteins and belong to the VTT domain family. They form a complex essential for autophagosome biogenesis and lipid mobilization (Morita et al., 2018; Moretti et al., 2018; Shoemaker et al., 2019; Zhao et al., 2017). VMP1 also regulates the disassembly of ER contacts with other organelles, including autophagosomes, mitochondria, endosomes, and lipid droplets (LDs), via activation of the ER calcium transporter SERCA (Zhao et al., 2017). Recent studies revealed that VMP1 and TMEM41B act as scramblases, regulating cross-membrane distribution of phospholipids (Ghanbarpour et al., 2021; Li et al., 2021; Huang et al., 2021).
Here, we demonstrated that both VMP1 and TMEM41B are required for β-coronavirus infection and they function at distinct steps of DMV biogenesis. Using DMV induction by coexpression of SARS-CoV-2 nsp3 and nps4 as a model, we discovered that DMV formation was greatly suppressed in VMP1 or TMEM41B KO cells. VMP1 was recruited to nsp3/4-positive structures by binding to nps3/4 through its luminal loop. In VMP1 KO cells, the closure of DMVs was blocked without affecting the binding of nsp3 to nsp4. By contrast, TMEM41B deficiency significantly reduced the formation of nsp3/4 complexes. VMP1 and TMEM41B regulate PS distribution as scramblases. Depletion of the PS synthase PTDSS1 suppressed the DMV abnormalities in VMP1 KO cells, suggesting that the misallocation of PS may contribute to the defect. Our findings provide insights into the mechanism of membrane arrangement for optimal β-coronavirus replication.
Results and discussion
VMP1 and TMEM41B are essential for β-coronavirus infection
Previous genome-wide CRISPR screens identified that host proteins VMP1 and TMEM41B are critical for SARS-CoV-2 infection (Schneider et al., 2021). We verified the effect of VMP1 or TMEM41B deficiency on the infection of the murine β-coronavirus, MHV-A59, which is a prototype strain and can be used in biosafety level 2 (BSL-2) labs. After infection with a reporter MHV-A59 (MHV-A59/GFP; Das Sarma et al., 2002; Ding et al., 2011) for 9 h, GFP and dsRNA, presumed intermediates in viral RNA replication, were hardly detected in VMP1 or TMEM41B KO cells transiently expressing the MHV-A59 receptor Flag-mCEACAM1, while control cells were effectively infected (Figs. 1 A; and S1, A–D). We then constructed the control, VMP1 and TMEM41B KO HeLa cells, stably expressing the MHV-A59 receptor mCEACAM1 (Fig. 1 B). Consistent with the above result, the expression of viral protein nsp9 was completely blocked in VMP1 or TMEM41B KO cells, while high levels of nsp9 were detected in control cells 16 h after infection (Fig. 1 B). Quantitative PCR results showed that viral genomic RNA levels were comparable in the control, VMP1 KO and TMEM41B KO cells, 3 h after infection (Fig. 1 C), suggesting that entry of the virus is not affected by the depletion of VMP1 or TMEM41B. Taken together, these data indicate the essential roles of VMP1 and TMEM41B in the β-coronavirus intracellular lifecycle, downstream of virus entry.
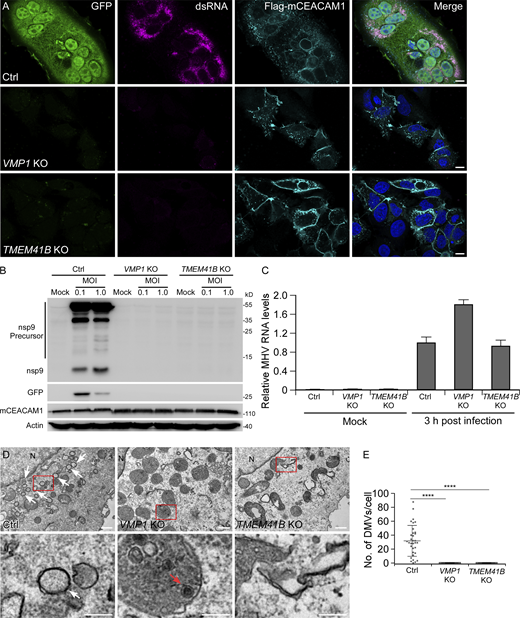
VMP1 and TMEM41B are required for β-coronavirus infection. (A) Immunostaining results show that GFP expression from an MHV-A59/GFP reporter virus and virus-specific dsRNA is detected in control (Ctrl) HeLa cells, but not in VMP1 KO or TMEM41B KO cells 9 h after MHV-A59 infection. Efficient expression of the MHV-A59 receptor Flag-mCEACAM1 is verified by immunostaining with Flag antibody. Bars: 10 μm. (B) 16 h after MHV-A59/GFP infection at the indicated multiplicity of infection (MOI), high levels of nsp9 precursors, mature nsp9, and GFP are detected in control HeLa cells, while no expression of nsp9 or GFP is detected in VMP1 KO or TMEM41B KO cells. The expression levels of mCEACAM1 are comparable in control and KO cells. (C) Control, VMP1 KO, and TMEM41B KO cells were infected with MHV-A59 for 3 h. Viral RNA levels were determined by quantitative PCR using virus-specific primers. Values were normalized to GAPDH mRNA levels (n = 3). (D and E) TEM analysis shows that numerous DMVs are observed in control cells 6 h after MHV-A59 infection. No DMVs are formed in VMP1 KO or TMEM41B KO cells (D). Virus (red arrow) is occasionally detected in endolysosomes of VMP1 KO cells. White arrows indicate DMVs. N, nucleus. Quantification of DMV numbers per cell is shown as mean ± SD (Ctrl, n = 33; VMP1 KO, n = 42; TMEM41B KO, n = 25; E). ****, P < 0.0001. Bars: 500 nm; inserts, 200 nm. Source data are available for this figure: SourceData F1.
VMP1 and TMEM41B are required for β-coronavirus infection. (A) Immunostaining results show that GFP expression from an MHV-A59/GFP reporter virus and virus-specific dsRNA is detected in control (Ctrl) HeLa cells, but not in VMP1 KO or TMEM41B KO cells 9 h after MHV-A59 infection. Efficient expression of the MHV-A59 receptor Flag-mCEACAM1 is verified by immunostaining with Flag antibody. Bars: 10 μm. (B) 16 h after MHV-A59/GFP infection at the indicated multiplicity of infection (MOI), high levels of nsp9 precursors, mature nsp9, and GFP are detected in control HeLa cells, while no expression of nsp9 or GFP is detected in VMP1 KO or TMEM41B KO cells. The expression levels of mCEACAM1 are comparable in control and KO cells. (C) Control, VMP1 KO, and TMEM41B KO cells were infected with MHV-A59 for 3 h. Viral RNA levels were determined by quantitative PCR using virus-specific primers. Values were normalized to GAPDH mRNA levels (n = 3). (D and E) TEM analysis shows that numerous DMVs are observed in control cells 6 h after MHV-A59 infection. No DMVs are formed in VMP1 KO or TMEM41B KO cells (D). Virus (red arrow) is occasionally detected in endolysosomes of VMP1 KO cells. White arrows indicate DMVs. N, nucleus. Quantification of DMV numbers per cell is shown as mean ± SD (Ctrl, n = 33; VMP1 KO, n = 42; TMEM41B KO, n = 25; E). ****, P < 0.0001. Bars: 500 nm; inserts, 200 nm. Source data are available for this figure: SourceData F1.
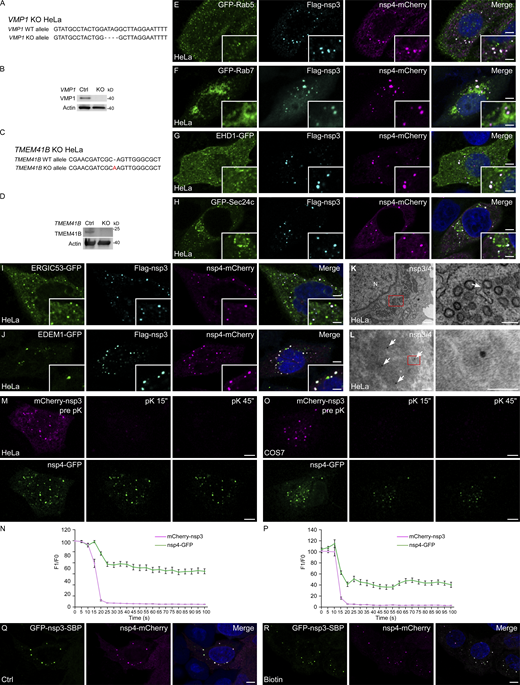
DMVs are induced by coexpression of SARS-CoV-2 nsp3 and nsp4, related to Figs. 1 and 2. (A) Genomic DNA sequences of VMP1 in control and VMP1 KO HeLa cells. Deletions are indicated by dashes. (B) Immunoblotting with VMP1 antibody verifies the KO efficiency in VMP1 KO HeLa cells. (C) Genomic DNA sequences of TMEM41B in control and TMEM41B KO HeLa cells. The insertion is highlighted in red. (D) Immunoblotting with TMEM41B antibody verifies the KO efficiency in TMEM41B KO HeLa cells. (E–J) Immunostaining shows that Flag-nsp3/nsp4-mCherry double positive foci do not colocalize with GFP-Rab5 (E), GFP-Rab7 (F), EHD1-GFP (G), GFP-Sec24c (H), ERGIC53-GFP (I), or EDEM1-GFP (J). Bars: 5 μm; inserts, 2 μm. (K) TEM analysis demonstrates that clusters of DMVs are formed in HeLa cells coexpressing nsp3/4. The arrow indicates a DMV associated with the ER. The red boxed area in the left panel is enlarged in the right panel. N, nucleus. Bars: left panel, 500 nm; right panel, 200 nm. (L) Immuno-electron microscopy micrographs of control cells coexpressing mCherry-nsp3 and nsp4-GFP. Anti-GFP antibody (10 nm gold, arrows) was used to detect nsp4-GFP. The red boxed area in the left panel is enlarged in the right panel. Bars: left panel, 100 nm; right panel, 50 nm. (M and N) In FPP assays, time-lapse images show that mCherry-nsp3 puncta immediately disappear while most of nsp4-GFP puncta persist upon pK addition in digitonin-permeabilized HeLa cells coexpressing nsp3/4 (M). Quantitative data are shown as mean ± SEM (n = 16; N). Bars: 5 μm. (O and P) In FPP assays, time-lapse images show that mCherry-nsp3 puncta immediately disappear while most of nsp4-GFP puncta persist upon pK addition in digitonin-permeabilized COS7 cells coexpressing nsp3/4 (O). Quantitative data are shown as mean ± SEM (n = 17; P). Bars: 5 μm. (Q and R) HeLa cells coexpressing GFP-nsp3-SBP and nsp4–mCherry at control (Q) and 24 h biotin treatment (R) conditions. Bars, 5 μm. Source data are available for this figure: SourceData FS1.
DMVs are induced by coexpression of SARS-CoV-2 nsp3 and nsp4, related to Figs. 1 and 2. (A) Genomic DNA sequences of VMP1 in control and VMP1 KO HeLa cells. Deletions are indicated by dashes. (B) Immunoblotting with VMP1 antibody verifies the KO efficiency in VMP1 KO HeLa cells. (C) Genomic DNA sequences of TMEM41B in control and TMEM41B KO HeLa cells. The insertion is highlighted in red. (D) Immunoblotting with TMEM41B antibody verifies the KO efficiency in TMEM41B KO HeLa cells. (E–J) Immunostaining shows that Flag-nsp3/nsp4-mCherry double positive foci do not colocalize with GFP-Rab5 (E), GFP-Rab7 (F), EHD1-GFP (G), GFP-Sec24c (H), ERGIC53-GFP (I), or EDEM1-GFP (J). Bars: 5 μm; inserts, 2 μm. (K) TEM analysis demonstrates that clusters of DMVs are formed in HeLa cells coexpressing nsp3/4. The arrow indicates a DMV associated with the ER. The red boxed area in the left panel is enlarged in the right panel. N, nucleus. Bars: left panel, 500 nm; right panel, 200 nm. (L) Immuno-electron microscopy micrographs of control cells coexpressing mCherry-nsp3 and nsp4-GFP. Anti-GFP antibody (10 nm gold, arrows) was used to detect nsp4-GFP. The red boxed area in the left panel is enlarged in the right panel. Bars: left panel, 100 nm; right panel, 50 nm. (M and N) In FPP assays, time-lapse images show that mCherry-nsp3 puncta immediately disappear while most of nsp4-GFP puncta persist upon pK addition in digitonin-permeabilized HeLa cells coexpressing nsp3/4 (M). Quantitative data are shown as mean ± SEM (n = 16; N). Bars: 5 μm. (O and P) In FPP assays, time-lapse images show that mCherry-nsp3 puncta immediately disappear while most of nsp4-GFP puncta persist upon pK addition in digitonin-permeabilized COS7 cells coexpressing nsp3/4 (O). Quantitative data are shown as mean ± SEM (n = 17; P). Bars: 5 μm. (Q and R) HeLa cells coexpressing GFP-nsp3-SBP and nsp4–mCherry at control (Q) and 24 h biotin treatment (R) conditions. Bars, 5 μm. Source data are available for this figure: SourceData FS1.
VMP1 and TMEM41B are integral ER-localized proteins that are required for normal autophagosome and LD formation (Morita et al., 2018; Moretti et al., 2018; Shoemaker et al., 2019; Zhao et al., 2017), two processes involving the ER. As β-coronaviruses rearrange the ER of host cells to form DMVs, we thus speculated that VMP1 and TMEM41B may regulate DMV biogenesis. To test this hypothesis, we analyzed the cells by transmission electron microscopy (TEM) to examine the formation of DMVs in MHV-A59-infected cells. In control HeLa cells, DMVs obviously accumulated at 6 h post-MHV-A59 inoculation. The diameters of DMVs ranged from 150 to 370 nm. However, almost no DMVs were present in VMP1 or TMEM41B-depleted cells (Fig. 1, D and E). Viruses were occasionally found in the endolysosomes in VMP1 KO cells (Fig. 1 D), suggesting that endocytosis-mediated virus entry still occurred. Thus, VMP1 and TMEM41B may play important roles in DMV generation.
Ectopic expression of SARS-CoV-2 nsp3 and nsp4 induces DMV formation
Previous studies revealed that the coexpression of β-coronavirus nsp3 and nsp4 induces the formation of zippered ER and DMVs (Oudshoorn et al., 2017; Twu et al., 2021). We transiently transfected SARS-CoV-2 nsp3 and nsp4 and found that they ubiquitously labeled the ER when transfected individually, while the coexpression of both proteins led to the formation of a large number of discrete puncta (Fig. 2 A). The nsp3/4+ foci were distinct from Rab5-labeled early endosomes, Rab7-labeled late endosomes, EHD1-labeled recycling endosomes, Sec24c-labeled COPII vesicles, ERGIC53-labeled ERGIC, or EDEM1-labeled EDEMosomes (Fig. S1, E–J). Three-dimensional single-molecule localization microscopy (3D-SMLM) imaging revealed that the nsp3/4+ puncta were composed of multiple small (∼100 nm) vesicles in 3D clusters (Fig. 2 B). We then performed TEM analysis to examine the ultrastructure of these foci. Consistent with the previous report (Twu et al., 2021), numerous DMVs were detected in cells coexpressing nsp3 and nsp4, and they correlated with nsp3/4+ foci (Figs. 2, C and F; and S1, K and L), although their size was more uniform and relatively small, ranging from 50 to 100 nm, compared with an average of 250 nm in SARS-CoV-2-infected cells (Fig. 2, C–E; Mihelc et al., 2021). Most DMVs induced by nsp3/4 formed dense clusters intertwined with the ER at perinuclear regions, while some of the DMVs were still associated with the ER (Figs. 2 C and S1 K).
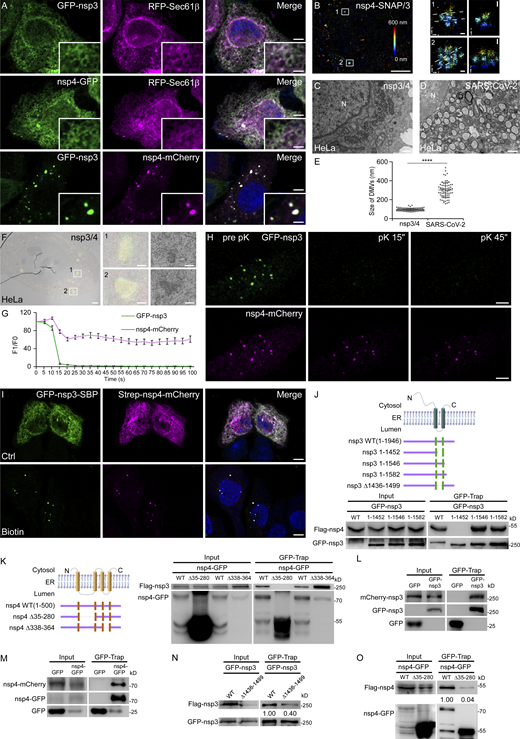
Ectopic expression of SARS-CoV-2 nsp3 and nsp4 is sufficient to induce DMVs. (A) In HeLa cells expressing GFP-nsp3 or nsp4-GFP alone, each protein shows a diffuse ER pattern and colocalizes with RFP-Sec61β. When cells are cotransfected with GFP-nsp3 and nsp4-mCherry, a large number of foci are observed, which are positive for both nsp3 and nsp4. Bars: 5 μm; inserts, 2 μm. (B) 3D-SMLM imaging of nsp4-SNAP co-transfected with GFP-nsp3 in a cell. The left panel shows the image of two nsp4 puncta in a large area with the z position color-coded. The middle panels show the x-y cross-sections of the boxed regions 1 and 2. The corresponding vertical cross-sections along the dotted lines are shown in the right panels. Bars: left panel, 5 μm; middle and right panels, 100 nm. (C–E) TEM images demonstrate that numerous DMVs are detected in HeLa cells coexpressing nsp3/4 (C). The sizes of DMVs formed during SARS-CoV-2 infection are larger than those induced by nsp3/4 expression (D). N, nucleus. Quantification of the size of DMVs is shown as mean ± SD (nsp3/4, n = 125; SARS-CoV-2, n = 71; E). ****, P < 0.0001. Bars: 500 nm. (F) CLEM images of a control cell expressing GFP-nsp3 and nsp4-mCherry. The left panel shows two nsp4 puncta in a large area. The middle and right panels show the boxed regions 1 and 2. Bars: left panel, 2 μm; middle and right panels, 500 nm. (G and H) In FPP assays, time-lapse images show that GFP-nsp3 puncta immediately disappear, while most of nsp4-mCherry puncta persist upon pK (proteinase K) addition in digitonin-permeabilized HeLa cells coexpressing nsp3/4 (H). Quantitative data (n = 11) are shown as mean ± SEM (G). Bars: 5 μm. (I) In most cells cotransfected with plasmids expressing GFP-nsp3-SBP and Strep-nsp4-mCherry, the two proteins show a diffuse ER pattern. After the addition of biotin for 24 h, GFP-nsp3-SBP and Strep-nsp4-mCherry form punctate structures. Bars, 5 μm. (J) The top panel shows a schematic of the topology of nsp3, and the structures of the nsp3 truncations. The bottom panel demonstrates that Flag–nsp4 is immunoprecipitated by WT GFP-nsp3, GFP-nsp3(1–1546), or GFP-nsp3(1–1582), but not GFP-nsp3(1-1452) in a GFP-Trap assay. (K) The left panel shows a schematic of the topology of nsp4 and the structures of the nsp4 truncations. The right panel demonstrates that Flag-nsp3 is immunoprecipitated by WT nsp4-GFP or nsp4(Δ338-364)-GFP, but not nsp4(Δ35-280)-GFP in a GFP-Trap assay. (L) In a GFP-Trap assay, mCherry-nsp3 is immunoprecipitated by GFP-nsp3. (M) In a GFP-Trap assay, nsp4–mCherry is immunoprecipitated by nsp4-GFP. (N) In a GFP-Trap assay, more Flag-nsp3 is immunoprecipitated by WT GFP-nsp3, compared with GFP-nsp3(Δ1436-1499). (O) In a GFP-Trap assay, more Flag-nsp4 is immunoprecipitated by WT nsp4-GFP, compared with nsp4(Δ35–280)-GFP. Source data are available for this figure: SourceData F2.
Ectopic expression of SARS-CoV-2 nsp3 and nsp4 is sufficient to induce DMVs. (A) In HeLa cells expressing GFP-nsp3 or nsp4-GFP alone, each protein shows a diffuse ER pattern and colocalizes with RFP-Sec61β. When cells are cotransfected with GFP-nsp3 and nsp4-mCherry, a large number of foci are observed, which are positive for both nsp3 and nsp4. Bars: 5 μm; inserts, 2 μm. (B) 3D-SMLM imaging of nsp4-SNAP co-transfected with GFP-nsp3 in a cell. The left panel shows the image of two nsp4 puncta in a large area with the z position color-coded. The middle panels show the x-y cross-sections of the boxed regions 1 and 2. The corresponding vertical cross-sections along the dotted lines are shown in the right panels. Bars: left panel, 5 μm; middle and right panels, 100 nm. (C–E) TEM images demonstrate that numerous DMVs are detected in HeLa cells coexpressing nsp3/4 (C). The sizes of DMVs formed during SARS-CoV-2 infection are larger than those induced by nsp3/4 expression (D). N, nucleus. Quantification of the size of DMVs is shown as mean ± SD (nsp3/4, n = 125; SARS-CoV-2, n = 71; E). ****, P < 0.0001. Bars: 500 nm. (F) CLEM images of a control cell expressing GFP-nsp3 and nsp4-mCherry. The left panel shows two nsp4 puncta in a large area. The middle and right panels show the boxed regions 1 and 2. Bars: left panel, 2 μm; middle and right panels, 500 nm. (G and H) In FPP assays, time-lapse images show that GFP-nsp3 puncta immediately disappear, while most of nsp4-mCherry puncta persist upon pK (proteinase K) addition in digitonin-permeabilized HeLa cells coexpressing nsp3/4 (H). Quantitative data (n = 11) are shown as mean ± SEM (G). Bars: 5 μm. (I) In most cells cotransfected with plasmids expressing GFP-nsp3-SBP and Strep-nsp4-mCherry, the two proteins show a diffuse ER pattern. After the addition of biotin for 24 h, GFP-nsp3-SBP and Strep-nsp4-mCherry form punctate structures. Bars, 5 μm. (J) The top panel shows a schematic of the topology of nsp3, and the structures of the nsp3 truncations. The bottom panel demonstrates that Flag–nsp4 is immunoprecipitated by WT GFP-nsp3, GFP-nsp3(1–1546), or GFP-nsp3(1–1582), but not GFP-nsp3(1-1452) in a GFP-Trap assay. (K) The left panel shows a schematic of the topology of nsp4 and the structures of the nsp4 truncations. The right panel demonstrates that Flag-nsp3 is immunoprecipitated by WT nsp4-GFP or nsp4(Δ338-364)-GFP, but not nsp4(Δ35-280)-GFP in a GFP-Trap assay. (L) In a GFP-Trap assay, mCherry-nsp3 is immunoprecipitated by GFP-nsp3. (M) In a GFP-Trap assay, nsp4–mCherry is immunoprecipitated by nsp4-GFP. (N) In a GFP-Trap assay, more Flag-nsp3 is immunoprecipitated by WT GFP-nsp3, compared with GFP-nsp3(Δ1436-1499). (O) In a GFP-Trap assay, more Flag-nsp4 is immunoprecipitated by WT nsp4-GFP, compared with nsp4(Δ35–280)-GFP. Source data are available for this figure: SourceData F2.
To examine the localization of nsp3 and nsp4 on DMVs, we performed fluorescence protease protection (FPP) assays. Cells expressing GFP-nsp3 and nsp4-mCherry were incubated with digitonin to permeabilize the PM but leave the endomembranes intact, and then treated with proteinase K (pK). Consistent with the TEM results, GFP-nsp3 foci were digested immediately after pK addition, suggesting that GFP-nsp3 localizes on the outer membrane of the DMVs (Fig. 2, G and H). This is also consistent with the reported location of GFP-nsp3 at the pores spanning the double membrane (Wolff et al., 2020). The weak fluorescence of nsp4-mCherry remaining on the ER quickly disappeared upon pK treatment, while punctate signals of nsp4 were slightly decreased and then remained stable during the observation time (Fig. 2, G and H). This indicates that nsp4 mainly localizes to the inner membrane of the DMVs. The decreased nsp4 signal may originate from the ER structures entwined with DMV clusters or small amounts of nsp4 on the cytosolic side of the DMVs. The distinct digestion patterns of nsp3 and nsp4 were not caused by differential sensitivity of GFP and mCherry to pK treatment (Fig. S1, M and N). Similar results were also obtained in COS7 cells (Fig. S1, O and P). To examine if the distinct localization of nsp3 and nsp4 is important for DMV biogenesis, we utilized a Strep-SBP heterodimerization system by fusing streptavidin (Strep) to nsp4-mCherry and a streptavidin binding peptide (SBP) to GFP-nsp3. The Strep-SBP interaction tethers nsp3 and nsp4 together on the same side of the ER. When GFP-nsp3-SBP and Strep-nsp4-mCherry were coexpressed, they ubiquitously localized on the ER with few puncta formed. After the addition of biotin, which dissociates nsp3 and nsp4 by competing with SBP for Strep binding, nsp3/4+ puncta were formed (Fig. 2 I; and Fig. S1, Q and R). These data suggest that the uncoupling of nsp3 and nsp4 is critical for DMV formation.
Previous results showed that nsp3 and nsp4 interact with each other through the luminal loop of nsp3 and the first luminal loop of nsp4 (Hagemeijer et al., 2014; Sakai et al., 2017). Here, we found that SARS-CoV-2 nsp3 and nsp4 are also bound to each other in a similar way (Fig. 2, J and K). Moreover, nsp3 and nsp4 exhibited self-interaction, which also required their luminal domains (Fig. 2, L–O). As nsp3 and nsp4 localize at opposite sides of DMV membranes, this self-oligomerization may mediate their concentration at the DMV formation sites on the ER to drive membrane curving.
VMP1 and TMEM41B play different roles in DMV formation
DMV induction by nsp3 and nsp4 provides an ideal system to study this process separately from other events in the viral life cycle. We investigated the role of VMP1 and TMEM41B in the formation of DMVs. In VMP1 KO cells cotransfected with nsp3 and nsp4, intense nsp3/4+ foci were still efficiently induced, while in TMEM41B KO cells, the formation of nsp3/4+ foci was significantly reduced compared with control cells (Fig. 3, A–C). TEM analysis showed that the formation of DMVs was greatly suppressed in VMP1- or TMEM41B-deficient cells (Fig. 3, D and E). Control HeLa cells contained clustered DMVs, while VMP1 KO or TMEM41B KO HeLa cells contained occasional scattered DMVs (Fig. 3 D). Interestingly, we detected concentric structures consisting of paired ER in VMP1 KO cells, but not in TMEM41B KO cells (Fig. 3, D and F). Similar structures were present in VMP1 KO COS7 cells (Fig. S2 A). The irregular membrane structures observed in VMP1 KO cells resemble those caused by uncleaved nsp3-4 polyprotein (Oudshoorn et al., 2017). Therefore, in VMP1 KO cells, nsp3 and nsp4 may be juxtaposed in the ER membrane.

VMP1 and TMEM41B are involved at distinct steps of DMV generation. (A – C) Cotransfection of nsp3 and nsp4 induces punctate structures in control, VMP1 KO and TMEM41B KO cells (A). Formation of nsp3/4+ puncta is less efficient in TMEM41B KO cells. The percentages of cells with formation of nsp3/4+ foci (Ctrl, n = 105; VMP1 KO, n = 104; TMEM41B KO, n = 110; B) and the numbers of nsp3/4+ foci (Ctrl, n = 45; VMP1 KO, n = 22; TMEM41B KO, n = 54; C) are quantified. ***, P < 0.001; ****, P < 0.0001; N.S., not significant. Bars: 5 μm. (D and E) TEM images show that coexpression of nsp3/4 induces clusters of DMVs in control HeLa cells, while in VMP1 KO and TMEM41B KO cells, the number of DMVs is greatly reduced and most DMVs are scattered in the cytosol. White arrows indicate DMVs. Concentric zippered membranes (red arrow) are present in VMP1 KO cells (D). N, nucleus. The numbers of DMVs per cell are quantified and shown as mean ± SEM (Ctrl, n = 108; VMP1 KO, n = 133; TMEM41B KO, n = 60; E). *, P < 0.05; ***, P < 0.001; N.S., not significant. Bars: 500 nm. (F) CLEM images of a VMP1 KO cell expressing GFP-nsp3 and nsp4-mCherry. The right panel shows the boxed region in the left panel. Bars: left panel, 2 μm; middle and right panels, 500 nm. (G–I) In FPP assays, time-lapse images show that most of the nsp4-mCherry puncta persist upon pK addition in digitonin-permeabilized control HeLa cells coexpressing nsp3/4 (G). In VMP1 KO HeLa cells, nsp4-mCherry is quickly digested upon pK treatment (H). Quantitative data are shown as mean ± SEM (Ctrl, n = 11; VMP1 KO, n = 13; I). Bars: 5 μm. (J and K) In FPP assays, nsp4-mCherry is resistant to pK treatment in VMP1 KO HeLa cells expressing WT GFP-VMP1, but not GFP-VMP1(G195R) (J). Quantitative data are shown as mean ± SEM (WT, n = 12; G195R, n = 16; G197R, n = 13; K). Bar: 5 μm.
VMP1 and TMEM41B are involved at distinct steps of DMV generation. (A – C) Cotransfection of nsp3 and nsp4 induces punctate structures in control, VMP1 KO and TMEM41B KO cells (A). Formation of nsp3/4+ puncta is less efficient in TMEM41B KO cells. The percentages of cells with formation of nsp3/4+ foci (Ctrl, n = 105; VMP1 KO, n = 104; TMEM41B KO, n = 110; B) and the numbers of nsp3/4+ foci (Ctrl, n = 45; VMP1 KO, n = 22; TMEM41B KO, n = 54; C) are quantified. ***, P < 0.001; ****, P < 0.0001; N.S., not significant. Bars: 5 μm. (D and E) TEM images show that coexpression of nsp3/4 induces clusters of DMVs in control HeLa cells, while in VMP1 KO and TMEM41B KO cells, the number of DMVs is greatly reduced and most DMVs are scattered in the cytosol. White arrows indicate DMVs. Concentric zippered membranes (red arrow) are present in VMP1 KO cells (D). N, nucleus. The numbers of DMVs per cell are quantified and shown as mean ± SEM (Ctrl, n = 108; VMP1 KO, n = 133; TMEM41B KO, n = 60; E). *, P < 0.05; ***, P < 0.001; N.S., not significant. Bars: 500 nm. (F) CLEM images of a VMP1 KO cell expressing GFP-nsp3 and nsp4-mCherry. The right panel shows the boxed region in the left panel. Bars: left panel, 2 μm; middle and right panels, 500 nm. (G–I) In FPP assays, time-lapse images show that most of the nsp4-mCherry puncta persist upon pK addition in digitonin-permeabilized control HeLa cells coexpressing nsp3/4 (G). In VMP1 KO HeLa cells, nsp4-mCherry is quickly digested upon pK treatment (H). Quantitative data are shown as mean ± SEM (Ctrl, n = 11; VMP1 KO, n = 13; I). Bars: 5 μm. (J and K) In FPP assays, nsp4-mCherry is resistant to pK treatment in VMP1 KO HeLa cells expressing WT GFP-VMP1, but not GFP-VMP1(G195R) (J). Quantitative data are shown as mean ± SEM (WT, n = 12; G195R, n = 16; G197R, n = 13; K). Bar: 5 μm.

Distinct roles of VMP1 and TMEM41B in DMV biogenesis, related to Fig. 3. (A) TEM analysis shows that when nsp3/4 are ectopically expressed, large number of DMVs (white arrow) are induced in control COS7 cells. In VMP1 KO COS7 cells, the zippered ER forms concentric membrane structures (red arrow) and only a few DMVs are generated. N, nucleus. Bars: left panel, 500 nm; right panel, 200 nm. (B–D) In FPP assays, time-lapse images show that most of the nsp4-mCherry puncta persist upon pK addition in digitonin-permeabilized control COS7 cells coexpressing nsp3/4 (C). In VMP1 KO COS7 cells, nsp4–mCherry is quickly digested upon pK treatment (D). Quantitative data are shown as mean ± SEM (Ctrl, n = 11; VMP1 KO, n = 12; B). Bars: 5 μm. (E and F) In FPP assays, similar to control HeLa cells, mCherry-nsp3 is digested by pK, while nsp4-GFP is resistant to pK in TMEM41B KO cells expressing nsp3/4 (E). Quantitative data are shown as mean ± SEM (n = 18; F). Bars: 5 μm. (G) In FPP assays, nsp4-mCherry is sensitive to pK treatment in VMP1 KO HeLa cells expressing GFP-VMP1(G197R). Bar: 5 μm. (H) Immunostaining with LC3 antibody shows that GFP-nsp3/nsp4-mCherry double positive foci are separate from LC3 puncta. Bars: 5 μm; insert, 2 μm. (I) TEM analysis demonstrates that clusters of DMVs are formed in both control and FIP200 KO HeLa cells coexpressing nsp3/4. N, nucleus. Bars: top panel, 500 nm; bottom panel, 200 nm. (J) TEM analysis demonstrates that clusters of DMVs are formed in both control and TG-treated HeLa cells coexpressing nsp3/4. N, nucleus. Bars: 200 nm. (K) Immunostaining shows that Flag-nsp3/nsp4-mCherry double-positive foci are induced normally in FIP200 KO HeLa cells. Bars: 5 μm; insert, 2 μm. (L) Immunostaining shows that Flag-nsp3/nsp4-mCherry double-positive foci are induced normally in TG-treated HeLa cells. TG, thapsigargin. Bars: 5 μm; insert, 2 μm.
Distinct roles of VMP1 and TMEM41B in DMV biogenesis, related to Fig. 3. (A) TEM analysis shows that when nsp3/4 are ectopically expressed, large number of DMVs (white arrow) are induced in control COS7 cells. In VMP1 KO COS7 cells, the zippered ER forms concentric membrane structures (red arrow) and only a few DMVs are generated. N, nucleus. Bars: left panel, 500 nm; right panel, 200 nm. (B–D) In FPP assays, time-lapse images show that most of the nsp4-mCherry puncta persist upon pK addition in digitonin-permeabilized control COS7 cells coexpressing nsp3/4 (C). In VMP1 KO COS7 cells, nsp4–mCherry is quickly digested upon pK treatment (D). Quantitative data are shown as mean ± SEM (Ctrl, n = 11; VMP1 KO, n = 12; B). Bars: 5 μm. (E and F) In FPP assays, similar to control HeLa cells, mCherry-nsp3 is digested by pK, while nsp4-GFP is resistant to pK in TMEM41B KO cells expressing nsp3/4 (E). Quantitative data are shown as mean ± SEM (n = 18; F). Bars: 5 μm. (G) In FPP assays, nsp4-mCherry is sensitive to pK treatment in VMP1 KO HeLa cells expressing GFP-VMP1(G197R). Bar: 5 μm. (H) Immunostaining with LC3 antibody shows that GFP-nsp3/nsp4-mCherry double positive foci are separate from LC3 puncta. Bars: 5 μm; insert, 2 μm. (I) TEM analysis demonstrates that clusters of DMVs are formed in both control and FIP200 KO HeLa cells coexpressing nsp3/4. N, nucleus. Bars: top panel, 500 nm; bottom panel, 200 nm. (J) TEM analysis demonstrates that clusters of DMVs are formed in both control and TG-treated HeLa cells coexpressing nsp3/4. N, nucleus. Bars: 200 nm. (K) Immunostaining shows that Flag-nsp3/nsp4-mCherry double-positive foci are induced normally in FIP200 KO HeLa cells. Bars: 5 μm; insert, 2 μm. (L) Immunostaining shows that Flag-nsp3/nsp4-mCherry double-positive foci are induced normally in TG-treated HeLa cells. TG, thapsigargin. Bars: 5 μm; insert, 2 μm.
To determine whether the DMV-related structures were closed in VMP1 KO or TMEM41B KO cells, we performed FPP assays. In VMP1 KO HeLa and COS7 cells, both GFP-nsp3 and nsp4-mCherry signals immediately disappeared with the addition of pK (Fig. 3, G–I; and Fig. S2, B–D). nsp4-mCherry became resistant to pK treatment after expressing WT VMP1, but not two VMP1 mutants corresponding to identified genetic mutations in epg-3 and the C. elegans ortholog of VMP1 (Fig. 3, J and K; and Fig. S2 G; Tian et al., 2010). The digestion of mCherry-nsp3 and nsp4-GFP in TMEM41B KO cells with nsp3/4+ puncta was similar to the control cells (Fig. S2, E and F). VMP1 forms a complex with TMEM41B, functioning in both autophagy and LD pathways (Morita et al., 2018; Moretti et al., 2018; Shoemaker et al., 2019). However, our observation indicates that VMP1 and TMEM41B may have distinct roles in DMV formation. TMEM41B may promote the formation of nsp3/4+ puncta, while VMP1 may be required to generate the pronounced curvature present in DMVs.
Given the crucial roles of VMP1 and TMEM41B in autophagy, we next investigated whether the autophagic process is involved in DMV formation. LC3 puncta were distinct from the puncta labeled by nsp3/4 (Fig. S2 H). The formation of nsp3/4+ puncta and DMVs was not affected in FIP200 KO cells expressing nsp3/4 (Fig. S2, I and K), which is consistent with the previous study (Twu et al., 2021). We previously showed that VMP1 regulates the activity of SERCA on the ER to control the ER contacts with other organelles. However, treatment with the specific SERCA inhibitor thapsigargin (TG) did not affect DMV formation induced by nsp3/4 (Fig. S2, J and L). Thus, these results suggest that DMV formation specifically requires VMP1 and TMEM41B, but not the autophagy machinery or SERCA.
VMP1 interacts with nsp3 and nsp4
A previous study on flavivirus showed that TMEM41B forms aggregates colocalizing with the viral nonstructural protein NS4 in infected cells, and TMEM41B interacts with NS4 to induce membrane remodeling (Hoffmann et al., 2021). Thus, we determined the localization of VMP1 and TMEM41B in cells coexpressing nsp3 and nsp4. When nsp3 or nsp4 was expressed individually, both VMP1 and TMEM41B colocalized with them on the ER (Fig. S3, A–D). In cells coexpressing nsp3/4, there was a weak colocalization of GFP-VMP1, TMEM41B-GFP, or endogenous VMP1 with the puncta labeled by nsp3/4 (Fig. 4, A–C). In a membrane flotation assay, endogenous VMP1 and TMEM41B were found in lighter density fractions similar to nsp3/4, while the ER protein BIP was enriched in higher density fractions (Fig. S3 E).
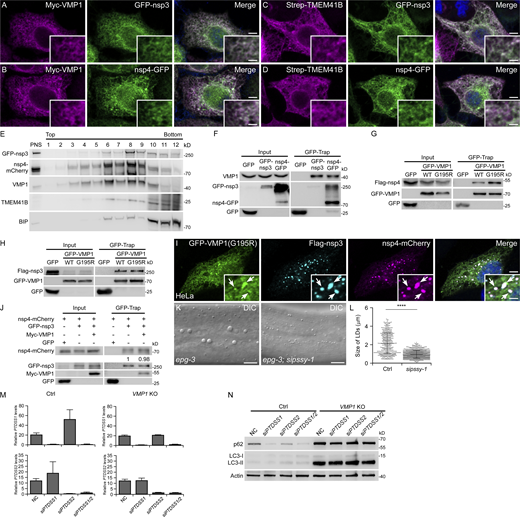
VMP1 interacts with nsp3 and nsp4, related to Figs. 4 and 5. (A) Immunostaining reveals that Myc-VMP1 colocalizes with GFP-nsp3 on the ER. Bars: 500 nm; insert, 200 nm. (B) Immunostaining reveals that Myc-VMP1 colocalizes with nsp4-GFP on the ER. Bars: 500 nm; insert, 200 nm. (C) Immunostaining reveals that Strep-TMEM41B colocalizes with GFP-nsp3 on the ER. Bars: 500 nm; insert, 200 nm. (D) Immunostaining reveals that Strep-TMEM41B colocalizes with nsp4-GFP on the ER. Bars: 500 nm; insert, 200 nm. (E) OptiPrep membrane flotation analysis of cells coexpressing GFP-nsp3 and nsp4-mCherry. PNS, post-nuclear supernatant. (F) In a GFP-Trap assay, endogenous VMP1 is immunoprecipitated by GFP-nsp3 or nsp4-GFP. (G) In a GFP-Trap assay, levels of Flag-nsp4 immunoprecipitated by GFP-VMP1 with the G195R mutation are increased, compared with WT GFP-VMP1. (H) In a GFP-Trap assay, levels of Flag-nsp3 immunoprecipitated by GFP-VMP1 or GFP-VMP1(G195R) are comparable. (I) Immunostaining reveals that GFP-VMP1(G195R) accumulates at the sites of Flag-nsp3/nsp4-mCherry puncta, as indicated by arrows. Bars: 500 nm; insert, 200 nm. (J) In a GFP-Trap assay, levels of nsp4-mCherry immunoprecipitated by GFP-nsp3 are comparable in control and Myc-VMP1-overexpressing cells. (K and L) The size of enlarged hypodermal LDs (arrows) in epg-3 mutant worms is dramatically reduced by pssy-1(RNAi) (K). Quantitative data are shown as mean ± SD (N2, n = 505; epg-3, n = 878; L). ****, P < 0.0001. Bars: 10 μm. (M) Quantitative PCR results show that the transcription of PTDSS1 or PTDSS2 is efficiently suppressed in siPTDSS1 or siPTDSS2 cells, respectively. mRNA levels of PTDSS1 and PTDSS2 are normalized by ACTB levels. (N) Immunoblotting results demonstrate that levels of p62 and LC3-I/II remain unchanged after single or double knock down of PTDSS1 and PTDSS2 in control and VMP1 KO HeLa cells. Source data are available for this figure: SourceData FS3.
VMP1 interacts with nsp3 and nsp4, related to Figs. 4 and 5. (A) Immunostaining reveals that Myc-VMP1 colocalizes with GFP-nsp3 on the ER. Bars: 500 nm; insert, 200 nm. (B) Immunostaining reveals that Myc-VMP1 colocalizes with nsp4-GFP on the ER. Bars: 500 nm; insert, 200 nm. (C) Immunostaining reveals that Strep-TMEM41B colocalizes with GFP-nsp3 on the ER. Bars: 500 nm; insert, 200 nm. (D) Immunostaining reveals that Strep-TMEM41B colocalizes with nsp4-GFP on the ER. Bars: 500 nm; insert, 200 nm. (E) OptiPrep membrane flotation analysis of cells coexpressing GFP-nsp3 and nsp4-mCherry. PNS, post-nuclear supernatant. (F) In a GFP-Trap assay, endogenous VMP1 is immunoprecipitated by GFP-nsp3 or nsp4-GFP. (G) In a GFP-Trap assay, levels of Flag-nsp4 immunoprecipitated by GFP-VMP1 with the G195R mutation are increased, compared with WT GFP-VMP1. (H) In a GFP-Trap assay, levels of Flag-nsp3 immunoprecipitated by GFP-VMP1 or GFP-VMP1(G195R) are comparable. (I) Immunostaining reveals that GFP-VMP1(G195R) accumulates at the sites of Flag-nsp3/nsp4-mCherry puncta, as indicated by arrows. Bars: 500 nm; insert, 200 nm. (J) In a GFP-Trap assay, levels of nsp4-mCherry immunoprecipitated by GFP-nsp3 are comparable in control and Myc-VMP1-overexpressing cells. (K and L) The size of enlarged hypodermal LDs (arrows) in epg-3 mutant worms is dramatically reduced by pssy-1(RNAi) (K). Quantitative data are shown as mean ± SD (N2, n = 505; epg-3, n = 878; L). ****, P < 0.0001. Bars: 10 μm. (M) Quantitative PCR results show that the transcription of PTDSS1 or PTDSS2 is efficiently suppressed in siPTDSS1 or siPTDSS2 cells, respectively. mRNA levels of PTDSS1 and PTDSS2 are normalized by ACTB levels. (N) Immunoblotting results demonstrate that levels of p62 and LC3-I/II remain unchanged after single or double knock down of PTDSS1 and PTDSS2 in control and VMP1 KO HeLa cells. Source data are available for this figure: SourceData FS3.
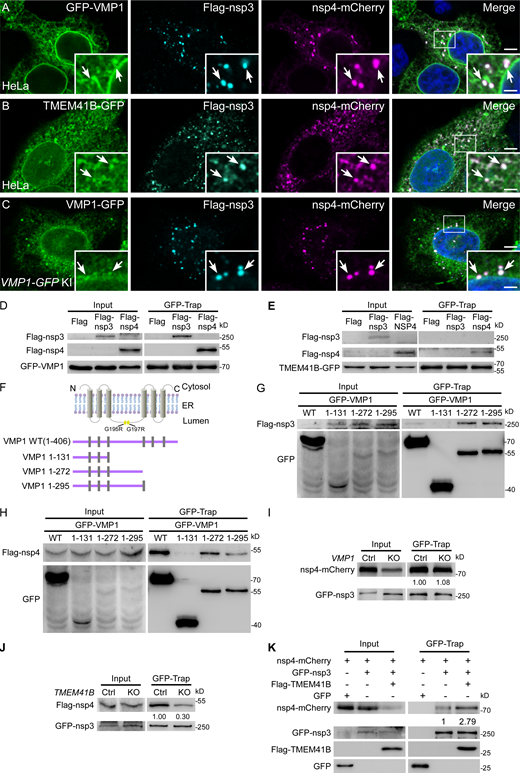
VMP1 binds to nsp3 and nsp4. (A–C) Immunostaining reveals that GFP-VMP1 (A), TMEM41B-GFP (B), and endogenous VMP1 (C) weakly accumulate at the Flag-nsp3/nsp4-mCherry+ punctate structures, as indicated by arrows. Bars: 500 nm; inserts, 200 nm. (D) In a GFP-Trap assay, Flag–nsp3 or Flag-nsp4 is immunoprecipitated by GFP-VMP1. (E) In a GFP-Trap assay, Flag-nsp4, but not Flag–nsp3 is immunoprecipitated by TMEM41B-GFP. (F) Schematic of the topology of VMP1, and the structures of the VMP1 truncations. The positions of G195R and G197R are indicated by yellow squares. (G) In a GFP-Trap assay, Flag-nsp3 is immunoprecipitated by WT GFP-VMP1, GFP-VMP1(1-272), or GFP-VMP1(1-295), but not GFP-VMP1(1-131). (H) In a GFP-Trap assay, Flag–nsp4 is immunoprecipitated by WT GFP-VMP1, GFP-VMP1(1-272), or GFP-VMP1(1-295), but not GFP-VMP1(1-131). (I) In a GFP-Trap assay, levels of nsp4-mCherry immunoprecipitated by GFP-nsp3 are comparable between control and VMP1 KO HeLa cells. (J) In a GFP-Trap assay, levels of Flag-nsp4 immunoprecipitated by GFP-nsp3 are greatly reduced in TMEM41B KO HeLa cells, compared with control cells. (K) In a GFP-Trap assay, levels of nsp4-mCherry immunoprecipitated by GFP-nsp3 are dramatically increased in Flag-TMEM41B-overexpressing HeLa cells, compared with control cells. Source data are available for this figure: SourceData F4.
VMP1 binds to nsp3 and nsp4. (A–C) Immunostaining reveals that GFP-VMP1 (A), TMEM41B-GFP (B), and endogenous VMP1 (C) weakly accumulate at the Flag-nsp3/nsp4-mCherry+ punctate structures, as indicated by arrows. Bars: 500 nm; inserts, 200 nm. (D) In a GFP-Trap assay, Flag–nsp3 or Flag-nsp4 is immunoprecipitated by GFP-VMP1. (E) In a GFP-Trap assay, Flag-nsp4, but not Flag–nsp3 is immunoprecipitated by TMEM41B-GFP. (F) Schematic of the topology of VMP1, and the structures of the VMP1 truncations. The positions of G195R and G197R are indicated by yellow squares. (G) In a GFP-Trap assay, Flag-nsp3 is immunoprecipitated by WT GFP-VMP1, GFP-VMP1(1-272), or GFP-VMP1(1-295), but not GFP-VMP1(1-131). (H) In a GFP-Trap assay, Flag–nsp4 is immunoprecipitated by WT GFP-VMP1, GFP-VMP1(1-272), or GFP-VMP1(1-295), but not GFP-VMP1(1-131). (I) In a GFP-Trap assay, levels of nsp4-mCherry immunoprecipitated by GFP-nsp3 are comparable between control and VMP1 KO HeLa cells. (J) In a GFP-Trap assay, levels of Flag-nsp4 immunoprecipitated by GFP-nsp3 are greatly reduced in TMEM41B KO HeLa cells, compared with control cells. (K) In a GFP-Trap assay, levels of nsp4-mCherry immunoprecipitated by GFP-nsp3 are dramatically increased in Flag-TMEM41B-overexpressing HeLa cells, compared with control cells. Source data are available for this figure: SourceData F4.
Then, we investigated the interactions of VMP1 and TMEM41B with nsp3 and nsp4. The results showed that both nsp3 and nsp4 interacted with VMP1 (Fig. 4 D; and Fig. S3 F), while TMEM41B showed weak binding to nsp4, but not nsp3 (Fig. 4 E). The G195R VMP1 mutant exhibited stronger interaction with nsp4, but not nsp3, compared with wild-type VMP1 (Fig. S3, G and H). It also showed a stronger signal at the nsp3/4+ foci (Fig. S3 I). The G195 of VMP1 is localized in the ER luminal loop, which indicates that VMP1 may interact with nsp3 and nsp4 through this domain. We then generated a series of VMP1 truncations (Fig. 4 F). VMP1 without the three C-terminal transmembrane domains were still bound to nsp3 and nsp4, while further deletion of the ER luminal domain totally disrupted its binding to nsp3 or nsp4 (Fig. 4, G and H). Thus, VMP1 probably interacts with nsp3/4 inside the ER lumen.
Given that the ER zippering is mediated by the interaction of nsp3 and nsp4 (Hagemeijer et al., 2014; Sakai et al., 2017), we then determined whether VMP1 and TMEM41B facilitate the formation of the nsp3/4 complex. Levels of nsp4 precipitated by nsp3 were comparable in VMP1 KO or VMP1-overexpressing cells and control cells (Fig. 4 I; and Fig. S3 J), which is consistent with the TEM results showing that the ER zippering is not affected by VMP1 deficiency. In TMEM41B KO cells, the binding of nsp4 with nsp3 was dramatically decreased compared with control cells (Fig. 4 J). Moreover, more nsp4 was precipitated by nsp3 in TMEM41B-overexpressing cells than in control cells (Fig. 4 K). In summary, these data suggest that TMEM41B may facilitate nsp3/4 interaction directly. Another possibility is that TMEM41B has a phospholipid scramblase activity and regulates the distribution of cholesterol and PS (Li et al., 2021). It is well known that cholesterol drives the formation of lipid raft microdomains that function as platforms for segregating proteins within the lipid bilayer (Simons and Ehehalt, 2002). Thus, cholesterol or phospholipids, modulated by TMEM41B, may potentially promote the nsp3–nsp4 interaction.
Depletion of PTDSS1 rescues the DMV and LD defects in VMP1 KO cells
We performed a genome-wide RNAi screen in C. elegans to identify genes that suppressed the LD phenotype of epg-3 (the worm homolog of VMP1) mutants. We found that pssy-1(RNAi) rescued the enlarged hypodermal LDs, but not the autophagy defects in the epg-3 mutants (Fig. S3, K and L, and data not shown). PSSY-1 is responsible for phosphatidylserine (PS) biosynthesis using phosphatidylcholine (PC) or phosphatidylethanolamine (PE) as substrates. Mammals have two PSSY-1 homologs, PTDSS1 and PTDSS2, which convert PC and PE, respectively, to PS. PS is synthesized on the cytosolic leaflet of ER membranes (Pomorski and Menon, 2016). The scramblase activity of VMP1 and TMEM41B plays an important role in maintaining the balance of newly synthesized phospholipids between the two ER leaflets (Ghanbarpour et al., 2021; Li et al., 2021; Huang et al., 2021). Without VMP1 or TMEM41B, PS accumulates at the cytoplasmic side of ER membranes (Li et al., 2021). We found that siPTDSS1, but not siPTDSS2, suppressed the enlarged LDs in VMP1 KO cells (Fig. 5, A and B; and Fig. S3 M). This is probably because PTDSS2 converts PE to PS, and siPTDSS2 may cause the accumulation of PE, which lowers the surface tension of the biolayer and favors the formation of bigger LDs (M’barek et al., 2017). Neither siPTDSS1 nor siPTDSS2 rescued the autophagy defects in VMP1 KO cells (Fig. S3 N). We previously revealed that VMP1 regulates SERCA activity to control autophagosome formation (Zhao et al., 2017). Thus, these results imply that VMP1 controls the autophagy and LD pathways through different mechanisms.

siPTDSS1 reverses the DMV defects in VMP1-depleted cells. (A and B) The enlarged LD phenotype in siVMP1 cells is suppressed by siPTDSS1, but not siPTDSS2. siPTDSS2 alone causes bigger LDs, compared with control cells (A). Quantitative data are shown as mean ± SD (NC, n = 54; siPTDSS1, n = 55; siPTDSS2, n = 53; siVMP1, n = 52; siVMP1&siPTDSS1, n = 50; siVMP1&siPTDSS1, n = 52; B). ****, P < 0.0001; N.S., not significant. Bars: 5 μm. (C) Compared with NC-treated VMP1 KO cells, concentric membrane structures (red arrows) are reduced and the formation of DMVs (white arrow) is increased after siPTDSS1. N, nucleus. Bars: 200 nm. (D–F) In FPP assays, nsp4–mCherry immediately disappears upon pK addition in NC-treated VMP1 KO cells (D), while nsp4-mCherry shows partial resistance to pK treatment after knocking down of PTDSS1 (E). Quantitative data are shown as mean ± SEM (NC, n = 18; siPTDSS1, n = 12; F). Bars: 5 μm. (G) The proposed model of the roles of VMP1 and TMEM41B in DMV biogenesis. Once β-coronaviruses enter the cell, the polyprotein containing nsp3 and nsp4 is translated, and then cleaved into individual proteins by viral genome-encoded proteases. The host ER protein TMEM41B facilitates the binding of nsp3 and nsp4 to each other through their luminal domains. This leads to the separation of nsp3 and nsp4 and their concentration on the opposite sides of the ER by unknown mechanisms. nsp3/4 interaction and separation drive the zippering and bending of the ER. The paired ER finally closes into vesicles, possibly regulated by VMP1-modulated PS distribution.
siPTDSS1 reverses the DMV defects in VMP1-depleted cells. (A and B) The enlarged LD phenotype in siVMP1 cells is suppressed by siPTDSS1, but not siPTDSS2. siPTDSS2 alone causes bigger LDs, compared with control cells (A). Quantitative data are shown as mean ± SD (NC, n = 54; siPTDSS1, n = 55; siPTDSS2, n = 53; siVMP1, n = 52; siVMP1&siPTDSS1, n = 50; siVMP1&siPTDSS1, n = 52; B). ****, P < 0.0001; N.S., not significant. Bars: 5 μm. (C) Compared with NC-treated VMP1 KO cells, concentric membrane structures (red arrows) are reduced and the formation of DMVs (white arrow) is increased after siPTDSS1. N, nucleus. Bars: 200 nm. (D–F) In FPP assays, nsp4–mCherry immediately disappears upon pK addition in NC-treated VMP1 KO cells (D), while nsp4-mCherry shows partial resistance to pK treatment after knocking down of PTDSS1 (E). Quantitative data are shown as mean ± SEM (NC, n = 18; siPTDSS1, n = 12; F). Bars: 5 μm. (G) The proposed model of the roles of VMP1 and TMEM41B in DMV biogenesis. Once β-coronaviruses enter the cell, the polyprotein containing nsp3 and nsp4 is translated, and then cleaved into individual proteins by viral genome-encoded proteases. The host ER protein TMEM41B facilitates the binding of nsp3 and nsp4 to each other through their luminal domains. This leads to the separation of nsp3 and nsp4 and their concentration on the opposite sides of the ER by unknown mechanisms. nsp3/4 interaction and separation drive the zippering and bending of the ER. The paired ER finally closes into vesicles, possibly regulated by VMP1-modulated PS distribution.
As PS levels are critical for LD size regulation, as shown above, we further tested whether decreasing PS levels can reverse the DMV defects in VMP1 KO cells. After siPTDSS1 in VMP1 KO cells, more DMVs were detected with some small clusters formed, which indicates that the DMV defect was partially rescued (Fig. 5 C). In VMP1 KO cells cotransfected with nsp3/4, weak nsp4-mCherry signals persisted in FPP assays when PTDSS1 was knocked down (Fig. 5, D–F). The impaired MHV-A59 infection in VMP1 KO cells could not be suppressed by the simultaneous depletion of PTDSS1 (data not shown), probably because PTDSS1 itself is required for virus infection (Baggen et al., 2021). Thus, the abnormal PS accumulation may contribute to the defects in LD and DMV biogenesis in VMP1 KO cells.
In conclusion, our study reveals that the viral nonstructural proteins nsp3 and nsp4 are localized on two adjacent ER membranes at the DMV formation sites to induce vesicle formation. This unique distribution pattern of nsp3/4 may facilitate the bending of the zippered membranes for membrane curvature. Previous studies with MERS-CoV nsp3-4 polyprotein demonstrated that cleavage at the nsp3/4 junction is essential for DMV formation. Expression of the uncleaved nsp3-4 polyprotein does not affect ER zippering but causes abnormal membrane rearrangement with the accumulation of concentric zippered membranes (Oudshoorn et al., 2017). The distinct localization of nsp3 and nsp4 on different sides of DMVs may explain why nsp3 and nsp4 must be liberated for DMV formation. We also discovered distinct functions of VMP1 and TMEM41B at different steps of DMV biogenesis, and we revealed that dysregulation of PS distribution may contribute to the LD and DMV defects in VMP1 KO cells (Fig. 5 G). These results provide novel insights into how the host factors collaborate with viral proteins to remodel the endomembrane system for virus replication.
Materials and methods
Plasmids
GFP-VMP1, Myc-VMP1, GFP-VMP1(G195R), GFP-VMP1(G197R), RFP-Sec61β, GFP-Rab5, GFP-Rab7, EHD1-GFP, GFP-Sec24c, Flag-mCEACAM1, and Flag-ACE2 were generated as previously described (Wang et al., 2016; Zhao et al., 2017; Miao et al., 2020, 2021). Lentivirus plasmids (pLenti-CMV-mCEACAM1-Puro) and packaging plasmids (psPA and pMD) were kindly provided by Dr. Junjie Hu (Institute of Biophysics, Chinese Academy of Sciences, Beijing, China). Full-length SARS-CoV-2 nsp3 and nsp4 were codon-optimized and synthesized by Sangon Biotech (Shanghai) Co., Ltd. GFP-nsp3 was constructed by inserting nsp3 into pEGFP-C1 vector. mCherry-nsp3 was generated by replacing the GFP fragment of GFP-nsp3 with mCherry. Flag–nsp3 was constructed by inserting nsp3 into pCMV–Flag vector. nsp4-GFP was constructed by inserting nsp4 into pEGFP-N1 vector. Flag–nsp4 was constructed by inserting nsp4 into pCMV-Flag vector. nsp4-mCherry was generated by replacing the GFP fragment of nsp4-GFP with mCherry. GFP-nsp3-SBP was generated by inserting SBP at the carboxyl terminus of nsp3. Strep-nsp4-GFP was generated by inserting Strep at the amino-terminus of nsp4 (Niu et al., 2019). nsp4-SNAP was generated by replacing the GFP fragment of nsp4-GFP with SNAP. GFP-nsp3(1-1452), GFP-nsp3(1-1546), GFP-nsp3(1-1582), nsp4(Δ35-280)-GFP, and nsp4(Δ338-364)-GFP were generated by PCR-based mutagenesis from GFP-nsp3 and nsp4-GFP, respectively. GFP-VMP1(1-131), GFP-VMP1(1-272), and GFP-VMP1(1-295) were generated by PCR-based mutagenesis from GFP-VMP1. ERGIC53 was generated by inserting human ERGIC53 into pEGFP-N1. EDEM1-GFP was constructed by inserting human EDEM1 into pEGFP-N1 vector. TMEM41B-GFP was constructed by inserting human TMEM41B into pEGFP-N1 vector. Strep-TMEM41B was generated by inserting human TMEM41B into pEG BacMam vector. Flag-TMEM41B was generated by inserting human TMEM41B into pCMV-Flag vector.
Antibodies
The following antibodies were used in this study: mouse anti-Flag (F1804; Sigma-Aldrich), mouse anti-dsRNA (10010200; SCICONS), mouse anti-nsp9 (AM08450PU-N; OriGene), mouse anti-mCEACAM1 (MA-29684; Thermo Fisher Scientific), mouse anti-GFP (11814460001; Roche, for immunoblotting), rabbit anti-GFP (ab290; Abcam, for immuno-electron microscopy), mouse anti-LC3 (M152-3; MBL), rabbit anti-VMP1 (12929; Cell Signaling Technology), mouse anti-strep (HX1988; Huaxingbio), rabbit anti-mCherry (GTX59788; Genetex), rabbit anti-TMEM41B (HPA014946; Sigma-Aldrich), mouse anti-GAPDH (60004-1-Ig; Proteintech), mouse anti-BIP (61979; BD Biosciences), mouse anti-Actin (60008-1-Ig; Proteintech), and goat anti-rabbit-gold (10 nm, 25109; Aurion).
Cell lines
HeLa, COS7, and HEK 293T cells (from ATCC) were cultured in DMEM (C11965500BT; Thermo Fisher Scientific), supplemented with 10% FBS (10099-141C; Thermo Fisher Scientific) and penicillin–streptomycin at 37°C with 5% CO2. FIP200 KO cells were a gift from Dr. Feng Shao’s Lab (National Institute of Biological Sciences, Beijing, China). VMP1-GFP knock-in HeLa cells were generated previously (Zhao et al., 2017). To block SERCA function, TG (T9033; Sigma-Aldrich) was used at 1 mM for 6 h.
For the generation of HeLa cells stably expressing mCEACAM1, lentivirus was generated by the transfection of HEK 293T cells with the plasmid encoding mCEACAM1 together with the psPA and pMD plasmids. The supernatant containing the virus was collected 2 days after transfection and filtered with a 0.45 μm filter. Control, VMP1 KO and TMEM41B KO HeLa cells were transduced with lentiviruses and selected with puromycin (0.5 mg/ml). Single-cell clones were picked and verified by immunoblotting.
The KO cell lines were generated using the CRISPR/Cas9 genome editing system. Cells were transiently transfected with the CRISPR plasmid px260 expressing specific gRNA and selected with 2.5 μg/ml puromycin. Single clones were picked and the depletion efficiency was verified by genomic sequencing and immunoblotting. The following gRNAs were used:
Human VMP1: TTTTGTATGCCTACTGGAT;
Human TMEM41B: GTCGCCGAACGATCGCAGTT.
C. elegans strains
The following worm strains were used in this study: N2 Bristol (wild type), epg-3(bp933). Hermaphrodites were analyzed, and the developmental stages of worms are specified in the figure legends. All experiments were done at 20°C.
MHV-A59 infection
17Cl-1 cells were used to propagate MHV-A59 or MHV-A59/GFP, at a multiplicity of infection (MOI) of 0.05 (Das Sarma et al., 2002; Ding et al., 2011). Herein, 17Cl-1 cells in DMEM were inoculated with virus by occasional swirling for 1 h. Then the medium was removed and replaced with fresh DMEM containing 10% FBS. The titer of MHV-A59 or MHV-A59/GFP was determined by plaque assay using monolayer 17Cl-1 cells. Plaque forming units (PFU) were measured after incubation with serially diluted supernatants of cell culture for 36 h. The obtained virus was stored at -80°C until further use.
SARS-CoV-2 virus amplification, titration, and infection
Vero E6 cells were used to propagate the SARS-CoV-2 virus (hCoV-19/China/CAS-B001/2020, GISAID No. EPI_ISL_514256-7). The cytopathic efficiency (CPE) assay was used to measure the virus titer. HeLa cells transiently transfected with Flag-ACE2 were infected with 2 × 10⁶ TCID50/ml (tissue culture infectious dose 50%). 1 h after infection, cells were washed three times with PBS and then incubated in DMEM medium plus 10% FBS for 8 h at 37°C with 5% CO2. Then samples were collected for TEM analysis. All experiments with live SARS-CoV-2 virus were performed in the biosafety level 3 facility at the Institute of Microbiology, Chinese Academy of Sciences.
Quantitative RT-PCR
Total RNA was extracted using TRIzol (15596018; Thermo Fisher Scientific), and cDNA was generated by reverse transcription with a SuperRT cDNA Synthesis Kit (CW0741M; CWBIO). Quantitative RT-PCR was performed on an Applied Biosystems 7500 Real-Time PCR System with 2*TSINGKE Master qPCR Mix (TSE201; TSINGKE).
The following primers were used: F-PTDSS1, 5′-AGCCAGTCATCCATTAAGTTGGG-3′; R-PTDSS1, 5′-AGTAGGTCTTTTCTCGGTGACC-3′; F-PTDSS2, 5′-ATCATCCTGGTGTTCCTGTTGG-3′; R-PTDSS2, 5′-TGTCCCGCAGGAAGAAGC-3′; F-MHV-A59 RNA, 5′-TGATGATGGTGTTGTGTGTTATAA-3′; R-MHV-A59 RNA, 5′-GCATTGTATGTTGAGAACAAAATTC-3′; F-ACTB, 5′-CTGGCTCCTAGCACCATGAAGAT-3′; R-ACTB, 5′-GGTGGACAGTGAGGCCAGGAT-3′; F-GAPDH, 5′-GACAGTCAGCCGCATCTTCT-3′; R-GAPDH, 5′-GCGCCCAATACGACCAAATC-3′.
Transfection and RNAi
Cells were transiently transfected with indicated plasmids using Lipofectamine 2000 (12566014; Life Technologies). For RNAi, cells were transfected with negative control (NC) or siRNA oligos using Lipofectamine RNAi MAX (13778150; Life Technologies), and collected 72 h after transfection.
siRNAs oligos were purchased from GenePharma. The following sequences were used: NC, 5′-UUCUCCGAACGUGUCACGUTT-3′; Human VMP1, 5′-GGAAUGGACCUCAAAAUUA-3′; Human PTDSS1, 5′-UUCUGGAACAGAGUCAUCC-3′; Human PTDSS2, 5′-GCACCGAGUCCGAGGUCUA-3′.
Immunostaining
Cells cultured on coverslips (C015001; Matsunami) were fixed with 4% paraformaldehyde (PFA) for 30 min and then permeabilized with 10 μg/ml digitonin (D141; Sigma-Aldrich; for LC3 staining) or 0.1% Triton (for other antibodies) for 20 min at room temperature. After blocking with 1% BSA for 1 h, cells were incubated with the indicated primary antibodies (diluted in 1% BSA) overnight at 4°C. After washing three times with PBS (140 mM NaCl, 2.7 mM KCl, 10 mM Na2HPO4, 1.8 mM KH2PO4), cells were incubated with fluorescently tagged secondary antibodies for 1 h at room temperature. For LD staining, cells were incubated with Lipidtox (1:1,000, H34476; Life Technologies) for 30 min at room temperature. Coverslips were mounted with DAPI in 50% glycerol and imaged using ZEN blue software under a confocal microscope (LSM 880 Meta plus Zeiss Axiovert zoom; Zeiss) with a 63×/1.40 oil-immersion objective lens (Plan-Apochromat; Zeiss) and a camera (Axiocam HRm; Zeiss) at room temperature. The fluorochromes used were FITC, TRITIC, Alexa Fluor 647, DAPI, EGFP, HCS LipidTOX Red neutral lipid stain, RFP, and mCherry.
Coimmunoprecipitation (co-IP) and immunoblotting
For co-IP analysis, cells were transfected with indicated plasmids for 24–48 h, and harvested with lysis buffer (20 mM Hepes, pH 7.5, 150 mM NaCl, 1 mM EDTA, and 0.1% Triton X-100) supplemented with protease inhibitor cocktail (11836170001; Roche). After incubation on ice for 30 min, cells were centrifuged at 13,000 rpm for 10 min at 4°C. Supernatants were collected and incubated with GFP-Trap agarose beads (gta-20; ChromoTek) for 1.5 h at 4°C. The bound proteins were eluted with SDS sample buffer and analyzed by immunoblotting.
For immunoblotting, cells were lysed with lysis buffer (20 mM Hepes, pH 7.5, 150 mM NaCl, 1 mM EDTA, 1% Triton X-100, and protease inhibitor cocktail) and incubated for 30 min on ice. Homogenates were centrifuged at 13,000 rpm for 10 min at 4°C. Supernatants were boiled with SDS sample buffer and subjected to SDS-PAGE electrophoresis. Signals were determined using the indicated primary and secondary antibodies and exposed to an imaging system (ChemiScope 6000 Touch, ClinX). The images were analyzed with ImageJ.
Fluorescence protease protection (FPP)
Cells cultured on glass-bottom dishes (801001, NEST) were transfected with the indicated siRNA for 72 h and plasmids for 24 h. After washing three times with KHM buffer (100 mM potassium acetate, 20 mM Hepes, 2 mM MgCl2, pH 7.4), cells were treated with 160 μM digitonin for 5 min at room temperature. Then 50 μg/ml proteinase K (P2308, Sigma-Aldrich) were added to the cells, and live cell images were captured using ZEN blue software by a confocal microscope (LSM 880 Meta plus Zeiss Axiovert zoom, Zeiss) with a 63×/1.40 oil-immersion objective lens (Plan-Apochromatlan, Zeiss) and a camera (Axiocam HRm, Zeiss) at room temperature. The intensity of nsp3/4+ dots were analyzed with ImageJ.
3D-SMLM (single-molecule localization microscopy) imaging
Cells grown on coverslips (CG15XH, Thorlabs) were co-transfected with GFP-nsp3 and nsp4-SNAP for 48 h. After 15 min fixation in 4% PFA followed by 15 min permeabilization with 0.1% Triton X-100, cells were quenched in 0.1 M NH4Cl for 5 min and washed twice with PBS. Cells were then blocked for 30 min with Image-iT FX Signal Enhancer (I36933, Invitrogen) and incubated in dye solution (1 μM BG-AF647 (S9136S, New England Biolabs), 1 mM DTT, and 0.5% bovine serum albumin in PBS) for 1 h. After washing three times in PBS, cells were postfixed with 4% PFA for 10 min and stored at 4°C. Cells were imaged in blinking buffer (50 mM Tris-HCl, pH 8.0; 10 mM NaCl, 10% [wt/vol] glucose, 0.5 mg/ml glucose oxidase [G7141, Sigma-Aldrich], 40 μg/ml catalase [C100, Sigma-Aldrich], and 35 mM cysteamine).
SMLM imaging was performed on a custom-built widefield setup with a NA 1.5 objective (UPLAPO100XOHR, Olympus), four lasers (405/488/561/640 nm), a main dichroic mirror (ZT405/488/561/640rpcxt-UF2, Chroma), a main emission filter (EF, NF03-405/488/561/635E-25, Semrock), and a sCMOS camera (ORCA-Flash4.0 V3, Hamamatsu) at room temperature. For 3D-SMLM imaging, a cylindrical lens was used to introduce astigmatism into the point spread function (PSF), and z stacks of TetraSpeck microspheres (T7279, Invitrogen) on a coverslip were acquired to generate the experimental PSF model (Li et al., 2018). To acquire 3D-SMLM images of nsp4 in cells, samples were excited with a 640-nm laser (∼2 kW/cm2) and concurrently activated with a 405-nm laser (0–1 W/cm2). The fluorescence was filtered by a band-pass EF (FF01-676/37-25; Semrock). Around 30,000 frames were recorded with a 20-ms exposure time to reconstruct super-resolution images. The focus was stabilized by a customized focus lock system during acquisition. The raw data were fitted and analyzed with SMAP software as described previously (Smap, 2020). Localizations appearing in consecutive frames were merged with one dark frame and within a distance of 100 nm. Localizations with x-y precision more than 20 nm, z precision more than 45 nm, photon count below 800, or number of localizations in the group more than 5 were excluded.
Transmission electron microscopy and immuno-electron microscopy
Cells were harvested and fixed with 2.5% glutaraldehyde in PBS overnight at 4°C. After 2× washes with PBS and 1× wash in ddH2O, cells were postfixed in 1% OsO4 and 1.5%K3Fe(CN)6 for 90 min at room temperature. Cells were then washed with water and placed in chilled 2% aqueous uranyl acetate for 1 h at room temperature. After washing with ddH2O, cells were further dehydrated by a graded series of ethanol solutions and embedded in epoxy EMBED-812 (14120; Electron Microscopy Sciences) resin. A 120-kV electron microscope (Tecnai Spirit; FEI) was used at 100 kV. Images were acquired with a CCD camera (MoradaG3; EMSIS) using RADIUS software at room temperature.
For immuno-electron microscopy, cell pellets were suspended in 12% weight/volume gelatin in PBS at 37°C for 15 min and then placed on ice for 10–20 min to solidify the gelatin. The cell pellets were then cut into small blocks and placed in 2.3 M sucrose overnight at 4°C. The specimen blocks were transferred from the 2.3 M sucrose to aluminum specimen holders and frozen by immersing them in liquid nitrogen. Ultrathin sections were cut at −120°C using an ultramicrotome (Leica EM FC7) and placed on grids. The grids were washed with PBS, incubated with 1% BSA for 30 min, and then with primary antibodies (1:20) for 2 h and IgG-gold (GAR IgG 10 nm; Aurion) for 1 h. The labeled samples were placed on UA/MC (uranyl acetate/methyl cellulose, 1:9) drops for 5 min, then picked up with a loop and allowed to dry there. The samples were observed using a transmission electron microscope (Tecnai Spirit; FEI) operating at 100 kV, and images were captured with a CCD camera (MoradaG3; EMSIS) using RADIUS software at room temperature.
Correlative confocal and electron microscopy
Cells grown on live-cell dishes with photo-etched gridded coverslips (D35-14-1.5GI; Cellvis) were fixed with 4% PFA and then a confocal microscope was used to collect the bright field and confocal images to show the arrangement of the cells at different magnifications. After that, the cells were fixed with 2.5% glutaraldehyde for 2 h at room temperature. Samples were then dehydrated with a graded ethanol series (50, 70, 90, 100, 100, and 100%) for 2 min each. Samples were infiltrated and embedded in SPON12 resin and then polymerized at 60°C for 48 h. Then 70-nm thick serial ultrathin sections were cut using a diamond knife by ultramicrotome (EM UC7; Leica), and then picked up with Formvar-coated copper slot grids (2 × 0.75 mm). The sections were double-stained with uranyl acetate and lead citrate. After air-drying, the samples were examined with a transmission electron microscope (H-7800; Hitachi) at 80 kV, and images were acquired with a CCD camera (MoradaG3; EMSIS) using RADIUS 2.2 software at room temperature.
Membrane flotation assay
Cells from three 15-cm plates (2 × 10⁷ cells/plate) were harvested, washed twice with ice-cold PBS, and resuspended in 2 ml 4°C homogenization buffer (400 mM sucrose, 20 mM Tris-HCl [pH 7.4], 1 mM EDTA, 0.3 mM DTT, and protease inhibitor). Cells were then homogenized with a Dounce Tissue Grinder (K885300-0002; Thermo Fisher Scientific). The homogenates were centrifuged twice at 3,000 g for 10 min and once at 8,000 g for 20 min to remove cell debris and mitochondria, respectively. The supernatant was diluted with an equal volume of OptiPrep (D1556; Sigma-Aldrich). Discontinuous OptiPrep gradients were generated in SW41 tubes (Beckman Instruments) by overlaying the following OptiPrep solutions all in homogenization buffer: 2.4 ml of the diluted supernatant in 25% OptiPrep, 1.8 ml in 20%, 2.0 ml in 15%, 2.0 ml in 10%, 2.0 ml in 5%, and 2.0 ml in 0%. The gradients were centrifuged at 150,200 g in SW41Ti rotors (Optima L-80 XP; Beckman Instruments) for 3 h at 4°C. Subsequently, 12 fractions (1.0 ml each) were collected from the top. Fractions were boiled with SDS-PAGE sample buffer and subjected to immunoblotting analysis.
Statistical analysis
Co-IP and immunoblotting results are representatives of at least three independent experiments. The sample size was determined by preliminary experiments. The statistical parameters, including n, SEM, and SD are specified in the figure legends. Data distribution was assumed to be normal, but this was not formally tested. Statistical comparisons were made by one-way ANOVA analysis, and a P value <0.05 was considered statistically significant. For comparison of percentages between control and KO cells, the Chi-square test was used to test significance.
Online supplemental material
Acknowledgments
We are grateful to Dr. Isabel Hanson for editing the work. We would like to thank the Center for Biological Imaging, Institute of Biophysics, Chinese Academy of Science for our immuno-electron microscopy and we are grateful to Li Wang with preparing the immuno-electron microscopy samples and taking the images.
This work was supported by the National Key Research and Development Program (2021YFA1300800 to Y.G. Zhao and H. Deng), the National Natural Science Foundation of China (32170753 to Y.G. Zhao), the Chinese Academy of Sciences (XDB37030205 and KJZD-SW-L05 to H. Deng), and the Shenzhen–Hong Kong Institute of Brain Science–Shenzhen Fundamental Research Institutions (2021SHIBS0002 to Y.G. Zhao..
The authors declare no competing financial interests.
Author contributions: Y.G. Zhao and H. Deng designed the project. M. Ji, M. Li. L. Sun, Z. Yang, X. Zhao, W. Qu, H. Xue, and Z. Zheng performed the experiments. H. Zhao carried out the TEM experiments. Y. Li carried out the CLEM experiments. L. Zhou and Y. Li performed the 3D-SMLM analysis. All authors analyzed and discussed the results. Y.G. Zhao wrote the manuscript.

