


Mitochondrial damage represents a dramatic change in cellular homeostasis. One rapid response is perimitochondrial actin polymerization, termed acute damage-induced actin (ADA). The consequences of ADA are not understood. In this study, we show evidence suggesting that ADA is linked to rapid glycolytic activation upon mitochondrial damage in multiple cells, including mouse embryonic fibroblasts and effector CD8+ T lymphocytes. ADA-inducing treatments include CCCP, antimycin, rotenone, oligomycin, and hypoxia. The Arp2/3 complex inhibitor CK666 or the mitochondrial sodium–calcium exchanger (NCLX) inhibitor CGP37157 inhibits both ADA and the glycolytic increase within 5 min, supporting ADA’s role in glycolytic stimulation. Two situations causing chronic reductions in mitochondrial ATP production, mitochondrial DNA depletion and mutation to the NDUFS4 subunit of complex 1 of the electron transport chain, cause persistent perimitochondrial actin filaments similar to ADA. CK666 treatment causes rapid mitochondrial actin loss and a drop in ATP in NDUFS4 knock-out cells. We propose that ADA is necessary for rapid glycolytic activation upon mitochondrial impairment, to re-establish ATP production.
Introduction
Mitochondrial damage represents an acute cellular stress, compromising ATP production and the balance of several key metabolites, as well as a rise in reactive oxygen species in some situations (Kasahara and Scorrano, 2014; Nunnari and Suomalainen, 2012). Cells respond in many ways to mitochondrial damage, including upregulating glycolysis and mitochondrial destruction by mitophagy (Pickles et al., 2018; Sturdik et al., 1986). These responses require extensive communication between mitochondria and the rest of the cell, and defects in these responses are linked to multiple pathologies such as Parkinson’s.
One response is acute damage-induced actin (ADA), resulting in a dense actin filament network surrounding the mitochondrion within 5 min of mitochondrial damage (Fung et al., 2019; Li et al., 2015). This actin network is dependent on Arp2/3 complex and has morphological similarities to other Arp2/3 complex-dependent mitochondrial polymerization events that occur in interphase (Moore et al., 2016) and mitotic cells (Moore et al., 2021). ADA is distinct, however, from another population of actin filaments that influence mitochondria, which we call calcium-induced actin (CIA). CIA is not dependent on Arp2/3 complex, but instead on the formin INF2, which is activated by increased cytoplasmic calcium (Chakrabarti et al., 2018; Ji et al., 2015; Shao et al., 2015; Wales et al., 2016). A consequence of CIA is increased mitochondrial division through two mechanisms: (1) increased ER-to-mitochondrial calcium transfer, leading to increased inner mitochondrial membrane (IMM) dynamics; and (2) increased recruitment of the mitochondrial division factor Drp1 to the outer mitochondrial membrane (OMM), leading to increased OMM dynamics (Chakrabarti et al., 2018).
The function of ADA is at present unclear. One study suggests that ADA increases mitochondrial division (Li et al., 2015). Our previous data, however, suggest that ADA actually decreases the extensive mitochondrial dynamics that occur in the acute stages of mitochondrial depolarization (Fung et al., 2022; Fung et al., 2019). We also show that these mitochondrial dynamics are more consistent with changes to IMM morphology, driven by the IMM protease Oma1, than they are with mitochondrial division. These findings are in line with several previous studies (De Vos et al., 2005; Liu and Hajnóczky, 2011; Minamikawa et al., 1999; Miyazono et al., 2018). The acute mitochondrial changes induced by depolarization are independent of Drp1 (Fung et al., 2019; Miyazono et al., 2018).
In this study, we provide evidence for a second function for ADA: stimulation of the rapid increase in glycolysis in response to compromised mitochondrial function. This effect on glycolysis occurs upon a variety of treatments, including hypoxia. Based on these results, we postulate that ADA represents an acute response to maintain cellular ATP levels in the face of mitochondrial dysfunction.
Results and discussion
To begin our investigation into the function of ADA, we first asked whether ADA is a common cellular response, both in terms of cell type and in terms of the nature of the mitochondrial assault. ADA is rapidly and transiently induced by carbonyl cyanide m-chlorophenyl hydrazone (CCCP), a mitochondrial depolarizer, in multiple cell lines including mouse embryonic fibroblasts (MEFs), U2-OS, HeLa, and Cos-7 cells (Fig. 1; and Videos 1, 2, 3, and 4). In all cases, maximum actin polymerization occurs within 4 min, and actin is largely depolymerized in 10 min. Closer examination shows that actin accumulates around most but not all mitochondria in both live-cell imaging of multiple cell types (Fig. 1 A) and fixed-cell imaging of MEFs (Fig. S1, A and B). Quantification of ADA-associated mitochondria in response to CCCP at 3-min post-treatment reveals that 92.9 ± 2.8% mitochondria display ADA versus 0.8 ± 1.4% for control cells (Fig. S1 C). The actin-free mitochondria are frequently smaller, which may be due to CCCP-induced circularization that has been previously identified (De Vos et al., 2005; Liu and Hajnóczky, 2011; Minamikawa et al., 1999; Miyazono et al., 2018) and that we have shown to be inhibited by ADA (Fung et al., 2022; Fung et al., 2019).

ADA in multiple cell types. (A) Micrographs of live-cell imaging for U2-OS, HeLa, Cos-7, and MEF cell before (0 s) and at their peak ADA timepoints after 20 µM CCCP addition (150 s–U2-OS; 135 s -HeLa; 210 s–Cos-7; 225 s–MEF). All cells were transfected with markers for actin filaments (GFP-F-tractin, green) and mitochondria (mito-DsRed, red). Scale bars are 10 μm (full cell) and 5 μm (inset). Yellow arrow indicates punctate mitochondrion without actin assembly. Corresponds to Videos 1, 2, 3, and 4. (B) Graph of actin intensity (± SEM) around mitochondria in U2-OS, HeLa, Cos-7, and MEF cells as a function of time of 20 µM CCCP or 100 µM CK666 + 20 µM CCCP simultaneous treatment. Cells per condition: U2-OS, n = 31; HeLa, n = 32; Cos-7, n ≥ 17; MEF, n ≥ 22 combined from two independent experiments. Arrows indicate time of treatment. **** P < 0.0001. Statistical significance was calculated between the indicated timepoint using unpaired two-tailed t tests. Experiments done in 25 mM glucose with serum. Exact number of experiments, statistical tests, and sample sizes are provided in Table S1.
ADA in multiple cell types. (A) Micrographs of live-cell imaging for U2-OS, HeLa, Cos-7, and MEF cell before (0 s) and at their peak ADA timepoints after 20 µM CCCP addition (150 s–U2-OS; 135 s -HeLa; 210 s–Cos-7; 225 s–MEF). All cells were transfected with markers for actin filaments (GFP-F-tractin, green) and mitochondria (mito-DsRed, red). Scale bars are 10 μm (full cell) and 5 μm (inset). Yellow arrow indicates punctate mitochondrion without actin assembly. Corresponds to Videos 1, 2, 3, and 4. (B) Graph of actin intensity (± SEM) around mitochondria in U2-OS, HeLa, Cos-7, and MEF cells as a function of time of 20 µM CCCP or 100 µM CK666 + 20 µM CCCP simultaneous treatment. Cells per condition: U2-OS, n = 31; HeLa, n = 32; Cos-7, n ≥ 17; MEF, n ≥ 22 combined from two independent experiments. Arrows indicate time of treatment. **** P < 0.0001. Statistical significance was calculated between the indicated timepoint using unpaired two-tailed t tests. Experiments done in 25 mM glucose with serum. Exact number of experiments, statistical tests, and sample sizes are provided in Table S1.
ADA in U2-OS. U2-OS cell expressing GFP-F-tractin (green) and mito-BFP (red), stimulated with 20 μM CCCP at time 00:00 (min:s). Confocal images acquired every 15 s at medial region 2–4 μm above basal surface. Corresponds to Fig. 1 A. Scale bars: 10 and 5 μm (inset). Time stamp: min:s.
ADA in U2-OS. U2-OS cell expressing GFP-F-tractin (green) and mito-BFP (red), stimulated with 20 μM CCCP at time 00:00 (min:s). Confocal images acquired every 15 s at medial region 2–4 μm above basal surface. Corresponds to Fig. 1 A. Scale bars: 10 and 5 μm (inset). Time stamp: min:s.
ADA in HeLa. HeLa cell expressing GFP-F-tractin (green) and mito-BFP (red), stimulated with 20 μM CCCP at time 00:00 (min:s). Confocal images acquired every 15 s at medial region 2–4 μm above basal surface. Corresponds to Fig. 1 A. Scale bars: 10 and 5 μm (inset). Time stamp: min:s.
ADA in HeLa. HeLa cell expressing GFP-F-tractin (green) and mito-BFP (red), stimulated with 20 μM CCCP at time 00:00 (min:s). Confocal images acquired every 15 s at medial region 2–4 μm above basal surface. Corresponds to Fig. 1 A. Scale bars: 10 and 5 μm (inset). Time stamp: min:s.
ADA in Cos-7. Cos-7 cell expressing GFP-F-tractin (green) and mito-BFP (red), stimulated with 20 μM CCCP at time 00:00 (min:s). Confocal images acquired every 15 s at medial region 2–4 μm above basal surface. Corresponds to Fig. 1 A. Scale bars: 10 and 5 μm (inset). Time stamp: min:s.
ADA in Cos-7. Cos-7 cell expressing GFP-F-tractin (green) and mito-BFP (red), stimulated with 20 μM CCCP at time 00:00 (min:s). Confocal images acquired every 15 s at medial region 2–4 μm above basal surface. Corresponds to Fig. 1 A. Scale bars: 10 and 5 μm (inset). Time stamp: min:s.
ADA in MEF. MEF cell expressing GFP-F-tractin (green) and mito-BFP (red), stimulated with 20 μM CCCP at time 00:00 (min:s). Confocal images acquired every 15 s at medial region 2–4 μm above basal surface. Corresponds to Fig. 1 A. Scale bars: 10 and 5 μm (inset). Time stamp: min:s.
ADA in MEF. MEF cell expressing GFP-F-tractin (green) and mito-BFP (red), stimulated with 20 μM CCCP at time 00:00 (min:s). Confocal images acquired every 15 s at medial region 2–4 μm above basal surface. Corresponds to Fig. 1 A. Scale bars: 10 and 5 μm (inset). Time stamp: min:s.
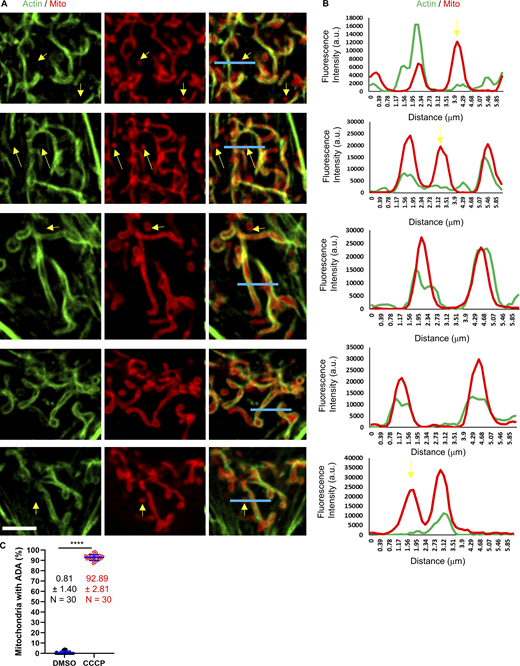
Line scans of ADA MEFs. (A) Micrographs of actin assembly around mitochondria in fixed MEFs, stained for actin (green) and mitochondria (red). Scale bar: 5 µm. Blue lines represent the region for line scans in B. Yellow arrows indicate punctate mitochondria without actin assembly. (B) Line scans showing the fluorescent intensity for actin and mitochondria signal across each mitochondrion as shown in A. (C) Quantification of % mitochondria displaying ADA in control (DMSO-treated) and CCCP-treated (3 min) MEFs. n = 30 cells combined from three independent experiments. Mean, SD, and number of cells given for each condition on graph. **** P < 0.0001. Statistical significance was calculated using unpaired two-tailed t tests. Number of experiments, sample sizes, and statistical tests are provided in Table S1. Video 5 shows a closedup mitochondria with ADA in U2-OS cell.

Line scans of ADA MEFs. (A) Micrographs of actin assembly around mitochondria in fixed MEFs, stained for actin (green) and mitochondria (red). Scale bar: 5 µm. Blue lines represent the region for line scans in B. Yellow arrows indicate punctate mitochondria without actin assembly. (B) Line scans showing the fluorescent intensity for actin and mitochondria signal across each mitochondrion as shown in A. (C) Quantification of % mitochondria displaying ADA in control (DMSO-treated) and CCCP-treated (3 min) MEFs. n = 30 cells combined from three independent experiments. Mean, SD, and number of cells given for each condition on graph. **** P < 0.0001. Statistical significance was calculated using unpaired two-tailed t tests. Number of experiments, sample sizes, and statistical tests are provided in Table S1. Video 5 shows a closedup mitochondria with ADA in U2-OS cell.
Treatment with CK666, an Arp2/3 complex inhibitor (Nolen et al., 2009), inhibits ADA in all cell types tested (Fig. 1 B), similar to our previous results in U2-OS cells (Fung et al., 2022; Fung et al., 2019) and to the actin “waves” (Moore et al., 2016) or "clouds" (Moore et al., 2021) recently shown in interphase and mitotic cells, respectively. ADA does not appear to drive directional mitochondrial motility (Videos 1, 2, 3, and 4), and the actin polymerization rarely extends appreciably beyond the mitochondrion (Video 5), in contrast to the motility-inducing actin “tails” previously shown to assemble from actin clouds in mitotic cells (Moore et al., 2021).
Zoomed-in view of ADA and mitochondria in U2-OS. U2-OS cell expressing GFP-F-tractin (green) and mito-BFP (red) stimulated with 20 μM CCCP at time 0 (s). Confocal images acquired every 15 s at medial region 2–4 μm above basal surface. Scale bars: 2 μm. Time stamp: s.
Zoomed-in view of ADA and mitochondria in U2-OS. U2-OS cell expressing GFP-F-tractin (green) and mito-BFP (red) stimulated with 20 μM CCCP at time 0 (s). Confocal images acquired every 15 s at medial region 2–4 μm above basal surface. Scale bars: 2 μm. Time stamp: s.
Since CCCP is a relatively harsh treatment, resulting in complete mitochondrial depolarization in seconds, we tested two electron transport chain (ETC) inhibitors: antimycin A (Complex III) and rotenone (Complex I), which cause partial depolarization, as measured by tetramethylrhodamine ethyl ester (TMRE; Fig. 2 A). ADA is induced within 3 min for both antimycin A and rotenone, in a CK666-inhibitable manner (Fig. 2, B and C). Importantly, CK666 effectively inhibits ADA when added simultaneously to the ADA stimulus, suggesting that the effect of Arp2/3 complex inhibition is on the acute ADA response. We also examined the effect of the ATP synthase inhibitor oligomycin on ADA, which causes a slight increase in mitochondrial polarization over 5 min (Fig. S2 A). Oligomycin stimulates ADA in a CK666-inhibitable manner (Fig. S2, B and C). This result suggests that ADA is not triggered by decreased mitochondrial polarization.

ADA stimulation by mitochondrial depolarization or ETC inhibition. (A) Mitochondrial depolarization (assessed by TMRE fluorescence) in MEFs with DMSO, CCCP, antimycin A or rotenone (± SEM) treatments. n ≥ 98 cells per group combined from three independent experiments. Experiments done in 25 mM glucose with serum. (B) MEFs stained for actin filaments (TRITC-phalloidin, green), mitochondria (Tom20, red) and DNA (DAPI, blue) after 3 min treatment with DMSO, 20 µM CCCP, 25 µM antimycin A or 50 µM rotenone in the absence (top) or presence (bottom) of 100 µM CK666. Right images are zooms of boxed regions. Scale bar: 5 μm. (C) % cells (± SD) displaying ADA for the conditions shown in B. n ≥ 62/18 cells/fields of view (FOV) per group combined from two experiments. Experiments done in 25 mM glucose with serum. (D) MEFs stained similarly to B, in normoxia or hypoxia for 30 min, in the presence or absence of 100 µM CK666. Scale bars are 10 μm (full cell) and 5 μm (inset). (E) % cells displaying ADA after 30 min normoxia or hypoxia, in the absence or presence of 100 µM CK666. n ≥ 174/20 cells/FOV per group combined from two biological experiments. Experiments done in 25 mM glucose without serum. Exact number of experiments, FOV and sample size are provided in Table S1.
ADA stimulation by mitochondrial depolarization or ETC inhibition. (A) Mitochondrial depolarization (assessed by TMRE fluorescence) in MEFs with DMSO, CCCP, antimycin A or rotenone (± SEM) treatments. n ≥ 98 cells per group combined from three independent experiments. Experiments done in 25 mM glucose with serum. (B) MEFs stained for actin filaments (TRITC-phalloidin, green), mitochondria (Tom20, red) and DNA (DAPI, blue) after 3 min treatment with DMSO, 20 µM CCCP, 25 µM antimycin A or 50 µM rotenone in the absence (top) or presence (bottom) of 100 µM CK666. Right images are zooms of boxed regions. Scale bar: 5 μm. (C) % cells (± SD) displaying ADA for the conditions shown in B. n ≥ 62/18 cells/fields of view (FOV) per group combined from two experiments. Experiments done in 25 mM glucose with serum. (D) MEFs stained similarly to B, in normoxia or hypoxia for 30 min, in the presence or absence of 100 µM CK666. Scale bars are 10 μm (full cell) and 5 μm (inset). (E) % cells displaying ADA after 30 min normoxia or hypoxia, in the absence or presence of 100 µM CK666. n ≥ 174/20 cells/FOV per group combined from two biological experiments. Experiments done in 25 mM glucose without serum. Exact number of experiments, FOV and sample size are provided in Table S1.
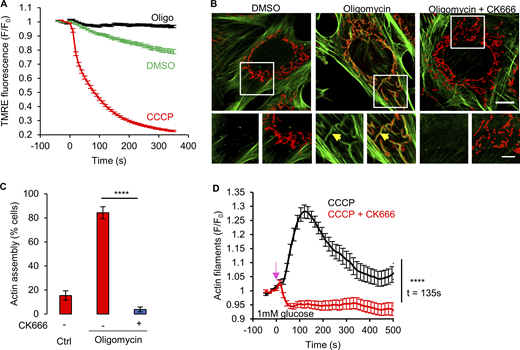
Oligomycin-induced ADA in MEFs. (A) Mitochondrial polarization (assessed by TMRE fluorescence) in MEFs with DMSO, 1 µM CCCP or 1.5 µM oligomycin (± SEM) treatment. n ≥ 118 cells per group combined from two independent experiments. Experiments done in 2 mM glucose without serum. (B) MEFs stained for actin filaments (TRITC-phalloidin, green), mitochondria (Tom20, red) and DNA (DAPI, blue) after 5 min treatment with DMSO, 1.5 µM oligomycin or 1.5 µM oligomycin with 100 µM CK666. Bottom images are zooms of boxed regions. Experiments done in 2 mM glucose without serum. Scale bars: 10 and 5 μm. Arrow indicates actin assembly. (C) % cells (± SEM) displaying ADA for the conditions shown in panel B. n ≥ 65/14 cells/fields of view (FOV) per group combined from two independent experiments. **** P < 0.0001. Statistical significance was calculated using unpaired two-tailed t tests. Experiments done in 2 mM glucose without serum. (D) Graph of actin intensity (± SEM) around mitochondria in MEF cells as a function of time for 1 µM CCCP or 100 µM CK666 + 1 µM CCCP simultaneous treatment. Cells were cultured in Agilent seahorse DMEM supplemented with 1 mM glucose and 4 mM glutamine but without serum for 1 h before imaging. n ≥ 35 cells per condition combined from two independent experiments. Arrow indicates time of treatment. **** P < 0.0001. Statistical significance at indicated timepoint was calculated using unpaired two-tailed t tests. Number of experiments, statistical tests, and sample sizes are provided in Table S1.

Oligomycin-induced ADA in MEFs. (A) Mitochondrial polarization (assessed by TMRE fluorescence) in MEFs with DMSO, 1 µM CCCP or 1.5 µM oligomycin (± SEM) treatment. n ≥ 118 cells per group combined from two independent experiments. Experiments done in 2 mM glucose without serum. (B) MEFs stained for actin filaments (TRITC-phalloidin, green), mitochondria (Tom20, red) and DNA (DAPI, blue) after 5 min treatment with DMSO, 1.5 µM oligomycin or 1.5 µM oligomycin with 100 µM CK666. Bottom images are zooms of boxed regions. Experiments done in 2 mM glucose without serum. Scale bars: 10 and 5 μm. Arrow indicates actin assembly. (C) % cells (± SEM) displaying ADA for the conditions shown in panel B. n ≥ 65/14 cells/fields of view (FOV) per group combined from two independent experiments. **** P < 0.0001. Statistical significance was calculated using unpaired two-tailed t tests. Experiments done in 2 mM glucose without serum. (D) Graph of actin intensity (± SEM) around mitochondria in MEF cells as a function of time for 1 µM CCCP or 100 µM CK666 + 1 µM CCCP simultaneous treatment. Cells were cultured in Agilent seahorse DMEM supplemented with 1 mM glucose and 4 mM glutamine but without serum for 1 h before imaging. n ≥ 35 cells per condition combined from two independent experiments. Arrow indicates time of treatment. **** P < 0.0001. Statistical significance at indicated timepoint was calculated using unpaired two-tailed t tests. Number of experiments, statistical tests, and sample sizes are provided in Table S1.
Another deleterious treatment is hypoxia, which depletes a necessary substrate for Complex IV of the ETC. Upon exposure to hypoxia (1% oxygen), morphologically similar actin filaments to those generated by the ADA treatments arise within 30 min (Fig. 2, D and E). Hypoxia-induced actin polymerization is inhibited by CK666 (Fig. 2, D and E). These results show that ADA is a rapid response to multiple acute treatments that inhibit oxidative phosphorylation (oxphos), including chemical treatments (CCCP, antimycin A, rotenone, oligomycin) and oxygen deprivation (hypoxia).
ADA is required for rapid upregulation of glycolysis upon oxphos inhibition
What might be the function of ADA? Since ADA is stimulated by treatments that inhibit oxphos, we asked whether inhibiting ADA would have an impact on cytoplasmic ATP levels. For these experiments, we used the GO-ATeam1 ATP biosensor (Nakano et al., 2011) in live MEFs. To inhibit ADA, we used CK666 added simultaneously to the stimulus, decreasing the possibility of longer term CK666 effects. We conducted the experiment at two glucose concentrations: 25 mM, which is the concentration in DMEM but is ∼fivefold higher than serum glucose; and 2 mM, which is hypoglycemic compared to serum but is similar to the extracellular glucose concentration in a number of environments, including solid tumors (Ho et al., 2015) and in the brain (Silver and Erecińska, 1994). ADA occurs in MEFs in hypoglycemic conditions (Fig. S2 D), similar to our earlier results in 25 mM glucose (Fig. 1, A and B).
At 2 mM glucose, there is a 20% drop in ATP within 2 min of mitochondrial depolarization by CCCP. Simultaneous addition of CK666 increases the ATP drop to >30% (Fig. 3 A and Fig. S3 A). Biochemical assays of whole-cell ATP levels show similar results (Fig. S3 B). The effects of antimycin A or rotenone on ATP levels are slower than for CCCP, with the rotenone effect being negligible (Fig. 3 B and Fig. S3 C). However, CK666 addition causes significant additional drops in cytosolic ATP for both antimycin and rotenone treatment at 2 mM glucose (Fig. 3 B and Fig. S3 C). At 25 mM glucose, CK666 has a non-significant effect on ATP levels when added with CCCP, antimycin, or rotenone (Fig. S3, D and E). Treatment with CK666 alone does not have a significant effect on ATP levels at either glucose concentration (Fig. 3, A and B; and Fig. S3, D and E). These experiments suggest that ADA is necessary to maintain cellular ATP levels upon oxphos inhibition when glucose is limited.

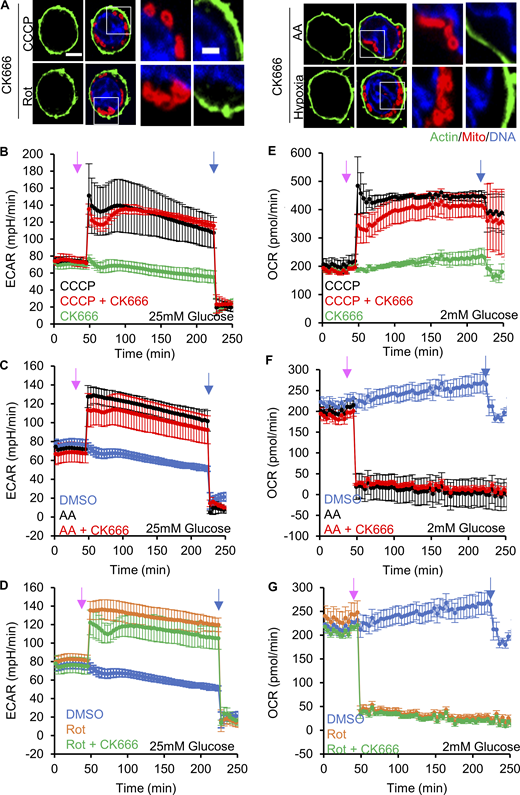
ADA is required for glycolytic activation upon mitochondrial perturbation in MEFs. (A) Cytoplasmic ATP levels (± SEM) after 20 µM CCCP in the absence or presence of 100 µM CK666, using GO-ATeam1. n ≥ 35 cells per group combined from two independent experiments. P values are graphed in Fig. S3 A. Arrow indicates time of treatment. Experiments done in 2 mM glucose with serum. (B) Cytoplasmic ATP levels (± SEM) after 25 µM antimycin A or 50 µM rotenone in the absence or presence of 100 µM CK666, using GO-ATeam1. n ≥ 24 cells per group combined from two independent experiments. P values graphed in Fig. S3 C. Arrow indicates time of treatment. Experiments done in 2 mM glucose with serum. (C) ECAR (± SD) upon 100 µM CK666, 1 µM CCCP or 1 µM CCCP + 100 µM CK666 addition (15 min), followed by 50 mM 2-deoxyglucose (2-DG) (59 min) in 2 mM glucose medium without serum. n = 3 individual well measurements for CCCP and CK666; 4 for CCCP + CK666. Pink arrow indicates drug treatment and blue arrow indicate 2-DG treatment. (D) ECAR (± SD) upon DMSO, 100 µM CK666, 2.5 µM antimycin A or 2.5 µM antimycin A + 100 µM CK666 addition (33 min), then 50 mM 2-DG (258 min) in 2 mM glucose medium without serum. n = 5 individual well measurements per condition. Pink arrow indicates drug treatment and blue arrow indicates 2-DG treatment. (E) ECAR (± SD) upon DMSO, 100 µM CK666, 5 µM rotenone or 5 µM rotenone + 100 µM CK666 addition (33 min), then 50 mM 2-DG (258 min) in 2 mM glucose medium without serum. n = 5 individual well measurements per condition. Pink arrow indicates drug treatment and blue arrow indicates 2-DG treatment. (F) Effect of glucose concentration on ECAR spike (± SD) induced by 3 min 1 µM CCCP, with and without 100 µM CK666. n = 9 individual well measurements for CCCP and CK666; 12 for CCCP + CK666. P values graphed in Fig. S4 D. (G) Effect of 100 µM CK666 on lactate production in hypoxia (1% O2) in MEFs at 2 mM glucose without serum. Points indicate individual well measurements starting with 100,000 cells/well. n = 8 individual well measurements from four independent experiments. ** P = 0.0018; **** P < 0.0001. Statistical significance was calculated by two-way ANOVA using Tukey’s multiple comparisons test. Number of experiments, FOV, sample sizes and statistical tests are provided in Table S1.
ADA is required for glycolytic activation upon mitochondrial perturbation in MEFs. (A) Cytoplasmic ATP levels (± SEM) after 20 µM CCCP in the absence or presence of 100 µM CK666, using GO-ATeam1. n ≥ 35 cells per group combined from two independent experiments. P values are graphed in Fig. S3 A. Arrow indicates time of treatment. Experiments done in 2 mM glucose with serum. (B) Cytoplasmic ATP levels (± SEM) after 25 µM antimycin A or 50 µM rotenone in the absence or presence of 100 µM CK666, using GO-ATeam1. n ≥ 24 cells per group combined from two independent experiments. P values graphed in Fig. S3 C. Arrow indicates time of treatment. Experiments done in 2 mM glucose with serum. (C) ECAR (± SD) upon 100 µM CK666, 1 µM CCCP or 1 µM CCCP + 100 µM CK666 addition (15 min), followed by 50 mM 2-deoxyglucose (2-DG) (59 min) in 2 mM glucose medium without serum. n = 3 individual well measurements for CCCP and CK666; 4 for CCCP + CK666. Pink arrow indicates drug treatment and blue arrow indicate 2-DG treatment. (D) ECAR (± SD) upon DMSO, 100 µM CK666, 2.5 µM antimycin A or 2.5 µM antimycin A + 100 µM CK666 addition (33 min), then 50 mM 2-DG (258 min) in 2 mM glucose medium without serum. n = 5 individual well measurements per condition. Pink arrow indicates drug treatment and blue arrow indicates 2-DG treatment. (E) ECAR (± SD) upon DMSO, 100 µM CK666, 5 µM rotenone or 5 µM rotenone + 100 µM CK666 addition (33 min), then 50 mM 2-DG (258 min) in 2 mM glucose medium without serum. n = 5 individual well measurements per condition. Pink arrow indicates drug treatment and blue arrow indicates 2-DG treatment. (F) Effect of glucose concentration on ECAR spike (± SD) induced by 3 min 1 µM CCCP, with and without 100 µM CK666. n = 9 individual well measurements for CCCP and CK666; 12 for CCCP + CK666. P values graphed in Fig. S4 D. (G) Effect of 100 µM CK666 on lactate production in hypoxia (1% O2) in MEFs at 2 mM glucose without serum. Points indicate individual well measurements starting with 100,000 cells/well. n = 8 individual well measurements from four independent experiments. ** P = 0.0018; **** P < 0.0001. Statistical significance was calculated by two-way ANOVA using Tukey’s multiple comparisons test. Number of experiments, FOV, sample sizes and statistical tests are provided in Table S1.
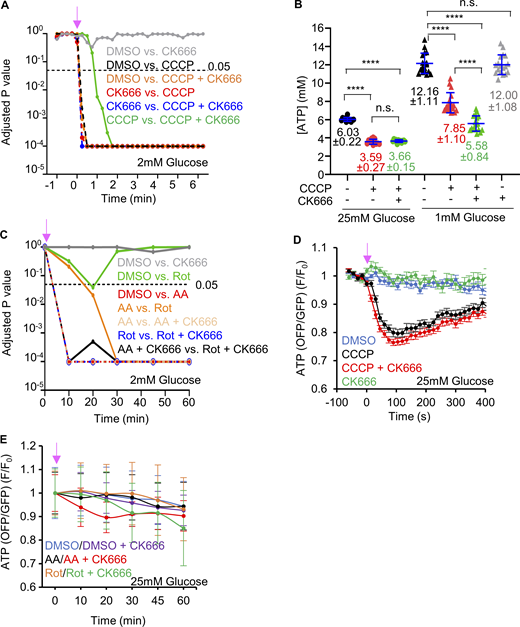
ATP levels changes by complex I or III inhibition. (A) Graph of P values for comparisons of GO-ATeam1 timecourses in Fig. 3 A (CCCP or CCCP/CK666 treatment of MEFs in 2 mM glucose). Statistical significance was calculated by two-way ANOVA using Tukey’s multiple comparisons test. (B) ATP levels (± SD) in MEFs upon DMSO, 1 µM CCCP or 1 µM CCCP + 100 µM CK666 treatments in medium containing either 1 or 25 mM glucose without serum, assayed from cell extracts. Points indicate individual measurements starting with 106 cells/dish. n = 12 individual well measurements from four independent experiments for 25 mM glucose groups and 18 individual well measurements from six independent experiments for 1 mM glucose groups. n.s. P > 0.05; **** P < 0.0001. Statistical significance was calculated by one-way ANOVA using Tukey’s multiple comparisons test. (C) Graph of P values for comparisons of GO-ATeam1 timecourses in Fig. 3 B (antimycin A and rotenone treatments of MEFs in 2 mM glucose). Statistical significance was calculated by two-way ANOVA using Tukey’s multiple comparisons test. (D) Graph of change in ATP levels (± SEM) in live MEFs stimulated with 20 µM CCCP in the absence or presence of 100 µM CK666, using GO-ATeam1 biosensor. Cells cultured in medium containing 25 mM glucose with serum. n ≥ 20 cells for each group combined from two independent experiments. Arrow indicates time of treatment. Statistical significance was calculated by two-way ANOVA using Tukey’s multiple comparisons test and presented in Table S1. (E) Graph of change in ATP levels (± SEM) in live MEFs stimulated with 25 µM antimycin A or 50 µM rotenone in the absence or presence of 100 µM CK666, using GO-ATeam1 biosensor. Cells cultured in medium containing 25 mM glucose with serum. n ≥ 33 cells for each group combined from two independent experiments. Arrow indicates time of treatment. Statistical significance was calculated by two-way ANOVA using Tukey’s multiple comparisons test and presented in Table S1. Number of experiments, statistical tests, and sample sizes are provided in Table S1.

ATP levels changes by complex I or III inhibition. (A) Graph of P values for comparisons of GO-ATeam1 timecourses in Fig. 3 A (CCCP or CCCP/CK666 treatment of MEFs in 2 mM glucose). Statistical significance was calculated by two-way ANOVA using Tukey’s multiple comparisons test. (B) ATP levels (± SD) in MEFs upon DMSO, 1 µM CCCP or 1 µM CCCP + 100 µM CK666 treatments in medium containing either 1 or 25 mM glucose without serum, assayed from cell extracts. Points indicate individual measurements starting with 106 cells/dish. n = 12 individual well measurements from four independent experiments for 25 mM glucose groups and 18 individual well measurements from six independent experiments for 1 mM glucose groups. n.s. P > 0.05; **** P < 0.0001. Statistical significance was calculated by one-way ANOVA using Tukey’s multiple comparisons test. (C) Graph of P values for comparisons of GO-ATeam1 timecourses in Fig. 3 B (antimycin A and rotenone treatments of MEFs in 2 mM glucose). Statistical significance was calculated by two-way ANOVA using Tukey’s multiple comparisons test. (D) Graph of change in ATP levels (± SEM) in live MEFs stimulated with 20 µM CCCP in the absence or presence of 100 µM CK666, using GO-ATeam1 biosensor. Cells cultured in medium containing 25 mM glucose with serum. n ≥ 20 cells for each group combined from two independent experiments. Arrow indicates time of treatment. Statistical significance was calculated by two-way ANOVA using Tukey’s multiple comparisons test and presented in Table S1. (E) Graph of change in ATP levels (± SEM) in live MEFs stimulated with 25 µM antimycin A or 50 µM rotenone in the absence or presence of 100 µM CK666, using GO-ATeam1 biosensor. Cells cultured in medium containing 25 mM glucose with serum. n ≥ 33 cells for each group combined from two independent experiments. Arrow indicates time of treatment. Statistical significance was calculated by two-way ANOVA using Tukey’s multiple comparisons test and presented in Table S1. Number of experiments, statistical tests, and sample sizes are provided in Table S1.
Inhibition of oxphos causes an increase in glycolysis to make up for decreased ATP production (Krebs, 1972; Racker, 1974). Changes in glycolysis can be assayed by changes in extracellular acidification rate (ECAR), an indirect measure of lactate production (Mookerjee et al., 2017). Treatment of MEFs with CCCP causes a rapid ECAR spike followed by prolonged ECAR elevation in both 2 and 25 mM glucose medium (Fig. 3 C and Fig. S4 A). The initial ECAR spike occurs at the first measurable timepoint after CCCP addition (3 min). Antimycin and rotenone also induce ECAR increases, but not as rapidly as CCCP (Fig. 3, D and E; and Fig. S4, B and C).
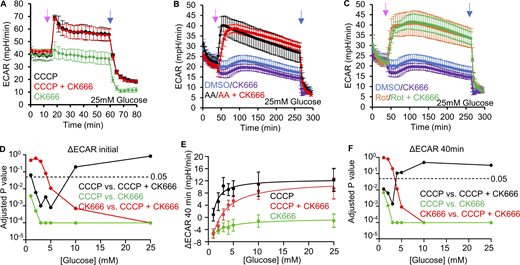
Changes in ECAR in MEFs after mitochondrial inhibitor treatments. (A) ECAR (± SD) upon 100 µM CK666, 1 µM CCCP or 1 µM CCCP + 100 µM CK666 addition (15 min), followed by 50 mM 2-DG (59 min) in 25 mM glucose medium without serum. n = 3 individual well measurements for CCCP and CK666; 4 for CCCP + CK666. Pink arrow indicates drug treatment and blue arrow indicates 2-DG treatment. (B) ECAR (± SD) upon DMSO, 100 µM CK666, 2.5 µM antimycin A or 2.5 µM antimycin A + 100 µM CK666 addition (33 min), then 50 mM 2-DG (258 min) in 25 mM glucose medium without serum. n = 5 individual well measurements per condition. Pink arrow indicates drug treatment and blue arrow indicates 2-DG treatment. (C) ECAR (± SD) upon DMSO, 100 µM CK666, 5 µM rotenone or 5 µM rotenone + 100 µM CK666 addition (33 min), then 50 mM 2-DG (258 min) in 25 mM glucose medium without serum. n = 5 individual well measurements per condition. Pink arrow indicates drug treatment and blue arrow indicates 2-DG treatment. (D) P values for comparisons between individual curves in Fig. 3 F. Statistical significance was calculated by two-way ANOVA using Tukey’s multiple comparisons test. (E) Effect of glucose concentration (± SD) on prolonged ECAR increase (after 40 min) induced by 1 µM CCCP or 1 µM CCCP + 100 µM CK666 in MEFs. n = 9 individual well measurements for CCCP and CK666; 12 for CCCP + CK666. P values graphed in F. (F) P values for comparisons between individual curves in E. Statistical significance was calculated by two-way ANOVA using Tukey’s multiple comparisons test. Number of experiments, statistical tests, and sample sizes are provided in Table S1.

Changes in ECAR in MEFs after mitochondrial inhibitor treatments. (A) ECAR (± SD) upon 100 µM CK666, 1 µM CCCP or 1 µM CCCP + 100 µM CK666 addition (15 min), followed by 50 mM 2-DG (59 min) in 25 mM glucose medium without serum. n = 3 individual well measurements for CCCP and CK666; 4 for CCCP + CK666. Pink arrow indicates drug treatment and blue arrow indicates 2-DG treatment. (B) ECAR (± SD) upon DMSO, 100 µM CK666, 2.5 µM antimycin A or 2.5 µM antimycin A + 100 µM CK666 addition (33 min), then 50 mM 2-DG (258 min) in 25 mM glucose medium without serum. n = 5 individual well measurements per condition. Pink arrow indicates drug treatment and blue arrow indicates 2-DG treatment. (C) ECAR (± SD) upon DMSO, 100 µM CK666, 5 µM rotenone or 5 µM rotenone + 100 µM CK666 addition (33 min), then 50 mM 2-DG (258 min) in 25 mM glucose medium without serum. n = 5 individual well measurements per condition. Pink arrow indicates drug treatment and blue arrow indicates 2-DG treatment. (D) P values for comparisons between individual curves in Fig. 3 F. Statistical significance was calculated by two-way ANOVA using Tukey’s multiple comparisons test. (E) Effect of glucose concentration (± SD) on prolonged ECAR increase (after 40 min) induced by 1 µM CCCP or 1 µM CCCP + 100 µM CK666 in MEFs. n = 9 individual well measurements for CCCP and CK666; 12 for CCCP + CK666. P values graphed in F. (F) P values for comparisons between individual curves in E. Statistical significance was calculated by two-way ANOVA using Tukey’s multiple comparisons test. Number of experiments, statistical tests, and sample sizes are provided in Table S1.
For all three treatments, addition of CK666 simultaneously with the treatment strongly suppresses the ECAR increase in 2 mM glucose (Fig. 3, C–E) but has much less inhibitory effect at 25 mM glucose (Fig. S4, A–C). Titrating the glucose concentration, we find significant effects of CK666 on ECAR occur at 5 mM glucose and below for CCCP treatment, for both the initial effect (3 min, Fig. 3 F and Fig. S4 D), or at 40 min after treatment (Fig. S4, E and F). These results show that Arp2/3 complex-mediated actin polymerization is necessary for upregulation of glycolysis upon inhibition of oxphos.
Given that CK666 is added at the same time as CCCP and inhibits both ADA and the initial ECAR increase by CCCP (both occurring within 3 min), it is likely to us that ADA is the relevant population of actin filaments responsible for the ECAR increase. However, Arp2/3 complex plays roles in many cellular processes, so a more specific link between ADA and the glycolytic increase is needed. We have previously shown that the initial step in CCCP-triggered Arp2/3 complex activation is a rise in cytoplasmic calcium, dependent upon the mitochondrial sodium-calcium exchanger NCLX (Fung et al., 2022). We asked whether the NCLX inhibitor CGP37157 would affect the CCCP-induced glycolytic response. When applied simultaneously with CCCP, CGP37157 lowers ECAR to a similar extent as CK666 (Fig. S5 A). Oligomycin also potently increases ECAR (Pike Winer and Wu, 2014). We tested the effects of CK666 and CGP37157 on oligomycin-stimulated ECAR at 2 mM glucose. Similar to their effects with CCCP, both CK666 and CGP37157 inhibit the oligomycin-stimulated ECAR increase (Fig. S5 B). These results suggest that ADA is the relevant Arp2/3 complex-dependent actin population that stimulates glycolysis, as opposed to another Arp2/3 complex-dependent process.
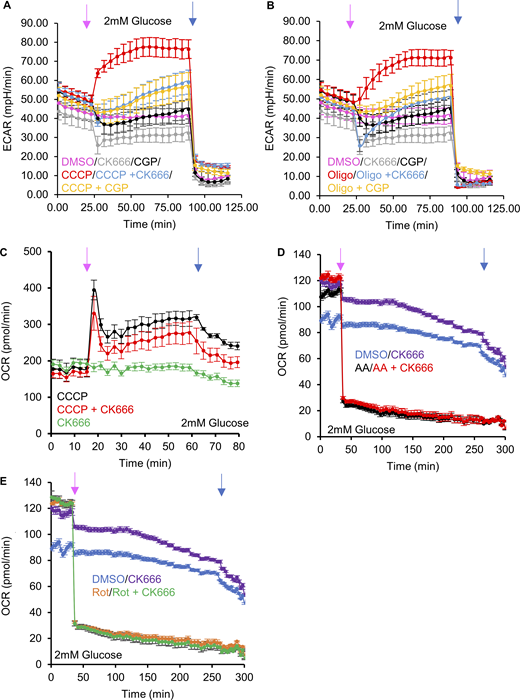
Effect of NCLX inhibition on CCCP- and oligomycin-activated glycolysis. (A) ECAR (± SD) upon DMSO, 100 µM CK666, 80 µM CGP37157, 1 µM CCCP, 1 µM CCCP + 100 µM CK666 addition, or 1 µM CCCP + 80 µM CGP37157 addition (at 23 min, pink arrow), followed by 50 mM 2-DG (at 89 min, blue arrow) in 2 mM glucose medium without serum. n = 8 individual well measurements per condition. (B) ECAR (± SD) upon DMSO, 100 µM CK666, 80 µM CGP37157, 1.5 µM oligomycin, 1 µM oligomycin + 100 µM CK666 addition or 1 µM oligomycin + 80 µM CGP37157 addition (at 23 min, pink arrow), followed by 50 mM 2-DG (at 89 min, blue arrow) in 2 mM glucose medium without serum. n = 8 individual well measurements per condition. (C) OCR (± SD) in MEFs (in 2 mM glucose without serum) upon 100 µM CK666, 1 µM CCCP or 1 µM CCCP + CK666 addition at 15 min, then 50 mM 2-DG at 59 min. n = 3 individual well measurements for CCCP and CK666; 4 for CCCP + CK666. Pink arrow indicates drug treatment and blue arrow indicates 2-DG treatment. (D) OCR (± SD) in MEFs (in 2 mM glucose without serum) upon DMSO, 100 µM CK666, 2.5 µM antimycin A or 2.5 µM antimycin A + 100 µM CK666 addition at 33 min, then 50 mM 2-DG at 258 min. n = 5 individual well measurements per condition. Pink arrow indicates drug treatment and blue arrow indicates 2-DG treatment. (E) OCR (± SD) in MEFs (in 2 mM glucose without serum) upon DMSO, 100 µM CK666, 2.5 µM rotenone or 2.5 µM rotenone + 100 µM CK666 addition at 33 min, then 50 mM 2-DG at 258 min. n = 5 individual well measurements per condition. Pink arrow indicates drug treatment and blue arrow indicates 2-DG treatment. Number of experiments and sample sizes are provided in Table S1.

Effect of NCLX inhibition on CCCP- and oligomycin-activated glycolysis. (A) ECAR (± SD) upon DMSO, 100 µM CK666, 80 µM CGP37157, 1 µM CCCP, 1 µM CCCP + 100 µM CK666 addition, or 1 µM CCCP + 80 µM CGP37157 addition (at 23 min, pink arrow), followed by 50 mM 2-DG (at 89 min, blue arrow) in 2 mM glucose medium without serum. n = 8 individual well measurements per condition. (B) ECAR (± SD) upon DMSO, 100 µM CK666, 80 µM CGP37157, 1.5 µM oligomycin, 1 µM oligomycin + 100 µM CK666 addition or 1 µM oligomycin + 80 µM CGP37157 addition (at 23 min, pink arrow), followed by 50 mM 2-DG (at 89 min, blue arrow) in 2 mM glucose medium without serum. n = 8 individual well measurements per condition. (C) OCR (± SD) in MEFs (in 2 mM glucose without serum) upon 100 µM CK666, 1 µM CCCP or 1 µM CCCP + CK666 addition at 15 min, then 50 mM 2-DG at 59 min. n = 3 individual well measurements for CCCP and CK666; 4 for CCCP + CK666. Pink arrow indicates drug treatment and blue arrow indicates 2-DG treatment. (D) OCR (± SD) in MEFs (in 2 mM glucose without serum) upon DMSO, 100 µM CK666, 2.5 µM antimycin A or 2.5 µM antimycin A + 100 µM CK666 addition at 33 min, then 50 mM 2-DG at 258 min. n = 5 individual well measurements per condition. Pink arrow indicates drug treatment and blue arrow indicates 2-DG treatment. (E) OCR (± SD) in MEFs (in 2 mM glucose without serum) upon DMSO, 100 µM CK666, 2.5 µM rotenone or 2.5 µM rotenone + 100 µM CK666 addition at 33 min, then 50 mM 2-DG at 258 min. n = 5 individual well measurements per condition. Pink arrow indicates drug treatment and blue arrow indicates 2-DG treatment. Number of experiments and sample sizes are provided in Table S1.
In contrast to its effects on ECAR, the effects of CK666 on oxygen consumption rate (OCR) are minimal for CCCP, antimycin, and rotenone. As expected (Brand and Nicholls, 2011), CCCP increases OCR, while antimycin and rotenone decrease OCR (Fig. S5, C–E). Simultaneous treatment with CK666 has no clear effect on OCR under any conditions (Fig. S5, C–E). These results show that CK666 affects the activation of glycolysis, rather than altering oxidative phosphorylation.
As a second method to assess glycolysis over a longer time period, we assayed lactate in the culture medium. At 2 mM glucose, lactate levels are significantly elevated by CCCP, antimycin, or rotenone treatment over a 5-h time course, but simultaneous addition of CK666 suppresses this increase (Fig. S6 A). In contrast, the effect of CK666 at 25 mM glucose is comparatively mild (Fig. S6 B).
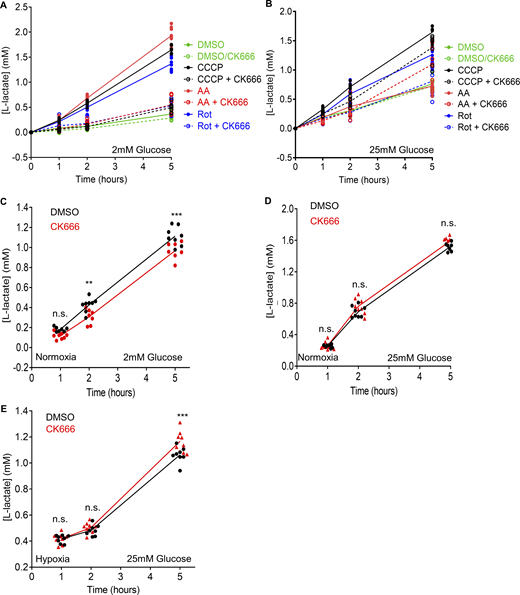
Changes in lactate production induced by mitochondrial inhibitors and hypoxia in MEFs. (A) Effect of 100 µM CK666 on lactate production upon 1 µM CCCP, 2.5 µM antimycin A, 5 µM rotenone or DMSO treatment of MEFs in 2 mM glucose without serum. Points indicate individual well measurements starting with 75,000 cells/well. n = 8 individual well measurements from four independent experiments. Statistical significance was calculated by two-way ANOVA using Tukey’s multiple comparisons test and presented in Table S1. (B) Effect of 100 µM CK666 on lactate production upon 1 µM CCCP, 2.5 µM antimycin A, 5 µM rotenone or DMSO treatment of MEFs in 25 mM glucose without serum. Points indicate individual well measurements starting with 75,000 cells/well. n = 8 individual well measurements from four independent experiments. Statistical significance was calculated by two-way ANOVA using Tukey’s multiple comparisons test and presented in Table S1. (C) Effect of 100 µM CK666 on lactate production in normoxia (21% O2) in MEFs at 2 mM glucose without serum. Points indicate individual well measurements starting with 100,000 cells/well. n = 8 individual well measurements from four independent experiments. n.s. P > 0.05; ** P = 0.002. *** P = 0.0002. Statistical significance was calculated by two-way ANOVA using Tukey’s multiple comparisons test. (D) Effect of 100 µM CK666 on lactate production in normoxia in MEFs at 25 mM glucose without serum. Points indicate individual well measurements starting with 100,000 cells/well. n = 8 individual well measurements from four independent experiments. n.s. P > 0.05. Statistical significance was calculated by two-way ANOVA using Sidak’s multiple comparisons test. (E) Effect of 100 µM CK666 on lactate production in hypoxia in MEFs at 25 mM glucose without serum. Points indicate individual well measurements starting with 100,000 cells/well. n = 8 individual well measurements from four independent experiments. n.s. P > 0.05; *** P = 0.0003. Statistical significance was calculated by two-way ANOVA using Tukey’s multiple comparisons test. Number of experiments, statistical tests, and sample sizes are provided in Table S1.

Changes in lactate production induced by mitochondrial inhibitors and hypoxia in MEFs. (A) Effect of 100 µM CK666 on lactate production upon 1 µM CCCP, 2.5 µM antimycin A, 5 µM rotenone or DMSO treatment of MEFs in 2 mM glucose without serum. Points indicate individual well measurements starting with 75,000 cells/well. n = 8 individual well measurements from four independent experiments. Statistical significance was calculated by two-way ANOVA using Tukey’s multiple comparisons test and presented in Table S1. (B) Effect of 100 µM CK666 on lactate production upon 1 µM CCCP, 2.5 µM antimycin A, 5 µM rotenone or DMSO treatment of MEFs in 25 mM glucose without serum. Points indicate individual well measurements starting with 75,000 cells/well. n = 8 individual well measurements from four independent experiments. Statistical significance was calculated by two-way ANOVA using Tukey’s multiple comparisons test and presented in Table S1. (C) Effect of 100 µM CK666 on lactate production in normoxia (21% O2) in MEFs at 2 mM glucose without serum. Points indicate individual well measurements starting with 100,000 cells/well. n = 8 individual well measurements from four independent experiments. n.s. P > 0.05; ** P = 0.002. *** P = 0.0002. Statistical significance was calculated by two-way ANOVA using Tukey’s multiple comparisons test. (D) Effect of 100 µM CK666 on lactate production in normoxia in MEFs at 25 mM glucose without serum. Points indicate individual well measurements starting with 100,000 cells/well. n = 8 individual well measurements from four independent experiments. n.s. P > 0.05. Statistical significance was calculated by two-way ANOVA using Sidak’s multiple comparisons test. (E) Effect of 100 µM CK666 on lactate production in hypoxia in MEFs at 25 mM glucose without serum. Points indicate individual well measurements starting with 100,000 cells/well. n = 8 individual well measurements from four independent experiments. n.s. P > 0.05; *** P = 0.0003. Statistical significance was calculated by two-way ANOVA using Tukey’s multiple comparisons test. Number of experiments, statistical tests, and sample sizes are provided in Table S1.
We also used the lactate assay to assess the effect of CK666 on glycolysis under hypoxic conditions (1% oxygen). At 2 mM glucose, CK666 inhibits lactate production 2.21-fold under hypoxic conditions (Fig. 3 G, 5-h timepoint) but only 1.15-fold in normoxia (Fig. S6 C). At 25 mM glucose, lactate production is similar in the presence or absence of CK666 in normoxic or hypoxic conditions (Fig. S6, D and E). These results suggest that Arp2/3 complex-mediated actin polymerization is important for the upregulation of glycolysis under hypoxic conditions.
Finally, we examined the effect of oligomycin on ATP levels and ECAR at both 25 and 2 mM glucose in MEFs. At 25 mM glucose, oligomycin treatment for 10 min causes a 10.2 ± 8.3% increase in cytoplasmic ATP, which is brought back to baseline by CK666 addition (1.0 ± 1.1%; Fig. S7 A). At 2 mM glucose, oligomycin causes a 3.4 ± 5.4% decrease in cytoplasmic ATP (Fig. S7 B). Although this change in cytoplasmic ATP is small, there is a significant activation of AMP-dependent protein kinase (AMPK; Fig. S7 C), which we have shown to be an initial step in ADA activation (Fung et al., 2022). In low glucose, CK666 addition to oligomycin causes further reduction of ATP level to 19.7 ± 7.5% (Fig. S7 B). These results suggest that glycolysis supplies the vast majority of ATP at either 25 or 2 mM glucose, but that Arp2/3 complex-mediated actin is required for optimal glycolysis under low glucose conditions when mitochondrial function is inhibited. The Seahorse assays suggest that the relevant Arp2/3 complex-mediated actin is ADA, based on its inhibition by both CK666 and CGP37157 (Fig. S5 B).
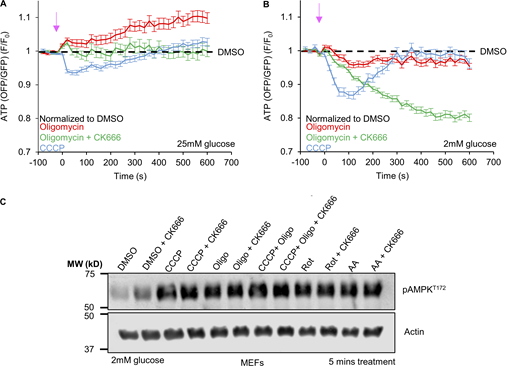
Cytoplasmic ATP changes induced by ATP synthase inhibition. (A) Cytoplasmic ATP levels (± SEM) after 1.5 µM oligomycin in the absence or presence of 100 µM CK666, or 1 µM CCCP using GO-ATeam1. Data were normalized to DMSO control. n ≥ 24 cells per group combined from two independent experiments. Arrow indicates time of treatment. Statistical significance was calculated by two-way ANOVA using Tukey’s multiple comparisons test and presented in Table S1. Experiments done in 25 mM glucose without serum. (B) Cytoplasmic ATP levels (± SEM) after 1.5 µM oligomycin in the absence or presence of 100 µM CK666, or 1 µM CCCP using GO-ATeam1. Data were normalized to DMSO control. n ≥ 24 cells per group combined from two independent experiments. Arrow indicates time of treatment. Statistical significance was calculated by two-way ANOVA using Tukey’s multiple comparisons test and presented in Table S1. Experiments done in 2 mM glucose without serum. (C) AMPK activation after 5 min treatment of MEFs with ETC or ATP synthase inhibition. Actin is used as a loading control. Experiments done in 2 mM glucose without serum. Number of experiments, statistical tests, and sample sizes are provided in Table S1. Source data are available for this figure: SourceDataFS7.

Cytoplasmic ATP changes induced by ATP synthase inhibition. (A) Cytoplasmic ATP levels (± SEM) after 1.5 µM oligomycin in the absence or presence of 100 µM CK666, or 1 µM CCCP using GO-ATeam1. Data were normalized to DMSO control. n ≥ 24 cells per group combined from two independent experiments. Arrow indicates time of treatment. Statistical significance was calculated by two-way ANOVA using Tukey’s multiple comparisons test and presented in Table S1. Experiments done in 25 mM glucose without serum. (B) Cytoplasmic ATP levels (± SEM) after 1.5 µM oligomycin in the absence or presence of 100 µM CK666, or 1 µM CCCP using GO-ATeam1. Data were normalized to DMSO control. n ≥ 24 cells per group combined from two independent experiments. Arrow indicates time of treatment. Statistical significance was calculated by two-way ANOVA using Tukey’s multiple comparisons test and presented in Table S1. Experiments done in 2 mM glucose without serum. (C) AMPK activation after 5 min treatment of MEFs with ETC or ATP synthase inhibition. Actin is used as a loading control. Experiments done in 2 mM glucose without serum. Number of experiments, statistical tests, and sample sizes are provided in Table S1. Source data are available for this figure: SourceDataFS7.
ETC protein depletion causes mitochondrially associated actin filaments and actin-dependent glycolytic activation
We tested whether longer term reduction of mitochondrial oxphos induced an ADA-like response. One method for inducing chronic oxphos reduction is depletion of mitochondrial DNA (mtDNA), which in mammals contains genes encoding essential subunits of complexes I, III, IV, and V (Vafai and Mootha, 2012). Treatment with a low dose of ethidium bromide (EtBr) causes mtDNA depletion (Fernández-Moreno et al., 2016). EtBr treatment of MEFs causes progressive mitochondrial depolarization over several days, with complete depolarization (comparable to CCCP) by 10 d (Fig. 4 A and Fig. S8 A). During this time, mitochondria adopt a circular conformation (Fig. S8 B). ADA-like filaments arise around mitochondria by day 2 and are still present after 10 d (Fig. 4, B and C; and Fig. S8 B). Although this mitochondrially associated actin is persistently present over multiple days (Fig. S8 B), it is inhibited within 5 min of CK666 treatment (Fig. S8 C). This result suggests that the mitochondrially associated actin filaments in these cells are dynamic, turning over with a half-life of <5 min.

Actin assembly in ETC protein depleted cells. (A) Mitochondrial polarization in MEFs (± SD) after 0.2 μg/ml ethidium bromide(EtBr)/50 μg/ml uridine treatment. Ctrl, untreated. Uridine, uridine treatment alone (10 d). CCCP - 10 min 20 µM CCCP-treated Ctrl cells. Circles indicate individual cell measurements (n ≥ 86 cells per group combined from two independent experiments). Experiments done in 25 mM glucose with serum. (B) MEFs under uridine alone or ethidium bromide/uridine treatment (EtBr) for 10 d, stained for actin filaments (green) and mitochondria (red). Scale bars: 5 μm. (C) % cells (± SD) displaying actin assembly after time in ethidium bromide/uridine, with and without 100 µM CK666. n ≥ 98/15 cells/fields of view (FOV) per group combined from two experiments. Experiments done in 25 mM glucose with serum. (D) Lactate production (± SD) in ethidium bromide cells (4 d, EtBr-4; 10 d, EtBr-10) and uridine-treated control (10 d), with and without 100 µM CK666 after 6 h. Points indicate individual well measurements starting with 75,000 cells/well. n = 8 individual well measurements from four independent experiments. n.s. P > 0.05; **** P < 0.0001. Statistical significance was calculated by one-way ANOVA using Tukey’s multiple comparisons test. Experiments done in 2 mM glucose without serum. (E) WT and NDUFS4 KO MEFs stained for actin filaments (green) and mitochondria (red). Scale bars: 5 μm. (F) % cells (± SD) displaying actin assembly in WT and NDUFS4 KO MEFs, with and without 10 min of 100 µM CK666 treatment. n ≥ 70/12 cells/FOVs per group combined from three independent experiments. * P = 0.018. Statistical significance was calculated using unpaired two-tailed t tests. Experiments done in 25 mM glucose with serum. (G) Cytosolic ATP levels in WT or NDUFS4 KO MEFs upon 100 µM CK666 treatment. n ≥ 30 cells per group combined from three independent experiments. Arrow indicates drug treatment. Experiments done in 25 mM glucose with serum. (H) Lactate production (± SD) in WT and NDUFS4 KO cells, with and without 100 µM CK666 after 6 h. Points indicate individual well measurements starting with 75,000 cells/well. n = 8 individual well measurements from four independent experiments. n.s. P > 0.05; **** P < 0.0001. Statistical significance was calculated by one-way ANOVA using Tukey’s multiple comparisons test. Experiments done in 2 mM glucose without serum. (I) % cells (± SEM) displaying actin assembly in control or Leigh syndrome patient fibroblasts. n ≥ 76/13 cells/FOVs per group combined from two independent experiments. Experiments done in 25 mM glucose with serum. Statistical tests are tabled in Fig. S10 B. Number of experiments, FOV, sample sizes, and statistical tests are provided in Table S1.
Actin assembly in ETC protein depleted cells. (A) Mitochondrial polarization in MEFs (± SD) after 0.2 μg/ml ethidium bromide(EtBr)/50 μg/ml uridine treatment. Ctrl, untreated. Uridine, uridine treatment alone (10 d). CCCP - 10 min 20 µM CCCP-treated Ctrl cells. Circles indicate individual cell measurements (n ≥ 86 cells per group combined from two independent experiments). Experiments done in 25 mM glucose with serum. (B) MEFs under uridine alone or ethidium bromide/uridine treatment (EtBr) for 10 d, stained for actin filaments (green) and mitochondria (red). Scale bars: 5 μm. (C) % cells (± SD) displaying actin assembly after time in ethidium bromide/uridine, with and without 100 µM CK666. n ≥ 98/15 cells/fields of view (FOV) per group combined from two experiments. Experiments done in 25 mM glucose with serum. (D) Lactate production (± SD) in ethidium bromide cells (4 d, EtBr-4; 10 d, EtBr-10) and uridine-treated control (10 d), with and without 100 µM CK666 after 6 h. Points indicate individual well measurements starting with 75,000 cells/well. n = 8 individual well measurements from four independent experiments. n.s. P > 0.05; **** P < 0.0001. Statistical significance was calculated by one-way ANOVA using Tukey’s multiple comparisons test. Experiments done in 2 mM glucose without serum. (E) WT and NDUFS4 KO MEFs stained for actin filaments (green) and mitochondria (red). Scale bars: 5 μm. (F) % cells (± SD) displaying actin assembly in WT and NDUFS4 KO MEFs, with and without 10 min of 100 µM CK666 treatment. n ≥ 70/12 cells/FOVs per group combined from three independent experiments. * P = 0.018. Statistical significance was calculated using unpaired two-tailed t tests. Experiments done in 25 mM glucose with serum. (G) Cytosolic ATP levels in WT or NDUFS4 KO MEFs upon 100 µM CK666 treatment. n ≥ 30 cells per group combined from three independent experiments. Arrow indicates drug treatment. Experiments done in 25 mM glucose with serum. (H) Lactate production (± SD) in WT and NDUFS4 KO cells, with and without 100 µM CK666 after 6 h. Points indicate individual well measurements starting with 75,000 cells/well. n = 8 individual well measurements from four independent experiments. n.s. P > 0.05; **** P < 0.0001. Statistical significance was calculated by one-way ANOVA using Tukey’s multiple comparisons test. Experiments done in 2 mM glucose without serum. (I) % cells (± SEM) displaying actin assembly in control or Leigh syndrome patient fibroblasts. n ≥ 76/13 cells/FOVs per group combined from two independent experiments. Experiments done in 25 mM glucose with serum. Statistical tests are tabled in Fig. S10 B. Number of experiments, FOV, sample sizes, and statistical tests are provided in Table S1.

ADA and mitochondrial depolarization in EtBr-treated cells. (A) Micrographs of TMRE staining of EtBr-treated cells at varying days post-treatment or control cells treated with uridine for 10 days. For days 8 and 10 post-EtBr treatment, the images below represent increased processing to reveal the presence of cells. Scale bar: 5 μm. (B) Micrographs of actin staining (TRITC-phalloidin, green) around mitochondria (Tom20, red) at different days of EtBr treatment. DNA is stained with DAPI (blue). Images at the bottom are zooms of the boxed region. Scale bars: 5 μm. (C) Micrographs of actin staining (TRITC-phalloidin, green) around mitochondria (Tom20, red) at day 10 of EtBr treatment with or without 100 µM CK666 for 5 min before fixation. Images at the right are zooms of the boxed region. Scale bars: 10 and 5 μm.

ADA and mitochondrial depolarization in EtBr-treated cells. (A) Micrographs of TMRE staining of EtBr-treated cells at varying days post-treatment or control cells treated with uridine for 10 days. For days 8 and 10 post-EtBr treatment, the images below represent increased processing to reveal the presence of cells. Scale bar: 5 μm. (B) Micrographs of actin staining (TRITC-phalloidin, green) around mitochondria (Tom20, red) at different days of EtBr treatment. DNA is stained with DAPI (blue). Images at the bottom are zooms of the boxed region. Scale bars: 5 μm. (C) Micrographs of actin staining (TRITC-phalloidin, green) around mitochondria (Tom20, red) at day 10 of EtBr treatment with or without 100 µM CK666 for 5 min before fixation. Images at the right are zooms of the boxed region. Scale bars: 10 and 5 μm.
We examined the effect of these perimitochondrial actin filaments on glycolysis in EtBr-treated MEFs, testing lactate production in cells treated for either 4 or 10 d (EtBr-4 and EtBr-10 cells, respectively), and comparing to control cells treated with uridine only (control) for 10 d. In medium containing 2 mM glucose, lactate production is elevated in both EtBr-4 and EtBr-10 cells compared to control (Fig. 4 D and Fig. S9, A–C). Treatment with CK666 reduces this lactate to control levels for both EtBr-4 and EtBr-10 (Fig. 4 D; and Fig. S9, A–C).
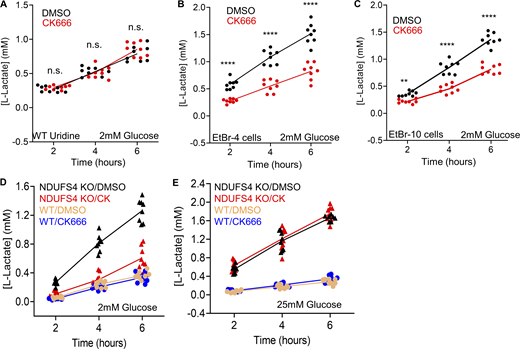
Changes in lactate production in EtBr or NDUFS4 KO MEFs. (A) Time course of lactate production from control cells (uridine-treated and in 2 mM glucose without serum) in the presence or absence of 100 µM CK666. Points indicate individual well measurements starting with 75,000 cells/well. n = 8 individual well measurements from four independent experiments. n.s. P > 0.05. (B) Time course of lactate production from EtBr-4 cells (in 2 mM glucose without serum) in the presence or absence of 100 µM CK666. Points indicate individual well measurements starting with 75,000 cells/well. n = 8 individual well measurements from four independent experiments. **** P < 0.0001. Statistical significance was calculated by two-way ANOVA using Tukey’s multiple comparisons test. (C) Time course of lactate production from EtBr-10 cells (in 2 mM glucose without serum) in the presence or absence of 100 µM CK666. Points indicate individual well measurements starting with 75,000 cells/well. n = 8 individual well measurements from four independent experiments. **** P < 0.0001. Statistical significance was calculated by two-way ANOVA using Tukey’s multiple comparisons test. (D) Time course of lactate production from WT and NDUFS4 KO cells (in 2 mM glucose without serum) in the presence or absence of 100 µM CK666. Points indicate individual well measurements starting with 75,000 cells/well. n = 8 individual well measurements from four independent experiments. Statistical significance between WT conditions and NDUFS4 KO conditions were calculated by two-way ANOVA using Tukey’s multiple comparisons test and presented in Table S1. (E) Time course of lactate production from WT and NDUFS4 KO cells (in 25 mM glucose without serum) in the presence or absence of 100 µM CK666. Points indicate individual well measurements starting with 75,000 cells/well. n = 8 individual well measurements from four independent experiments. Statistical significance between WT conditions and NDUFS4 KO conditions were calculated by two-way ANOVA using Tukey’s multiple comparisons test and presented in Table S1. Number of experiments, statistical tests, and sample sizes are provided in Table S1.

Changes in lactate production in EtBr or NDUFS4 KO MEFs. (A) Time course of lactate production from control cells (uridine-treated and in 2 mM glucose without serum) in the presence or absence of 100 µM CK666. Points indicate individual well measurements starting with 75,000 cells/well. n = 8 individual well measurements from four independent experiments. n.s. P > 0.05. (B) Time course of lactate production from EtBr-4 cells (in 2 mM glucose without serum) in the presence or absence of 100 µM CK666. Points indicate individual well measurements starting with 75,000 cells/well. n = 8 individual well measurements from four independent experiments. **** P < 0.0001. Statistical significance was calculated by two-way ANOVA using Tukey’s multiple comparisons test. (C) Time course of lactate production from EtBr-10 cells (in 2 mM glucose without serum) in the presence or absence of 100 µM CK666. Points indicate individual well measurements starting with 75,000 cells/well. n = 8 individual well measurements from four independent experiments. **** P < 0.0001. Statistical significance was calculated by two-way ANOVA using Tukey’s multiple comparisons test. (D) Time course of lactate production from WT and NDUFS4 KO cells (in 2 mM glucose without serum) in the presence or absence of 100 µM CK666. Points indicate individual well measurements starting with 75,000 cells/well. n = 8 individual well measurements from four independent experiments. Statistical significance between WT conditions and NDUFS4 KO conditions were calculated by two-way ANOVA using Tukey’s multiple comparisons test and presented in Table S1. (E) Time course of lactate production from WT and NDUFS4 KO cells (in 25 mM glucose without serum) in the presence or absence of 100 µM CK666. Points indicate individual well measurements starting with 75,000 cells/well. n = 8 individual well measurements from four independent experiments. Statistical significance between WT conditions and NDUFS4 KO conditions were calculated by two-way ANOVA using Tukey’s multiple comparisons test and presented in Table S1. Number of experiments, statistical tests, and sample sizes are provided in Table S1.
Another method for chronically reducing oxphos is knock-out of the NDUFS4 subunit of Complex I, which is associated with ∼5% of autosomal recessive cases of the neurometabolic disorder Leigh syndrome (Lake et al., 2016; Rahman and Thorburn, 1993). Mice with NDUFS4 KO in neurons and glia display progressive encephalopathy that resembles the disease phenotype (Quintana et al., 2010). Examination of NDUFS4 KO MEFs reveals ADA-like perimitochondrial actin accumulation in the majority of cells (Fig. 4, E and F). Similar to mtDNA-depleted cells, this ADA-like actin is largely removed within 10 min of CK666 treatment (Fig. 4, E and F). These results suggest that longer term inhibition of oxphos also leads to the accumulation of actin around mitochondria.
We tested cytoplasmic ATP levels in NDUFS4 KO cells using the GO-ATeam1 sensor, suspecting that the inhibition of ADA-like filaments would cause decreased ATP, similar to the mitochondrial poisons. In medium containing 2 mM glucose, treatment with CK666 causes an approximate 20% reduction in ATP levels in 10 min (Fig. 4 G), a similar time course to actin removal. In comparison, WT MEFs do not experience a significant ATP drop over 60 min of CK666 treatment (Fig. 4 G), similar to our earlier results. In terms of lactate production, NDUFS4 KO cells display characteristics similar to cells depleted of mitochondrial DNA. In medium containing 2 mM glucose, lactate production is significantly higher for these cells than WT MEFs, but is brought down to similar levels as WT MEFs by addition of CK666 (Fig. 4 H and Fig. S9 D). In 25 mM glucose, CK666 treatment causes no significant change in lactate production for NDUFS4 cells (Fig. S9 E), again showing that the Arp2/3 complex-dependent effect on glycolysis does not occur under hyperglycemic conditions.
We also examined fibroblasts from Leigh syndrome patients for ADA-like actin accumulation around mitochondria. Cells from two patients with defined mutations were examined, in addition to cells from two control subjects. The two patient lines display a significant increase in the percentage of cells displaying perimitochondrial actin (Fig. 4 I and Fig. S10), suggesting a similar situation to that in NDUFS4 KO cells.
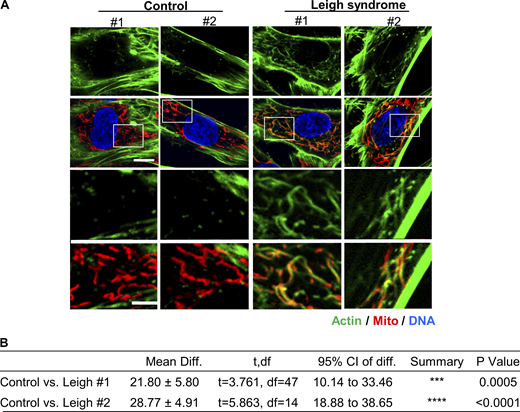
Actin assembly in Leigh syndrome fibroblasts. (A) Micrographs of actin staining (TRITC-phalloidin, green) around mitochondria (Tom20, red) for control and Leigh syndrome fibroblasts. Scale bars are 10 µm (full cell) and 5 µm (inset). (B) Table giving P values for comparisons of graph in Fig. 4 I using unpaired Student’s t test. Ctrl #1–2 were combined for analysis. Number of experiments and sample sizes are provided in Table S1.

Actin assembly in Leigh syndrome fibroblasts. (A) Micrographs of actin staining (TRITC-phalloidin, green) around mitochondria (Tom20, red) for control and Leigh syndrome fibroblasts. Scale bars are 10 µm (full cell) and 5 µm (inset). (B) Table giving P values for comparisons of graph in Fig. 4 I using unpaired Student’s t test. Ctrl #1–2 were combined for analysis. Number of experiments and sample sizes are provided in Table S1.
These results suggest that, similar to the acute treatments, Arp2/3 complex-dependent actin polymerization is necessary for optimal glycolytic capability in cells that have chronic mitochondrial dysfunction. These cells also maintain polymerized actin around their mitochondria.
ADA-dependent glycolytic activation in effector CD8+ T cells
T cells undergo a dramatic metabolic change upon activation from naïve T cells to effector T cells (Teff), upregulating glycolysis while also still using oxidative phosphorylation for significant ATP production (Geltink et al., 2018; Reina-Campos et al., 2021; Sena et al., 2013; van der Windt et al., 2012). Glycolytic activation is important for Teff proliferation and the elaboration of effector functions to kill target cells (Chang et al., 2013; Menk et al., 2018). To test the importance of ADA in T cells, we isolated CD8+ T cells from the spleens of naïve mice and activated them to Teff in vitro with anti-CD3 and anti-CD28 antibodies. Treatment with CCCP, antimycin, rotenone, or hypoxia causes mitochondrially associated actin polymerization in the majority of Teff, in a manner that is inhibited by CK666 (Fig. 5, A and B; and Fig. S11 A).

Effector T lymphocytes (Teff) require ADA for glycolytic activation. (A) Teff stained for actin filaments (TRITC-phalloidin, green), mitochondria (Tom20, red), and DNA (DAPI, blue) under un-stimulated conditions, or after treatment with 3 min 1 µM CCCP, 5 min 2.5 µM antimycin A, 5 5 µM min rotenone, or 60 min hypoxia in 2 mM glucose medium. Right images are zooms of boxed regions. Scale bars: 5 μm (full cell) and 2 μm (inset). (B) % cells (± SEM) displaying ADA in treatments described in A, n ≥ 61/5 cells/FOV per group combined from two independent experiments. **** P < 0.0001. Statistical significance between respective treatments in the presence or absence of CK666 was calculated using unpaired two-tailed t tests. Experiments done in 2 mM glucose without serum. (C) ECAR (± SD) in Teff upon addition of 100 µM CK666, 1 µM CCCP or 1 µM CCCP + 100 µM CK666 (45 min), followed by 50 mM 2-deoxyglucose (2-DG; 223 min) in 2 mM glucose medium without serum. n = 4 individual well measurements per condition. Pink arrow indicates drug treatment and blue arrow indicates 2-DG treatment. (D) ECAR (± SD) in Teff upon addition of DMSO, 2.5 µM antimycin A or 2.5 µM antimycin A + 100 µM CK666 (45 min), followed by 50 mM 2-DG (223 min) in 2 mM glucose medium without serum. n = 4 individual well measurements per condition. Pink arrow indicates drug treatment and blue arrow indicates 2-DG treatment. (E) ECAR (± SD) in Teff upon addition of DMSO, 5 µM rotenone or 5 µM rotenone + 100 µM CK666 (45 min), followed by 50 mM 2-DG (223 min) in 2 mM glucose medium without serum. n = 4 individual well measurements per condition. Pink arrow indicates drug treatment and blue arrow indicates 2-DG treatment. (F) Lactate production (2 mM glucose without serum) induced by hypoxia (1% oxygen) in Teff in the presence or absence of 100 µM CK666 addition. Circles indicate individual well measurements starting with 400,000 cells/well. n = 8 individual well measurements from four independent experiments. ** P = 0.0013; **** P < 0.0001. Statistical significance was calculated by two-way ANOVA using Tukey’s multiple comparisons test. Number of experiments, FOV, sample size, and statistical tests used are provided in Table S1.
Effector T lymphocytes (Teff) require ADA for glycolytic activation. (A) Teff stained for actin filaments (TRITC-phalloidin, green), mitochondria (Tom20, red), and DNA (DAPI, blue) under un-stimulated conditions, or after treatment with 3 min 1 µM CCCP, 5 min 2.5 µM antimycin A, 5 5 µM min rotenone, or 60 min hypoxia in 2 mM glucose medium. Right images are zooms of boxed regions. Scale bars: 5 μm (full cell) and 2 μm (inset). (B) % cells (± SEM) displaying ADA in treatments described in A, n ≥ 61/5 cells/FOV per group combined from two independent experiments. **** P < 0.0001. Statistical significance between respective treatments in the presence or absence of CK666 was calculated using unpaired two-tailed t tests. Experiments done in 2 mM glucose without serum. (C) ECAR (± SD) in Teff upon addition of 100 µM CK666, 1 µM CCCP or 1 µM CCCP + 100 µM CK666 (45 min), followed by 50 mM 2-deoxyglucose (2-DG; 223 min) in 2 mM glucose medium without serum. n = 4 individual well measurements per condition. Pink arrow indicates drug treatment and blue arrow indicates 2-DG treatment. (D) ECAR (± SD) in Teff upon addition of DMSO, 2.5 µM antimycin A or 2.5 µM antimycin A + 100 µM CK666 (45 min), followed by 50 mM 2-DG (223 min) in 2 mM glucose medium without serum. n = 4 individual well measurements per condition. Pink arrow indicates drug treatment and blue arrow indicates 2-DG treatment. (E) ECAR (± SD) in Teff upon addition of DMSO, 5 µM rotenone or 5 µM rotenone + 100 µM CK666 (45 min), followed by 50 mM 2-DG (223 min) in 2 mM glucose medium without serum. n = 4 individual well measurements per condition. Pink arrow indicates drug treatment and blue arrow indicates 2-DG treatment. (F) Lactate production (2 mM glucose without serum) induced by hypoxia (1% oxygen) in Teff in the presence or absence of 100 µM CK666 addition. Circles indicate individual well measurements starting with 400,000 cells/well. n = 8 individual well measurements from four independent experiments. ** P = 0.0013; **** P < 0.0001. Statistical significance was calculated by two-way ANOVA using Tukey’s multiple comparisons test. Number of experiments, FOV, sample size, and statistical tests used are provided in Table S1.
Effect of CK666 on ADA and glycolytic activation in Teff. (A) Teff stained for actin filaments (TRITC-phalloidin, green), mitochondria (Tom20, red) and DNA (DAPI, blue) after CCCP, antimycin A, rotenone, or hypoxia in the presence of CK666 for 2 mM glucose medium without serum (1 µM CCCP + 100 µM CK666, 3 min; 2.5 µM antimycin A + 100 µM CK666 and 5 µM rotenone + 100 µM CK666, 5 min; hypoxia with 100 µM CK666, 60 min). Images at right are zooms of boxed regions. Scale bars: 5 μm (full cell) and 2 μm (inset). (B) ECAR (± SD) in 25 mM glucose without serum upon 100 µM CK666, 1 µM CCCP or 1 µM CCCP + 100 µM CK666 addition at 45 min, then 50 mM 2-deoxyglucose (2-DG) at 223 min. n = 4 individual well measurements per condition. Pink arrow indicates drug treatment and blue arrow indicates 2-DG treatment. (C) ECAR (± SD) in 25 mM glucose without serum upon DMSO, 2.5 µM antimycin A or 2.5 µM antimycin A + 100 µM CK666 addition at 45 min, then 50 mM 2-DG at 223 min. n = 4 individual well measurements per condition. Pink arrow indicates drug treatment and blue arrow indicates 2-DG treatment. (D) ECAR (± SD) in 25 mM glucose without serum upon DMSO, 5 µM rotenone or 5 µM rotenone + 100 µM CK666 addition at 45 min, then 50 mM 2-DG at 223 min. n = 4 individual well measurements per condition. Pink arrow indicates drug treatment, and blue arrow indicates 2-DG treatment. (E) OCR (± SD) in 2 mM glucose without serum upon 100 µM CK666, 1 µM CCCP or 1 µM CCCP + 100 µM CK666 addition at 45 min, then 50 mM 2-DG at 223 min. n = 4 individual well measurements per condition. Pink arrow indicates drug treatment and blue arrow indicates 2-DG treatment. (F) OCR (± SD) in 2 mM glucose without serum upon DMSO, 2.5 µM antimycin A or 2.5 µM antimycin A + 100 µM CK666 addition at 45 min, then 50 mM 2-DG at 223 min. n = 4 individual well measurements per condition. Pink arrow indicates drug treatment and blue arrow indicates 2-DG treatment. (G) OCR (± SD) in 2 mM glucose without serum upon DMSO, 5 µM rotenone or 5 µM rotenone + 100 µM CK666 addition at 45 min, then 50 mM 2-DG at 223 min. n = 4 individual well measurements per condition. Pink arrow indicates drug treatment and blue arrow indicates 2-DG treatment. Number of experiments and sample sizes are provided in Table S1.

Effect of CK666 on ADA and glycolytic activation in Teff. (A) Teff stained for actin filaments (TRITC-phalloidin, green), mitochondria (Tom20, red) and DNA (DAPI, blue) after CCCP, antimycin A, rotenone, or hypoxia in the presence of CK666 for 2 mM glucose medium without serum (1 µM CCCP + 100 µM CK666, 3 min; 2.5 µM antimycin A + 100 µM CK666 and 5 µM rotenone + 100 µM CK666, 5 min; hypoxia with 100 µM CK666, 60 min). Images at right are zooms of boxed regions. Scale bars: 5 μm (full cell) and 2 μm (inset). (B) ECAR (± SD) in 25 mM glucose without serum upon 100 µM CK666, 1 µM CCCP or 1 µM CCCP + 100 µM CK666 addition at 45 min, then 50 mM 2-deoxyglucose (2-DG) at 223 min. n = 4 individual well measurements per condition. Pink arrow indicates drug treatment and blue arrow indicates 2-DG treatment. (C) ECAR (± SD) in 25 mM glucose without serum upon DMSO, 2.5 µM antimycin A or 2.5 µM antimycin A + 100 µM CK666 addition at 45 min, then 50 mM 2-DG at 223 min. n = 4 individual well measurements per condition. Pink arrow indicates drug treatment and blue arrow indicates 2-DG treatment. (D) ECAR (± SD) in 25 mM glucose without serum upon DMSO, 5 µM rotenone or 5 µM rotenone + 100 µM CK666 addition at 45 min, then 50 mM 2-DG at 223 min. n = 4 individual well measurements per condition. Pink arrow indicates drug treatment, and blue arrow indicates 2-DG treatment. (E) OCR (± SD) in 2 mM glucose without serum upon 100 µM CK666, 1 µM CCCP or 1 µM CCCP + 100 µM CK666 addition at 45 min, then 50 mM 2-DG at 223 min. n = 4 individual well measurements per condition. Pink arrow indicates drug treatment and blue arrow indicates 2-DG treatment. (F) OCR (± SD) in 2 mM glucose without serum upon DMSO, 2.5 µM antimycin A or 2.5 µM antimycin A + 100 µM CK666 addition at 45 min, then 50 mM 2-DG at 223 min. n = 4 individual well measurements per condition. Pink arrow indicates drug treatment and blue arrow indicates 2-DG treatment. (G) OCR (± SD) in 2 mM glucose without serum upon DMSO, 5 µM rotenone or 5 µM rotenone + 100 µM CK666 addition at 45 min, then 50 mM 2-DG at 223 min. n = 4 individual well measurements per condition. Pink arrow indicates drug treatment and blue arrow indicates 2-DG treatment. Number of experiments and sample sizes are provided in Table S1.
We then tested the effect of CK666 on glycolysis in Teff cells, using ECAR as a readout. At both 2 and 25 mM glucose, ECAR is stimulated by CCCP, antimycin, and rotenone (Fig. 5, C–E; and Fig. S11, B–D). Interestingly, the ECAR response to antimycin or rotenone treatment is rapid in Teff cells, in contrast to the slow response in MEFs. At 2 mM glucose, CK666 significantly inhibits the ECAR increase stimulated by all three treatments (Fig. 5, C–E), while the effects on OCR are unchanged (Fig. S11, E–G). At 25 mM glucose, simultaneous CK666 treatment reduces this ECAR increase slightly in all cases (Fig. S11, B–D).
T cells often encounter a hypoxic environment in solid tumors and can be out-competed by highly glycolytic cancer cells under these conditions (Chang et al., 2015; Ho et al., 2015). We therefore tested the effect of hypoxia on glycolysis in Teff cells, using lactate production as a readout. At 2, 5, and 25 mM glucose, CK666 inhibits lactate production 2.32-, 1.75-, and 1.33-fold, respectively, under hypoxic conditions (Fig. 5 F; and Fig. S12, A and B, 6-h timepoints). These results show that Arp2/3 complex-mediated actin polymerization stimulates glycolysis in Teff cells upon treatments that compromise mitochondrial function, with the effect being more pronounced at lower glucose concentration.
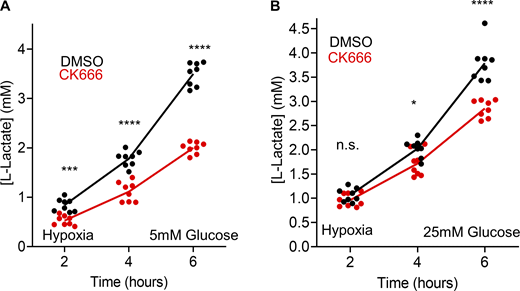
Effect of CK666 on hypoxia-induced lactate production in Teff. (A) Lactate production induced by hypoxia (1% oxygen) in Teff in the presence or absence of 100 µM CK666 addition (5 mM glucose without serum). Circles indicate individual well measurements starting with 400,000 cells/well. n = 8 individual well measurements from four independent experiments. *** P = 0.0003; **** P < 0.0001. Statistical significance was calculated by two-way ANOVA using Tukey’s multiple comparisons test. (B) Lactate production induced by hypoxia (1% oxygen) in Teff cells in the presence or absence of 100 µM CK666 addition (25 mM glucose without serum). Circles indicate individual well measurements starting with 400,000 cells/well. n = 8 individual well measurements from four independent experiments. n.s. P > 0.05; * P = 0.0136; **** P < 0.0001. Statistical significance was calculated by two-way ANOVA using Tukey’s multiple comparisons test. Number of experiments, statistical tests, and sample sizes are provided in Table S1.

Effect of CK666 on hypoxia-induced lactate production in Teff. (A) Lactate production induced by hypoxia (1% oxygen) in Teff in the presence or absence of 100 µM CK666 addition (5 mM glucose without serum). Circles indicate individual well measurements starting with 400,000 cells/well. n = 8 individual well measurements from four independent experiments. *** P = 0.0003; **** P < 0.0001. Statistical significance was calculated by two-way ANOVA using Tukey’s multiple comparisons test. (B) Lactate production induced by hypoxia (1% oxygen) in Teff cells in the presence or absence of 100 µM CK666 addition (25 mM glucose without serum). Circles indicate individual well measurements starting with 400,000 cells/well. n = 8 individual well measurements from four independent experiments. n.s. P > 0.05; * P = 0.0136; **** P < 0.0001. Statistical significance was calculated by two-way ANOVA using Tukey’s multiple comparisons test. Number of experiments, statistical tests, and sample sizes are provided in Table S1.
Overall, our study raises a number of intriguing questions. The mechanism by which mitochondrial dysfunction induces ADA is one such question. In response to CCCP, actin accumulates within 1 min and peaks by 4 min in multiple cell types. In more chronic mitochondrial dysfunction (EtBr treatment, NDUFS4 KO, Leigh Syndrome cells), the perimitochondrial filaments are eliminated within 5 min of Arp2/3 complex inhibition, suggesting that this is not a pool of stably polymerized actin but is constantly turning over. We have previously shown that CCCP-induced ADA requires two parallel signaling pathways, one induced by increased cytoplasmic calcium, which activates Arp2/3 complex, and the other through AMPK activation, which activates the FMNL family of formins (Fung et al., 2022). One possibility is that mitochondrial depolarization is the initiating stimulus of these events. However, we show here that ADA-inducing stimuli have a range of effects on mitochondrial polarization, including oligomycin, which causes slight hyperpolarization. Our current data might suggest that a decrease in mitochondrial ATP production capacity is a key signal. However, even those stimuli that cause low changes in overall cytoplasmic ATP levels, such as oligomycin, cause significant and rapid AMPK activation. These results might either suggest an ability to detect ATP locally around mitochondria or that other signals are responsible.
Another question concerns whether the mitochondrially associated actin filaments are the cause of the glycolytic increase. While Arp2/3 complex mediates many actin-dependent cellular processes (Chakrabarti et al., 2021; Gautreau et al., 2021), three items suggest that mitochondrially associated actin specifically contributes to glycolytic activation. First, inhibition of the mitochondrial sodium-calcium antiporter NCLX by CGP37157 inhibits the glycolytic increase caused by either CCCP or oligomycin stimulation. We have previously shown that NCLX mediates an important initial step in the ADA activation pathway (Fung et al., 2022). Second, the effects of both NCLX and Arp2/3 complex inhibition (by CGP37157 or CK666) on glycolysis occur within 4 min, because simultaneous addition of these compounds with CCCP inhibits the CCCP-induced ECAR increase at the first time point measured. While effects on other Arp2/3 complex-dependent processes on this timescale are certainly possible, it is more likely to us that the inhibition of ADA de novo is the relevant event. Third, there is a strong inhibitory effect of CK666 on glycolytic activation by mitochondrial inhibitors in Teffs, which have a limited number of existing actin-based structures. However, a role for other Arp2/3 complex-dependent actin processes in rapid glycolytic activation cannot be ruled out.
A third question concerns the target linking Arp2/3 complex-mediated actin polymerization to the glycolytic increase. A number of links between glycolysis and actin have previously been made. One study showed that aldolase was inhibited by an interaction with actin and that insulin stimulation caused actin depolymerization and aldolase activation (Hu et al., 2016). Intriguingly, this insulin-stimulated aldolase activation was inhibited by CK666, suggesting a more complicated mechanism than simply actin depolymerization. Whether this insulin-mediated glycolytic activation is related to the effects we observe is unclear, considering the different time courses of the responses (minutes for ADA vs. hours for the insulin effect). Another glycolytic enzyme that might be regulated by ADA is phosphofructokinase (PFK), whose degradation has recently been shown to be regulated by the E3 ubiquitin ligase TRIM21, itself being activated upon release from stress fibers (Park et al., 2020). Again, it is not clear that the effects reported here follow this mechanism, both in terms of speed of response and the fact that stress fibers are fundamentally different from Arp2/3 complex-dependent structures (Blanchoin et al., 2014). In budding yeast, a number of glycolytic enzymes appear to bind and be activated by actin (Espinoza-Simón et al., 2020), but links with Arp2/3 complex-mediated actin have not been made.
An intriguing feature is that the effect of ADA on glycolysis is particularly important at lower glucose concentrations. While normal blood glucose ranges from 4 to 6 mM, lower glucose concentrations are common in peripheral tissues. In particular, neuronal cells experience steady-state glucose levels of 2.4 mM, which rapidly drop to below 1 mM during ischemia (Silver and Erecińska, 1994). The tumor microenvironment also can experience extracellular glucose levels below 1 mM, and competition for glucose between cancer cells and tumoricidal Teff cells compromises anti-tumor effects (Chang et al., 2015; Ho et al., 2015). Rapid cellular proliferation and poor vascular supply also lead to hypoxia in tumors, compromising mitochondrial function. Induction of ADA in infiltrating T cells might be therefore crucial in maintaining T cell viability and anti-tumor immunity.
Glycolytic activation is one of at least two functions of ADA. We have previously shown that ADA inhibits the mitochondrial re-organization that occurs within 30 min of depolarization (Fung et al., 2022; Fung et al., 2019). This re-organization involves a circularization of the mitochondrion, rather than mitochondrial division (De Vos et al., 2005; Minamikawa et al., 1999; Miyazono et al., 2018). We showed that circularization depends upon the IMM protease Oma1 (Fung et al., 2022; Fung et al., 2019), one of whose substrates is Opa1 (MacVicar and Langer, 2016). ADA inhibition enhances Opa1 processing as well as circularization (Fung et al., 2022; Fung et al., 2019), suggesting that ADA might exert some form of regulatory control over Oma1. The purpose of these shape changes is unclear but may be a prelude to mitophagy. ADA might therefore serve as a temporary brake on responses to mitochondrial damage, increasing glycolytic rate to maintain ATP levels and delaying the mitophagic response. It is not clear whether the mitochondrial circularization we observe upon EtBr treatment represents a similar process to the rapid circularization induced by mitochondrial depolarization.
The exact organization of the actin filaments induced during ADA is unclear, but they are likely to be bundles of filaments or tightly packed networks. The fact that Arp2/3 complex is required for ADA suggests that a dendritic network is present (Gautreau et al., 2021). Similar Arp2/3 complex-dependent actin structures, termed actin “clouds,” have been observed around mitochondria in mitotic (Moore et al., 2021) and interphase cells (Moore et al., 2016) in the absence of treatment with mitochondrial-compromising drugs. These actin clouds cycle in waves around the cell, making a full rotation within 15 min. The ADA response, however, appears to differ from actin clouds, in that it is not inhibited by N-WASP KO (Fung et al., 2022). In contrast, we have previously shown ADA to be dependent on the WAVE family of Arp2/3 complex activators (Fung et al., 2022), while WAVE1 knockdown does not inhibit mitotic actin clouds (Moore et al., 2021). It is possible, though, that ADA and actin clouds have overlapping functions, and it would be interesting to determine whether actin clouds induce increased glycolysis.
Another type of recently identified mitochondrial actin structure is termed as actin “tails,” which develop from actin clouds during mitosis and increase mitochondrial motility, to favor homogenous distribution of mitochondria between daughter cells (Moore et al., 2021). ADA differs from actin tails in that it does not extend to micron lengths from the mitochondrion. In addition, we have not observed an increase in mitochondrial motility during ADA. In fact, we have previously shown that ADA suppresses mitochondrial dynamics (Fung et al., 2019).
Finally, ADA is not the only Arp2/3 complex-dependent process in which actin polymerizes around damaged mitochondria. A second phase of actin polymerization occurs 1–2 h after damage, which appears to function in the mitophagic process (Hsieh and Yang, 2019; Kruppa et al., 2018). In addition, we have previously mentioned in this discussion that the Arp2/3 complex-dependent mitochondrial actin polymerization is identified around apparently undamaged mitochondria at interphase (Moore et al., 2016) and during mitosis (Li et al., 2015; Moore et al., 2021), which possess a number of differences to ADA. Our conclusion at present is that multiple mechanisms for Arp2/3 complex-mediated actin polymerization around mitochondria exist, activated by distinct mechanisms for distinct purposes. One purpose of ADA is to promote rapid glycolytic upregulation in the face of mitochondrial dysfunction to maintain cellular ATP levels.
Materials and methods
Cell culture
Wild-type human osteosarcoma U2-OS and human cervical cancer HeLa cells were procured from American Type Culture Collection (ATCC) and grown in DMEM (10-013-CV; Corning) supplemented with 10% newborn calf serum (SH30118.03; NCS; Hyclone) for U2-OS or 10% fetal bovine serum (F4135; FBS; Sigma-Aldrich) for HeLa. Primate Cercopithecus aethiops Cos-7 cells were procured from ATCC (CRL-1651) and grown in DMEM with 10% FBS. Wild-type MEFs were a gift from David Chan (Losón et al., 2013), while NDUFS4 KO MEFs were a gift from Yasemin Sancak (University of Washington, Seattle). MEFs were grown in DMEM with 10% FBS. Cell lines are cultivated at 37°C with 5% CO2 and were tested every 3 mo for mycoplasma contamination using a Universal Mycoplasma Detection kit (30–1012K; ATCC) or a MycoAlert Plus Mycoplasma Detection kit (LT07-701; Lonza). Cell lines were used no more than 30 passages.
Mice and CD8+ T cells
Female wild-type C57BL/6NCrl mice were obtained from Charles River Laboratories. Mouse CD8+ T cells were isolated from the mouse spleens using EasySep Mouse CD8+ T Cell Isolation Kit (19853A; STEMCELL Technologies) according to manufacturer instructions. Isolated CD8+ T cells were stimulated for 2 d in 24-well culture plates coated overnight with 10 μg/ml anti-CD3 antibody (clone 145-2C11, mouse, BioXCell, BE0001-1) and 5 μg/ml soluble anti-CD28 (clone 37.51, mouse, BioXCell, BE0015-1) antibody with 25 U/ml recombinant human IL-2 (National Cancer Institute) in the medium. RPMI 1640 with L-Glutamine (10-040-CV; Corning) supplemented with 10% FBS (SH30541.03; HyClone), 10 mM HEPES (25-060-Cl; Corning Cellgro), 1× non-essential amino acids (25-025-Cl; Corning Cellgro), 1 mM sodium pyruvate (25-000-Cl; Corning Cellgro), and 44 μM 2-Mercaptoethanol (03446I-100; Fisher Scientific) was used for T cell stimulation and culture until the cells were harvested for experiments.
EtBr treatment of MEFs
This treatment followed published protocols showing mtDNA depletion (Fernández-Moreno et al., 2016). 2 × 10⁴ MEFs were plated directly onto Mat-tek imaging dishes and incubated in DMEM + 10% FBS overnight. 24 h later, overnight media was replaced with either EtBr-containing media (DMEM + 10% FBS + 0.2 μg/ml EtBr + 50 μg/ml uridine) or control media (DMEM + 10% FBS + 50 μg/ml uridine). At designated times, cells were stained with TMRE to record mitochondrial membrane potential, following which they were fixed and stained for actin (TRITC-phalloidin), mitochondria (Tom-20), and nuclear DNA (DAPI).
Human control and Leigh syndrome fibroblasts
All the culture cell materials from study subjects were collected with informed consent of the parents or the patient, following the recommendation from the Helsinki University Hospital ethical review board. The control cell lines originate from subjects eventually deemed not to manifest a mitochondrial disease.
The fibroblast cultures, previously immortalized by retroviral transduction of E6/E7 proteins of human papilloma virus, were cultivated at 37°C with 5% CO2 in DMEM (Dulbecco’s Modified Eagle’s Medium; Cat. #BE12-614F; Lonza) with 10% fetal bovine serum albumin (Cat. #11550356; Gibco), 1 × GlutaMAX Supplement (Cat. #35050061; Gibco) 50 mg/l uridine (Cat. #6680; Calbiochem), and 50 U/ml penicillin/streptomycin antibody (Cat. #15070063; Gibco) with media change in 3-d intervals. Cells were passaged after reaching 80% confluency by washing with PBS (Dulbecco’s Phosphate Buffered Saline; Cat. #D8537-6X500 ML; Sigma-Aldrich) and incubating in 1 × trypsin-EDTA (Cat. #15400-054; Gibco) in 37°C for 3 min prior to re-plating on two fresh 10-cm dishes. Cell lines were used no more than 30 passages.
DNA transfections and plasmids
For plasmid transfections, cells were seeded at 4 × 10⁵ cells per well in a 35-mm dish at ∼16 h before transfection. Transfections were performed in OPTI-MEM medium (31985062; Gibco) using lipofectamine 2000 (11668; Invitrogen) as per manufacturer’s protocol, followed by trypsinization and re-plating onto glass-bottomed dishes (P35G-1.5-14-C; MatTek Corporation) at ∼1 × 10⁵ cells per well. Cells were imaged ∼16–24 h after transfection.
GFP-F-tractin plasmids were gifts from C. Waterman and A. Pasapera (National Institutes of Health, Bethesda, MD) and were on a GFP-N1 backbone (Clonetech; Johnson and Schell, 2009). Mito-DsRed construct consists of amino acids 1–22 of S. cerevisiae COX4 N terminal to the respective fusion protein (Korobova et al., 2014). ATP FRET sensor GoATeam1 was a gift from Hiromi Imamura (Kyoto University, Kyoto, Japan; Imamura et al., 2009). The following amounts of DNA were transfected per well (individually or combined for co-transfection): 500 ng for Mito–DsRed, GFP–F-tractin, and GoATeam1.
Immunofluorescence
For all cell types and conditions, cells were fixed with 1% glutaraldehyde (Electron Microscopy Sciences, 16020) for 10 min and subsequently washed three times with sodium borohydride (Fisher Chemical, S678; 1 mg/ml, 15 min interval) and then permeabilized with 0.25% Triton X-100 for 10 min. After permeabilization, they were washed thrice again with PBS and incubated in blocking buffer (10% NCS in PBS) for 30 min. The cells were then incubated with anti-Tom20 (ab78547 1:500; Abcam) antibody prepared in 0.1% blocking solution for 90 min. Following PBS washes, the cells were incubated with secondary antibody against Tom20 (Alexa Fluor 488-coupled anti-rabbit; #A11037; 1:200; Invitrogen) mixed with TRITC-phalloidin (P1951 1:400; Sigma-Aldrich), 1× DAPI (D9542; Sigma-Aldrich), and incubated for 60 min. The cells were then washed with PBS, resuspended in 2 ml PBS, and imaged on the same or following day.
Drug treatment
For drug treatments with MEFs, cells were seeded onto Mat-tek dishes at 200,000 cells/well and incubated at 37°C incubator overnight. Cells were fixed after 3 min treatment with 20 μM CCCP, 20 μM CCCP + 100 μM CK666 simultaneously, 25 μM antimycin A, 25 μM antimycin A + 100 μM CK666 simultaneously, 50 μM rotenone, and 50 μM rotenone + 100 μM CK666 simultaneously in serum-containing culture DMEM. For oligomycin treatments, cells were fixed after 5 min treatment with 1.5 μM oligomycin or 1.5 μM oligomycin + 100 μM CK666 simultaneously in serum-free 2 mM glucose DMEM. For EtBr and NDUFS4 KO MEFs, cells were treated with 100 μM CK666 for 10 min before fixation with glutaraldehyde. For human fibroblasts, cells were seeded onto μ-slide 8 well (80826; ibidi) at 200,000 cells/well and incubated at 37°C incubator overnight. Cells were fixed without treatment to identify actin structures around mitochondria.
For drug treatments with effector T cells (Teff), cells were seeded onto Mat-tek dishes at 200,000 cells/well in serum-free (low glucose) DMEM medium (Agilent Seahorse XF DMEM; 103575-100) supplemented with 4 mM L-glutamine, 1 mM sodium pyruvate with 2 mM D-glucose and allowed to adhere for 1 h. Cells were fixed after 3 min treatment with 1 μM CCCP, 1 μM CCCP + 100 μM CK666 simultaneously; or 5 min treatment with 2.5 μM antimycin A, 2.5 μM antimycin A + 100 μM CK666 simultaneously, 5 μM rotenone, 5 μM rotenone + 100 μM CK666 simultaneously. A control for no treatment was also performed.
Hypoxia
For hypoxia treatments, WT-MEF cells were seeded onto Mat-tek dishes at 200,000 cells/well and incubated at 37°C incubator overnight. Serum-free DMEM medium was placed in the hypoxia chamber (InvivO2; BAKER; 94% N2, 5% CO2, 1% O2 at 37°C) overnight for equilibration. The following day, the Mat-tek dishes were washed twice with pre-warmed serum-free DMEM. 2 ml of pre-equilibrated serum-free DMEM (with DMSO, or CK666) were added to respective plates and quickly placed in the hypoxia chamber. 30 min later, the cells were fixed with glutaraldehyde and washed three times with PBS in the chamber before being taken out on the bench for downstream processing.
For effector T cells in hypoxia, serum-free (low glucose) DMEM (A1443001; Gibco) with 2 mM D-glucose, 4 mM L-glutamine, and 1 mM sodium pyruvate was placed in the hypoxia chamber for equilibration overnight. The following day, cells were seeded onto a poly-D-lysine-coated 8-well chamber slide (80821; Ibidi) at 500,000 cells/well in low glucose and allowed to adhere in normoxia condition at 37°C for 1 h. Next, the slide was brought into the hypoxia chamber and the pre-existing medium was substituted for the hypoxic medium containing either 100 μM CK666 or DMSO. 1 h later, the cells were fixed with glutaraldehyde and washed thrice with PBS before they were taken out of the chamber for sodium borohydride washes and subsequent steps.
Antibodies and Western blotting
Anti-actin (mouse; mab1501R; Millipore) used at 1:1,000. Anti-phospho-AMPKα (Thr172; CST;#2535; clone 40H9; rabbit monoclonal) was used at 1:1,000. Li-COR secondary antibodies used were: anti-rabbit IRDye 800CW (#926-32211; 1:15,000; goat) and anti-mouse IRDye 680RD (#926-68070; 1:15,000; goat). For probing protein levels and AMPK phosphorylation in cell extracts, cells from a 35-mm dish were trypsinized, centrifuged at 300 g for 5 min, and resuspended in 400 μl of 1× DB (50 mM Tris-HCl, pH 6.8, 2 mM EDTA, 20% glycerol, 0.8% SDS, 0.02% 784 Bromophenol Blue, 1 M NaCl, 4 M urea). Proteins were then separated by 10% SDS-PAGE in a Bio-Rad mini-gel system (7 × 8.4 cm) and transferred onto polyvinylidene fluoride membrane (IPFL00010; EMD Millipore). The membrane was blocked with TBS-T (20 mM Tris-HCl, pH 7.6, 136 mM NaCl, 0.1% Tween-20) containing 3% BSA (VWR Life Science, VWRV0332) for 1 h, then incubated with primary antibody solution at 4°C overnight. After washing with TBS-T, the membrane was incubated with fluorescently tagged Li-COR antibody for 1 h at 23°C. Signals were detected by Li-COR fluorescent imager.
Microscopy
Both fixed and live sample dishes were imaged using the Dragonfly 302 spinning disk confocal (Andor Technology) on a Nikon Ti-E base and equipped with an iXon Ultra 888 EMCCD camera, a Zyla 4.2 M pixels CMOS camera, and a Tokai Hit stage-top incubator set at 37°C. A solid-state 405 smart diode 100 mW laser, solid-state 560 OPSL smart laser 50 mW laser, and solid-state 637 OPSL smart laser 140 mW laser were used for excitation. Objectives used were the CFI Plan Apochromat Lambda 100×/1.45 NA oil (MRD01905; Nikon) for all drug treatment in live-cell assays or fixed-cell assays. Images were acquired using Fusion software (Andor Technology, version 2.0.0.15). For live-cell imaging, cells co-transfected with Mito–DsRed and GFP–F-tractin were imaged in their respective cell culture medium: DMEM with 10% NCS for U2-OS or DMEM with 10% FBS for HeLa, Cos-7, and MEF cells. Medium was pre-equilibrated at 37°C and 5% CO2 before use, and the microscope stage was pre-heated and maintained at 37°C before and during image acquisition. For actin burst and TMRE quantifications, cells were imaged at a single confocal slice at the medial region, approximately 2 μm above the basal surface, to avoid stress fibers. For live-cell drug treatments, cells were treated with 20 μM CCCP, 20 μM CCCP + 100 μM CK666 simultaneously for media containing serum; or 1 μM CCCP, 1 μM CCCP + 100 μM CK666 simultaneously for media free of serum at the start of the fifth frame (∼1 min, with time interval set at 15 s) during imaging and continued for another 9 min. To observe TMRE changes in WT, uridine treated or EtBr MEFs, cells were loaded with 20 nM TMRE for 30 min in culture medium at 37°C and 5% CO2. After incubation, TMRE was washed off with fresh culture medium before imaging.
Image analysis and quantification
All image analysis was performed on ImageJ Fiji (version 1.51n, National Institutes of Health).
Immunofluorescence analysis
Cells with actin clouds were scored by visual analysis for the presence or absence of actin assembly in a given field and expressed as a percentage of the total number of cells for that field. Taking all the imaging fields into consideration for each condition, a bar graph showing the average percentage of cells, along with its respective error bars in SD or SEM, was plotted with Microsoft Excel. For human patient fibroblast dataset, imaging wells were blinded by P.W. Elonkirjo and imaged by R. Chakrabarti. Microscopy images from each well were subsequently combined and scrambled by R. Chakrabarti before given to T.S. Fung for analysis. Final quantification was unscrambled by R. Chakrabarti and then decoded by P.W. Elonkirjo.
% mitochondria displaying ADA
First, ROIs encompassing the entirety of the cell were chosen in a medial z-section. Next, the mitochondria channel was converted to 8-bit and processed into a binary image. The total number of mitochondria was counted using the Analyze Particles function in Fiji. Each individual mitochondrion identified was then visually assessed for ADA. The percentage of ADA-positive mitochondria was plotted as a scatter plot for each cell, with SD for the readings of 30 cells given.
Quantification from live-cell imaging
The ImageJ Fiji Time Series Analyzer (UCLA) plugin was used for analysis for live-cell imaging. Cells that shrunk during imaging or exhibited signs of phototoxicity such as blebbing or vacuolization were excluded from analysis (maximal amount 10% for any treatment).
ADA: Quantification methods for actin assembly after mitochondrial damage were performed on live-cell images (Fung et al., 2022; Fung et al., 2019). For each cell, one ROI was chosen which encompasses the entire area of ADA around mitochondria after drug addition. The fluorescence values for each time point (F) were normalized with the mean initial fluorescence before drug treatment (first four frames−F0) and plotted against time as F/F0. For DMSO control or cells that did not exhibit an actin burst, the ROI was selected as the bulk region of the cytoplasm containing mitochondria using the mito–DsRed channel.
TMRE: Mean TMRE fluorescence was calculated from the entire mitochondrial area for each individual cell. TMRE fluorescence values for each time point (F) were normalized with the mean initial fluorescence before drug treatment (first four frames−F0) and plotted against time as F/F0.
Cytoplasmic ATP changes using GO-ATeam1 biosensor
Go-Ateam1 plasmid (kindly provided by Hiromi Imamura, Kyoto University, Kyoto, Japan) was transfected into MEF cells using Lipofectamine 2000. The cells were then seeded onto Mat-tek dishes and imaged by spinning disk confocal microscopy. To acquire GFP and FRET signals, live cells were excited using a 488 nm laser and signals collected using a 525-50 nm band pass filter (GFP) and 600-50 nm band pass filter (OFP/FRET). Cells were imaged at a medial focal plane (i.e., not in the basal region of the cell) for 1 min at 15 s intervals to establish baseline fluorescence, then perfused with indicated drugs and continuously imaged for another 9 min. Mean fluorescence for GFP and OFP(FRET) channels, as well as OFP/GFP ratio, for a particular ROI (square of 50 µm2) from each cell (near the nucleus) were calculated for all time points using ImageJ. Ratios of each time point after drug treatment (F) were normalized with the mean initial ratio (first 5 frames before drug treatment; F0) and plotted against time as F/F0. For oligomycin-treated samples, data points were normalized to DMSO control curve.
L-Lactate assay from extracellular medium
An assay kit based on the NADH-coupled reduction of tetrazolium salt to formazan (BMR service, University of Buffalo, SUNY, A-108) was used to measure the amount of L-lactate in the extracellular medium.
Drug treatment
For MEFs (wild type, uridine treated, NDUFS4 KO or EtBr) given drug treatments, cells were seeded at 75,000 cells per well in a 96-well plate and allowed to adhere overnight in culture medium. The following day, overnight medium was removed and cells were washed and equilibrated for 1 h with either (1) high glucose medium – DMEM (A1443001; Gibco) with 25 mM D-glucose, 4 mM L-glutamine, supplemented with no serum or (2) low glucose medium – DMEM (A1443001; Gibco) with 2 mM D-glucose, 4 mM L-glutamine, supplemented with no serum. Next, cells were treated with 1 μM CCCP; 1 μM CCCP + 100 μM CK666; 2.5 μM AA; 2.5 μM AA + 100 μM CK666; 5 μM Rotenone; 5 μM Rotenone + 100 μM CK666 for wild-type cells. 100 μM CK666 versus volume equivalent DMSO was used for wild-type, NDUFS4 KO, uridine-treated, and EtBr cells. Cell culture medium was withdrawn at various timepoints (1–6 h) and deproteinized in PEG solution. Samples were assayed with the L-lactate kit according to the manufacturer’s instructions, and OD 492 nm was measured using a microplate reader (TECAN infinite M1000). A standard curve ranging from 0 to 1 mM L-lactate was plotted for each experiment.
Hypoxia
For hypoxia experiments, MEFs were plated at 100,000 cells per well in a 96-well plate and allowed to adhere overnight at 37°C and 5% CO2 normoxia conditions while an aliquot of high/low glucose medium was placed inside the 1% O2 hypoxia chamber for oxygen depletion overnight. The following day, cells were brought into the hypoxia chamber, their pre-existing medium removed and treated with 100 μM CK666 or DMSO containing hypoxic high/low glucose medium. Samples were taken at various timepoints (1–6 h), deproteinized and assayed for L-lactate concentration.
For Teff in hypoxic conditions, 400,000 cells were seeded per well in a poly-D-lysine treated 96-well plate and allowed to adhere and equilibrate for 1 h at 37°C and 5% CO2 normoxia in high/low glucose medium (with additional 1 mM sodium pyruvate) before being brought inside the hypoxia chamber. Cells were then treated with either CK666 or DMSO containing hypoxic high/low glucose medium. An additional condition with 5 mM D-glucose was also performed for Teff.
ATP assays from cell extracts
A luciferase-based assay was used (BMR service, University of Buffalo, SUNY, A-125). MEFs were plated at 1 × 10⁶ cells per well in 60-mm cell culture dishes and incubated for 2 d in standard medium (Corning DMEM containing 25 mM glucose, 10% FBS), resulting in 5.75 × 10⁶ cells/dish for MEFs. On the day of extraction, cells were washed and incubated for 1 h in Agilent Seahorse XF DMEM (103575-100, with 4 mM L-glutamine, no sodium pyruvate or serum) supplemented with 25 mM glucose (high glucose condition) or 1 mM glucose (low glucose condition) before treatment with: DMSO, 1 μM CCCP; 100 μM CK666 + 1 μM CCCP; or 100 μM CK666 for 2 min. Cells were lysed immediately with 10% TCA and washed 3 times with 1:1 ether pre-saturated in TE (10 mM Tris-HCl and 1 mM EDTA, pH 8) for sample deproteinization. Samples were diluted eightfold in water and ATP assay then assays conducted followed manufacturer’s instructions. The luminescence intensity was measured in a microplate reader (BioTek Synergy Neo2). A standard curve with ATP standards ranging from 0 to 10 μM was plotted for every experiment. The μM value of ATP determined in each assay was converted to a mM cellular value using the cell number stated above and an estimated cellular volume of 6 pl, obtained for Cos-7 cells (Valm et al., 2017).
Seahorse assay
A Seahorse XFe96 Bioanalyser (Agilent) was used to determine oxygen consumption rate (OCR) and extracellular acidification rate (ECAR) for MEFs and activated CD8+ cells. MEFs, taken from a T75 flask at 70–80% confluency and in culture for three days, were plated at 40,000 per well onto an Agilent XF microplate (101085-004) in DMEM (10-013-CV; Corning) + 10% FBS medium, 24 h before the experiment. Medium was changed 1-h before the start of readout into 180 μl serum-free assay medium (103575-100; Agilent Seahorse XF DMEM) supplemented with 4 mM L-glutamine (25-005-CI; Corning) and a variable amount of glucose (103577-100; Agilent). The reading and injection regime was as follows: (1) Baseline OCR and ECAR were measured for 15 min (6 measurements); (2) injection of CCCP (1 μM final), CK666 (100 μM final), or CK666 + CCCP; (3) measuring for 38 min (15 measurements); (4) injection of 50 mM final 2-DG (Sigma Aldrich; D3179); and (5) measuring for 18 min (7 measurements). Measurement parameters were 30 s mix, 0 wait, and 2 min measure. For each experiment, three wells were done for CCCP or CK666 alone and four wells for CCCP + CK666. Stock concentrations: 10 mM CCCP (in DMSO), 20 mM CK666 (in DMSO), 500 mM 2-DG (in glucose-free medium). CCCP and CK666 were diluted to 10× stocks in the appropriate medium and 20 ml injected (final DMSO concentration 0.5%). 22 ml 2-DG injected. “ΔECAR initial” represents the difference between the first measurement after the first injection and the last measurement before the injection, which represents a time span of ∼2.5 min post-injection. “ΔECAR 40 min” represent the difference between the last measurement after the first injection and the last measurement before the first injection, which represents a time span of ∼38-min post-injection.
For MEF treated with rotenone (R8875; Sigma-Aldrich) and antimycin A (A8674; Sigma-Aldrich), the reading and injection regime was as follows: (1) Baseline OCR and ECAR were measured for 30 min (12 measurements); (2) injection of antimycin A (2.5 μM final), CK666 (100 μM final), or CK666 + antimycin A, rotenone (5 μM final), or CK666 + rotenone or DMSO (volume equivalent to CK666); (3) measuring for 3 h 22 min (45 measurements); (4) injection of 50 mM final 2-DG; (5) measuring for 30 min (12 measurements). Measurement parameters: 30 s mix, 0 wait, and 2 min measure for baseline and 2-DG treatments, 30 s mix, 0 wait, and 4 min measure for drug treatment. For each experiment, at least three wells were done for each condition. Stock concentrations for antimycin A and rotenone: 10 mM (in ethanol) and 10 mM (in DMSO), respectively.
For MEF treated with oligomycin (75351; Sigma-Aldrich) and CGP-37157 (CGP, C8874; Sigma-Aldrich), the reading and injection regime was as follows: (1) Baseline OCR and ECAR were measured for 24 min (6 measurements); (2) injection of oligomycin (1.5 μM final), CK666 (100 μM final), or CK666 + oligomycin, CGP (80 μM final), CGP + oligomycin, CCCP (1 μM final), CK666 + CCCP, CGP + CCCP or DMSO (volume equivalent to oligomycin); (3) measuring for 1 h 15 min (15 measurements); (4) injection of 50 mM final 2-DG; (5) measuring for 24 min (6 measurements). Measurement parameters: 2 min mix, 0 wait, and 2 min measure for baseline, drug, and 2-DG treatments. For each experiment, at least three wells were done for each condition. Stock concentrations for oligomycin and CGP were 10 mM (in DMSO), respectively.
For Teff, 150,000 cells (activated with anti-CD3 and anti-CD28 antibodies 48 h prior) were plated into individual wells of a poly-D-lysine-coated seahorse cell culture microplate (101085-004; Agilent). T cell culture medium was changed 1 h before the start of readout into 180 μl serum-free assay medium (103575-100; Agilent Seahorse XF DMEM) supplemented with 4 mM L-glutamine, 1 mM sodium pyruvate and either 2 or 25 mM glucose. The reading and injection regime was as follows: (1) Baseline OCR and ECAR were measured for 42 min (12 measurements); (2) injection of various treatments, with the concentration same as MEFs: CCCP, CK666, CK666 + CCCP, antimycin A, CK666 + antimycin A, rotenone, CK666 + rotenone or DMSO (volume equivalent to CK666); (3) measuring for 2 h 38 min (45 measurements); (4) injection of 50 mM final 2-DG; and (5) measuring for 42 min (12 measurements). Measurement parameters were 30 s mix, 0 wait, and 3 min measure. For each experiment, at least three wells were done for each condition.
Statistical analysis and graph plotting software
All statistical analyses and P value determinations were conducted using GraphPad Prism QuickCalcs or GraphPad Prism 9 (version 9.2.0, GraphPad Software). For P values in multiple comparisons (two-tailed unpaired t test; one or two-way ANOVA), Tukey’s multiple comparisons test was performed in GraphPad Prism 9. Scatter plots for TMRE, L-lactate assays were plotted with GraphPad Prism 9. ECAR and OCR curves, along with the SD, and live-cell actin burst, along with the SEM were all plotted using Microsoft Excel for Office 365 (version 16.0.11231.20164, Microsoft Corporation). Exact P values, sample size N, and the number of independent experiments for each analysis are provided in Table S1. For all experiments, the data distribution was assumed to be normal, but this was not formally tested.
Online supplementary material
Fig. S1 (in support of Fig. 1) demonstrates that ADA in MEFs surrounds the majority of mitochondria. Fig. S2 (in support of Fig. 2) shows that oligomycin treatment assembles actin filaments around mitochondria. In addition, Fig. S2 shows that depolarizing mitochondria in low glucose conditions (1 mM glucose) generates a robust ADA response. Fig. S3 (in support of Fig. 3) shows that ATP levels are reduced after CCCP treatment and that the addition of CK666 exacerbates this effect in the presence of low glucose as opposed to high glucose conditions. Fig. S4 (in support of Fig. 3) shows that the ECAR response after mitochondrial damage is less sensitive to the addition of CK666 at high glucose conditions. Fig. S5 (in support of Fig. 3) shows that inhibiting ADA (by inhibiting NCLX) reduces the ECAR response after CCCP or oligomycin treatments at 2 mM glucose conditions. In addition, Fig. S5 also shows the OCR changes to mitochondrial damage in 2 mM glucose. Fig. S6 (in support of Fig. 3) shows that mitochondrial damage using CCCP or Complex I/III inhibitors increases extracellular lactate levels, which is inhibited by CK666 for 2 mM glucose. Fig. S6 also shows that lactate levels increase in both normoxia and hypoxia conditions at 2 and 25 mM glucose conditions. Fig. S7 (in support of Fig. 3) shows the changes in cytosolic ATP after oligomycin treatment in 2 and 25 mM glucose conditions. Also, Fig. S7 demonstrates an increase in activated AMPK after CCCP or ETC inhibitors at 2 mM glucose. Fig. S8 (in support of Fig. 4) displays the changes in actin, TMRE, and mitochondrial morphology after EtBr treatment over a 10-d period. Fig. S9 (in support of Fig. 4) shows that extracellular lactate levels decrease in EtBr-treatment MEFs and NDUFS4 KO MEFs after CK666 treatment. Fig. S10 (in support of Fig. 4) shows ADA in Leigh syndrome patients’ fibroblasts. Fig. S11 (in support of Fig. 5) shows the absence of ADA in Teff in the presence of CK666. In addition, Fig. S11 presents the ECAR changes for the 25 mM glucose condition and the OCR changes for the 2 mM glucose condition. Fig. S12 (in support of Fig. 5) shows the effect of CK666 in hypoxic Teff for 5 and 25 mM glucose conditions. Video 1 shows ADA in U2-OS cells by live-cell imaging after CCCP treatment. Video 2 shows ADA in HeLa cells by live-cell imaging after CCCP treatment. Video 3 shows ADA in Cos-7 cells by live-cell imaging after CCCP treatment. Video 4 shows ADA in MEF cells by live-cell imaging after CCCP treatment. Video 5 shows a zoomed-in view of ADA and mitochondria in U2-OS cells after CCCP treatment. Table S1 provides P values, sample size N, and the number of independent experiments for each analysis.
Acknowledgments
We thank R. Cramer for allowing us the use of the hypoxia chamber, T. Riggers for providing the stimulus, Z. Svindrych for his expertise in imaging, and N. Zaidi for help designing the Seahorse experiments. We thank J. Prudent (MRC Mitochondrial Biology Unit, University of Cambridge, UK), K. Rottner (Technische Universität Braunschweig, Germany), and Y. Sancak (University of Washington, Seattle, WA) for sending us key reagents quickly. We thank Dr P. Isohanni for help collecting human patient cell samples.
This work was funded by a support from National Institutes of Health (NIH) grant R35 GM122545 (H.N. Higgs, R. Chakrabarti, TS. Fung), NIH grant P20 GM113132 (H.N.Higgs, R. Chakrabarti, TS. Fung), NIH grant R01 AI155015 (E.J. Usherwood, T. Kang), and NIH grant R01 AI122854 (E.J. Usherwood, T. Kang). We thank the Academy of Finland and Sigrid Jusèlius Foundation (for A. Suomalainen) and Doctoral Program for Integrative Life Science (P.W. Elonkirjo) for funding support.
The authors declare no competing financial interests.
Author contributions: R. Chakrabarti, T.S. Fung, E.J. Usherwood, A. Suomalainen, and H.N. Higgs conceptualized the project and designed experiments. R. Chakrabarti and T.S. Fung performed imaging experiments, T. Kang prepared and isolated effector T cells. P.W. Elonkirjo prepared and isolated human patient Leigh syndrome fibroblasts and conducted treatments. R. Chakrabarti, T.S. Fung, and T. Kang performed seahorse experiments. R. Chakrabarti and T.S. Fung analyzed data. R. Chakrabarti, T.S. Fung, P.W. Elonkirjo, A. Suomalainen, and H.N. Higgs designed the figures. E.J. Usherwood, A. Suomalainen, P.W. Elonkirjo, and T. Kang provided critical feedback. R. Chakrabarti, T.S. Fung, and H.N. Higgs wrote the paper and all authors contributed to the methods and revisions.

