


Tissue microenvironments affect the functional states of cancer cells, but determining these influences in vivo has remained a challenge. We present a quantitative high-resolution imaging assay of single cancer cells in zebrafish xenografts to probe functional adaptation to variable cell-extrinsic cues and molecular interventions. Using cell morphology as a surrogate readout of cell functional states, we examine environmental influences on the morphotype distribution of Ewing Sarcoma, a pediatric cancer associated with the oncogene EWSR1-FLI1 and whose plasticity is thought to determine disease outcome through non-genomic mechanisms. Computer vision analysis reveals systematic shifts in the distribution of 3D morphotypes as a function of cell type and seeding site, as well as tissue-specific cellular organizations that recapitulate those observed in human tumors. Reduced expression of the EWSR1-FLI1 protein product causes a shift to more protrusive cells and decreased tissue specificity of the morphotype distribution. Overall, this work establishes a framework for a statistically robust study of cancer cell plasticity in diverse tissue microenvironments.
Introduction
The ability of cancer cells to arrive, survive, and thrive in diverse tissue microenvironments during metastasis is a testament to their plasticity. Despite a growing appreciation that environmental cues can drive cancer disease states, our understanding of whether and how cancer cells respond to extrinsic cues remains severely limited (Hanahan and Weinberg, 2011). A major obstacle lies in the difficulty of probing the adaptation of single cells to distinct microenvironments in an experimental system that allows for hypothesis-driven molecular interventions and observation of cell behaviors in situ.
Historically, cancer research has relied predominantly on the mouse for investigation of organotropic behaviors (Gomez-Cuadrado et al., 2017). Numerous of these studies have addressed cellular adaptation at the transcriptional level (Pastushenko et al., 2018; Aynaud et al., 2020; Marjanovic et al., 2020; Vegliante et al., 2022); however, for the task of examining plasticity in cell function, mouse models have several shortcomings. Cell functional responses are dynamic, and adaptation related to organotropism is super-imposed by a broad range of random cell-to-cell variation. Statistical distinction of these sources of cellular heterogeneity requires a large pool of single-cell measurements in the intact cellular microenvironment, which is challenging to accomplish in the mouse due to low throughput and long experimental timelines. Moreover, the mouse does not provide easy access to imaging intact tissues, limiting the diversity of microenvironments that can be studied. As an alternative, 2D and 3D cell cultures have been exploited for studying cancer cell heterogeneity (Katt et al., 2016; van Marion et al., 2016), but these systems lack the relevant micro-environmental complexity of an organism to shed light on the degree of functional adaptation and its driving mechanisms. Organoid models, which reconstitute some aspects of tissue architecture and functionality of human tissues (Lo et al., 2020), suffer from the same disadvantage. Moreover, conventional organoid cancer models are largely limited to tumors of epithelial origin, preventing the analysis of wider classes of cancers like sarcomas (Colella et al., 2018; Zanoni et al., 2020).
Human cancer cell xenografts in zebrafish are fast emerging models to study tumor biology (Fior et al., 2017; Asokan et al., 2020; Fazio et al., 2020; Xiao et al., 2020) as they provide a powerful practical compromise between the competing quests for environmental diversity, experimental access, and sufficient throughput to acquire meaningful descriptions of cancer cell adaptation (Konantz et al., 2012; Heilmann et al., 2015; van Marion et al., 2016; Osmani and Goetz, 2019): (1) Zebrafish larvae contain various complex tissue microenvironments, with tissue mechanics, physiology, and disease susceptibility that is highly conserved with those of humans (Ingham, 2009; Osmani and Goetz, 2019). (2) The optical transparency of zebrafish grants convenient experimental access to any seeding site by high-resolution imaging. (3) A single experimental session can yield data from numerous sites and xenografts, allowing statistically properly powered comparative studies; and (4) the relative ease of applicability of live imaging at various time scales enables the capture of dynamic processes that are very difficult to access in other host systems for human cancer samples.
This work utilizes human cancer xenografts in zebrafish as a model for unraveling mechanisms of cell adaptation during tumor progression in distinct microenvironments. As an initial readout of plastic cell behaviors, we focus on cell morphological variation. Cell morphology is the integrated response of cells to autonomous cues (Bakal et al., 2007; Keren et al., 2008; Yin et al., 2013; Sailem and Bakal, 2017; Driscoll et al., 2019; Calizo et al., 2020), mechanical and chemical interactions with the microenvironment (Lamouille et al., 2014; Kai et al., 2016; Woods et al., 2017), as well as a functional proxy for proliferation and cell death (Chen et al., 1997; Mills et al., 1998). Accordingly, pathologists have relied for decades on morphological patterns to stratify cancer disease states and to deliver specific diagnoses that guide treatment. With the recent development of machine learning, cell morphology is emerging as an increasingly quantitative correlate with specific molecular cell states (Rohban et al., 2017; Bera et al., 2019; Derynck and Weinberg, 2019; Driscoll et al., 2019; Wu et al., 2020; Zaritsky et al., 2021).
Studying cancer cell plasticity is of particular importance in pediatric cancers. While somatic variation, clonal heterogeneity, and selection are thought to drive the organotropism of several adult cancers (Mcgranahan and Swanton, 2017), many pediatric cancers exhibit low mutational burden beyond a single driver (Crompton et al., 2014; Grobner et al., 2018). This suggests that non-genetic mechanisms may dominate the process of cell adaptation. In this work, we focus on Ewing Sarcoma (EwS) as a pediatric cancer prototype. EwS is a common pediatric bone and soft tissue tumor, characterized by a chromosomal translocation fusing members of the FUS/EWSR1/TAF15 family to ETS transcription factors, the most common of which creates the EWSR1-FLI1 (EF1) fusion oncogene (Delattre et al., 1994; Grunewald et al., 2018). Previous attempts have yet to produce robust genetically modified mouse (Minas et al., 2017) or organoid (Kondo, 2020) models for EwS, in part due to its unknown cell of origin (Lin et al., 2011), making alternative strategies for the study of this disease particularly pertinent. As with most other pediatric sarcomas (Hernandez Tejada et al., 2020), presence of metastasis is by far the most prominent adverse prognostic factor in EwS (Grunewald et al., 2018). The specific tissue environment appears to contribute to the degree of malignancy in EwS (Cotterill et al., 2000; Miser et al., 2004; Ladenstein et al., 2010; Ye et al., 2019), as well as other pediatric sarcomas Kager et al., 2003; Merks et al., 2014). For example, pelvic primary tumors appear to correlate with poorer prognosis and are more prone to metastasis compared to other primary sites, and patients who have metastasis only to lung have improved survival compared to those with metastasis to bone or bone marrow (Cotterill et al., 2000). The differences at the level of cell behavior that drive such distinct pathologies have remained enigmatic.
To address this question, we have assembled a quantitative high-resolution imaging assay of EwS cell morphology in zebrafish xenografts to probe functional adaptation in response to diverse microenvironments and experimental molecular interventions. Applying in house-written computer vision pipelines to 3D cell shape analysis, we found systematic shifts in the distribution of cell morphological states, referred to as morphotypes, between seeding sites in the fish embryo, as well as between control expression and knockdown of EWSR1-FLI1 in an environmentally sensitive fashion. This approach also uncovered an architectural organization of EwS cells in certain microenvironments that is characteristic of a subset of human EwS tumors. Combined with live cell imaging, these results suggest that both cell-intrinsic and cell-extrinsic cues can trigger changes in EwS morphotype, and they illustrate the capacity of the established framework to capture a statistically robust definition of environment-associated cell states within overall very heterogeneous data.
Results
3D shape analysis captures functional heterogeneity in EwS cells
We present an experimental and analytical pipeline to identify morphotypes within tissues of zebrafish larvae (Fig. 1). By analysis of geometric features extracted from high-resolution 3D image volumes, we examined morphological heterogeneity as a function of cell type, oncogene expression level, and tissue microenvironment. Mixtures of cells tagged with either a red-emitting filamentous actin marker F-Tractin (90–99% of cell mixture) or a green-emitting F-Tractin (1–10% of cell mixture) were prepared for injection, enabling the visualization of individual cell boundaries within cellular clusters in situ. F-tractin was chosen empirically as it provides a robust outline of the cell contour compared to other fluorescent tags (Fig. S1 a).

3D cell shape analysis in cancer cell xenografts in zebrafish larvae. We present an experimental and analytical pipeline to identify single-cell morphologies within tissues of zebrafish larvae and identify differences in morphological cell states, referred to as morphotypes, by computer-vision analysis of 3D cell shape, as follows. (1) In order to distinguish morphotypes of individual cells, we prepared a mosaic cell mixture consisting of 90–99% of cells labeled with a green-emitting fluorophore and 1–10% of cells labeled with a red-emitting fluorophore, or vice versa. We then injected the cell mixture into the PVS or HBV of 2-d-old zebrafish larvae. For PVS injections, we selected specifically for injected larvae which also had xenografted cells in the CHT immediately following injection. Fish larvae were imaged live or fixed 24 h after injection using an ASLM, which is optimized for maximum throughput, resolution, and flexibility of sample orientation. High axial resolution is obtained by combining a thin, moving light-sheet with a synchronized rolling shutter (active pixels) that blocks out of focus fluorescence on the image plane on an sCMOS camera. (2) Individual cells were computationally extracted from the image data of sparsely labeled cells, and after image processing were segmented into 3D volumes. We then measured 12 global 3D geometric features as listed, and each cell was indexed according to fish, location, and cell type. (3) Using PCA we captured the heterogeneity of morphotypes (N = number of fish, n = number of cells). PC1 captured the protrusive state of the cell, while PC2 was influenced largely by volume. Insets show 3D renderings of segmented cell volumes indicated in the PC plot. We evaluated our analytical pipeline and used several visualization and classification techniques to capture differences among heterogeneous single-cell data. Scale bar, 20 µm.
3D cell shape analysis in cancer cell xenografts in zebrafish larvae. We present an experimental and analytical pipeline to identify single-cell morphologies within tissues of zebrafish larvae and identify differences in morphological cell states, referred to as morphotypes, by computer-vision analysis of 3D cell shape, as follows. (1) In order to distinguish morphotypes of individual cells, we prepared a mosaic cell mixture consisting of 90–99% of cells labeled with a green-emitting fluorophore and 1–10% of cells labeled with a red-emitting fluorophore, or vice versa. We then injected the cell mixture into the PVS or HBV of 2-d-old zebrafish larvae. For PVS injections, we selected specifically for injected larvae which also had xenografted cells in the CHT immediately following injection. Fish larvae were imaged live or fixed 24 h after injection using an ASLM, which is optimized for maximum throughput, resolution, and flexibility of sample orientation. High axial resolution is obtained by combining a thin, moving light-sheet with a synchronized rolling shutter (active pixels) that blocks out of focus fluorescence on the image plane on an sCMOS camera. (2) Individual cells were computationally extracted from the image data of sparsely labeled cells, and after image processing were segmented into 3D volumes. We then measured 12 global 3D geometric features as listed, and each cell was indexed according to fish, location, and cell type. (3) Using PCA we captured the heterogeneity of morphotypes (N = number of fish, n = number of cells). PC1 captured the protrusive state of the cell, while PC2 was influenced largely by volume. Insets show 3D renderings of segmented cell volumes indicated in the PC plot. We evaluated our analytical pipeline and used several visualization and classification techniques to capture differences among heterogeneous single-cell data. Scale bar, 20 µm.

Classification of morphotypes captures heterogeneity of cell states in EwS cells. (a) TC32 cell expressing F-Tractin-mRuby2 and cytoplasmic GFP. Note that F-Tractin better captures detailed features of the cell contour. Scale bar, 10 µm. (b) Sphericity single-cell level (n = 15, 22, 15; 19, 23, 18; 19, 41, 37; 18, 25, 28; 25, 26,19 for HBV/PVS/CHT of NIH-3T3, TC71, TC32, TC32 C shRNA, TC32 EF1 shRNA, respectively) or fish-level (n = 13, 11, 10; 12, 11, 12; 11, 16, 13; 10, 7, 4; 14, 12, 10 for HBV/PVS/CHT of NIH-3T3, TC71, TC32, TC32 C shRNA, TC32 EF1 shRNA, respectively) show similar distributions, with low fish-to-fish variability. Significant shifts between experimental groups already for a single feature at the fish level indicates that cell type, molecular condition, and seeding site play a role in the control of cell morphogenesis (ANOVA, P < 0.0001). (c) Violin plots (left) and similarity matrices displaying P values (right, Kruskal-Wallis test, post-hoc Dunn’s test) of two prominent individual features, sphericity (top) and volume (bottom). Individual features alone cannot capture the full heterogeneity of the dataset (n = 52, 60, 97, 71, 70 for NIH-3T3, TC71, TC32, TC32 C shRNA, TC32 EF1 shRNA, respectively). (d) Histogram of the relative contributions of PCs. The first two PCs capture 86% of the heterogeneity in the data and are used for further analysis. (e) A similarity matrix based on pairwise permutation tests of the Tukey median values of the first two PCs shows significantly different distributions between all experimental groups except TC32 and TC32 C shRNA. (f) A biplot displaying the relative contribution of each geometric feature to the first two PCs. All features appear to contribute to the first two PCs, with sphericity and volume strongly influencing PCs 1 and 2, respectively. (g) When excluding outlier group NIH-3T3, the PC space (top) and contribution of features (bottom) remain largely the same while the classes become shifted, suggesting the PCA for the 12 3D global features defined constitutes a robust space for the definition of morphotype classes.

Classification of morphotypes captures heterogeneity of cell states in EwS cells. (a) TC32 cell expressing F-Tractin-mRuby2 and cytoplasmic GFP. Note that F-Tractin better captures detailed features of the cell contour. Scale bar, 10 µm. (b) Sphericity single-cell level (n = 15, 22, 15; 19, 23, 18; 19, 41, 37; 18, 25, 28; 25, 26,19 for HBV/PVS/CHT of NIH-3T3, TC71, TC32, TC32 C shRNA, TC32 EF1 shRNA, respectively) or fish-level (n = 13, 11, 10; 12, 11, 12; 11, 16, 13; 10, 7, 4; 14, 12, 10 for HBV/PVS/CHT of NIH-3T3, TC71, TC32, TC32 C shRNA, TC32 EF1 shRNA, respectively) show similar distributions, with low fish-to-fish variability. Significant shifts between experimental groups already for a single feature at the fish level indicates that cell type, molecular condition, and seeding site play a role in the control of cell morphogenesis (ANOVA, P < 0.0001). (c) Violin plots (left) and similarity matrices displaying P values (right, Kruskal-Wallis test, post-hoc Dunn’s test) of two prominent individual features, sphericity (top) and volume (bottom). Individual features alone cannot capture the full heterogeneity of the dataset (n = 52, 60, 97, 71, 70 for NIH-3T3, TC71, TC32, TC32 C shRNA, TC32 EF1 shRNA, respectively). (d) Histogram of the relative contributions of PCs. The first two PCs capture 86% of the heterogeneity in the data and are used for further analysis. (e) A similarity matrix based on pairwise permutation tests of the Tukey median values of the first two PCs shows significantly different distributions between all experimental groups except TC32 and TC32 C shRNA. (f) A biplot displaying the relative contribution of each geometric feature to the first two PCs. All features appear to contribute to the first two PCs, with sphericity and volume strongly influencing PCs 1 and 2, respectively. (g) When excluding outlier group NIH-3T3, the PC space (top) and contribution of features (bottom) remain largely the same while the classes become shifted, suggesting the PCA for the 12 3D global features defined constitutes a robust space for the definition of morphotype classes.
Cell mixtures were injected into 2-d-old zebrafish larvae and visualized in one of three seeding sites: the hindbrain ventricle (HBV), perivitelline space (PVS), and, by rapid passive transport during injection, the caudal hematopoietic tissue (CHT). Each such site comprises a distinct microenvironment, enabling the study of environmentally driven functional cell adaptation. For example, the HBV are cavities that contain cerebrospinal fluid, rich in hormones, proteoglycans, and ions (Lowery and Sive, 2005; Chang et al., 2016; Fame et al., 2016), the PVS is a sandwiched, avascular region between two malleable membranes surrounding the yolk (Nicoli and Presta, 2007), and the CHT is a compact, thin region crowded with multiple cell types, including endothelial cells, stromal cell, and hematopoietic cells for which it serves as a stem cell niche (Murayama et al., 2006; Tamplin et al., 2015; Xue et al., 2017).
24 h following injection, chemically fixed zebrafish larvae were mounted in 1% low-melting agarose in fluorinated ethylene propylene tubes, which allowed for rotation of the sample to optimize the imaging conditions at the sites of interest (Kaufmann et al., 2012). Images within the three seeding sites were acquired using an axially swept light-sheet microscope (ASLM; Dean et al., 2015, 2016), a high-resolution modality of light-sheet fluorescence microscopy that offers near-isotropic resolution over large sampling volumes. For the presented study, we imaged ∼190 fish larvae. After semi-automated image processing to identify image sub-volumes containing cells suitable for shape analysis (see Materials and methods), we extracted the volumes of ∼640 individual cells using a tailored version of an automated segmentation pipeline developed previously (Driscoll et al., 2019). Each computationally defined surface was visually inspected to eliminate segmentation artifacts. The final dataset encompassed ∼350 validated cell volumes from ∼140 fish, enabling adequately powered statistical analysis. For each volume, we measured 12 geometric features (Fig. 1 and Table S1). To test for batch effects, we calculated the median values of each feature per fish (Fig. S1 b). While the geometric features at the cell level showed substantial variance, the variance of the features among fish was decreased, suggesting that batch effects across larvae are modest. Significant shifts between experimental groups, even for a single feature at the fish level, indicate that cell type, molecular condition, and seeding site play a role in the control of cell morphogenesis.
To capture differences in the morphotypes of experimental groups, we switched to multivariate analysis of the complete feature sets. Pairwise comparisons of individual features such as sphericity and volume could not distinguish many cell types or molecular states (Fig. S1 c). To visualize and reduce the dimensionality of the 12-dimensional feature space, we applied principal component analysis (PCA; Fig. 1). The first two principal components (PCs) captured 86% of the heterogeneity within the data, indicating a high potential for dimensionality reduction of the feature space (Fig. S1 d). Indeed, PC1 and PC2 together captured morphological differences between all cell types and molecular conditions (Fig. S1 e). As a negative control, we also compared a cell line (specifically TC32, see below) to cells of the same line expressing scrambled shRNA vectors and found no difference between the conditions. To address which geometric properties were most important for an EwS cell morphology analysis, we projected the loading vectors of the 12 individual features into the (PC1,PC2) space. PC1 was dominated by sphericity and aspect ratio, thus capturing the protrusive state of the cell. PC2 was dominated by volume and surface area, thus capturing the size and rectangularity of a cell (Fig. S1 f). Together, these outcomes led us to conclude that a 2D linear projection of the original feature space would be sufficient for the analysis of meaningful morphological differences between EwS cells.
To evaluate the broader applicability of this framework, we examined the sensitivity of the geometric feature analysis to axial resolution, considering that the more commonly available light sheet microscopes, such as the multidirectional selective plane imaging microscope (mSPIM), typically have threefold reduced axial resolution compared to the ASLM (Huisken and Stainier, 2007). Simulation of reduced axial resolution through use of Gaussian blurring in the z-dimension (σ = 3 pixels) showed highly similar overall distribution patterns in PC space (Fig. S2 a). To verify this robustness experimentally, we compared images of the same cells acquired first on an ASLM and then on an mSPIM. Images of single cells acquired on both microscopes showed no significant differences in geometric features (Fig. S2, b and c), and only slight shifts in PC space (Fig. S2 d). This demonstrates the applicability of the analytical pipeline to different microscopes and experimental conditions.

Geometric features are robust to changes in microscope resolution. (a) PCA comparison between original data and simulations of threefold blurred data in Z-dimension causing non-isotropic resolution. The two datasets are largely overlapping, demonstrating minimal effect of decreased axial resolution on shape feature measurements. (b) Comparison of XY (top) and XZ (middle) projections and 3D rendering (bottom) of the same cell acquired either on the ASLM (high axial resolution) or mSPIM (low axial resolution) show similarities despite decreased resolution. (c) Comparison of all 12 shape features (V, volume; SA, surface area; LL, long length; VS, volume sphericity; Sph, sphericity; AR, aspect ratio; Sol, solidity; R, roughness; Ext, extent; CSR, circumscribed surface ratio; RdS, radius sphericity; RtS, ratio sphericity) in four cells imaged in both mSPIM and ASLM show no significant difference (ns, paired t test). (d) Overall shift in PC space of the same cell imaged in ASLM (white) or mSPIM (black) is modest. Scale bar, 10 µm.

Geometric features are robust to changes in microscope resolution. (a) PCA comparison between original data and simulations of threefold blurred data in Z-dimension causing non-isotropic resolution. The two datasets are largely overlapping, demonstrating minimal effect of decreased axial resolution on shape feature measurements. (b) Comparison of XY (top) and XZ (middle) projections and 3D rendering (bottom) of the same cell acquired either on the ASLM (high axial resolution) or mSPIM (low axial resolution) show similarities despite decreased resolution. (c) Comparison of all 12 shape features (V, volume; SA, surface area; LL, long length; VS, volume sphericity; Sph, sphericity; AR, aspect ratio; Sol, solidity; R, roughness; Ext, extent; CSR, circumscribed surface ratio; RdS, radius sphericity; RtS, ratio sphericity) in four cells imaged in both mSPIM and ASLM show no significant difference (ns, paired t test). (d) Overall shift in PC space of the same cell imaged in ASLM (white) or mSPIM (black) is modest. Scale bar, 10 µm.
EwS cell morphotypes are different from fibroblasts and differ between cell lines
Equipped with the described pipeline, we examined morphotypes of two patient-derived EwS cell lines, TC32 and TC71, in situ in zebrafish larvae (Fig. 2 a). We further included analysis of NIH-3T3 fibroblasts as a reference of non-transformed cells. Previous work in 2D cell culture reported strong morphological changes in response to knockdown of EF1 gene expression, which were also accompanied by shifts in proliferation but not in cell survival (Franzetti et al., 2017). Therefore, we wondered whether EF1 expression changes would trigger similar responses in our in situ 3D imaging system. To accomplish this, we injected TC32 EwS cells expressing a doxycycline-inducible scrambled (control [C] shRNA) or EF1 (EF1 shRNA) targeting shRNA and a cytoplasmic GFP tag. To facilitate segmentation of individual cells within clusters, 1–10% of cells in the mixture also carried a ubiquitously driven F-Tractin-mRuby2. Visual inspection of 3D renderings of segmented cells, pooled from all three tissue microenvironments, already showed distinct differences between cell types (Fig. 2 b). For example, NIH-3T3 cells appear to be larger and more protrusive compared to EwS cells. Notably, EwS cells appear to take on distinctly more protrusive morphologies upon EF1 knockdown. Projection of the morphological feature data into the (PC1,PC2) space confirmed the visual impression of strong morphological shifts between these cell types and conditions, as each experimental group occupies a distinct region in PC space, except for TC32 and TC32 C shRNA, which overlap (Fig. 2, c and d). The statistical significance of these described differences between groups is confirmed by permutation tests (Fig. S1 e).

Classification of morphologies captures heterogeneity of cell states in EwS cells. (a) Left: Fibroblast (NIH-3T3, n = 52) or EwS cells (TC71 n = 60 cells, and TC32 n = 97) expressing F-Tractin-GFP (green in upper panel, gray in lower panel) or F-Tractin-mRuby2 (red) in zebrafish HBV. Right: TC32 cells expressing a doxycycline-induced cassette, which includes a cytoplasmic GFP (upper panel, green) as well as C shRNA (n = 71) or EF1 shRNA (n = 70). A subset of cells also express F-Tractin-mRuby2 (red in upper panel, gray in lower panel), allowing for sparse labeling of single-cell morphologies. (b) 10 representative 3D cell renderings are displayed within each experimental group, pooled from all three tissue microenvironments. Note the distinction in cell shape and size particularly in NIH-3T3 (left-most panel) and TC32 EF1 shRNA (right-most panel) compared to other experimental groups. (c and d) PCA of all experimental groups shown individually (c) or together (d). (e) K-means based clustering allows visualization of relationships between experimental groups. Note distinctions in all experimental groups, with the exception of TC32 and TC32 + C shRNA, which largely overlap. Scale bars, 20 µm.
Classification of morphologies captures heterogeneity of cell states in EwS cells. (a) Left: Fibroblast (NIH-3T3, n = 52) or EwS cells (TC71 n = 60 cells, and TC32 n = 97) expressing F-Tractin-GFP (green in upper panel, gray in lower panel) or F-Tractin-mRuby2 (red) in zebrafish HBV. Right: TC32 cells expressing a doxycycline-induced cassette, which includes a cytoplasmic GFP (upper panel, green) as well as C shRNA (n = 71) or EF1 shRNA (n = 70). A subset of cells also express F-Tractin-mRuby2 (red in upper panel, gray in lower panel), allowing for sparse labeling of single-cell morphologies. (b) 10 representative 3D cell renderings are displayed within each experimental group, pooled from all three tissue microenvironments. Note the distinction in cell shape and size particularly in NIH-3T3 (left-most panel) and TC32 EF1 shRNA (right-most panel) compared to other experimental groups. (c and d) PCA of all experimental groups shown individually (c) or together (d). (e) K-means based clustering allows visualization of relationships between experimental groups. Note distinctions in all experimental groups, with the exception of TC32 and TC32 + C shRNA, which largely overlap. Scale bars, 20 µm.
As a complimentary approach to visualizing differences in morphotypes between groups, we assigned cells to one of four characteristic clusters in (PC1,PC2) space. We identified the clusters by K-means and determined the number k of clusters subject to maximizing the silhouette score in the range of 3–10 clusters (Fig. 2 e). While qualitative, this type of visualization technique allows some degree of interpretability of the data given the known relative contribution of individual geometric features to PC1 and PC2 (Fig. S1 f). For example, clusters 4, 3, and 2 break the data set primarily along the PC1 axis, representing increasingly more protrusive cell shapes. Cluster 1 is characterized by a shift in PC2, representing larger, more rectangular cells. Comparison of the cluster assignments demonstrates stark differences between cell types. Fibroblasts occupy all four clusters, with 44% of cells residing in Cluster 2. In contrast, TC71 is largely distributed along the PC2 axis, occupying predominantly Clusters 1 (35%) and 4 (48%), and TC32 and TC32 C shRNA cells are dominated by Cluster 4 (79 and 72%, respectively). TC32 cells with a knockdown of EF1 expression displayed an increase in occupancy of Cluster 3 (57%), at the expense of Cluster 4 occupancy (33%), i.e., lower EF1 expression overall yields more protrusive cells. This observation is consistent with 2D cell culture studies describing the cells with EF1 knockdown as more “mesenchymal” (Franzetti et al., 2017). Of note, exclusion of NIH-3T3 as an outlier group resulted in only a minor shift in PC space and relative contribution of features (Fig. S1 g), suggesting that the PCA of the 12 global 3D features constitutes a robust space for the definition of cell morphological classes and is not dominated by the fibroblast distribution. Overall, these results demonstrate the applicability of 3D cell shape analysis in capturing differences across cell types and experimental conditions, and confirm in vivo that the expression level of the oncoprotein EF1 affects EwS cell morphology.
Tissue microenvironment affects EwS morphotypes and function
To examine whether EwS cells functionally adapt to the tissue microenvironment, we first compared proliferation and cell death states between HBV, PVS, and CHT (Fig. 3 a) by immunostaining for the proliferative marker Phospho-Histone 3 (PH3) or the apoptotic marker TUNEL (Fig. 3, b and c), or by measuring change in cell cluster size over 4 d (S3a-c). While apoptosis was similarly low across all three tissue microenvironments (<10% on average, Fig. 3 d), proliferation and growth rates were higher in PVS compared to the other sites (Fig. 3 e and Fig. S3 d). Note that the number of cells greatly varied between regions (Fig. S3 e), a difference that likely arose from differences in initial seeding rather than cell growth. However, no clear correlation was seen between proliferation rate and cell cluster size (Fig. S3 f) or fold growth and initial cell cluster size (Fig. S3, a–c), suggesting cluster size may not be a major driver of differences in cell growth.

Proliferation but not apoptosis change as a function of tissue microenvironment. (a) Comparison of single-cell morphologies were made as a function of seeding site within the zebrafish larvae, each representing a distinct tissue microenvironment. The HBV is a mostly fluid-filled compartment (a), the PVS is a small, compressed region sandwiched between two membranes surrounding the yolk, and the CHT is a narrow region rich in vasculature. (b and c) TC71 cells expressing nuclear marker mCherry-H2B (red) within the HBV (inset, enlarged in b’), CHT (inset, enlarged in c’), or PVS (inset, enlarged in c’’) of fish larvae (4 dpf). Fish are immunostained for proliferation marker PH3 (blue) and apoptotic staining TUNEL (green). Measurements are made on 3D volumes, as rendered in c’’’. (d and e) Apoptotic rate is similarly low across all three regions (Kruskal-Wallis test, post-hoc Dunn’s test, P > 0.1; d), while proliferation rate appears to be highest in PVS compared to other regions (Kruskal-Wallis test, post-hoc Dunn’s test, **P < 0.05; e). Scale bars, 100 µm (b and c) and 20 µm (b’, c’, and c’’). N = 18, 27, 12 fish for PVS/CHT/HBV, respectively.
Proliferation but not apoptosis change as a function of tissue microenvironment. (a) Comparison of single-cell morphologies were made as a function of seeding site within the zebrafish larvae, each representing a distinct tissue microenvironment. The HBV is a mostly fluid-filled compartment (a), the PVS is a small, compressed region sandwiched between two membranes surrounding the yolk, and the CHT is a narrow region rich in vasculature. (b and c) TC71 cells expressing nuclear marker mCherry-H2B (red) within the HBV (inset, enlarged in b’), CHT (inset, enlarged in c’), or PVS (inset, enlarged in c’’) of fish larvae (4 dpf). Fish are immunostained for proliferation marker PH3 (blue) and apoptotic staining TUNEL (green). Measurements are made on 3D volumes, as rendered in c’’’. (d and e) Apoptotic rate is similarly low across all three regions (Kruskal-Wallis test, post-hoc Dunn’s test, P > 0.1; d), while proliferation rate appears to be highest in PVS compared to other regions (Kruskal-Wallis test, post-hoc Dunn’s test, **P < 0.05; e). Scale bars, 100 µm (b and c) and 20 µm (b’, c’, and c’’). N = 18, 27, 12 fish for PVS/CHT/HBV, respectively.

Proliferation but not apoptosis changes as a function of tissue microenvironment. (a–c) Images of TC71-GFP cells xenografted in zebrafish larvae at 2 dpf and imaged in their respective seeding sites (CHT, PVS, HBV) 3 and 7 dpf. Graphs indicate change in area over 4 d. Note that individual paired measurements within each tissue microenvironment suggest that fold growth change is not influenced by initial seeding cluster size. (d) Fold growth as measured by change in measured area of CHT (a), PVS (b) , or HBV (c) over a period of 4 d. PVS shows a larger increase in fold growth compared to HBV. (e) Relative size of TC71 clusters varies greatly as a function of tissue microenvironment, which is likely a result of differential seeding rates during xenografts. (f) XY plot of cluster size (cell count) vs. proportion of PH3 positive cells (see Fig. 3). Proliferation rate does not seem to correlate to size of clusters, suggesting this difference does not greatly impact the functional state of cells. Asterisks mark significant differences (Dunn’s multiple comparison test, P < 0.05). Scale bars, 20 µm.

Proliferation but not apoptosis changes as a function of tissue microenvironment. (a–c) Images of TC71-GFP cells xenografted in zebrafish larvae at 2 dpf and imaged in their respective seeding sites (CHT, PVS, HBV) 3 and 7 dpf. Graphs indicate change in area over 4 d. Note that individual paired measurements within each tissue microenvironment suggest that fold growth change is not influenced by initial seeding cluster size. (d) Fold growth as measured by change in measured area of CHT (a), PVS (b) , or HBV (c) over a period of 4 d. PVS shows a larger increase in fold growth compared to HBV. (e) Relative size of TC71 clusters varies greatly as a function of tissue microenvironment, which is likely a result of differential seeding rates during xenografts. (f) XY plot of cluster size (cell count) vs. proportion of PH3 positive cells (see Fig. 3). Proliferation rate does not seem to correlate to size of clusters, suggesting this difference does not greatly impact the functional state of cells. Asterisks mark significant differences (Dunn’s multiple comparison test, P < 0.05). Scale bars, 20 µm.
We next examined single-cell morphotype variations between the three tissue microenvironments (Fig. 4). Bagplots (i.e., bivariate boxplots; Rousseeuw et al., 1999) enabled visualization in the PC space of differences in the morphological features between regions. Differences were further quantified by assembly of similarity matrices based on pairwise permutation tests. Examination of NIH-3T3 fibroblasts revealed highly heterogeneous morphotypes, with largely overlapping distributions in all three seeding sites, suggesting that these non-transformed cells lack sensitivity to environmental cues (Fig. 4 a). In contrast, the EwS cell lines TC32 (Fig. 4 b) and TC71 (Fig. 4 c) showed variation in the distributions of morphotypes as a function of seeding site. For example, TC32 cells in the PVS and CHT were largely overlapping, but cells in the HBV shifted to the upper left in PC space, representing more protrusive, larger cells. TC71 cell distributions in the PVS and HBV shifted left in PC space compared to CHT (Fig. 4 c), suggesting that these cells stayed more rounded in the CHT.

Tissue microenvironment affects EwS cell morphologies. (a–c) 10 representative cell renderings of EwS cell lines TC32 and TC71 and fibroblast cell line NIH-3T3 are shown, color-coded by k-means-based cluster from Fig. 2 e (black frames, upper part of panels). Bagplots below display PCA of each cell line as a function of region (HBV, red, PVS, black, CHT, white). The inner polygon is constructed on the basis of Tukey depth and contains at most 50% of the data points. The outer circle encompasses all data excluding outliers. White plus sign represents the Tukey depth median. Lower right panel shows a similarity matrix based on pairwise permutation tests. Note that relative to NIH-3T3 (n = 15, 22, 15 cells for HBV/PVS/CHT, respectively), which shows high similarity in morphological cell state among all three regions (a), TC32 (n = 19, 41, 47 for HBV/PVS/CHT, respectively; b) and TC71 (n = 19, 23, 18 for HBV/PVS/CHT, respectively; c) show some tissue-dependent specialization of cells. Scale bars, 20 µm.
Tissue microenvironment affects EwS cell morphologies. (a–c) 10 representative cell renderings of EwS cell lines TC32 and TC71 and fibroblast cell line NIH-3T3 are shown, color-coded by k-means-based cluster from Fig. 2 e (black frames, upper part of panels). Bagplots below display PCA of each cell line as a function of region (HBV, red, PVS, black, CHT, white). The inner polygon is constructed on the basis of Tukey depth and contains at most 50% of the data points. The outer circle encompasses all data excluding outliers. White plus sign represents the Tukey depth median. Lower right panel shows a similarity matrix based on pairwise permutation tests. Note that relative to NIH-3T3 (n = 15, 22, 15 cells for HBV/PVS/CHT, respectively), which shows high similarity in morphological cell state among all three regions (a), TC32 (n = 19, 41, 47 for HBV/PVS/CHT, respectively; b) and TC71 (n = 19, 23, 18 for HBV/PVS/CHT, respectively; c) show some tissue-dependent specialization of cells. Scale bars, 20 µm.
Common to both TC32 and TC71 cell lines is the tendency to become more protrusive in the HBV. This was unexpected, given that the fluid-filled HBV compartment is likely softer than PVS and CHT and thus is a mechanical environment usually associated with rounded cells (Kai et al., 2016). On the other hand, this environment may be enriched in signaling cues that trigger neural differentiation (Lowery and Sive, 2005; Chang et al., 2016). Closer examination of the architecture of this region revealed that EwS cell clusters within the HBV organized in pseudorosette-like spheroids, with protrusions pointing inwards and cell bodies occupying the cluster periphery (Fig. 5, a–c and Video 1). Notably, pseudorosettes have been described clinically in a subset of EwSs classified previously as peripheral primitive neuroectordermal tumors (Llombart-Bosch et al., 2009; Brohl et al., 2014; Campbell et al., 2018), so named by pathologists according to their apparent neural-like differentiation (Navarro et al., 2007). Indeed, direct apposition of H&E stains of a human EwS tumor in soft tissue (Fig. 5 d and Fig. S4 a) and TC71 cells expressing the nuclear marker Cherry-H2B (Fig. 5 e) showed a striking similarity in the circular arrangement of nuclei associated with the formation of pseudorosettes. As expected, based on the cell morphological classification, these arrangements could not be observed with TC71 nuclei in the PVS or CHT (Fig. S4 b). In sum, these analyses demonstrate that a morphological classifier is a valid step toward the discovery of cell functional adaptation to microenvironments. The analyses also show remarkable parallels between adaptive processes in human tissue and zebrafish, further validating the zebrafish model as a tool for studying organotropism of cancer cells.

Tissue architecture affects cell state. (a) Schematic of mixtures of fluorescently labeled cells displaying pseudorosette-like formations formed by EwS cells specifically in HBVs. (b and c) Maximum intensity projections (upper panel) or single optical slices (lower panel) of TC32 and TC71 cells expressing F-Tractin-GFP (gray, green) or F-Tractin-mRuby2 (red) in zebrafish larval HBV (3 dpf). Note the pseudorosette-like polarization of cells, with cellular protrusions pointing towards a center of a sphere and cell bodies organized outwards. (d) An H&E-stained histological slice from a human EwS tissue sample from the soft tissue (sacral region) of a 20-yr-old female, evaluated by a pathologist. Pseudorosettes structures outlined with dashed line. (e) Optical slice of TC71 cells expressing nuclear marker H2B-Cherry form ring-like structures (outlined with dashed line) in the HBV that resemble those observed in some human EwS tumors. (f) Cells within a cell cluster of like-cells are classified and analyzed according to percent contact with other cells, as no neighbors (NN, 0–20% contact with other cells), partially exposed (PE, 21–81% contact), or fully embedded (E, 81–100% contact). (g and h) Proportion of contact with other TC32 cells is plotted against two dominant shape features, volume (g) and sphericity (h). Whereas volume was independent of the degree of cell–cell contact, a few embedded cells but not other groups show cells with distinctly low sphericity (<0.8, dashed line). Pink arrows indicate cells from all three regions with distinctive cell morphological states, rendered below and color-coded by k-means clustering in Fig. 2 e. Scale bars, 20 µm.
Tissue architecture affects cell state. (a) Schematic of mixtures of fluorescently labeled cells displaying pseudorosette-like formations formed by EwS cells specifically in HBVs. (b and c) Maximum intensity projections (upper panel) or single optical slices (lower panel) of TC32 and TC71 cells expressing F-Tractin-GFP (gray, green) or F-Tractin-mRuby2 (red) in zebrafish larval HBV (3 dpf). Note the pseudorosette-like polarization of cells, with cellular protrusions pointing towards a center of a sphere and cell bodies organized outwards. (d) An H&E-stained histological slice from a human EwS tissue sample from the soft tissue (sacral region) of a 20-yr-old female, evaluated by a pathologist. Pseudorosettes structures outlined with dashed line. (e) Optical slice of TC71 cells expressing nuclear marker H2B-Cherry form ring-like structures (outlined with dashed line) in the HBV that resemble those observed in some human EwS tumors. (f) Cells within a cell cluster of like-cells are classified and analyzed according to percent contact with other cells, as no neighbors (NN, 0–20% contact with other cells), partially exposed (PE, 21–81% contact), or fully embedded (E, 81–100% contact). (g and h) Proportion of contact with other TC32 cells is plotted against two dominant shape features, volume (g) and sphericity (h). Whereas volume was independent of the degree of cell–cell contact, a few embedded cells but not other groups show cells with distinctly low sphericity (<0.8, dashed line). Pink arrows indicate cells from all three regions with distinctive cell morphological states, rendered below and color-coded by k-means clustering in Fig. 2 e. Scale bars, 20 µm.
EwS cells form rosette-like structures in hindbrain. TC32 and TC71 cells expressing F-Tractin-GFP (gray, green) or F-Tractin-mRuby2 (red), in zebrafish larval HBV (3 dpf). In both EwS cell lines, 3D rotation of image z-stack shows pseudorosette-like polarization of cells, with cellular protrusions pointing towards a center of a sphere and cell bodies organized outwards. Running through the z-dimension of the optical slices illustrates how rosettes form within a subset of the clusters, rather than encompass its entirety. Renderings were created at 7 frames per second.
EwS cells form rosette-like structures in hindbrain. TC32 and TC71 cells expressing F-Tractin-GFP (gray, green) or F-Tractin-mRuby2 (red), in zebrafish larval HBV (3 dpf). In both EwS cell lines, 3D rotation of image z-stack shows pseudorosette-like polarization of cells, with cellular protrusions pointing towards a center of a sphere and cell bodies organized outwards. Running through the z-dimension of the optical slices illustrates how rosettes form within a subset of the clusters, rather than encompass its entirety. Renderings were created at 7 frames per second.

Tissue architecture affects cell state. (a) An H&E-stained histological slice from three separate EwS tissue samples, evaluated by a pathologist. Pseudorosettes structures outlined with dashed line. Note both elongated and rounded presentations of pseudorosettes. (b) XY maximum intensity projections of TC71 cells expressing nuclear marker H2B-mcherry in the HBV, PVS, or CHT. Numbered dashed lines indicate the corresponding optical XZ projections depicted below. Note that only the HBV but not the other regions contains pseudorosette-like structures (indicated by arrowheads) throughout the cell cluster. (c) Proportion of contact with other TC71 cells is plotted against volume (b) and sphericity (c). While no clear relationship is observed for volume, a few embedded (E) cells but not other groups (NN, no neighbor; PE, partially exposed) show cells with distinctly low sphericity (<0.8). Arrows indicate cells from all three regions with distinctive cell morphological states, rendered to the right and color-coded by k-means clustering in Fig. 2 e. Scale bars, 20 µm.

Tissue architecture affects cell state. (a) An H&E-stained histological slice from three separate EwS tissue samples, evaluated by a pathologist. Pseudorosettes structures outlined with dashed line. Note both elongated and rounded presentations of pseudorosettes. (b) XY maximum intensity projections of TC71 cells expressing nuclear marker H2B-mcherry in the HBV, PVS, or CHT. Numbered dashed lines indicate the corresponding optical XZ projections depicted below. Note that only the HBV but not the other regions contains pseudorosette-like structures (indicated by arrowheads) throughout the cell cluster. (c) Proportion of contact with other TC71 cells is plotted against volume (b) and sphericity (c). While no clear relationship is observed for volume, a few embedded (E) cells but not other groups (NN, no neighbor; PE, partially exposed) show cells with distinctly low sphericity (<0.8). Arrows indicate cells from all three regions with distinctive cell morphological states, rendered to the right and color-coded by k-means clustering in Fig. 2 e. Scale bars, 20 µm.
Cell–cell interaction, cell crowding, and position within a cell cluster or tissue all may affect cell function and thus the morphological state (Snijder et al., 2009; Mayr et al., 2019). We therefore tested whether the morphotype of EwS cells was affected by its position within a cell cluster. We distinguished cluster-peripheral and cluster-interior cells based on the fraction of the cell surface in contact with other cells in the cluster. For example, a cell may have few or no neighbors (0%–20% of cell surface in contact with the cluster), be partially embedded (21–80%) within a cluster with one portion exposed to the tissue microenvironment, or almost fully or entirely embedded (81–100%) within a cluster (Fig. 5 f). We compared the degree of contact of EwS cells with other cells to two dominant-shaped features, sphericity, and volume. While volume was independent of the degree of cell–cell contact (Fig. 5 g and Fig. S4 c), the few cells with distinctly low sphericity were all fully embedded in the cluster, regardless of seeding site (Fig. 5 h and Fig. S4 c). Overall, these results demonstrate the capacity of the proposed assay to capture the sensitivity of EwS cell morphotypes to cell-extrinsic cues, allowing the systematic analysis of context-driven cell adaptation.
Loss of EWSR1-FLI1 causes site-specific changes in cell morphology
Previous works have suggested that variation in EWSR1-FLI1 expression could drive differential cell function (Aynaud et al., 2020), including morphology (Franzetti et al., 2017). However, these studies have so far been limited to 2D culture systems. Thus, we wondered how EWSR1-FLI1 expression shifts affect cell morphology in vivo, and whether putative morphological adaptation to such expression shifts varies between the microenvironments presented by the three seeding sites. Using a doxycycline-inducible EF1 knockdown system, we observed efficient partial reduction in EF1 (Fig. S5 a), but only mild associated changes in cytoskeletal organization in 2D cell culture, with no notable effects on cell shape (Fig. S5 b). This is in contrast to the significant shifts in cell morphology upon EF1 knockdown in the xenograft assays (Fig. 2).
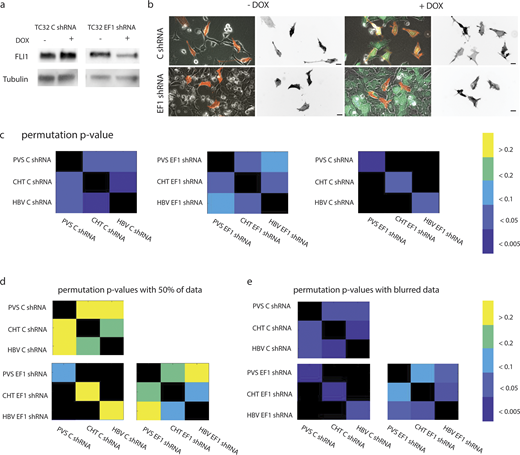
Knockdown of EF1 causes variable changes in morphologies as a function of tissue microenvironment. (a) Western blot shows efficient knockdown of EWS-FLI1 in cell culture conditions upon 72 h addition of doxycycline (DOX). (b) Images of TC32 cells expressing C shRNA or EF1 shRNA with or without addition of DOX in cell culture. A subset of cells express F-Tractin mRuby2 (red on left, gray on right), while all cells express the doxycycline-inducible cytoplasmic GFP (green), allowing for mosaic cell labeling. Mild changes in actin organization are observed with expression of EF1 shRNA. However, no clear distinctions in cell morphology are seen. (c) Similarity matrix based on pairwise permutation test of Tukey depth median of first two PCs shows distinct differences in cell states between all three tissue microenvironments in TC32 C shRNA (left). Upon loss of EF1, cell states in all three regions change significantly (right), and enviromentally dependent differences become less distinct (middle), suggesting expression of EF1 enables tissue-specific specialization of cells. (d and e) Loss of 50% of data (d), but not simulations of reduced axial resolution by Gaussian blurring in the z-dimension (σ = 3 pixels; e), leads to loss of distinction between experimental groups, as visualized by similarity matrix based on pairwise permutation tests. Source data are available for this figure: SourceData FS5.

Knockdown of EF1 causes variable changes in morphologies as a function of tissue microenvironment. (a) Western blot shows efficient knockdown of EWS-FLI1 in cell culture conditions upon 72 h addition of doxycycline (DOX). (b) Images of TC32 cells expressing C shRNA or EF1 shRNA with or without addition of DOX in cell culture. A subset of cells express F-Tractin mRuby2 (red on left, gray on right), while all cells express the doxycycline-inducible cytoplasmic GFP (green), allowing for mosaic cell labeling. Mild changes in actin organization are observed with expression of EF1 shRNA. However, no clear distinctions in cell morphology are seen. (c) Similarity matrix based on pairwise permutation test of Tukey depth median of first two PCs shows distinct differences in cell states between all three tissue microenvironments in TC32 C shRNA (left). Upon loss of EF1, cell states in all three regions change significantly (right), and enviromentally dependent differences become less distinct (middle), suggesting expression of EF1 enables tissue-specific specialization of cells. (d and e) Loss of 50% of data (d), but not simulations of reduced axial resolution by Gaussian blurring in the z-dimension (σ = 3 pixels; e), leads to loss of distinction between experimental groups, as visualized by similarity matrix based on pairwise permutation tests. Source data are available for this figure: SourceData FS5.
We next examined whether loss of EF1 affected the cell morphotypes in a tissue-sensitive manner. As with the wildtype version, TC32 cells expressing C shRNA showed a distinct morphological shift of HBV relative to PVS and CHT, with cells shifting upward in PC2 (Fig. 6, a–d and Fig. S5 c). The TC32 C shRNA cells showed additional distinction between PVS and CHT, with cells in PVS shifting to a relatively more protrusive state (left in PC1). Cells expressing EF1 shRNA exhibited overall larger morphological heterogeneity and a significant shift of cells in all three regions toward a more protrusive state. Differences observed in the morphotypes of C shRNA expressing cells between PVS and CHT became blurred in the EF1 shRNA group, while HBV cells remained distinctly higher in PC2 and volume. Pseudorosette-like structures formed in HBV also with EF1 low cells, despite altered morphology (Fig. 6 e and Video 2), suggesting maintained sensitivity to the cues of this environment. Examination of sphericity as a function of position within a cluster showed that upon EF1 knockdown, cells with distinctly low sphericity could now also be observed with only partial contact to other cells (Fig. 6 f). This is in contrast to the observations in TC32 and TC71 cells, where the protrusive subpopulation requires a high degree of contact (Fig. 5 h and Fig. S4 c). Hence, with decreased EF1 expression, EwS cells become less sensitive to interactions with neighboring cells in the cluster. We conclude that reduced EF1 expression leads to an indiscriminately more protrusive morphological cell state with loss of sensitivity to some but not all environmental cues.

Knockdown of EF1 causes variable changes in morphologies as a function of tissue microenvironment. (a–c) Morphological cell states were examined as a function of tissue microenvironment (HBV, PVS, or CHT) in EwS cells expressing a dox-inducible scrambled (C, left, n = 18, 25, 28 for HBV/PVS/CHT, respectively) or EWSR1-FLI1 (EF1, right, n = 25, 26, 19 for HBV/PVS/CHT, respectively) targeting shRNA. Representative cell renderings from each group are color-coded by k-means clustering in Fig. 2 e. (d) Bagplots below display PCA of each cell line as a function of region (HBV, red, PVS, black, CHT, white). The inner polygon is constructed on the basis of Tukey depth, and contains at most 50% of the data points. The outer circle encompasses all data excluding outliers, which are marked by black asterisks. White plus sign represents the Tukey depth median. In C shRNA expressing cells, all three regions showed distinct cell states in PC space (left). Upon knockdown of EF1, cells are shifted to a more protrusive state and differences as a function of region are relatively reduced (right). (e) A subset of EwS C (e’) or EF1 shRNA (e’’) expressing cells express F-Tractin mRuby2 (white in top panel, red in bottom panel) in addition to dox-inducible cytoplasmic GFP (green, bottom panel), allowing for labeling of individual cells. EwS cells in HBV can maintain a pseudorosette-like organization upon EF1 knockdown, despite altered cell morphologies. (see also Video 2). (f) Proportion of contact with other TC32 cells expressing C shRNA or EF1 shRNA is plotted against sphericity. Upon EF1 knockdown, cells with distinctly low sphericity (<0.8, dashed line) could now also be observed with only partial contact to other cells. Scale bar, 20 µm.
Knockdown of EF1 causes variable changes in morphologies as a function of tissue microenvironment. (a–c) Morphological cell states were examined as a function of tissue microenvironment (HBV, PVS, or CHT) in EwS cells expressing a dox-inducible scrambled (C, left, n = 18, 25, 28 for HBV/PVS/CHT, respectively) or EWSR1-FLI1 (EF1, right, n = 25, 26, 19 for HBV/PVS/CHT, respectively) targeting shRNA. Representative cell renderings from each group are color-coded by k-means clustering in Fig. 2 e. (d) Bagplots below display PCA of each cell line as a function of region (HBV, red, PVS, black, CHT, white). The inner polygon is constructed on the basis of Tukey depth, and contains at most 50% of the data points. The outer circle encompasses all data excluding outliers, which are marked by black asterisks. White plus sign represents the Tukey depth median. In C shRNA expressing cells, all three regions showed distinct cell states in PC space (left). Upon knockdown of EF1, cells are shifted to a more protrusive state and differences as a function of region are relatively reduced (right). (e) A subset of EwS C (e’) or EF1 shRNA (e’’) expressing cells express F-Tractin mRuby2 (white in top panel, red in bottom panel) in addition to dox-inducible cytoplasmic GFP (green, bottom panel), allowing for labeling of individual cells. EwS cells in HBV can maintain a pseudorosette-like organization upon EF1 knockdown, despite altered cell morphologies. (see also Video 2). (f) Proportion of contact with other TC32 cells expressing C shRNA or EF1 shRNA is plotted against sphericity. Upon EF1 knockdown, cells with distinctly low sphericity (<0.8, dashed line) could now also be observed with only partial contact to other cells. Scale bar, 20 µm.
Rosette-like organization maintained upon loss of EF1. TC32 cells expressing C shRNA or EF1 shRNA in zebrafish larval HBV (3 dpf). A subset of cells express F-Tractin mRuby2 (gray, red), while all cells express the DOX-inducible cytoplasmic GFP (green). Rosette-like formation is sustained in the EF1 knockdown condition, despite gross morphological changes. Renderings were created at 7 frames per second.
Rosette-like organization maintained upon loss of EF1. TC32 cells expressing C shRNA or EF1 shRNA in zebrafish larval HBV (3 dpf). A subset of cells express F-Tractin mRuby2 (gray, red), while all cells express the DOX-inducible cytoplasmic GFP (green). Rosette-like formation is sustained in the EF1 knockdown condition, despite gross morphological changes. Renderings were created at 7 frames per second.
Live imaging captures temporal dynamics of morphological states
The observed heterogeneity within each experimental group prompted us to assess whether the variation between cells is a result of morphological state dynamics or of a bona fide cell-to-cell variation. Leveraging the advantages of the zebrafish for in situ high-resolution live-imaging, we tracked the morphotype variation of 19 cells within the HBV, expressing either C or EF1 shRNA (Fig. 7 a and Video 3). Timelapse images were acquired at 10-min time intervals over approximately 3 h, using the lower-axial-resolution mSPIM rather than the ASLM. Our choice of the mSPIM was motivated by the more stable environmental control in our experimental set-up, which is necessary for such long-term experiments. Overall, the projection of feature measurements onto the PC space we previously established indicated that live-imaging cell features fall within the same feature space as fixed cells (Fig. 7 b). Technically, this corroborates our earlier conclusion based on simulations that the reduced axial resolution of the mSPIM does not greatly impact shape feature space analysis. However, there are differences between the distributions of the two data sets that are likely introduced by the fixation. We therefore applied PCA to the 376 individual cell images acquired from the timelapse image sequences. Contrary to the fixed cell image data, there was a significant contribution of PC3 (Fig. 7 c), requiring visualization and analysis of the live cell data in 3D. In agreement with the results of the fixed cell analyses, the distributions of morphotypes between C shRNA and EF1 shRNA expressing cells were again distinct (Fig. 7 d). To measure temporal dynamics of morphotypes, we determined (1) the median step in shape feature space between consecutive time points and (2) the persistence, defined as the net endpoint-to-endpoint displacement divided by the total trajectory length in shape space as a measure of directed versus random cell morphological changes (Fig. 7 e; Meijering et al., 2012). While the median step was similar for all cells, half of the EF1 shRNA–expressing cells displayed increased persistence in their shape changes compared to the other cells. This may provide a dynamics-based explanation for the increased morphological heterogeneity exhibited by EF1 knockdown cells (see Fig. 6), i.e., with lower EF1 expression shape changes are more persistent, yielding more pronounced shape differences between individual cells. This suggests that high EF1 expression promotes the activation of signaling programs that tend to weaken cell polarization.

Live imaging captures temporal dynamics of morphological states. (a) Live imaging of TC32 cells in the HBV expressing either C shRNA or EF1 shRNA. Sequences were acquired over ∼3 h with 10-min time intervals. XY maximum intensity projections of segmented image pseudo-colored by timepoint demonstrates dynamics of shape change over time. Four representative images of each experimental group are shown. (b) Projection of C shRNA (red, n = 10 cells) or EF1 shRNA (blue, n = 9 cells) timelapse data into the PC space of the fixed cells (gray). The boundaries of C shRNA (dashed line) or EF1 shRNA (solid line)–expressing fixed cells within the HBV, excluding outliers, are indicated for comparison. Slight differences between the fixed and live cell data sets may be due to morphological shifts during fixation and uncontrolled variation in experimental conditions. (c) Relative contribution of PCs explaining the morphological variation of 376 live cell images acquired over all 19 cells. PC3 shows an increased contribution compared to PC3 of the fixed cell analysis (inset, reproduced from Fig. S1 d). (d) PCA of shape features using three PCs in four representative C shRNA (red) or EF1 shRNA (blue) cells shows distinct distributions between the two experimental groups (permutation P value based on the shift in center of mass between 10 C shRNA cells and 9 EF1 shRNA cells <0.001). For each cell, consecutive time points are connected to create a shape change trajectory. (e) Median step between consecutive time points (left) and persistence (right), defined as the net endpoint-to-endpoint displacement divided by the total trajectory length in shape space, for individual cells over time.
Live imaging captures temporal dynamics of morphological states. (a) Live imaging of TC32 cells in the HBV expressing either C shRNA or EF1 shRNA. Sequences were acquired over ∼3 h with 10-min time intervals. XY maximum intensity projections of segmented image pseudo-colored by timepoint demonstrates dynamics of shape change over time. Four representative images of each experimental group are shown. (b) Projection of C shRNA (red, n = 10 cells) or EF1 shRNA (blue, n = 9 cells) timelapse data into the PC space of the fixed cells (gray). The boundaries of C shRNA (dashed line) or EF1 shRNA (solid line)–expressing fixed cells within the HBV, excluding outliers, are indicated for comparison. Slight differences between the fixed and live cell data sets may be due to morphological shifts during fixation and uncontrolled variation in experimental conditions. (c) Relative contribution of PCs explaining the morphological variation of 376 live cell images acquired over all 19 cells. PC3 shows an increased contribution compared to PC3 of the fixed cell analysis (inset, reproduced from Fig. S1 d). (d) PCA of shape features using three PCs in four representative C shRNA (red) or EF1 shRNA (blue) cells shows distinct distributions between the two experimental groups (permutation P value based on the shift in center of mass between 10 C shRNA cells and 9 EF1 shRNA cells <0.001). For each cell, consecutive time points are connected to create a shape change trajectory. (e) Median step between consecutive time points (left) and persistence (right), defined as the net endpoint-to-endpoint displacement divided by the total trajectory length in shape space, for individual cells over time.
Live imaging captures temporal dynamics of morphological state. Original image (top panel) and 3D rendering (bottom panel) of TC32 cell expressing C shRNA and F-Tractin mRuby2 in zebrafish larval HBV (3 dpf) imaged over the course of 2.8 h, with 10-min time intervals. Renderings were created at 7 frames per second.
Live imaging captures temporal dynamics of morphological state. Original image (top panel) and 3D rendering (bottom panel) of TC32 cell expressing C shRNA and F-Tractin mRuby2 in zebrafish larval HBV (3 dpf) imaged over the course of 2.8 h, with 10-min time intervals. Renderings were created at 7 frames per second.
Discussion
In this study, we present a quantitative 3D imaging pipeline for the analysis of cell morphological adaptation to diverse microenvironments in zebrafish. Applied to human EwS xenografts, we demonstrate that the pipeline captures systematic shifts in EwS cell morphotypes as a function of cancer cell type, oncogene expression level, and location within the fish. We do not observe site-specific adaptation for xenografts composed of human fibroblasts, suggesting that organotropic behavior is an acquired feature during transformation.
Demonstrating in situ the plasticity of cancer cells in response to mechanical and chemical parameters has been difficult. Environmentally triggered variation must be gauged against a slew of stochastic cell autonomous cues that drive heterogeneous cellular responses. Our approach begins to address this very challenge by leveraging the combined advantages of the zebrafish model (Ingham, 2009; Konantz et al., 2012; Heilmann et al., 2015; Osmani and Goetz, 2019) and innovations in high-resolution imaging and computational image analysis, allowing for the throughput and resolution needed to uncover meaningful heterogeneity among noise. First, high-resolution image acquisition enabled the segmentation and morphological characterization of cells in 3D. Second, because of intrinsic cell-to-cell variation, the analysis has relied on a fairly large dataset. For example, random removal of 50% of the data caused loss of sensitivity to differences between experimental groups (Fig. S5 d). Third, the automation of the single-cell segmentation and shape feature definition using constant hyper-parameters across all image data sets guaranteed an unbiased analysis. Notably, detected differences between groups were overall robust within a 30% margin of control parameter variation (Table S2). Fourth, the amenability of the framework to live imaging enabled the capture of dynamic processes on a variety of time scales. Overall, these technical developments provide a powerful basis for the study of cancer cell adaptation in situ.
We applied the pipeline to investigate evidence of extrinsically driven variation of EwS cell states, a form of cancer whose progression we hypothesize is strongly dependent on cell adaptation to the microenvironment. Indeed, we found that both environmental conditions of the host tissue as well as the location within the sarcoma cell cluster systematically affect EwS cell morphology (summarized in Fig. 8). For example, in the hindbrain ventricle but not other tissues, our analysis uncovered a pseudorosette-like organization akin to that observed in a subset of human EwS tumors. In contrast, non-transformed fibroblasts, while even more heterogeneous in morphology than EwS cells, showed no sensitivity for the tissue microenvironment, suggesting that specialization for certain environments is a cellular feature acquired with the oncogenic transformation of EwS. Our results also show that expression levels of EF1 can regulate morphotypes in vivo. We find that knockdown of the EF1 fusion protein leads to an overall shift toward more protrusive cell morphologies. This is consistent with previously reported observations of EwS in cell culture, which reported shifts in transcriptional and morphological cell states characteristic of epithelial-to-mesenchymal transitions (Franzetti et al., 2017) and decreased proliferation (Hancock and Lessnick, 2008; Toomey et al., 2010). Interestingly, this tendency to protrusion and polarization could be confirmed by live cell imaging, where we found knockdown of EF1 to cause more directed shape change over the time scale of hours. Perhaps more important than a global shift in cell morphology, our data show a homogenization of cell morphologies between tissue microenvironments and cluster locations upon EF1 knockdown, akin to that observed in the non-transformed fibroblasts.

EwS morphological cell state displays context-specific plasticity. A schematic representing findings. High EF1-expressing EwS cells show a change in morphological state or organization according to seeding site or location within a cluster. Low expression of EF1 causes a shift towards more protrusive cell state and reduced sensitivity to some tissue environmental cues but not others, suggesting EF1 enables site-specific specialization of cancer cells. In contrast, non-transformed fibroblasts display highly heterogeneous cell morphologies regardless of extrinsic cues.
EwS morphological cell state displays context-specific plasticity. A schematic representing findings. High EF1-expressing EwS cells show a change in morphological state or organization according to seeding site or location within a cluster. Low expression of EF1 causes a shift towards more protrusive cell state and reduced sensitivity to some tissue environmental cues but not others, suggesting EF1 enables site-specific specialization of cancer cells. In contrast, non-transformed fibroblasts display highly heterogeneous cell morphologies regardless of extrinsic cues.
Based on these results, we propose EwS cells through expression of EF1 acquire a “high-plasticity cell state” (HPCS), as recently identified in lung cancer (Marjanovic et al., 2020). A transition into an HPCS allows EwS cells to adapt to distinct tissue microenvironments. Low expression of EF1 confers a loss of plasticity and reduced proliferation, which are properties associated with a more differentiated cell state. Our interpretation of EF1 as a plasticity-enabling factor is complementary to models in the EwS field, which suggest that modulation of levels of EF1 can enable switch-like behavior from proliferative to migratory states (Franzetti et al., 2017; Aynaud et al., 2020). This prediction rests on the ability of the proposed zebrafish system to probe cellular response to perturbation superimposed to environmental variation, a paradigm that would be otherwise experimentally inaccessible. Future work will now systematically exploit this experimental system to determine the molecular underpinnings of an EF1-driven cell plasticity.
Limitations and future prospects
While this work represents a significant advance in characterizing cell adaptation to tissue microenvironments, several limitations of the current approach must be considered. First, while morphology can serve as a meaningful surrogate of functional cell state, it is a conglomerate of many mechanical (Kai et al., 2016; Baskaran et al., 2020; Park et al., 2020), biochemical (Bakal et al., 2007; Yin et al., 2013), and stochastic (Alizadeh et al., 2020) processes and therefore cannot inform on the specific pathways regulating cell behaviors such as plasticity. For a deeper understanding of the observed tissue-dependent cell differences, we will now have to introduce molecularly specific probes. Our pipeline already fulfills the requirements in terms of microscope resolution and sensitivity to perform analyses of subcellular molecular behaviors. Second, the throughput of the assay could be greatly enhanced if mosaic labeling was expanded to multicolor techniques such as brainbow (Livet et al., 2007). Third, while the zebrafish embryonic xenograft model confers many advantages, it is limited to the short timescale of 2–10 d after engraftment. To investigate longer-term cell adaptations, complementary similar approaches should be developed for adult immunocompromised zebrafish (Yan et al., 2019), organoid (Hartley and Brennand, 2017; Drost and Clevers, 2018), and murine cancer models (Lamprecht et al., 2017). Alternatively, the system could be used to investigate the effect of non-tumor stromal or immune cells using either genetic (Roh-Johnson et al., 2017; Povoa et al., 2021; Vasileva et al., 2022) or co-implantation (Liu et al., 2017; Pascoal et al., 2020) zebrafish models. Finally, the potential of this system will have to be validated on other cancer types.
Together the presented work establishes a framework for the statistically robust study of cancer cell plasticity to diverse microenvironmental cues and leads to the proposal of EF1-driven tissue-specific adaptation.
Materials and methods
Zebrafish husbandry
Danio rerio were maintained in an Aquaneering aquatics facility according to industry standards. Vertebrate animal work was carried out by protocols approved by the institutional animal care and use committee at UT Southwestern, an Association for Assessment and Accreditation of Laboratory Animal Care accredited institution. Wild Indian Karyotype (WIK) wild-type lines used were obtained from the Zebrafish International Resource Center (zebrafish.org).
Cell culture and cell line generation
Cells were cultured at 5% CO2 and 21% O2. TC32 and TC71 cells were cultured using RPMI (Gibco) supplemented with 10% FBS and 1% antibiotic antimycotic. NIH-3T3 cells were cultured using DMEM (Gibco) supplemented with 10% FBS and 1% antibiotic antimycotic. TC32 shRNA lines cells were generated using the pZIP shRNA Promoter selection kit (https://www.transomic.com/cms/home.aspx/). EF1 shRNA targets the C-terminal region of Fli1, and the C shRNA is a scrambled sequence (Table S3). shRNA cells were cultured using RPMI (Gibco) supplemented with 10% FBS and 1% antibiotic antimycotic. shRNA knockdown was induced by 1 µg/ml doxycycline in cell culture 48 h prior to injection, and 10 µg/ml doxycycline in E3 fish larval growth medium 24 h following injection, and shRNA knockdown was verified by Western blotting using rabbit anti-Fli1 (ab15289; Abcam; Fig. S3).
Fluorescent constructs were introduced into cells using the pLVX lentiviral system (Clontech) and selected using antibiotic resistance to either puromycin or neomycin. The GFP-FTractin and mRuby2-FTractin constructs contain residues 9–52 of the enzyme IPTKA30 fused to eGFP or mRuby2, respectively. pLenti6-H2B-mCherry was acquired from Addgene (generated by Wittmann lab, University of California, San Francisco, plasmid #89766; Addgene; Pemble et al., 2017).
Xenografts
For xenografts of NIH-3T3, TC71, and TC32 cells, preparation of cell mixture consisted of 99 or 90% mRuby2-Ftractin labeled cells and 1 or 10% GFP-FTractin labeled cells, for HBV and PVS, or CHT, respectively. These ratios were chosen to achieve optimum number of isolated cells not contacting other cells within a cluster. Cell mixtures (2 × 10⁶ cells) were run through a 70-µm cell strainer and resuspended in 5% FBS in PBS mixture for optimal cell viability.
Zebrafish embryos were collected, dechorionated, and treated with 0.1 mM phenylthiourea starting at 24 h post fertilization to prevent pigmentation. Xenografts were generated by microinjection of cell mixture into zebrafish larvae (2 d post fertilization [dpf]) with glass capillary needles into PVS or HBV. For each cell xenograft group, cells were injected into 3-aminobenzoic acid ethyl ester (Tricaine)–anesthetized embryos. For PVS injections, larvae with cells disseminated to the CHT through passive pressure through the vasculature during injection were identified under a fluorescent stereomicroscope 1 h after injections. This helped us (1) to increase the throughput of imaging by having two seeding sites within one embryo and (2) to select specifically for seeding-site-specific cell adaptation rather than selection of a potentially more migratory population from the primary site of injection. Injected zebrafish larvae were incubated for 1–2 d in 34°C before imaging.
Immunofluorescence
For immunostaining of zebrafish larvae, anesthetized embryos were fixed in 4% paraformaldehyde/1XPBS for 2 h in scintillation vials, rinsed in PBS +0.5% Tween, and stored in PBS up to 2 wk. Immunostaining was carried out as previously described (Miller et al., 2015). Primary antibodies were rabbit anti-GFP (ab290; Abcam) and mouse anti-Phospho-Histone H3 (9706S; Cell Signaling). TUNEL assay was performed using the ApopTag Green In-Situ Apoptosis Detection Kit (Millipore). Xenografted fish were immunostained for GFP prior to high-resolution imaging of single cells.
Human tumor histology
EwS tissue samples were obtained as part of standard clinical management. All histology samples were evaluated by an expert sarcoma pathologist.
Imaging
Light-sheet fluorescence microscopes were used to image the zebrafish larvae. Fixed zebrafish larvae were embedded in 1% low-melting agarose into sonicated, ethanol-washed fluorinated ethylene propylene tubes (Zeus, HS 029EXP/ .018 REC). The tube is held by a custom-made mount, which allows 3D translation and rotation in our light-sheet microscopes.
For high-resolution 3D imaging of cell morphologies, ASLM was developed as previously described (Dean et al., 2015; Isogai et al., 2019 Preprint). Briefly, a 25×, NA 1.1 water-dipping objective (CFI75 Apo 25XC W; Nikon Instruments) was used for detection, in combination with a 500-mm focal length achromatic convex lens (49-396; Edmund Optics), which formed the image with a total magnification of 62.5× on an sCMOS camera (ORCA-Flash4.0; Hamamatsu Photonics). A 28.6× NA 0.7 water-dipping objective (54-10-7@488–910 nm; Special Optics) was used for light-sheet illumination. In our ASLM set-up, the resolution is ∼300 nm laterally and 450 nm axially over a 200 × 100 µm2 field of view, in its raw form (without applying image deconvolution algorithms).
For imaging of immunostained fish larvae, a conventional mSPIM (Huisken and Stainier, 2007) was used as previously described (Murali et al., 2019). Briefly, a 16× NA 0.8 water-dipping objective (CFI75 LWD 16XW; Nikon Instruments) was used for detection, at room temperature in PBS. A 200-mm focal length tube lens (58-520; Edmund Optics) that formed the image on an sCMOS camera (ORCA-Flash4.0; Hamamatsu Photonics). The theoretical lateral resolution was ∼350–400 nm, but the course sampling with 16× magnification afforded for only 800–1000 nm practical resolution. A 10× NA 0.28 objective (M Plan Apo 10×, 378-803-3; Mitutoyo) was used for light-sheet illumination. The thickness and the length of the light-sheet were controlled by a variable slit (VA100C; Thorlabs) placed at the conjugate plane of the back focal plane of the illumination objective. Usually, we adjust the variable slit to create a light-sheet with a thickness of 3–4 µm, which has a length of ∼400 µm to cover a large field of view. Under these conditions, the axial resolution was estimated at 1.4 µm.
For live imaging of fish larvae, we swapped the detection objective in mSPIM to a 40× NA 0.8 water-dipping objective (CFI Apo NIR 40XW; Nikon Instruments). These conditions provide a resolution of 380 nm laterally and about 1.4 µm axially. The sample chamber was filled with E3 medium and temperature was controlled at 32°C as a compromise temperature between the zebrafish embryos and injected cells (Cabezas-Sainz et al., 2021).
Image processing
For high-resolution 3D image processing, regions of interest around individual cells were detected automatically using thresholding of the smoothed image (σ = 5, thresholded at 5%) and computing the connected components to isolate volumes of single-cell image volumes from the raw data image. In some cases, additional user-aided cropping was done using ImageJ. We then applied drift correction using the StackReg plugin (Thevenaz et al., 1998) in ImageJ (Schindelin et al., 2012) to counter sample movement in Z during acquisition, via MIJ, a java package for running ImageJ within MATLAB. Finally, we applied deconvolution to all images prior to segmentation, using blind deconvolution with a synthesized point spread function with 10 iterations in MATLAB.
Segmentation and geometric feature extraction
For 3D morphology classification, we employed a 3D morphology pipeline described in Driscoll et al. (2019) to segment cell volumes from deconvoluted single-cell image volumes. For the segmentation process, we smoothed the deconvoluted images with a 3D Gaussian kernel (σ = 3 pixels) and applied a gamma correction (ϒ = 0.7), then employed an Otsu threshold, followed by a 3D grayscale flood-fill operation to fill possible holes. Disconnected parts from the main image were removed. The binary images of all cells were visually inspected for segmentation artifacts. Miss-segmented cells were excluded from the data set.
Computation 3D shape descriptors require parameters including volume, surface area, 3D convex hull, minimum circumscribed sphere, and maximum inscribed sphere. The basic shape descriptors of segmented cells were computed using “regionprops3” in MATLAB. Other features were calculated based on the formulas indicated in Table S1. These features included but were not limited to roughness, various definitions of sphericity, and 3D aspect ratio. The post-processing, segmentation, and geometric feature extraction pipelines are accessible through the Danuser lab (https://github.com/DanuserLab/3dCellShape).
For location within clusters, the region of interest detectors described above was reused to isolate segmented volumes. Individual cell surfaces were extracted from cell volumes using Surfaces maps from 3D Object Counter plugin in Fiji (Bolte and Cordelieres, 2006). Measurements of percent of contact with other cells were made based on measurements of colocalization of the surfaces of the subsequent binary images. These were compared to individual geometric features as captured by the 3D morphology pipeline described above.
For quantification of proliferation and apoptosis within clusters, we utilized manually aided threshold-based segmentation followed by 3D Objects Counter plugin (Bolte and Cordelieres, 2006) in ImageJ. Size of cluster or touching objects was estimated by dividing the measured volume of the object by the measured volume of an isolated object (e.g., PH3-labeled nucleus) within the same fish.
For quantification of change in cluster size over 3 d (Fig. S2, a–d), segmentation of areas of interest and measurements of changes in area were done in Cell Profiler (McQuin et al., 2018). Simulations of reduced axial resolution (Fig. S2 a) achieved through use of Gaussian blurring in the z-dimension (σ = 3 pixels) did not hinder distinction between experimental groups (Fig. S5 e).
Statistics and visualizations
Violin plots, boxplots, and scatter plots of individual features at the cell level or fish level and corresponding statistical tests were performed in GraphPad Prism 9. Outliers for individual parameters were found by ROUT method (Q = 1%) and excluded from the analysis. To address sample variability, fish-level data points were generated based on the median of each geometrical feature per fish per region. Sample sizes are provided in figure legends.
For multivariable statistical analysis, PCA, scatter plots of PCs, and biplot were applied or generated in MATLAB. For visualization purpose, we defined the geometrical classes using the unsupervised learning k-means clustering algorithm in 2D PCA space and calculated the contribution of each geometrical class in each experimental condition by hierarchical clustering. We identified the clusters by K-means and determined the number k of clusters subject to maximizing the silhouette score in the range of 3–10 clusters. Bagplots were generated in MATLAB as described in Verboven (2010).
Similarity matrices were based on pairwise permutation P values between different conditions. The metric used for permutation test (n = 1,500 iterations) was the Tukey median of each distribution in PC space, as defined by Rousseeuw et al. (1999).
For timelapse data, pseudocolored projection outlines of segmented images were made using the “Analyze Particles” tool followed by the Temporal-Color Code plug-in in ImageJ. To map images of cells acquired on mSPIM to previous dataset, images were interpolated in 3D to match pixel size of images acquired on ASLM. Median Jump Size and Persistence were measured in 3D PC space. In cases where individual timepoints were removed due to segmentation errors, the morphological feature step size was replaced by the average step size for that trajectory. Permutation P value was calculated based on 3D center of mass in PC space.
Similarity matrices were based on pairwise permutation P values between different conditions. The metric used for permutation test (n = 1,500 iterations) was the Tukey median of each distribution, as defined by Rousseeuw et al. (1999).
3D surface renderings of single cells were created with ChimeraX (Goddard et al., 2018) as described in Driscoll et al. (2019). Rendering of microscopy set-up was created with AutoCad (Autodesk). 3D rendering in Fig. S2 was created with Amira software (Thermo Fisher Scientific). Schematics were created with BioRender.com.
Online supplemental material
Fig. S1 relates to Fig. 1 and provides evaluation of PCA method and relative contribution of features. Fig. S2 relates to Fig. 1 and demonstrates through simulation and experimental results that geometric feature measurement is robust to changes in microscope resolution. Fig. S3 relates to Fig. 3 and provides metrics of growth as a function of tissue microenvironment. Fig. S4 relates to Fig. 5 and provides additional patient histology samples and visualization of pseudorosette-like structures in the xenografts in fish, as well as visualization of volume and sphericity as a function of contact with other cells in TC71 cells. Fig. S5 relates to Fig. 6 and demonstrates efficient knockdown of EF1 and changes in actin architecture upon doxycycline induction, and permutation P value tables of C vs. EF1 shRNA data. Video 1 provides a 3D rendering and visualization of data showing pseudorosette-like structures in the HBV, and Video 2 shows the same organization is maintained upon loss of EF1. Video 3 provides an example of a live cell changing its shape over time. Table S1 describes the mathematical definition of the 12 global shape features used, and Table S2 shows permutation P values across parameter variations, demonstrating robustness to segmentation parameters. Table S3 provides the sequences for the shRNA constructs used.
Acknowledgments
We would like to thank Meghan Driscoll, Erik Welf, David Saucier, Jungsik Noh, Jaewon Huh, and Marcel Mettlen for fruitful discussion and help with image analysis. We would also like to thank David McFadden (inducible shRNA lines), Ralph Deberardinis (TC32 cell line), Sandra Schmid (NIH-3T3 cell line), and Angelique Whitehurst (TC71 cell line) labs (UT Southwestern, Dallas, TX) for sharing reagents.
Funding for this work in the Danuser lab has been provided through R35 GM136428 (National Institute of General Medical Sciences) and microscope development in the Fiolka lab has been supported by R33 CA235254 (National Cancer Institute). D. Segal acknowledges funding from European Molecular Biology Organization Long-term Research Fellowship (ALTF 626-2018). G. Danuser, R. Fiolka, and J. Amatruda are jointly funded by the grant U54 CA268072 (National Cancer Institute).
The authors declare no competing financial interests.
Author contributions: Conceptualization: D. Segal, G. Danuser, and J.F. Amatruda, Methodology: D. Segal, H. Mazloom-Farsibaf, and B.-J. Chang, Investigation: D. Segal, H. Mazloom-Farsibaf, B.-J. Chang , P. Roudot, M. Warren, D. Rajendran, and S. Daetwyler, Writing: D. Segal, G. Danuser, and J.F. Amatruda, Funding Acquisition: D. Segal, G. Danuser, J.F. Amatruda, and R. Fiolka, Resources: G. Danuser, J.F. Amatruda, and R. Fiolka, Supervision: G. Danuser and J.F. Amatruda.

