


While much is known about how transcription is controlled at individual genes, comparatively little is known about how cells regulate gene expression on a genome-wide level. Here, we identify a molecular pathway in the C. elegans germline that controls transcription globally in response to nutritional stress. We report that when embryos hatch into L1 larvae, they sense the nutritional status of their environment, and if food is unavailable, they repress gene expression via a global chromatin compaction (GCC) pathway. GCC is triggered by the energy-sensing kinase AMPK and is mediated by a novel mechanism that involves the topoisomerase II/condensin II axis acting upstream of heterochromatin assembly. When the GCC pathway is inactivated, then transcription persists during starvation. These results define a new mode of whole-genome control of transcription.
Introduction
Sixty years have passed since Jacob and Monod produced a paradigm for the molecular control of gene expression (Jacob and Monod, 1961), and in that time much has been learned about how individual genes, or small stretches of genes, are up- and down-regulated. Far less is known, however, about how gene expression is controlled at larger scales, for example, at the level of whole genomes. During early development, genome activation is observed at the maternal-to-zygotic transition (Vastenhouw et al., 2019). In Drosophila melanogaster, a key factor driving genome activation at the maternal-to-zygotic transition is Zelda, a transcription factor that up-regulates hundreds of genes and appears to function via chromatin accessibility (Schulz and Harrison, 2019). Genome activation is also observed in human lymphocytes and is driven by c-Myc, which functions to amplify the low level of genome output upon lymphocyte activation (Nie et al., 2012; Percharde et al., 2017).
The studies on Zelda and c-Myc highlight how gene expression is up-regulated on a global basis, and other studies have described how genome output can be globally repressed. One example of genome repression is found in Caenorhabditis elegans, where the PIE-1 protein interferes with activation of RNA polymerase II (RNAPII) to repress gene expression during germline specification in the early embryo (Robert et al., 2015). Loss of PIE-1 allows transcription in germline progenitors, and this, in turn, promotes an exclusively somatic fate for these cells. Interestingly, while the PIE-1 protein itself is not conserved in other animals, its mechanism of action is conserved (Robert et al., 2015). A different form of whole-genome repression has recently been reported for quiescent yeast cells (Swygert et al., 2019). In this system, the chromosome condensation factor condensin remodels chromatin into transcriptionally repressive loop domains; however, it is not yet known if yeast condensin acts alone to globally repress the genome, or if it is one component of a more complex pathway.
Recent work from our laboratory has examined genome activation, repression, and reactivation in the C. elegans primordial germ cells Z2 and Z3 (Z2/Z3; Butuči et al., 2015; Wong et al., 2018). Z2/Z3 are born during early embryogenesis, and soon after their birth, the PIE-1 protein is degraded (Mello et al., 1996), allowing transcription to be activated for the first time in this lineage (Seydoux and Dunn, 1997). Earlier studies had suggested that after a period of transcriptional activity in embryonic Z2/Z3, the genome becomes repressed again (Furuhashi et al., 2010). However, as detailed below, we find that once PIE-1 is degraded, then Z2/Z3 maintain transcriptional competence for the remainder of embryogenesis and through hatching into L1 larvae. If new L1 larvae are maintained in nutrient-free media, however, then transcription is globally repressed through a heretofore undefined mechanism (Butuči et al., 2015; Wong et al., 2018). Previous work from our group has shown that the Z2/Z3 chromatin in starved L1 manifests as tightly compacted bundles that are positioned exclusively at the nuclear periphery, leaving the center of the nucleus devoid of chromatin (Wong et al., 2018). Once food is available, a remarkable series of events unfold that eventually lead to the global reactivation of germline transcription. In a nutrient-dependent manner, the DNA cleavage enzyme topoisomerase II (TOP-2) is activated, and it goes on to produce numerous stable DNA double-strand breaks (DSBs) throughout the genome (Butuči et al., 2015; Wong et al., 2018). The role of the DSBs is to recruit the AAA+ ATPase and chromatin decompacting factor RUVB-1/2 complex to DNA, and the chromatin is then decompacted. Decompaction leads to a loosening of the bundles and a relocalization of some chromatin from the periphery to the center. More importantly, decompaction allows for genome reactivation, and when decompaction fails, for example after inactivation of TOP-2 or RUVB-1/2, then transcription remains repressed (Wong et al., 2018). Thus, our work, and work from others, presents a fascinating picture whereby the nematode germline genome goes through repeated cycles of repression and activation. The genome is initially repressed via PIE-1 in the early embryo, then activated via degradation of PIE-1, then repressed again during starvation via the mechanism detailed below, and finally reactivated when food is present via the DSB-mediated pathway discussed above.
In the current study, we have focused on how the germline genome is repressed during starvation. We find that repression occurs through the activity of a global chromatin compaction (GCC) pathway. By combining genetics with cytology, we identify the components of the GCC pathway and order their activities within the pathway, thereby defining a new mechanism of global transcriptional repression.
Results
Germline chromatin compaction is developmentally regulated and occurs over two stages
In starved L1s, Z2/Z3 chromatin manifests as globular bundles positioned at the nuclear periphery (Fig. 1 A, panel “starved L1”; also see Wong et al., 2018). This can be visualized in living samples using a transgene encoding mCherry-tagged histone H2B (Fig. 1 A), and previous work has shown that when DNA is stained directly in living samples, the pattern is identical (Wong et al., 2018). Our first question was when does germline chromatin first assume this unusual and highly compacted state? To answer this, we took single plane images of Z2/Z3 nuclei from living animals of different developmental stages. We divided the nuclear space into two compartments: an outer compartment (89% of the surface area) and an inner compartment (11%; Fig. 1 B) and quantified the fraction of chromatin that falls into the inner compartment. In germline progenitor cells (P lineage), the chromatin was decompacted and diffuse, with ∼14% of the chromatin signal located in the inner compartment (Fig. 1, A and C). At the ∼100-cell stage, or ∼150 min after zygote cleavage, P4 divided to form Z2/Z3. Shortly after birth, Z2/Z3 chromatin architecture was not noticeably different from the P lineage (Fig. 1 A, panel “Z2/Z3 early”; see also Fig. 1 C); however, by the end of gastrulation, there was a significant change as the chromatin became more compacted and the center of the nucleus lost signal (Fig. 1, A and C). This state persisted through the comma and 1.5-fold stages of embryogenesis. We could not evaluate older embryos due to the onset of muscle twitching that precluded image capture. However, the pattern was not significantly different in freshly hatched L1s (heretofore referred to as “new L1s”) from that observed in 1.5-fold–stage embryos (Fig. 1, A and C). Importantly, however, after overnight starvation, the chromatin became significantly more compacted, with tighter bundles at the periphery and just ∼4% of the chromatin signal located in the inner compartment (Fig. 1, A and C). These data reveal a two-stage compaction process for germline chromatin, where stage I occurs during late embryogenesis and stage II occurs after hatching and during starvation.
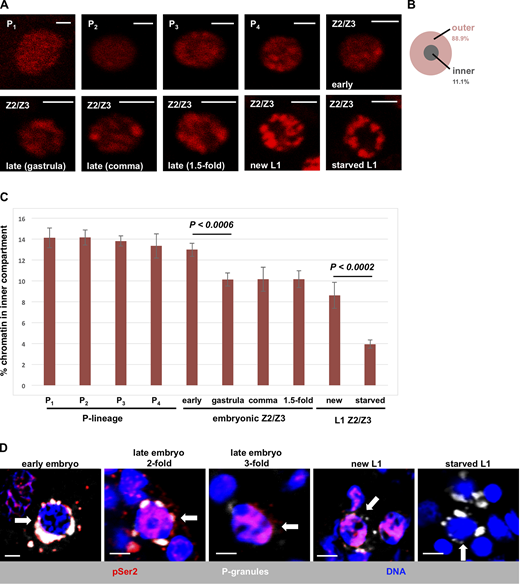
Developmental timing of chromatin compaction in C. elegans primordial germ cells.(A) Germ cell nuclei in living WMM1 embryos of various stages were imaged for chromatin compaction using an mCherry-tagged histone H2B. Scale bar represents a length of 2 µm (n = 8). (B) Schematic showing the two regions of the nucleus used for quantification in subsequent figures. (C) Quantification of the data presented in A. Vertical axis represents the percentage of pixels in the inner compartment described in B, and the horizontal axis presents germ cell nuclei at different stages of development. Error bars represent one standard deviation. P values were obtained using the Student’s t test. (D) Germ cell nuclei of N2 embryos and larvae at various developmental stages were fixed and stained for P-granules (white), RNAPII (pSer2; red), and DNA (blue). Representative images are shown, with white arrows pointing to P3 in the first panel and Z2/Z3 in the remaining panels. The number of samples examined ranged from 10 (early embryos) to 22 (starved L1s). See Table S1 for a summary of pSer2 signal intensities across the entire dataset.
Developmental timing of chromatin compaction in C. elegans primordial germ cells.(A) Germ cell nuclei in living WMM1 embryos of various stages were imaged for chromatin compaction using an mCherry-tagged histone H2B. Scale bar represents a length of 2 µm (n = 8). (B) Schematic showing the two regions of the nucleus used for quantification in subsequent figures. (C) Quantification of the data presented in A. Vertical axis represents the percentage of pixels in the inner compartment described in B, and the horizontal axis presents germ cell nuclei at different stages of development. Error bars represent one standard deviation. P values were obtained using the Student’s t test. (D) Germ cell nuclei of N2 embryos and larvae at various developmental stages were fixed and stained for P-granules (white), RNAPII (pSer2; red), and DNA (blue). Representative images are shown, with white arrows pointing to P3 in the first panel and Z2/Z3 in the remaining panels. The number of samples examined ranged from 10 (early embryos) to 22 (starved L1s). See Table S1 for a summary of pSer2 signal intensities across the entire dataset.
We next wanted to correlate chromatin compaction with the transcriptional status of Z2/Z3 at various developmental stages. For this, we performed immunofluorescence microscopy using an antibody that recognizes phospho-Serine 2 (pSer2) within the heptad repeats of the RNAPII C-terminal domain. The presence of the pSer2 epitope corresponds to active and elongating RNAPII (Palancade and Bensaude, 2003). Consistent with previous reports, we found that cells of the P lineage in early embryos lacked active RNAPII (Seydoux and Dunn, 1997), whereas the pSer2 epitope was present in Z2/Z3 of all embryonic stages and was also present in new L1s (Fig. 1 D). By stark contrast, however, when starved L1s were examined, we observed that pSer2 was no longer detectable (Fig. 1 D). Thus, during L1 starvation, the chromatin becomes significantly compacted and transcription is globally repressed. We note that a previous study did not observe active RNAPII in Z2/Z3 of late embryos (Furuhashi et al., 2010). We suspect that this discrepancy lies in the different antibodies used to monitor pSer2. The previous study used a mouse monoclonal of the IgM subtype (H5), whereas we used a rabbit monoclonal of the IgG subtype; thus, it may be that the bulkier IgM antibody was unable to access RNAPII as efficiently as the IgG version used here. We note that the rabbit antibody used here was validated by us for specificity (Fig. S1). It thus appears that once PIE-1 is degraded, Z2/Z3 are transcriptionally active through their hatching into L1 larvae, and only upon starvation is transcription globally repressed.

pSer2 antibody reactivity requires the presence of phosphorylated RNA polymerase II. Embryos were fixed and stained for P-granules (green), pSer2 (red), and DNA (blue). Both ama-1 RNAi treatment (which depletes RNAPII) and calf intestine phosphatase treatment result in the loss of pSer2 signal. Thus, the pSer2 signal is dependent on the presence of phosphorylated RNAPII. Scale bar represents a length of 2 µm.
pSer2 antibody reactivity requires the presence of phosphorylated RNA polymerase II. Embryos were fixed and stained for P-granules (green), pSer2 (red), and DNA (blue). Both ama-1 RNAi treatment (which depletes RNAPII) and calf intestine phosphatase treatment result in the loss of pSer2 signal. Thus, the pSer2 signal is dependent on the presence of phosphorylated RNAPII. Scale bar represents a length of 2 µm.
Both the TOP-2/condensin II axis and the heterochromatin pathway are required for germline chromatin compaction during starvation
To learn more about how germline chromatin gets compacted during starvation, we used RNAi to screen known chromatin compaction factors for a role in this process. Animals were treated with feeding RNAi against the target gene, and their progenies were tested for Z2/Z3 chromatin compaction after L1 starvation. As shown in Fig. 2 A and quantified in Fig. 2 C, depletion of the condensin II subunit CAPG-2 resulted in hypocompacted chromatin. The bundles that normally form were diffuse, and chromatin was readily observed in the center of the nucleus, consistent with previous results (Wong et al., 2018). Similar data were obtained when the KLE-2 subunit of condensin II was targeted (Figs. S2 A and 2 C). We next examined TOP-2, as previous work has shown that TOP-2 and condensin II work collaboratively to resolve sister chromatids and compact chromatin in preparation for mitosis (Coelho et al., 2003; Cuvier and Hirano, 2003; Shintomi et al., 2015; Charbin et al., 2014). Like condensin II, depletion of TOP-2 resulted in hypocompacted chromatin (Figs. S2 A and 2 C). We conclude that the TOP-2/condensin II axis is required for the acute chromatin compaction that occurs during L1 starvation.

The TOP-2/condensin II axis and heterochromatin pathway are required for Z2/Z3 chromatin compaction. (A) Strain WMM1 was treated with either control or capg-2 RNAi, and F1s born from these animals were starved upon hatching. Z2/Z3 nuclei of the starved L1s were then imaged for chromatin compaction. (n = 20). (B) Same as A except samples were treated with cec-4 RNAi and not capg-2 RNAi. (C) Chromatin compaction was quantified in starved L1s born from strain WMM1 that was treated with either capg-2, kle-2, top-2, hpl-2, cec-4, or mys-1 RNAi, as indicated. Each gene-targeted RNAi was accompanied by a control RNAi; thus, the data are presented as pairs of control and gene-targeted samples. Error bars represent one standard deviation (n = 20). (D) Strain WMM1 was treated with either control or capg-2 RNAi, and F1s born from these animals were examined. Z2/Z3 nuclei of the new L1s were imaged for chromatin compaction. (n = 20). (E) Same as D except samples were treated with cec-4 RNAi and not capg-2 RNAi. (F) Chromatin compaction was quantified in new L1s born from strain WMM1 that was treated with either capg-2, top-2, hpl-2, and cec-4 RNAi. Data are presented as in C. Error bars represent one standard deviation (n = 20). Scale bar represents a length of 2 µm.
The TOP-2/condensin II axis and heterochromatin pathway are required for Z2/Z3 chromatin compaction. (A) Strain WMM1 was treated with either control or capg-2 RNAi, and F1s born from these animals were starved upon hatching. Z2/Z3 nuclei of the starved L1s were then imaged for chromatin compaction. (n = 20). (B) Same as A except samples were treated with cec-4 RNAi and not capg-2 RNAi. (C) Chromatin compaction was quantified in starved L1s born from strain WMM1 that was treated with either capg-2, kle-2, top-2, hpl-2, cec-4, or mys-1 RNAi, as indicated. Each gene-targeted RNAi was accompanied by a control RNAi; thus, the data are presented as pairs of control and gene-targeted samples. Error bars represent one standard deviation (n = 20). (D) Strain WMM1 was treated with either control or capg-2 RNAi, and F1s born from these animals were examined. Z2/Z3 nuclei of the new L1s were imaged for chromatin compaction. (n = 20). (E) Same as D except samples were treated with cec-4 RNAi and not capg-2 RNAi. (F) Chromatin compaction was quantified in new L1s born from strain WMM1 that was treated with either capg-2, top-2, hpl-2, and cec-4 RNAi. Data are presented as in C. Error bars represent one standard deviation (n = 20). Scale bar represents a length of 2 µm.

The TOP-2/condensin II axis and heterochromatin pathway are required for Z2/Z3 chromatin compaction. (A) Samples were treated as in Fig. 2 A except the indicated RNAi was used. (B) Samples were treated as in Fig. 2 D except the indicated RNAi was used. (C) Starved N2 and RB2301 (cec-4−/−) L1s were stained with Hoechst 33342 DNA dye and live-imaged for Z2/Z3 chromatin compaction. Quantification is shown below. Error bars represent one standard deviation (n = 20). (D) Somatic cells in the vicinity of Z2/Z3 in starved L1s, born from strain WMM1 that was treated with either control or cec-4 RNAi, were imaged for chromatin compaction. Quantification is shown below. Error bars represent one standard deviation (n = 20). Scale bar represents a length of 2 µm.
The TOP-2/condensin II axis and heterochromatin pathway are required for Z2/Z3 chromatin compaction. (A) Samples were treated as in Fig. 2 A except the indicated RNAi was used. (B) Samples were treated as in Fig. 2 D except the indicated RNAi was used. (C) Starved N2 and RB2301 (cec-4−/−) L1s were stained with Hoechst 33342 DNA dye and live-imaged for Z2/Z3 chromatin compaction. Quantification is shown below. Error bars represent one standard deviation (n = 20). (D) Somatic cells in the vicinity of Z2/Z3 in starved L1s, born from strain WMM1 that was treated with either control or cec-4 RNAi, were imaged for chromatin compaction. Quantification is shown below. Error bars represent one standard deviation (n = 20). Scale bar represents a length of 2 µm.
We next searched for additional components of the compaction mechanism. One system with a well-known role in compacting chromatin is the heterochromatin pathway (Ahringer and Gasser, 2018), and recent work in C. elegans has identified CEC-4, an integral component of the inner nuclear envelope that binds the H3K9 methyl (H3K9me) marks found in heterochromatin (Gonzalez-Sandoval et al., 2015). CEC-4 was of interest given that Z2/Z3 chromatin in starved L1s is packed up against the inner face of the nuclear envelope. As shown in Fig. 2, B and C, loss of CEC-4 prevented compaction during L1 starvation, as the bundles became diffuse and were no longer organized at the nuclear periphery. To substantiate this important finding, we examined a cec-4 knockout strain, RB2301, and visualized Z2/Z3 chromatin by direct staining of the DNA with Hoechst 33342 dye in living samples. Relative to the wild-type strain, RB2301 showed disorganized Z2/Z3 chromatin similar to cec-4(RNAi) animals (Fig. S2 B). This effect was germline specific, as chromatin architecture in somatic nuclei was not impacted by the depletion of CEC-4 (Fig. S2 C). We also examined another H3K9me “reader” protein, HPL-2 (an HP1 orthologue), and observed that chromatin compaction in starved L1s was perturbed (Figs. S2 A and 2 C). Lastly, we wanted to be certain that defects in Z2/Z3 chromatin compaction are not linked to activation of the RNAi response against an endogenous gene, and this was confirmed when animals treated with RNAi against mys-1 showed normal compaction during L1 starvation (Figs. S2 A and 2 C).
Data shown thus far indicate that Z2/Z3 chromatin is remodeled during both late embryonic development (stage I compaction) and then again during L1 starvation (stage II compaction) and that components of both the TOP-2/condensin II and heterochromatin pathways are required for the final compacted state in starved L1s. We next asked if loss of either TOP-2/condensin II or the heterochromatin pathway would affect stage I compaction, and we did so by analyzing new L1s. As shown in Fig. 2, D–F, loss of both CAPG-2 and TOP-2 had a significant effect on stage I compaction, whereas depletion of the heterochromatin component CEC-4 or HPL-2 had no effect. It thus appears that the TOP-2/condensin II axis is active during stage I and the heterochromatin pathway acts specifically during stage II. This is reasonable, as stage I compaction may simply reflect the normal chromosome condensation that occurs during G2/prophase as cells prepare for mitosis, an event known to require TOP-2/condensin II. These data also suggest that stage II compaction is somehow linked to successful completion of stage I, as otherwise one might expect a higher degree of stage II compaction in samples depleted for the TOP-2/condensin II axis. Indeed, as detailed below, this turns out to be the case.
The TOP-2/condensin II axis is required for deposition of H3K9me marks in Z2/Z3 chromatin
To pursue these observations, we next stained embryos for a canonical heterochromatin mark, trimethylation of H3 on lysine 9 (H3K9me3; Ahringer and Gasser, 2018). In early (pregastrulation) embryos, H3K9me3 is found in small patches that are typically positioned at the nuclear periphery (Towbin et al., 2012). This is what we observed for both germline progenitor and somatic cells of the early embryo (Fig. S3, A and B). Later in development, the H3K9me3 signal for early Z2/Z3 (i.e., just after their birth, during early gastrulation) remained similar in intensity to somatic nuclei (Fig. S3, A and B); however by late gastrulation, the H3K9me3 signals in Z2/Z3 became uniformly larger and had spread to the nuclear interior, whereas the soma remained unchanged (Fig. S3, A and B). The increased H3K9me3 signal intensity in Z2/Z3 persisted through the remainder of embryogenesis (Fig. S3 B). Thus, there appears to be a differential deposition of H3K9me3 in germline versus soma in embryos, and this first becomes apparent during late gastrulation.
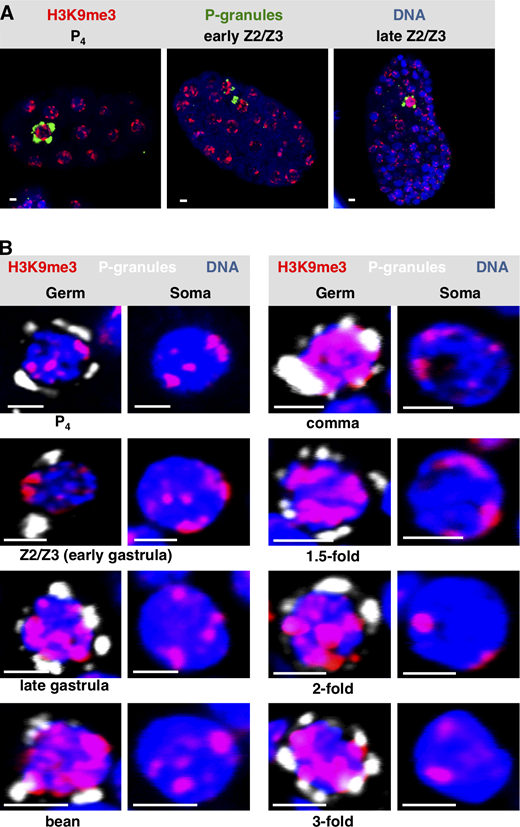
Widespread H3K9 methylation is observed as chromatin compaction starts in C. elegans PGCs.(A)C. elegans embryos at different embryonic stages were fixed and stained for P-granules (green), H3K9me3 (red), and DNA (blue). Representative whole-embryo images are shown. (B) Same as A except only Z2/Z3 (germ) or a neighboring somatic cell (soma) is shown. The developmental stage of the embryo from which the image was taken is indicated (n = 20). See Table S1 for a summary of signal intensities. Scale bar represents a length of 2 µm.
Widespread H3K9 methylation is observed as chromatin compaction starts in C. elegans PGCs.(A)C. elegans embryos at different embryonic stages were fixed and stained for P-granules (green), H3K9me3 (red), and DNA (blue). Representative whole-embryo images are shown. (B) Same as A except only Z2/Z3 (germ) or a neighboring somatic cell (soma) is shown. The developmental stage of the embryo from which the image was taken is indicated (n = 20). See Table S1 for a summary of signal intensities. Scale bar represents a length of 2 µm.
We next examined starved L1s for both H3K9me2 and H3K9me3 and observed that the signals were again much stronger in Z2/Z3 than in nearby somatic nuclei (Fig. 3 A, panel “N2”). Previous work has shown that H3K9me2/3 deposition in the worm is controlled by two methyltransferases, MET-2 and SET-25 (Ahringer and Gasser, 2018), and indeed when mutants for these methyltransferases were examined, we saw a decrease in Z2/Z3 signal intensity (Fig. 3 A). More specifically, we observed that H3K9me2 and me3 were both compromised in met-2 mutants and me3 was compromised in set-25 mutants. When both genes were depleted by RNAi, then both me2 and me3 marks were attenuated. Both H3K9me2 and me3 appeared normal in a strain deficient for SET-32, a putative H3K9me3 methyltransferase (Fig. 3 A; Ahringer and Gasser, 2018). These data show that both MET-2 and SET-25 are required for H3K9me2 and me3 deposition in Z2/Z3. We next asked if these methyltransferases are required for Z2/Z3 chromatin compaction. RNAi-mediated depletion of either methyltransferase alone or a double depletion of both enzymes resulted in compaction defects in starved L1s, but not new L1s (Fig. S4). These data show that while MET-2/SET-25 act during late embryogenesis to hypermethylate H3K9 in Z2/Z3, the effect of attenuation of these enzymes is not realized until embryos have hatched and L1s have starved. This is consistent with our finding that the H3K9me reader proteins CEC-4 and HPL-2 act specifically during L1 starvation (Fig. 2).
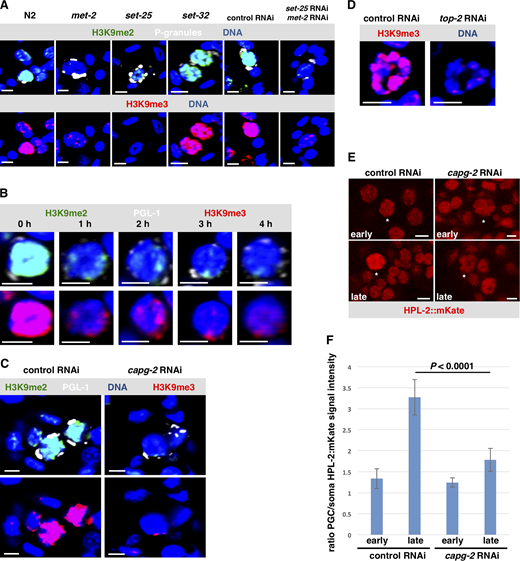
A TOP-2/condensin II–dependent increase in heterochromatin marks coincides with chromatin compaction in Z2/Z3.(A) Wild-type starved L1s and starved L1s that were defective for methyltransferases (mutants for met-2, set-25, set-32, and F1s from animals treated with met-2/set-25 double RNAi) were fixed and stained for P-granules (white), H3K9me2 (green), H3K9me3 (red), and DNA (blue). (n = 40). See Table S1 for a summary of signal intensities. (B) L1s were either starved or fed for a varying amount of time. Samples were then fixed and stained for P-granules (white), H3K9me3 (red), H3K9me2 (green), and DNA (blue). Representative images are shown. (n = 40). See Table S1 for a summary of signal intensities. (C) Starved L1s, born from strain N2 treated with either control RNAi or capg-2 RNAi, were fixed and stained for P-granules (white), H3K9me2 (green), H3K9me3 (red), and DNA (blue). Representative images are shown (n = 40). See Table S1 for a summary of signal intensities. (D) Starved L1s, born from strain N2 treated with either control or top-2 RNAi, were fixed and stained for H3K9me3 (red) and DNA (blue). Representative images are shown (n = 40). See Table S1 for a summary of signal intensities. (E) Worms that express HPL-2::mKate were optionally treated with control and capg-2 RNAi. Live embryos were extracted and were imaged for HPL-2 signal. The white star identifies Z2/Z3. Representative images are shown (n = 20). (F) Quantification of HPL-2::mKate signal from the images taken in E. Error bars represent one standard deviation. Scale bar represents a length of 2 µm.
A TOP-2/condensin II–dependent increase in heterochromatin marks coincides with chromatin compaction in Z2/Z3.(A) Wild-type starved L1s and starved L1s that were defective for methyltransferases (mutants for met-2, set-25, set-32, and F1s from animals treated with met-2/set-25 double RNAi) were fixed and stained for P-granules (white), H3K9me2 (green), H3K9me3 (red), and DNA (blue). (n = 40). See Table S1 for a summary of signal intensities. (B) L1s were either starved or fed for a varying amount of time. Samples were then fixed and stained for P-granules (white), H3K9me3 (red), H3K9me2 (green), and DNA (blue). Representative images are shown. (n = 40). See Table S1 for a summary of signal intensities. (C) Starved L1s, born from strain N2 treated with either control RNAi or capg-2 RNAi, were fixed and stained for P-granules (white), H3K9me2 (green), H3K9me3 (red), and DNA (blue). Representative images are shown (n = 40). See Table S1 for a summary of signal intensities. (D) Starved L1s, born from strain N2 treated with either control or top-2 RNAi, were fixed and stained for H3K9me3 (red) and DNA (blue). Representative images are shown (n = 40). See Table S1 for a summary of signal intensities. (E) Worms that express HPL-2::mKate were optionally treated with control and capg-2 RNAi. Live embryos were extracted and were imaged for HPL-2 signal. The white star identifies Z2/Z3. Representative images are shown (n = 20). (F) Quantification of HPL-2::mKate signal from the images taken in E. Error bars represent one standard deviation. Scale bar represents a length of 2 µm.

Both H3K9 methyltransferases, MET-2 and SET-25, are needed for chromatin compaction in starved L1s. New and starved L1s born from strain WMM1 treated with either control RNAi, met-2 RNAi, or set-25 RNAi or met-2/set-25 double RNAi were used. Z2/Z3 from the L1s were imaged for chromatin compaction. Representative images are shown. Compaction was also quantified and shown below images. Error bars represent one standard deviation (n = 20). Scale bar represents a length of 2 µm.
Both H3K9 methyltransferases, MET-2 and SET-25, are needed for chromatin compaction in starved L1s. New and starved L1s born from strain WMM1 treated with either control RNAi, met-2 RNAi, or set-25 RNAi or met-2/set-25 double RNAi were used. Z2/Z3 from the L1s were imaged for chromatin compaction. Representative images are shown. Compaction was also quantified and shown below images. Error bars represent one standard deviation (n = 20). Scale bar represents a length of 2 µm.
Our data show that H3K9me marks accumulate in Z2/Z3 during late embryogenesis and persist within the chromatin through hatching and during L1 starvation, thereby linking H3K9me deposition to the chromatin compaction that occurs at these times. If deposition of these marks is truly linked to the compacted state of the chromatin, then, we predicted, they would be removed upon chromatin decompaction during L1 feeding. Indeed, as shown in Fig. 3 B, upon feeding, both H3K9me2 and me3 were rapidly erased, with just a few patches of peripherally located signals remaining after only 1 h. We conclude that as Z2/Z3 compact their chromatin in late embryos, H3K9me2/3 marks become intensely enriched, and during nutrient-dependent decompaction in feeding L1s, the marks are rapidly lost.
Our data identify two systems, the TOP-2/condensin II axis and the heterochromatin pathway, as required for germline chromatin compaction. Previous work has linked condensin and heterochromatin in compaction, in both plants and C. elegans adult germ cells (Wang et al., 2017; Llères et al., 2017). However, how the two systems are organized to promote compaction was not known. We therefore asked if depletion of capg-2 would impact the widespread deposition of H3K9me marks that normally occurs on Z2/Z3 chromatin in starved L1s. Adult animals were exposed to control or capg-2 RNAi, and their progeny was examined for both H3K9me2 and me3. We observed, surprisingly, that only very low levels of H3K9me2/3 marks were found in the CAPG-2–depleted samples (Fig. 3 C), and similar results were observed after depletion of TOP-2 (Fig. 3 D). These data implicate the TOP-2/condensin II axis as acting upstream of MET-2 and SET-25 to promote H3K9 methylation; however, because this was an unanticipated result, we performed a second, independent experiment to confirm it. We used a transgenic line expressing mKate-tagged HPL-2 and imaged living samples for HPL-2 signal intensity in Z2/Z3. As shown in Fig. 3, E and F, for control samples the HPL-2 signal intensity was similar between Z2/Z3 and somatic nuclei in early embryos but elevated in Z2/Z3 relative to the soma in late embryos. This is consistent with the onset of heterochromatin assembly occurring in Z2/Z3 of late embryos. By contrast, in capg-2(RNAi) samples, the Z2/Z3 signal intensity, relative to soma, did not go up nearly as much in late embryos (Fig. 3, E and F), and this is consistent with a failure to accumulate the H3K9me2/3 marks to which HPL-2 binds. These data place the TOP-2/condensin II axis upstream of H3K9me deposition during germline chromatin compaction. This pathway is, to our knowledge, the first to be described that combines the activities of two well-studied compaction processes into a singular, linear pathway that compacts chromatin on a global scale. As such, we have given this new pathway a name: the GCC pathway.
GCC is required for transcriptional repression during L1 starvation
Data in Fig. 1 show that gene expression in Z2/Z3 is globally repressed during L1 starvation. We therefore next asked if this transcriptional quiescence is due to GCC. We depleted GCC components and scored Z2/Z3 in starved L1s for transcription activity by RNAPII pSer2 staining, as in Fig. 1 D. By stark contrast to control samples, depletion of the GCC pathway components CAPG-2, CEC-4, and MET-2/SET-25 resulted in transcriptionally active Z2/Z3 nuclei (Fig. 4, A and B). Thus, loss of the GCC pathway leads to RNAPII activation in starved L1s. We next examined individual genes for misexpression in Z2/Z3, using RNA–fluorescence in situ hybridization (Choi et al., 2016) to detect the presence of their transcripts in starved L1s. Previous work from our group has shown that wago-1 and cgh-1 transcripts are absent in starved L1s and then expressed in Z2/Z3 after L1s have fed (Wong et al., 2018). We also probed for xnd-1, a germline-specific transcript as a marker for Z2/Z3 (Wong et al., 2018; Mainpal et al., 2015). As shown in Fig. 4 C, only a small subset of starved wild-type L1s showed expression of wago-1 or cgh-1, consistent with previous results (Wong et al., 2018). However, in starved cec-4(RNAi) or met-2/set-25(RNAi) L1s, expression of both genes was readily apparent (Fig. 4 C), with 90–100% of the samples found to contain the transcripts. Similar results were obtained with two additional genes that we had previously shown to be up-regulated in Z2/Z3 after feeding, ifet-1 and car-1 (Wong et al., 2018). These genes were mostly silent in control samples but were up-regulated in top-2(RNAi) L1s (Fig. 4 D). Thus, across multiple components of the GCC pathway (TOP-2, CAPG-2, CEC-4, and MET-2/SET-25), we see that depletion leads to both activation of RNAPII and promiscuous gene expression in the primordial germ cells (PGCs) of starved L1s. We conclude that the GCC pathway represses gene expression globally in Z2/Z3 during L1 starvation.

Aberrant germline transcription is observed when GCC components are depleted. (A) Starved L1s, born from strain N2 that had been treated with either control RNAi or capg-2 RNAi, were fixed and stained for P-granules (P-gran.; white), DNA (blue), and RNAPII (pSer2; green). The number of pSer2-positive samples is shown below (n = 20). (B) Starved L1s, born from strain N2 that had been treated with either control RNAi, cec-4 RNAi, or met-2/set25 RNAi, were fixed and stained for P-granules (green), DNA (blue), and activated RNAPII (pSer2; red). The number of samples that were positive for pSer2 signal is shown below (n = 40). (C) Starved L1s, born from strain N2 that had been treated with either control RNAi, cec-4 RNAi, or met-2/set25 RNAi, were used in this experiment. In situ HCR was performed by probing for wago-1 (red) and cgh-1 (white). DNA was visualized using Hoechst 33342 dye (blue), and xnd-1 (green) was used to identify Z2/Z3. The white dashed lines correspond to the nuclei. Percentage of samples positive for each gene is shown on the right (n = 40). (D) Starved L1s, born from strain N2 that had been treated with either control or top-2 RNAi were used. HCR for xnd-1 (green), ifet-1 (red), and car-1 (white) was performed. DNA was visualized using Hoechst 33342 dye (blue). Percentage of samples positive for each gene is shown on the right (n = 25). Scale bar represents a length of 2 µm.
Aberrant germline transcription is observed when GCC components are depleted. (A) Starved L1s, born from strain N2 that had been treated with either control RNAi or capg-2 RNAi, were fixed and stained for P-granules (P-gran.; white), DNA (blue), and RNAPII (pSer2; green). The number of pSer2-positive samples is shown below (n = 20). (B) Starved L1s, born from strain N2 that had been treated with either control RNAi, cec-4 RNAi, or met-2/set25 RNAi, were fixed and stained for P-granules (green), DNA (blue), and activated RNAPII (pSer2; red). The number of samples that were positive for pSer2 signal is shown below (n = 40). (C) Starved L1s, born from strain N2 that had been treated with either control RNAi, cec-4 RNAi, or met-2/set25 RNAi, were used in this experiment. In situ HCR was performed by probing for wago-1 (red) and cgh-1 (white). DNA was visualized using Hoechst 33342 dye (blue), and xnd-1 (green) was used to identify Z2/Z3. The white dashed lines correspond to the nuclei. Percentage of samples positive for each gene is shown on the right (n = 40). (D) Starved L1s, born from strain N2 that had been treated with either control or top-2 RNAi were used. HCR for xnd-1 (green), ifet-1 (red), and car-1 (white) was performed. DNA was visualized using Hoechst 33342 dye (blue). Percentage of samples positive for each gene is shown on the right (n = 25). Scale bar represents a length of 2 µm.
The energy-sensing kinase AMP-activated kinase (AMPK) acts as an upstream trigger for GCC
Having discovered the GCC pathway and shown that it is required for global transcriptional repression during L1 starvation, we moved on to determine the upstream trigger for this starvation-induced repression. Prior studies have shown that loss of the energy sensor AMPK results in premature division of Z2 and Z3 during L1 starvation (Demoinet et al., 2017; Fukuyama et al., 2012), a process our group has shown to require transcriptional activity (Butuči et al., 2015; Wong et al., 2018). Therefore, given its role in the maintenance of cellular quiescence during starvation, we reasoned that the upstream trigger for GCC could be AMPK. To test this, we assessed GCC in animals that had been depleted of the AMPK subunits aak-1 and aak-2 using dual RNAi. As shown in Fig. 5 A, loss of AMPK had a strong impact on stage II compaction in starved L1s. Stage I compaction, however, was unaffected (Fig. 5 B). We also asked if depletion of AMPK would trigger premature activation of RNAPII in starved Z2/Z3 and found that it did (Fig. 5 C). These results place AMPK in the GCC pathway and suggest that AMPK senses the reduction in energy charge during L1 starvation and, in response, activates GCC to preserve transcriptional quiescence in the germ cells. We note that one additional phenotype that has been reported for an aak-1/aak-2 double-knockout strain is that of Z2/Z3 cell division during L1 starvation (Demoinet et al., 2017; Fukuyama et al., 2012). In the aak-1/2 RNAi experiments shown in Figs. 2 and 5, we looked carefully for more than two PGCs during L1 starvation, but we did not encounter this phenotype, and this is likely due to the hypomorphic effect of RNAi.

GCC pathway and its activator AMPK are required for the nascent germline to survive nutritional stress. (A) Chromatin compaction was quantified in starved L1s born from strain WMM1 that was treated with either control or aak-1/2 RNAi. Quantification is shown below. Error bars represent one standard deviation (n = 20). (B) Chromatin compaction was quantified in new L1s born from strain WMM1 that was treated with either control or aak-1/2 RNAi. Quantification is shown below. Error bars represent one standard deviation (n = 20). (C) Starved L1s, born from strain N2 that had been treated with either control RNAi or aak-1/2 RNAi, were fixed and stained for P-granules (P-gran.; white), DNA (blue), and RNAPII (pSer2; red). The number of pSer2-positive samples is shown below (n = 20). Scale bar represents a length of 2 µm.
GCC pathway and its activator AMPK are required for the nascent germline to survive nutritional stress. (A) Chromatin compaction was quantified in starved L1s born from strain WMM1 that was treated with either control or aak-1/2 RNAi. Quantification is shown below. Error bars represent one standard deviation (n = 20). (B) Chromatin compaction was quantified in new L1s born from strain WMM1 that was treated with either control or aak-1/2 RNAi. Quantification is shown below. Error bars represent one standard deviation (n = 20). (C) Starved L1s, born from strain N2 that had been treated with either control RNAi or aak-1/2 RNAi, were fixed and stained for P-granules (P-gran.; white), DNA (blue), and RNAPII (pSer2; red). The number of pSer2-positive samples is shown below (n = 20). Scale bar represents a length of 2 µm.
Discussion
The data reported here and elsewhere have revealed a remarkable cycle of genome-wide activation, repression, and reactivation of transcription in the developing C. elegans germline (summarized in Fig. 6). The Z2/Z3 genome is activated for the first time after PIE-1 is degraded, and in our studies, the genome remains active throughout the remainder of embryogenesis. Transcription in the germline persists upon the hatching of embryos into L1 larvae; however, if nutrients are not available, then a severe compaction of the germline chromatin occurs that is coincident with, and required for, the global repression of gene expression. GCC in the germline requires the energy-sensing kinase AMPK, as well as the heterochromatin components CEC-4 and HPL-2. Germline chromatin remains compacted and repressed until L1 larvae encounter nutrients. Nutrients, in an unknown manner, then trigger activation of TOP-2 to produce numerous DSBs in the Z2/Z3 genome, an act that is required for chromatin decompaction and genome reactivation (Fig. 6; Butuči et al., 2015; Wong et al., 2018). Thus, in a time frame that can be as short as 20 h, the nascent germline genome is activated, repressed, and then reactivated.

Summary of events that comprise a genome activation-repression-reactivation cycle in the developing C. elegans germline. Please see main text for details.
Summary of events that comprise a genome activation-repression-reactivation cycle in the developing C. elegans germline. Please see main text for details.
In this study, we have delved deeper into how GCC occurs in the germline. We have obtained evidence for a two-step process, whereby germline chromatin is remodeled and compacted in the late embryo during stage I compaction and the chromatin is then more extensively compacted during stage II, which occurs when L1s undergo starvation. Stage I compaction requires the TOP-2/condensin II axis, and this is likely a manifestation of the normal chromatin remodeling that occurs after cells have finished DNA replication and are preparing for mitosis. There are, however, a couple of twists. First, we have observed a hyperaccumulation of the repressive H3K9me chromatin mark during stage I compaction. Remarkably, we found that deposition of H3K9me is controlled by the TOP-2/condensin axis. We do not yet understand how TOP-2/condensin regulates H3K9 methylation, but it is intriguing to speculate that this process is linked to DNA replication. Previous studies have shown that condensin-mediated compaction is tightly coupled to replication in the C. elegans embryo (Sonneville et al., 2015); thus, it is possible that passage of the replication fork triggers condensin-mediated compaction and H3K9me deposition. Indeed, preliminary results from our laboratory have shown that DNA replication is complete by late gastrulation (data not shown), which is when H3K9me deposition is maximal (Fig. S3 B). How this process is specific for germline chromatin is a fascinating question. The other twist is that stage I compaction in Z2/Z3 initiates at the time of gastrulation, as though the cells are preparing for mitosis, and then everything just stops. The cells arrest in a G2-like state with partially compacted chromatin, and this state persists through hatching. The means by which Z2/Z3 arrest the cell cycle is an important, unanswered question.
Upon hatching into a nutrient-free environment, Z2/Z3 chromatin will eventually become hypercompacted (stage II compaction). This level of compaction is sufficient to repress germline transcription and is dependent on members of the heterochromatin pathway (MET-2, SET-25, CEC-4, and HPL-2). One fascinating feature of stage II compaction is its dependence on AMPK, which likely acts as an energy sensor that communicates the lack of nutrients to the chromatin compaction machinery. Another fascinating property of this system is that although the H3K9me marks are present in the late embryo, CEC-4 and HPL-2 are incapable of acting upon them until embryos hatch and L1s starve. Thus, it may be that AMPK initiates a signaling cascade that ultimately regulates CEC-4/HPL-2 to drive GCC. To our knowledge, this is a rare example of chromatin compaction operating under metabolic control; thus, unraveling the molecular mechanism for how CEC-4 and HPL-2 are regulated is a high priority.
Lastly, it is important to consider the physiological rationale for why the germline genome would undergo these cycles of repression-activation-repression-reactivation. The initial repression in early embryos is crucial for the P lineage to remain competent for germline fate (Robert et al., 2015). It is unclear what role genome activation plays upon Z2/Z3 birth, but one possibility is that germline transcription is needed to allow DNA replication, or perhaps it is needed for Z2/Z3 internalization during gastrulation (Chihara and Nance, 2012). Upon L1 starvation, the germline genome is again repressed, and one possible reason for this is that it serves to prevent Z2/Z3 cell division when nutrients are absent Indeed, it has been shown that loss of AMPK triggers Z2/Z3 division during starvation (Demoinet et al., 2017; Fukuyama et al., 2012), and we showed previously that transcription is required for Z2/Z3 division after feeding (Butuči et al., 2015). Thus, it may be that germline proliferation during starvation is inherently risky, and thus the GCC mechanism for repression described here has evolved to prevent this from happening.
Materials and methods
Animals
N2 (wild-type), WMM1 ([pie-1::gfp::pgl-1 + unc-119(+)]; [(pAA64)pie-1p::mCherry::his-58 + unc-119(+)] IV), MT13293(met-2(n4256) III), MT17463 (set-25(n5021) III), VC967 (set-32(ok1457) I), RB2301 (F32E10.2(ok3124) IV), and OH14220 (hpl-2(ot860[hpl-2::mKate2]) III) strains were used in this study. All C. elegans strains were obtained fromCaenorhabditis Genetics Center or generated in our laboratory. Worms were maintained on 60-mm plates containing nematode growth media (NGM) seeded with the Escherichia coli strain OP50. Worms were grown at either 20°C or 24°C and propagated by bleaching or chunking.
Bacterial strains
OP50 bacteria served as the main food source. They were grown in Luria-Bertani (LB) broth containing 100 μg/ml streptomycin by shaking at 37°C overnight. 500 μl of the culture was seeded on Petri dishes containing NGM + streptomycin. Most of our RNAi strains were obtained from the Ahringer library and verified by Sanger sequencing. An RNAi feeding vector containing the entire hpl-2 (isoform 3) coding sequence was ordered from Genewiz and was transformed into HT115 (DE3) cells that were made competent by CaCl2 incubation. Bacteria were then streaked on LB-agar plates containing 100 μg/ml carbenicillin and 12.5 μg/ml tetracycline and incubated at 37°C overnight. Single colonies were picked and grown in 25 ml LB cultures with 100 μg/ml carbenicillin and 12.5 μg/ml tetracycline. 500 μl of this culture was seeded on 60-mm Petri dishes containing 5 mM IPTG.
Egg preparation
Bleach solution (3.675 ml H2O, 1.2 ml NaOCl, and 0.125 ml NaOH) was prepared. Adult worms were washed from plates using 5 ml M9 minimal medium (22 mM KH2PO4, 22 mM Na2HPO4, 85 mM NaCl, and 2 mM MgSO4). Worms were then spun down at 1,900 rpm for 1 min. Excess minimal medium was removed, and the bleach solution was added. Eggs were extracted by vortexing for 30 s and shaking for 1 min. This was done a total of three times, and worms were vortexed one last time. Then the eggs were spun down at 1,900 rpm for 1 min and excess bleach solution was removed, and the eggs were washed three times with M9 medium.
RNAi treatment
Feeding RNAi–containing NGM plates were prepared as described above. met-2, set-25, ruvb-1, ruvb-2, and cec-4 feeding vectors were obtained from the Ahringer library, while the hpl-2 feeding vector was produced by us (see above). HT115 cells transformed with an empty pL4440 vector were used as a negative control for all RNAi experiments. RNAi conditions used in this study and tests for their efficacy are described below.
top-2 RNAi
L1 worms were plated on OP50 plates for the first 53 h and were then moved to plates seeded with top-2 RNAi for the remaining 7 h. Embryonic lethality was observed at ∼90%.
met-2/set-25 RNAi
L1s were plated on OP50 plates for 12 h at 24°C. Then worms were transferred to control and met-2 RNAi plates and were incubated for 24 h. Finally, the worms were transferred from met-2 RNAi plates to set-25 RNAi plates and grown for another 24 h till they were gravid adults. When worms were grown at room temperature, the time on OP50 was extended to 24 h, keeping the RNAi treatment times constant. Once the worms were gravid, they were bleached and left overnight to hatch. Under these conditions, embryonic lethality was 15%.
hpl-2 RNAi
L1s were directly plated onto NGM plates seeded with hpl-2 RNAi and were grown for their whole life until they were gravid adults. Worms were then bleached, and eggs were left to hatch overnight. Embryonic lethality was ∼14%.
cec-4 RNAi
Worms were grown on cec-4 RNAi plates until gravid, after which they were bleached. F1 animals were hatched overnight. Embryonic lethality (∼25%) and defects in Z2/Z3 chromatin compaction were used to ensure RNAi efficacy.
capg-2 RNAi
Worms were grown on OP50 plates for the first 44 h at 24°C and were moved to plates containing capg-2 RNAi for the remaining 16 h. An embryonic lethality of 80–90% was seen with this RNAi treatment.
kle-2 RNAi
Worms were initially grown on food plates and transferred to kle-2 RNAi plates for the final 12 h till they were gravid adults. An embryonic lethality ranging from 45% to 75% was observed in our experiments.
aak-1/2 RNAi
Worms were grown on plates containing a 1:1 mixture of aak-1 and aak-2 RNAi (referred to as aak-1/2 RNAi) until they were gravid adults. A 12–16% embryonic lethality was seen for these samples.
Antibodies and dilutions
P-granules: Mouse Mab K76 (subtype: IgM) from Developmental Studies Hybridoma Bank (RRID: AB_531836; DSHB) was used at a dilution of 1:20. H3K9me2: Mouse antibody (subtype: IgG1) from Molecular and Biological Laboratories (MABI0317; MBL) was used at 1:1,000. H3K9me3: Rabbit antibody from Abcam (ab176916) was used at 1:1,000. RNAPII pSer2: Rabbit antibody from Abcam (ab5095) was used at 1:100. The following secondary antibodies were used: Alexa Fluor–conjugated secondary antibodies from Invitrogen (Thermo Fisher Scientific) were used at a dilution of 1:200.
Immunofluorescence staining
Animals were first washed with Milli-Q water twice and then spotted on poly-L-lysine–covered slides and let rest for 10 min. Coverslips were applied, and slides were put on dry ice for 25 min. Samples were then freeze-cracked by flicking the coverslips off for permeabilization. Once permeabilized, slides were put in 100% methanol (at −20°C) for 10 s and then fixing solution (0.08 M Hepes, pH 6.9, 1.6 mM MgSO4, 0.8 mM EGTA, 3.7% formaldehyde, and 1X phosphate-buffered saline) for 10 min. After fixing, slides were washed three times with TBS-T (TBS with 0.1% Tween-20) and were blocked for 2 h with Tris-NaCl blocking (TNB) solution supplemented with 1:10 normal goat serum. Primary antibodies were then applied at the dilutions described above in TNB, and slides were incubated at 4°C overnight. The next day, primary antibodies were washed three times with TBS, and slides were incubated with secondary antibodies and Hoechst 33342 dye for 2 h at room temperature. When two mouse primary antibodies were used in the same experiment, it was made sure that they were of different subtypes. Subtype-specific secondary antibodies were then employed so that the distinct antigens could be visualized without signal overlap. Slides were washed three more times with TBS. Mounting medium (50% glycerol in PBS) and coverslip were applied and sealed with Cytoseal XYL (Thermo Fisher Scientific).
RNA fluorescence in situ hybridization (in situ hybridized chain reaction [HCR])
A kit containing a DNA probe set, DNA HCR amplifier hairpins, and hybridization, wash, and amplification buffers was purchased from Molecular Instruments (https://www.molecularinstruments.com). Genes that were examined were wago-1, cgh-1, ifet-1, and car-1. A germline-specific gene, xnd-1, was used to mark the primordial germ cells, and Hoechst 33342 dye was used to visualize DNA. Samples were permeabilized using 4% PFA and were stored at −80°C for at least 1 d. Samples were then treated with Proteinase K (100 μg/ml) for 10 min at 37°C and were washed twice with PBS-T. Samples were treated with 2 mg/ml glycine for 15 min on ice and washed twice with PBS-T. A 1:1 solution of probe hybridization buffer and PBS-T was added to the samples, and they were incubated for 5 min at room temperature. Samples were then prehybridized with probe hybridization buffer for 30 min at 37°C, and DNA probes (2 pmol of each) were added to the samples and were incubated overnight at 37°C. The next day, samples were washed with probe wash buffer at 37°C and with 5xSSCT at room temperature. Samples were then preamplified with amplification buffer for 30 min at room temperature. Probe amplifier hairpins were snap cooled and added to the sample. Worms were incubated with the hairpins overnight. On the final day, samples were washed with 5xSSCT at room temperature and incubated with Hoechst 33342 (1:5,000 dilution) for 15 min. Finally, samples were mounted on poly-L-lysine–coated slides and imaged.
Live-animal imaging
WMM1 and OH14220 samples were treated as needed for the experiments. To image embryos, gravid WMM1 adults were bleached, and the resulting embryos were washed multiple times with M9 medium. 0.3% agarose pads were made on slides, and ∼10 μl embryos was mounted on them. A coverslip was gently applied, and slides were imaged.
To image new L1s
Gravid WMM1 adults were bleached in the morning. The resulting embryos were washed three times with M9 medium and were left in M9 for ∼5 h until some of the embryos hatched. Once L1s were observed, 0.3% agarose pads were made on slides, and ∼5 μl of L1s was mounted. A similar volume of 1 M tetramisole hydrochloride was added to stop the larvae from moving. The coverslip was gently applied, and the slides were imaged.
To image starved L1s
Gravid WMM1 adults were bleached. The resulting embryos were washed three times with M9 medium and were left overnight in M9 to hatch. The next day, 0.3% agarose pads were made on slides, and ∼5 μl of L1s was mounted. A similar volume of 1 M Tetramisole hydrochloride was added to stop the larvae from moving. The coverslip was gently applied, and the slides were imaged. Identical results were observed when 10 mM sodium azide was used instead of tetramisole hydrochloride as an anesthetic (see also Wong et al., 2018).
Hoechst staining of live animals
Gravid adults were bleached, and embryos were left overnight in M9 minimal medium to hatch. The next day, L1s were spun down at 1,900 rpm and transferred to Eppendorf tubes. The remaining M9 was aspirated, and worms were incubated with 100 μl of SDS-DTT (804 μl 0.31% SDS and 196 μl of DTT) for 4 min. Worms were washed with 1 ml of M9 and then incubated with 1 ml of 1:5,000 Hoechst 33342 dye for 15 min. Worms were spun down, mounted on slides with agar pads, and imaged.
Immunofluorescent imaging
All samples were imaged at room temperature with an Olympus Fluoview FV1000 confocal microscope using Fluoview Viewer software. Images were captured at 600× magnification (60× objective and 10× eye piece magnification). Laser intensity was controlled for experiments to achieve consistency among samples. Images were then processed using ImageJ software for further analysis.
Quantification and statistical analysis
GCC assay quantification
Analysis of chromatin compaction was done as described in Wong et al. (2018). In brief, single-plane images were analyzed using ImageJ. Using the “Oval” tool, an ellipse was drawn tightly around the chromatin, and the total pixel amount was measured and recorded. Then a smaller ellipse was made by reducing the radii of the original ellipse to one third of its size. This smaller ellipse was positioned at the darkest area at the center of the nucleus. The number of pixels in that area, which is roughly 11% of that of the original ellipse, was measured. The fraction of chromatin in the inner 11% was calculated by dividing the pixel counts in the smaller ellipse by the pixel count of the original ellipse. Data are presented as the percentage of chromatin that falls into the inner compartment.
HPL-2::mKate signal quantification
To quantify HPL-2::mKate signal, whole-embryo images were analyzed using ImageJ. Z2/Z3 were identified in the images by cell size and position. Once Z2/Z3 were identified, an ellipse was drawn around them using the Oval tool. The number of pixels was measured and recorded. Then, the ellipse was moved to an empty area to measure the background signal. The actual HPL-2::mKate signal was calculated by subtracting the background signal from the signal in Z2/Z3. This was also done for a neighboring somatic cell of comparable size. Then, we calculated the ratio of Z2/Z3 HPL-2::mKate signal to that of the somatic cell. Data are presented as the fold difference of the Z2/Z3 signal with respect to the somatic signal.
Statistical analysis
Data were analyzed using either a Student’s t test or Wilcoxon rank sum test depending on whether the datasets fulfilled the requirements for a parametric test or not. This was determined by using the Shapiro-Wilk test for normal distribution and F-test to test for variance homogeneity of the datasets we were comparing. Differences between two datasets were considered significant if a P value of <0.05 was obtained.
Online supplemental material
Fig. S1 shows the specificity of the antibody used to recognize active RNAPII in this study. Fig. S2 contains various data from assays for compaction relevant to Fig. 2. Fig. S3 shows that H3K9 hypermethylation coincides with the onset of chromatin compaction in Z2/Z3. Fig. S4 shows more chromatin compaction assays relevant to Fig. 2. Table S1 contains qualitative signal intensity measures for the immunofluorescence staining data shown in this study.
Acknowledgments
We thank Nicole Francis for helpful discussions.
This work was funded by a grant from the National Institutes of Health (R01GM127477) to W.M. Michael.
The authors declare no competing financial interests.
Author contributions: W.M. Michael acquired funding and conceptualized the project. W.M. Michael and M.D. Belew designed experiments. M.D. Belew, E. Chien, M. Wong, and W.M. Michael performed experiments. W.M. Michael and M.D. Belew wrote the manuscript.

