


Micronuclei, whole or fragmented chromosomes spatially separated from the main nucleus, are associated with genomic instability and have been identified as drivers of tumorigenesis. Paradoxically, Kif18a mutant mice produce micronuclei due to asynchronous segregation of unaligned chromosomes in vivo but do not develop spontaneous tumors. We report here that micronuclei in Kif18a mutant mice form stable nuclear envelopes. Challenging Kif18a mutant mice via deletion of the Trp53 gene led to formation of thymic lymphoma with elevated levels of micronuclei. However, loss of Kif18a had modest or no effect on survival of Trp53 homozygotes and heterozygotes, respectively. Micronuclei in cultured KIF18A KO cells form stable nuclear envelopes characterized by increased recruitment of nuclear envelope components and successful expansion of decondensing chromatin compared with those induced by nocodazole washout or radiation. Lagging chromosomes were also positioned closer to the main chromatin masses in KIF18A KO cells. These data suggest that not all micronuclei actively promote tumorigenesis.
Introduction
Micronuclei contain chromosomes that are excluded from the main nucleus and are used clinically as a biomarker to evaluate genomic instability (Fenech and Morley, 1985; Tolbert et al., 1992; Dertinger et al., 1996; Fenech, 2000; Bonassi et al., 2007; Imle et al., 2009; Fenech et al., 2011; Luzhna et al., 2013). Micronuclei are widely associated with chromosomally unstable tumors and poor patient prognosis (Bonassi et al., 2007; Imle et al., 2009; Fenech et al., 2011; Luzhna et al., 2013). Growing evidence demonstrates that micronuclei are not only passive markers but also active drivers of genomic instability, although the specific conditions required for this transformation are not fully elucidated (Stephens et al., 2011; Rausch et al., 2012; Holland and Cleveland, 2012; Crasta et al., 2012; Nones et al., 2014; Zhang et al., 2015; Luijten et al., 2018).
Micronuclei can arise due to various errors occurring during the cell cycle, including improper attachments between microtubules and kinetochores, DNA replication errors, and unrepaired DNA damage (Fenech and Morley, 1985; Cimini et al., 2001; Hoffelder et al., 2004; Crasta et al., 2012). Chromosomes that become micronucleated can be whole or fragmented, and DNA content can be centromere-containing or acentric, with different mechanisms of micronucleus formation leading to varying levels of damage to the micronucleated DNA (Ding et al., 2003; Hoffelder et al., 2004; Terradas et al., 2009; Terradas et al., 2010; Huang et al., 2011; Crasta et al., 2012; Hatch et al., 2013; Zhang et al., 2015; Liu et al., 2018).
There are two widely accepted, nonmutually exclusive mechanisms that explain how a micronucleated chromosome may lead to genomic instability. First, micronucleated cells can enter mitosis with incompletely replicated chromosomes, which results in severe structural defects within the micronucleated chromosome and its reincorporation into the primary nucleus (Crasta et al., 2012; Holland and Cleveland, 2012; Jones and Jallepalli, 2012; Zhang et al., 2015). This catastrophic process, termed chromothripsis, is an early event in tumorigenesis and has been elegantly demonstrated in experiments pairing long-term imaging with single-cell whole-genome sequencing in cultured cells (Zhang et al., 2015). Furthermore, loss of micronuclear envelope integrity can lead to genomic instability by exposing the chromosome to damage in the cytoplasm (Hoffelder et al., 2004; Hatch et al., 2013; Zhang et al., 2015; Shah et al., 2017). While these events may follow one another along a shared pathway, this does not occur in all cases (Hatch et al., 2013; Zhang et al., 2015; He et al., 2019).
Recently, micronuclei were demonstrated to form as a result of chromosome alignment defects and asynchronous segregation during mitosis (Fonseca et al., 2019). In cells lacking the function of the kinesin KIF18A, chromosomes fail to properly align at the mitotic spindle equator, segregate in a disordered fashion, and display an increased probability of forming micronuclei (Fonseca et al., 2019). Furthermore, mice with inactivating mutations in Kif18a form micronuclei in vivo, with micronuclear incidence significantly elevated from levels of spontaneously occurring micronuclei in WT mice. Paradoxically, Kif18a mutant mice do not develop tumors spontaneously and are resistant to induced colitis-associated colorectal cancer (Zhu et al., 2013). These results raise questions about the conditions under which micronuclei might induce genomic instability and tumorigenesis in vivo. Kif18a mutant mice are a useful system for studying the effects of micronuclei in vivo since the level of aneuploidy observed in these mice is low, allowing separation of effects due to micronucleation from those caused by widespread aneuploidy (Czechanski et al., 2015; Fonseca et al., 2019).
It is possible that micronuclei in Kif18a mutant mice minimally impact genomic stability due to p53-dependent cell-cycle arrest or maintenance of micronuclear envelope stability. Activation of p53 in micronucleated cells has been observed to cause cell-cycle arrest in the subsequent G1 phase (Uetake and Sluder, 2010; Santaguida et al., 2017; Thompson and Compton, 2010), and micronucleated KIF18A knockout (KO) cells are subject to a p53-dependent cell-cycle arrest in culture (Fonseca et al., 2019). It is plausible, then, that micronuclei produced due to loss of Kif18a do not contribute to tumorigenesis in mice because a p53-dependent pathway prevents micronucleated cells from dividing further. In addition, recent studies have demonstrated that not all micronuclei undergo nuclear envelope rupture (Liu et al., 2018; He et al., 2019). Thus, it is also possible that micronuclei in Kif18a loss-of-function cells form stable nuclear envelopes, which could reduce their negative impact on genomic stability.
To investigate the effects of p53 status and micronuclear envelope stability on the impact of micronuclei in vivo, we developed a mouse model lacking Kif18a and p53 function. We found that micronuclei in cells with defective chromosome alignment formed robust micronuclear envelopes that rupture less frequently than those surrounding micronuclei formed due to improper kinetochore–microtubule attachments. These data indicate that the type of insult that leads to micronucleus formation can determine micronuclear stability, and we propose that intact micronuclei mitigate the overall risk to genome integrity in cells with chromosome alignment defects.
Results
Loss of Kif18a increases micronuclei in both normal tissues and thymic lymphomas of p53-null mice
Mice homozygous for the Kif18a mutation germ cell depletion 2 (gcd2) lack KIF18A activity and form micronuclei due to chromosome alignment defects in vivo (Czechanski et al., 2015; Fonseca et al., 2019). While Kif18agcd2/gcd2 mice are infertile due to mitotic defects during embryonic germline development, they do not develop spontaneous tumors (Czechanski et al., 2015).
Analyses of KIF18A KO retinal pigment epithelial (RPE1) cells indicated that micronucleated cells rarely entered mitosis (Fonseca et al., 2019). This arrest was at least partially dependent on p53, consistent with other reports of cell-cycle arrest following micronucleation (Sablina et al., 1998; Thompson and Compton, 2010; Fonseca et al., 2019). Thus, we reasoned that a p53-dependent mechanism could limit the impact of micronuclei on tumor induction or development in Kif18a mutant. To investigate this possibility, we crossed Kif18agcd2/+ mice with mice heterozygous for a p53-null mutation (Trp53tm1 Tyj/+) to produce mice heterozygous for both alleles. Kif18agcd2/+, Trp53tm1 Tyj/+ mice were crossed again to obtain mice homozygous and heterozygous for both Kif18a and Trp53 mutations (Fig. 1 A).

Kif18a mutant mice display similarly elevated levels of micronuclei in healthy tissues, regardless of p53 status.(A) Schematic of cross to generate Kif18agcd2, Trp53tm1 Tyj mice. (B) Quantification of micronucleated cells, as observed by Hoechst stain, in thymus, spleen, and liver tissues from healthy individuals homozygous for the Kif18Agcd2 mutation and with WT Trp53, Trp53tm1 Tyj/+, or Trp53tm1 Tyj/tm1 Tyj. n = 3 tissue types from one biological sample per each genotype. Percentages are the average from two independent counts of each tissue. Micronucleated cell counts were Kif18agcd2/gcd2, Trp53+/+, 83 of 1,317 in thymus, 119 of 2,587 in spleen, and 57 of 1,115 in liver; Kif18agcd2/gcd2, Trp53+/tm1 Tyj, 120 of 1,496 in thymus, 68 of 1,468 in spleen, and 41 of 735 in liver; and Kif18agcd2/gcd2, Trp53tm1 Tyj/tm1 Tyj, 36 of 602 in thymus, 97 of 2,410 in spleen, and 46 of 811 in liver (Table S1). (C) Representative images of micronuclei (yellow arrowheads) observed in healthy (left to right) thymus, spleen, and liver tissue sections from a Kif18agcd2/gcd2, p53+/+ mouse. (D) Plot showing percentages of micronucleated Ret (of total Ret) quantified via peripheral blood assay from male and female mice of genotypes Kif18agcd2/gcd2, Trp53tm1 Tyj/tm1Tyj (n = 8); Kif18agcd2/gcd2, Trp53+/+ (n = 8); Kif18agcd2/+, Trp53tm1 Tyj/tm1Tyj (n = 8); and Kif18a+/+, Trp53tm1 Tyj/tm1Tyj and Trp53+/+ (n = 8). Data points indicate individual biological replicates. Error bars represent SD. Statistical analysis was performed using pairwise ANOVA comparisons of means, α = 0.05. *, P < 0.01.
Kif18a mutant mice display similarly elevated levels of micronuclei in healthy tissues, regardless of p53 status.(A) Schematic of cross to generate Kif18agcd2, Trp53tm1 Tyj mice. (B) Quantification of micronucleated cells, as observed by Hoechst stain, in thymus, spleen, and liver tissues from healthy individuals homozygous for the Kif18Agcd2 mutation and with WT Trp53, Trp53tm1 Tyj/+, or Trp53tm1 Tyj/tm1 Tyj. n = 3 tissue types from one biological sample per each genotype. Percentages are the average from two independent counts of each tissue. Micronucleated cell counts were Kif18agcd2/gcd2, Trp53+/+, 83 of 1,317 in thymus, 119 of 2,587 in spleen, and 57 of 1,115 in liver; Kif18agcd2/gcd2, Trp53+/tm1 Tyj, 120 of 1,496 in thymus, 68 of 1,468 in spleen, and 41 of 735 in liver; and Kif18agcd2/gcd2, Trp53tm1 Tyj/tm1 Tyj, 36 of 602 in thymus, 97 of 2,410 in spleen, and 46 of 811 in liver (Table S1). (C) Representative images of micronuclei (yellow arrowheads) observed in healthy (left to right) thymus, spleen, and liver tissue sections from a Kif18agcd2/gcd2, p53+/+ mouse. (D) Plot showing percentages of micronucleated Ret (of total Ret) quantified via peripheral blood assay from male and female mice of genotypes Kif18agcd2/gcd2, Trp53tm1 Tyj/tm1Tyj (n = 8); Kif18agcd2/gcd2, Trp53+/+ (n = 8); Kif18agcd2/+, Trp53tm1 Tyj/tm1Tyj (n = 8); and Kif18a+/+, Trp53tm1 Tyj/tm1Tyj and Trp53+/+ (n = 8). Data points indicate individual biological replicates. Error bars represent SD. Statistical analysis was performed using pairwise ANOVA comparisons of means, α = 0.05. *, P < 0.01.
Micronuclei in Kif18a mutant mice were previously quantified in RBCs via flow cytometry (Fonseca et al., 2019). Interestingly, Kif18agcd2/gcd2 mice were found to have the same elevated level of spontaneous micronuclei in erythrocytes as ATMtm1 Awb/tm1 Awb mutant mice (Fonseca et al., 2019). Although the relative abundance of micronuclei is not significantly different between these two mouse models, Kif18agcd2/gcd2 mutant mice do not spontaneously form tumors, while the majority of ATMtm1 Awb/tm1 Awb mutant mice develop thymic lymphomas between 2 and 4 mo (Barlow et al., 1996). To confirm that micronuclei are present in other tissues, we analyzed thymus, spleen, and liver tissues from mice carrying Kif18a mutations in the presence or absence of Trp53. As expected, Kif18agcd2/gcd2 mice displayed elevated levels of micronuclei in all tissues compared with littermate controls (Fig. 1 and Table S1). Healthy thymus, spleen, and liver tissues from Kif18agcd2/gcd2, Trp53tm1 Tyj/tm1 Tyj mice exhibited similar percentages of micronucleated cells as Kif18agcd2/gcd2 mice (Fig. 1 C). Additionally, analyses of micronucleated erythrocytes via flow cytometry indicated that the percentage of micronucleated cells was not affected by p53 in vivo (Fig. 1 D).
Mice homozygous or heterozygous for null mutations in Trp53 develop a spectrum of tumors, with a predominance of thymic lymphoma (Jacks et al., 1994). Consistent with this, Kif18agcd2/gcd2, Trp53tm1 Tyj/tm1 Tyj homozygous mutant mice developed tumors within 3 mo, with the majority (78%) exhibiting thymic lymphoma. To investigate whether the prevalence of micronuclei found within tumor tissues varied among Kif18a mutant and Trp53 mutant animals, we analyzed primary thymic lymphoma sections with labeled DNA. We observed that tumors from Kif18agcd2/gcd2, Trp53tm1 Tyj/tm1 Tyj mice exhibited elevated levels of micronucleated cells compared with those from Kif18a+/+, Trp53tm1 Tyj/tm1 Tyj mice (P < 0.001; Fig. 2, A and B; and Table S2). To ensure that nuclear blebs from neighboring cells were not erroneously counted as micronuclei in these experiments, we analyzed tissues in 3D using optical sections for all experiments and confirmed micronuclear counts in tissues costained with the plasma membrane protein ezrin (Fig. S1 B and Table S4).

Loss of Kif18a function increases the percentage of micronucleated cells in tumors caused by Trp53 mutation but only modestly reduces survival.(A) Representative images of micronuclei (yellow arrowheads) observed in thymic lymphoma tumor sections, stained with Hoechst, from Kif18agcd2/gcd2, Trp53tm1 Tyj/tm1Tyj and Kif18a+/+, Trp53tm1 Tyj/tm1Tyj mice. (B) Plot showing the percentage of micronucleated cells observed in thymic lymphoma from the indicated genotypes. Data points represent individual biological samples. n = 3 biological replicates per genotype. Kif18a+/+, Trp53tm1 Tyj/tm1Tyj (n = 3,099 cells) and Kif18agcd2/gcd2, Trp53tm1 Tyj/tm1Tyj (n = 4,210 cells). *, P < 0.001 (Table S2). Statistical comparison was made using χ2 analysis. (C) Left: Kaplan–Meier survival curves for the indicated genotypes Kif18a+/+, Trp53tm1 Tyj/tm1Tyj (n = 58); Kif18agcd2/gcd2, Trp53tm1 Tyj/tm1Tyj (n = 41); and Kif18agcd2/+, Trp53tm1 Tyj/tm1Tyj (n = 33); *, P = 0.01. Right: Kaplan–Meier survival curves for the indicated genotypes Kif18agcd2/gcd2, Trp53tm1 Tyj/+ (n = 88) and Kif18a+/+, Trp53tm1 Tyj/+ (n = 87); P = 0.43, ns. Black lines represent censored data points. Indicated P values were obtained by performing log-rank analysis of mean survival time and a Wang–Allison test of maximal lifespan.
Loss of Kif18a function increases the percentage of micronucleated cells in tumors caused by Trp53 mutation but only modestly reduces survival.(A) Representative images of micronuclei (yellow arrowheads) observed in thymic lymphoma tumor sections, stained with Hoechst, from Kif18agcd2/gcd2, Trp53tm1 Tyj/tm1Tyj and Kif18a+/+, Trp53tm1 Tyj/tm1Tyj mice. (B) Plot showing the percentage of micronucleated cells observed in thymic lymphoma from the indicated genotypes. Data points represent individual biological samples. n = 3 biological replicates per genotype. Kif18a+/+, Trp53tm1 Tyj/tm1Tyj (n = 3,099 cells) and Kif18agcd2/gcd2, Trp53tm1 Tyj/tm1Tyj (n = 4,210 cells). *, P < 0.001 (Table S2). Statistical comparison was made using χ2 analysis. (C) Left: Kaplan–Meier survival curves for the indicated genotypes Kif18a+/+, Trp53tm1 Tyj/tm1Tyj (n = 58); Kif18agcd2/gcd2, Trp53tm1 Tyj/tm1Tyj (n = 41); and Kif18agcd2/+, Trp53tm1 Tyj/tm1Tyj (n = 33); *, P = 0.01. Right: Kaplan–Meier survival curves for the indicated genotypes Kif18agcd2/gcd2, Trp53tm1 Tyj/+ (n = 88) and Kif18a+/+, Trp53tm1 Tyj/+ (n = 87); P = 0.43, ns. Black lines represent censored data points. Indicated P values were obtained by performing log-rank analysis of mean survival time and a Wang–Allison test of maximal lifespan.

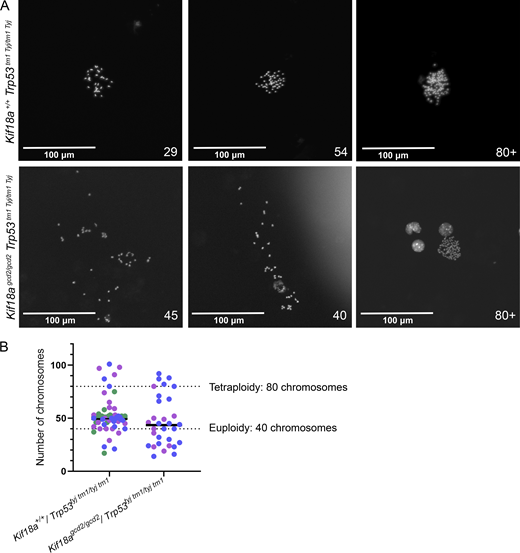
Primary cells extracted from murine thymic lymphoma exhibit high levels of aneuploidy. (A) Representative images of metaphase chromosome spreads prepared from individual biological replicates of primary cells extracted from murine thymic lymphoma from Kif18a+/+, Trp53tm1 Tyj/tm1Tyj and Kif18agcd2/gcd2, Trp53tm1 Tyj/tm1Tyj mice. Indicated chromosome count number displayed in lower right corners. (B) Plot showing the chromosome copy number observed in primary lymphoma cells from individual biological replicates (colors indicate data from individual biological replicates). n = 3 biological samples from Kif18a+/+, Trp53tm1 Tyj/tm1Tyj mice (sample 1, 18 cells; sample 2, 20 cells; sample 3, 23 cells); n = 2 biological samples from Kif18agcd2/gcd2, Trp53tm1 Tyj/tm1Tyj mice (sample 1, 21 cells; sample 2, 10 cells). Dashed lines indicate chromosome copy number for euploidy (40 chromosomes) and tetraploidy (80 chromosomes).

Primary cells extracted from murine thymic lymphoma exhibit high levels of aneuploidy. (A) Representative images of metaphase chromosome spreads prepared from individual biological replicates of primary cells extracted from murine thymic lymphoma from Kif18a+/+, Trp53tm1 Tyj/tm1Tyj and Kif18agcd2/gcd2, Trp53tm1 Tyj/tm1Tyj mice. Indicated chromosome count number displayed in lower right corners. (B) Plot showing the chromosome copy number observed in primary lymphoma cells from individual biological replicates (colors indicate data from individual biological replicates). n = 3 biological samples from Kif18a+/+, Trp53tm1 Tyj/tm1Tyj mice (sample 1, 18 cells; sample 2, 20 cells; sample 3, 23 cells); n = 2 biological samples from Kif18agcd2/gcd2, Trp53tm1 Tyj/tm1Tyj mice (sample 1, 21 cells; sample 2, 10 cells). Dashed lines indicate chromosome copy number for euploidy (40 chromosomes) and tetraploidy (80 chromosomes).
Loss of Kif18a minimally affects the survival of Trp53 mutant mice
If the elevated levels of micronuclei observed in Kif18agcd2/gcd2, Trp53tm1 Tyj/tm1 Tyj accelerated tumorigenesis, we reasoned that this effect would reduce survival. We did find that mice homozygous for both Kif18a and p53 mutations had a small, but significant reduction in survival compared with p53-null littermates with WT Kif18a (P = 0.01; Fig. 2 C, left). The reduced survival of the double mutants could be explained by (1) an increase in tumor development that occurs as a result of the Kif18a mutation, (2) an interaction between the Kif18a-null genotype and the genetic background differences introduced by the cross, or (3) a slightly reduced ability of Kif18a-null mice to cope with rapid tumorigenesis. To help distinguish among these possibilities, we tested the effects of Kif18a loss of function on survival of p53 heterozygotes, which exhibit slower tumor development. Within the p53 heterozygous population, there was no significant difference in survival between Kif18agcd2/gcd2 and Kif18a+/+ animals (P = 0.43; Fig. 2 C, right). Furthermore, micronucleated cell frequency is similarly high in both p53 homozygotes and heterozygotes lacking Kif18a function, and metaphase spread samples extracted from thymic lymphoma tissues from both genotypes indicate aneuploid tumor cells (Fig. 1 B, Table S1, and Fig. S2). Therefore, we were unable to detect evidence of enhanced genomic instability, genetic background effects, or accelerated tumorigenesis in p53-deficient tumors lacking Kif18a function.
Frequency of micronuclei is increased in thymic lymphoma tissues from Kif18a mutants. (A) Representative images of nuclear envelopes for primary nuclei and micronuclei occurring in healthy mouse tissue (top) and in thymic lymphoma (middle and bottom) from the indicated genotypes. Sections were stained with Hoechst (DNA, blue), ezrin (plasma membrane, red), and lamin A/C (nuclear envelope, green). Arrowheads indicate micronuclei; yellow arrowheads show micronuclei with complete lamin A/C, and red arrowheads show incomplete micronuclei. (B) Plot showing the percentage of micronucleated cells in thymic lymphoma tissues for indicated genotypes. Data points represent individual biological samples. n = 3 biological replicates per genotype: Kif18a+/+, Trp53tm1 Tyj/tm1Tyj (n = 1,632 cells); Kif18agcd2/gcd2, Trp53tm1 Tyj/tm1Tyj (n = 1,615 cells). *, P < 0.01 (Table S4). Statistical comparison was made using χ2 analysis. (C) Plot showing the percentage of micronuclei lacking recruitment of lamin A/C in thymic lymphoma tissues for indicated genotypes. Data points represent individual biological samples. n = 3 biological replicates per genotype: Kif18a+/+, Trp53tm1 Tyj/tm1Tyj (n = 54 micronuclei); Kif18agcd2/gcd2, Trp53tm1 Tyj/tm1Tyj (n = 90 micronuclei). P = 0.29, ns (Table S5). Statistical comparison was made using χ2 analysis.

Frequency of micronuclei is increased in thymic lymphoma tissues from Kif18a mutants. (A) Representative images of nuclear envelopes for primary nuclei and micronuclei occurring in healthy mouse tissue (top) and in thymic lymphoma (middle and bottom) from the indicated genotypes. Sections were stained with Hoechst (DNA, blue), ezrin (plasma membrane, red), and lamin A/C (nuclear envelope, green). Arrowheads indicate micronuclei; yellow arrowheads show micronuclei with complete lamin A/C, and red arrowheads show incomplete micronuclei. (B) Plot showing the percentage of micronucleated cells in thymic lymphoma tissues for indicated genotypes. Data points represent individual biological samples. n = 3 biological replicates per genotype: Kif18a+/+, Trp53tm1 Tyj/tm1Tyj (n = 1,632 cells); Kif18agcd2/gcd2, Trp53tm1 Tyj/tm1Tyj (n = 1,615 cells). *, P < 0.01 (Table S4). Statistical comparison was made using χ2 analysis. (C) Plot showing the percentage of micronuclei lacking recruitment of lamin A/C in thymic lymphoma tissues for indicated genotypes. Data points represent individual biological samples. n = 3 biological replicates per genotype: Kif18a+/+, Trp53tm1 Tyj/tm1Tyj (n = 54 micronuclei); Kif18agcd2/gcd2, Trp53tm1 Tyj/tm1Tyj (n = 90 micronuclei). P = 0.29, ns (Table S5). Statistical comparison was made using χ2 analysis.
Micronuclear envelopes in normal tissues of Kif18agcd2/gcd2, Trp53tm1 Tyj/tm1 Tyj mice are stable, but those in tumor cells are disrupted
Micronuclear envelope instability has been reported to contribute significantly to genomic instability (Hatch et al., 2013; Shah et al., 2017; Zhang et al., 2015; Liu et al., 2018). Previous in vitro studies indicated that micronuclear envelopes are often incomplete, lacking the appropriate and expected density, deposition, or diversity of some nuclear envelope components (Hatch et al., 2013; Liu et al., 2018). Significant gaps in the lamina of micronuclear envelopes are strongly associated with the eventual outcome of micronuclear envelope collapse and rupture (Vargas et al., 2012; Denais et al., 2016; Hatch and Hetzer, 2016; Raab et al., 2016; Robijns et al., 2016; Cho et al., 2019; Maciejowski and Hatch, 2020). To analyze micronuclear envelopes in Kif18a mutant mice, sections from liver, spleen, and thymus were stained for the core nuclear envelope protein lamin A/C and DNA (Fig. 3 A). Micronuclei surrounded by continuous lamin A/C signal were considered to have complete nuclear envelopes, while those containing gaps in or lacking lamin A/C were considered incomplete. We found that the majority of micronuclear envelopes successfully recruited complete halos of lamin A/C (83%–97%) within healthy tissues from Kif18a mutant mice (Fig. 3 B and Table S1). In contrast, micronuclei found in tissues from WT mice were rare but usually exhibited evidence of discontinuous lamin A/C recruitment (100% in thymus, n = 1; 50% in spleen, n = 2; 100% in liver, n = 1). The incidence of micronuclear envelopes lacking lamin A/C was uniformly low, regardless of Trp53 allele status. Thus, micronuclei formed following loss of Kif18a function in vivo appear to have intact nuclear envelopes.

Micronuclear envelopes in Kif18a mutants are stable in healthy tissue but display incomplete lamin A/C recruitment in tumor cells.(A) Representative images of nuclear envelopes for primary nuclei and micronuclei occurring in healthy thymus tissue (top) and in thymic lymphoma (middle and bottom) from the indicated genotypes. Sections were stained with Hoechst (DNA, blue) and lamin A/C (green); yellow arrowheads indicate complete micronuclei through lamin A/C; red arrowheads show micronuclei with incomplete lamin A/C. (B) Plot showing the percentage of micronucleated cells experiencing micronuclear envelope disruption in healthy thymus, liver, and spleen tissues, as determined by incomplete lamin A/C signal co-occurring with micronuclear DNA. n = 3 tissue types per one biological replicate for each genotype (also see Table S1). (C) Plot showing percentage of micronuclei with nuclear envelopes lacking complete lamin A/C in thymic lymphoma tissues from the indicated genotypes. n = 3 biological replicates per genotype; P = 0.76, ns (also see Table S3). Data points indicate biological replicates, P values were calculated via unpaired Student’s t test.
Micronuclear envelopes in Kif18a mutants are stable in healthy tissue but display incomplete lamin A/C recruitment in tumor cells.(A) Representative images of nuclear envelopes for primary nuclei and micronuclei occurring in healthy thymus tissue (top) and in thymic lymphoma (middle and bottom) from the indicated genotypes. Sections were stained with Hoechst (DNA, blue) and lamin A/C (green); yellow arrowheads indicate complete micronuclei through lamin A/C; red arrowheads show micronuclei with incomplete lamin A/C. (B) Plot showing the percentage of micronucleated cells experiencing micronuclear envelope disruption in healthy thymus, liver, and spleen tissues, as determined by incomplete lamin A/C signal co-occurring with micronuclear DNA. n = 3 tissue types per one biological replicate for each genotype (also see Table S1). (C) Plot showing percentage of micronuclei with nuclear envelopes lacking complete lamin A/C in thymic lymphoma tissues from the indicated genotypes. n = 3 biological replicates per genotype; P = 0.76, ns (also see Table S3). Data points indicate biological replicates, P values were calculated via unpaired Student’s t test.
We also investigated whether micronuclei within primary thymic lymphoma sections successfully recruited lamin A/C (Fig. 3 A). Rates of micronuclei lacking continuous lamin A/C in tumors were elevated relative to normal thymus tissue; however, there was no significant difference in the frequency of lamin A/C absence between mice lacking only p53 and those lacking both Kif18a and p53 (43% versus 46%; Fig. 3 C, Table S3, and Table S5). Taken together, these data suggest that the stability of micronuclear envelopes in Kif18a mutant cells could limit genomic instability and spontaneous tumorigenesis in normal tissues of Kif18a mutant mice but that micronuclear envelope integrity becomes compromised in tumor tissues.
Micronuclei induced through loss of KIF18A exhibit stable nuclear envelopes in vitro
To further explore micronuclear envelope stability in KIF18A mutant cells, we established an in vitro system to compare micronuclei induced via different types of insults in a human RPE1 cell line immortalized by human telomerase (hTERT) expression. hTERT-RPE1 cells are female, near-diploid cells containing a modal chromosome number of 46 with a single-derivative X chromosome and have been used previously for investigating micronuclear envelope rupture (Zhang, et al., 2015; Hatch et al., 2013; Liu et al., 2018). We will refer to hTERT-RPE1 cells as “RPE1” throughout, for simplicity.
Micronuclei were induced in RPE1 cells via (1) nocodazole washout, which leads to improper attachments between kinetochores and microtubules; (2) KO of the KIF18A gene; (3) sublethal doses of radiation, which lead to double-stranded DNA breaks and fragmented chromosomes; and (4) siRNA knockdown (KD) of mitotic arrest deficient 2 (MAD2), which disables the mitotic spindle assembly checkpoint and causes micronuclei through a combination of improper kinetochore–microtubule attachments and chromosome unalignment (Fig. 4 A; Fenech and Morley, 1985; Cimini et al., 2001; Burds, et al., 2005; Lusiyanti et al., 2016; Fonseca et al., 2019). Micronuclei also spontaneously form within WT populations of RPE1 cells at low frequencies (1%), and RPE1 cells treated with nontargeting siRNAs were used as controls (Tolbert et al., 1992).

Micronuclei resulting from loss of KIF18A function in human cells infrequently lack lamin A/C. (A) Schematic of experimental design. Note that cells were either treated with siRNA (†) or nocodazole washout (††), but not both. (B) Plot showing percentage of micronucleated RPE1 cells following treatment with the indicated siRNAs or drug washout. n = 4,188 (RPE1 control KD), n = 3,536 (RPE1 control + p53 KD), n = 661 (KIF18A KO control KD), n = 869 (KIF18A KO control KD + p53 KD), n = 1,223 (RPE1 MAD2 KD), n = 1,157 (MAD2 KD + p53 KD), n = 4,005 (RPE1 + nocodazole washout), n = 2,189 (RPE1 1 Gy, control KD), n = 3,080 (RPE1 1 Gy, control KD + p53 KD). *, P < 0.0001 (Table S6). (C) Representative images of fixed, micronucleated RPE1 cells labeled with DAPI (DNA, blue) and lamin A/C (red). (D) Plot showing percentage of micronucleated cells that lacked complete lamin A/C within micronuclear envelopes following the indicated treatments. n = 485 (RPE1 control KD), n = 510 (RPE1 control + p53 KD), n = 807 (KIF18A KO control KD), n = 720 (KIF18A KO control KD + p53 KD), n = 631 (RPE1 MAD2 KD), n = 648 (RPE1 MAD2 KD + p53 KD), n = 726 (RPE1 + nocodazole washout), n = 622 (RPE1 1 Gy, control KD), n = 778 (RPE1 1 Gy, control KD + p53 KD). *, P < 0.01 (Table S7). (E) Plot showing percentage of micronuclei that lacked complete lamin A/C within micronuclear envelopes in RPE1 control and KIF18A KO cells subjected to DMSO treatment or nocodazole washout, as indicated. n = 161 (RPE1 untreated), n = 162 (RPE1 + DMSO washout), n = 171 (RPE1 + nocodazole washout), n = 253 (KIF18A KO untreated), n = 293 (KIF18A KO + DMSO washout), n = 278 (KIF18A KO + nocodazole washout). *, P < 0.01 (Table S8). Data are from three independent experiments (B, C, and E) and from four experiments (D). Indicated P values were calculated by χ2 analysis.
Micronuclei resulting from loss of KIF18A function in human cells infrequently lack lamin A/C. (A) Schematic of experimental design. Note that cells were either treated with siRNA (†) or nocodazole washout (††), but not both. (B) Plot showing percentage of micronucleated RPE1 cells following treatment with the indicated siRNAs or drug washout. n = 4,188 (RPE1 control KD), n = 3,536 (RPE1 control + p53 KD), n = 661 (KIF18A KO control KD), n = 869 (KIF18A KO control KD + p53 KD), n = 1,223 (RPE1 MAD2 KD), n = 1,157 (MAD2 KD + p53 KD), n = 4,005 (RPE1 + nocodazole washout), n = 2,189 (RPE1 1 Gy, control KD), n = 3,080 (RPE1 1 Gy, control KD + p53 KD). *, P < 0.0001 (Table S6). (C) Representative images of fixed, micronucleated RPE1 cells labeled with DAPI (DNA, blue) and lamin A/C (red). (D) Plot showing percentage of micronucleated cells that lacked complete lamin A/C within micronuclear envelopes following the indicated treatments. n = 485 (RPE1 control KD), n = 510 (RPE1 control + p53 KD), n = 807 (KIF18A KO control KD), n = 720 (KIF18A KO control KD + p53 KD), n = 631 (RPE1 MAD2 KD), n = 648 (RPE1 MAD2 KD + p53 KD), n = 726 (RPE1 + nocodazole washout), n = 622 (RPE1 1 Gy, control KD), n = 778 (RPE1 1 Gy, control KD + p53 KD). *, P < 0.01 (Table S7). (E) Plot showing percentage of micronuclei that lacked complete lamin A/C within micronuclear envelopes in RPE1 control and KIF18A KO cells subjected to DMSO treatment or nocodazole washout, as indicated. n = 161 (RPE1 untreated), n = 162 (RPE1 + DMSO washout), n = 171 (RPE1 + nocodazole washout), n = 253 (KIF18A KO untreated), n = 293 (KIF18A KO + DMSO washout), n = 278 (KIF18A KO + nocodazole washout). *, P < 0.01 (Table S8). Data are from three independent experiments (B, C, and E) and from four experiments (D). Indicated P values were calculated by χ2 analysis.
We analyzed cells following each treatment for the presence of micronuclei via staining with the DNA dye DAPI. Micronuclei were identified as DAPI-stained chromatin masses outside the main nucleus, and the percentage of micronucleated cells observed in each population was quantified. Consistent with previous observations, we found that 5.3% of KIF18A KO RPE1 cells formed micronuclei (Fig. 4 B and Table S6; Fonseca et al., 2019). To facilitate comparison, a short treatment of nocodazole (2 h) before washout was used to yield a similar percentage of micronucleated cells (5.6%; Fig. 4 B and Table S6). We also found that 4% of RPE1 cells treated with MAD2 siRNAs formed micronuclei, and 19% of RPE1 cells subjected to 1-Gy radiation formed micronuclei 24 h after exposure (Fig. 4 B and Table S6).
Micronuclear envelope recruitment was assessed by analyzing RPE1 cells labeled with lamin A/C antibodies and DAPI. Micronuclei were scored as incomplete if lamin A/C label was either absent or discontinuous (Fig. 4 C; and Fig. S3, A–D). Consistent with previous reports (Hatch et al., 2013; Liu et al., 2018), micronuclei produced via nocodazole washout exhibited high rates of micronuclear envelope defects (58%), as evidenced by a loss of robust lamin A/C signal co-occurring with micronuclear DNA (Fig. 4 D; Fig. S3, A–D; and Table S7). In contrast, micronuclei in KIF18A KO cells exhibited low rates of micronuclear envelope defects (16%) compared with micronuclei produced via all other insults (P < 0.001; Fig. 4 D; Fig. S3, A and B; and Table S7). We observed a moderate level of micronuclear envelopes lacking lamin A/C in cells following MAD2 KD (46%), control KD (33%), and irradiation (32%; Fig. 4 D and Table S7). It should be noted that micronuclei that form spontaneously (control KD) and those that form following MAD2 KD could result from a mix of initial cellular insults, including improper kinetochore–microtubule attachments and alignment defects, which could explain the intermediate level of defects observed. The frequencies of micronuclear envelope defects in each population were not significantly affected by p53 KD, consistent with our in vivo results (Fig. 4 D).

Validation of lamin A/C staining to assess micronuclear envelope integrity. (A) Representative images of KIF18A KO cells and RPE1 cells treated with nocodazole washout stained with DAPI (DNA) and antibodies against lamin A/C and mCherry 24 h following transfection with mCherry-NLS construct. (B) Percentage of micronuclei exhibiting retainment or loss of mCherry-NLS signal as a function of continuous or incomplete nuclear membrane signal (lamin A/C). Of 140 micronuclei imaged and scored, 47 micronuclear envelopes with continuous lamin A/C signal contained mCherry signal (1 showed mCherry loss), and 87 micronuclear envelopes with incomplete lamin A/C signal experienced mCherry loss (5 retained mCherry signal). Comparison of these two criteria for the same micronuclei indicated that lamin A/C signal alone correctly predicted the integrity of the micronuclear envelope for 96% of cells (134 of 140 micronuclei). Validation data were collected from two independent experiments. (C) Representative still images of RPE1 cells expressing mCherry-H2B and NLS-EGFP that were treated with nocodazole washout to induce micronucleus formation. Cells were imaged immediately after drug washout to investigate time from micronuclear formation to time of micronuclear rupture (indicated by loss of NLS-EGFP signal from co-occurring mCherry-H2B–labeled micronucleus). White arrowheads indicate micronuclei with intact nuclear envelopes; red arrowheads indicate micronuclei after rupture. (D) Plot displaying the time from micronuclear formation to micronuclear envelope rupture for KIF18A KO and RPE1 cells treated with nocodazole washout. Mean time to micronuclear envelope rupture indicated within each condition. n = 34 (RPE1 + nocodazole washout), n = 36 (KIF18A KO). P = 0.33, ns. Data from 12 independently performed experiments. (E) Graph displaying percentage of ruptured micronuclear envelopes observed in the indicated conditions (from data in D) for micronuclei that remained within the field of view for at least 2.5 h. Statistical comparison performed using χ2 contingency test. *, P < 0.01. Noc., nocodazole.

Validation of lamin A/C staining to assess micronuclear envelope integrity. (A) Representative images of KIF18A KO cells and RPE1 cells treated with nocodazole washout stained with DAPI (DNA) and antibodies against lamin A/C and mCherry 24 h following transfection with mCherry-NLS construct. (B) Percentage of micronuclei exhibiting retainment or loss of mCherry-NLS signal as a function of continuous or incomplete nuclear membrane signal (lamin A/C). Of 140 micronuclei imaged and scored, 47 micronuclear envelopes with continuous lamin A/C signal contained mCherry signal (1 showed mCherry loss), and 87 micronuclear envelopes with incomplete lamin A/C signal experienced mCherry loss (5 retained mCherry signal). Comparison of these two criteria for the same micronuclei indicated that lamin A/C signal alone correctly predicted the integrity of the micronuclear envelope for 96% of cells (134 of 140 micronuclei). Validation data were collected from two independent experiments. (C) Representative still images of RPE1 cells expressing mCherry-H2B and NLS-EGFP that were treated with nocodazole washout to induce micronucleus formation. Cells were imaged immediately after drug washout to investigate time from micronuclear formation to time of micronuclear rupture (indicated by loss of NLS-EGFP signal from co-occurring mCherry-H2B–labeled micronucleus). White arrowheads indicate micronuclei with intact nuclear envelopes; red arrowheads indicate micronuclei after rupture. (D) Plot displaying the time from micronuclear formation to micronuclear envelope rupture for KIF18A KO and RPE1 cells treated with nocodazole washout. Mean time to micronuclear envelope rupture indicated within each condition. n = 34 (RPE1 + nocodazole washout), n = 36 (KIF18A KO). P = 0.33, ns. Data from 12 independently performed experiments. (E) Graph displaying percentage of ruptured micronuclear envelopes observed in the indicated conditions (from data in D) for micronuclei that remained within the field of view for at least 2.5 h. Statistical comparison performed using χ2 contingency test. *, P < 0.01. Noc., nocodazole.
To determine whether gaps in lamin A/C are predictive of micronuclear envelope rupture in this system, we evaluated the ability of micronuclei to retain an mCherry-tagged nuclear localization sequence (mCherry-NLS) in both live and fixed cells (Fig. S3, A–D). Specifically, we measured the frequency that individual micronuclei displayed both absent or discontinuous lamin A/C staining and loss of mCherry-NLS signal from the contained micronuclear area. Our results indicated that lamin A/C signal alone is predictive of the integrity of the micronuclear envelope for 96% of cells (134 of 140 micronuclei), suggesting that lamin A/C immunofluorescence is a reliable method to determine rupture status of micronuclear envelopes in fixed cells. To determine the timing of micronuclear envelope rupture in our system, we imaged dividing RPE1 cells expressing both NLS-EGFP and mCherry-histone 2B (H2B). Following nocodazole treatment and washout, we observed that micronuclei ruptured in 53% of cells (18 of 34) at 2.2 h after formation, on average (Fig. S3, C and D). While micronuclei ruptured in only 14% (5 of 36) of KIF18A KO cells, the average time to rupture was comparable to that seen in nocodazole-treated cells (3.2 h after formation, P = 0.33; Fig. S3, E and F). The proportion of intact micronuclei (still in frame for at least 3 h after formation) to ruptured micronuclei are reported in Fig. S3 E. We noted that a small fraction of micronuclei (6%, 5 of 80 micronuclei imaged) showed a delayed import of NLS-EGFP signal, and these were excluded from time-to-rupture measurements. Based on these data, we conclude that the majority of micronuclei experiencing nuclear envelope protein recruitment defects in our system had undergone micronuclear envelope rupture.
KIF18A is not required for micronuclear envelope rupture
The relatively low frequency of micronuclear envelope rupture observed in KIF18A KO cells could be explained by increased micronuclear envelope stability or a requirement for KIF18A in the micronuclear envelope rupture process. To distinguish between these possibilities, KIF18A KO and control RPE1 cells were subjected to nocodazole washout, and micronuclear envelope integrity was assessed. A large fraction of micronuclei present in each cell population at this time point are expected to have formed due to improper kinetochore–microtubule attachments. We found that micronuclei in KIF18A KO cells treated with nocodazole washout displayed similar rates of incomplete lamin A/C as those produced via drug treatment in RPE1 control cells (not significant at P = 0.20; Fig. 4 E and Table S8). These data indicate that KIF18A is not required for the micronuclear rupture process, and therefore, micronuclear envelopes in KIF18A KO cells are more stable than those formed due to induced kinetochore–microtubule attachment defects.
Micronuclei in KIF18A KO cells successfully recruit noncore nuclear envelope components
Before chromosomes can interact with spindle microtubules in mammalian cells, nuclear envelope components must be disassembled and relocated. Several nuclear envelope proteins are found ubiquitously throughout the cytoplasm following nuclear envelope disassembly, whereas other components are unevenly distributed to organelles in the dividing cell (Hetzer, 2010). For example, inner nuclear membrane proteins, such as lamin B, are stored within the membranes of the ER at this time (Yang et al., 1997; Hetzer, 2010). While lamin A/C is a “core” nuclear envelope component because it is recruited to the central chromosome mass nearest the central spindle axis during nuclear envelope reformation (Clever et al., 2013), lamin B is a “noncore” component that is targeted to the chromosome peripheral regions during nuclear envelope reformation (Clever et al., 2013). Micronuclear envelope stability is enhanced by successful recruitment of lamin B, while loss of lamin B causes holes to form in the lamina, increasing the frequency of nuclear envelope rupture (Vergnes et al., 2004; Vargas et al., 2012; Hatch et al., 2013; Liu et al., 2018).
To compare the extent of noncore nuclear envelope component recruitment to micronuclei in KIF18A KO cells and those subjected to nocodazole drug washout, cells were fixed and costained with DAPI and an antibody against lamin B1 (Fig. 5 A). These experimental conditions were chosen for comparison because they exhibited the lowest and highest rates of micronuclear envelope rupture, respectively (Fig. 4 D and Table S7). Lamin B levels in KIF18A KO cell micronuclei were significantly higher than those in nocodazole washout–treated cells and similar to those measured in primary nuclei (P < 0.01; Fig. 5, B and C). Quantifications of lamin B recruitment are also reported as a function of micronuclear envelope integrity determined via lamin A/C (Fig. 5 D). These data indicate that lamin B recruitment to micronuclei is more efficient in KIF18A KO cells than in nocodazole-treated cells.

Micronuclei in KIF18A-deficient cells successfully recruit the noncore nuclear envelope component lamin B. (A) Representative images of fixed, micronucleated RPE1 cells labeled with DAPI (DNA, blue), ACA (centromeres, green), and lamin B (red). (B) Plot displaying lamin B fluorescence in micronuclear envelopes. Data are from three independent experiments. n = 27 (RPE1 + nocodazole washout), n = 28 (KIF18A KO). *, P < 0.001. Data points indicate individual micronuclei. (C) Plot displaying the ratio of lamin B fluorescence in the micronuclear envelope to lamin B recruited to the primary nuclear (PN) envelope of the same cell. Data are from three independent experiments. n = 10 (RPE1 + nocodazole washout), n = 14 (KIF18A KO). *, P < 0.0001. Data points indicate individual micronucleated cells. (D) Plot displaying the ratios of lamin B in the micronucleated envelope to lamin B in the PN envelope, parsed by continuous, incomplete, or absent lamin A/C recruitment, as assessed by costaining with lamin A/C antibody. n = 24 (RPE1 + nocodazole washout), n = 52 (KIF18A KO). *, P < 0.01. Data are from three independent experiments. Data points indicate individual micronucleated cells. (E) Representative images of thymic lymphoma tumor sections stained with Hoechst (DNA, blue) and lamin B (nuclear envelope, red); micronuclei indicated by yellow arrowheads. (F) Plot showing percentage of micronuclei in thymic lymphoma tissues that lacked lamin B. n = 3 biological replicates per genotype (also see Table S9). Data points indicate individual biological replicates. Indicated P values for numerical data were obtained using unpaired Student’s t test for comparisons between two conditions or a one-way ANOVA with Tukey’s post hoc test for comparisons among more than two conditions. Noc., nocodazole.
Micronuclei in KIF18A-deficient cells successfully recruit the noncore nuclear envelope component lamin B. (A) Representative images of fixed, micronucleated RPE1 cells labeled with DAPI (DNA, blue), ACA (centromeres, green), and lamin B (red). (B) Plot displaying lamin B fluorescence in micronuclear envelopes. Data are from three independent experiments. n = 27 (RPE1 + nocodazole washout), n = 28 (KIF18A KO). *, P < 0.001. Data points indicate individual micronuclei. (C) Plot displaying the ratio of lamin B fluorescence in the micronuclear envelope to lamin B recruited to the primary nuclear (PN) envelope of the same cell. Data are from three independent experiments. n = 10 (RPE1 + nocodazole washout), n = 14 (KIF18A KO). *, P < 0.0001. Data points indicate individual micronucleated cells. (D) Plot displaying the ratios of lamin B in the micronucleated envelope to lamin B in the PN envelope, parsed by continuous, incomplete, or absent lamin A/C recruitment, as assessed by costaining with lamin A/C antibody. n = 24 (RPE1 + nocodazole washout), n = 52 (KIF18A KO). *, P < 0.01. Data are from three independent experiments. Data points indicate individual micronucleated cells. (E) Representative images of thymic lymphoma tumor sections stained with Hoechst (DNA, blue) and lamin B (nuclear envelope, red); micronuclei indicated by yellow arrowheads. (F) Plot showing percentage of micronuclei in thymic lymphoma tissues that lacked lamin B. n = 3 biological replicates per genotype (also see Table S9). Data points indicate individual biological replicates. Indicated P values for numerical data were obtained using unpaired Student’s t test for comparisons between two conditions or a one-way ANOVA with Tukey’s post hoc test for comparisons among more than two conditions. Noc., nocodazole.
To determine whether lamin B is also recruited to micronuclei in Kif18a mutant cells in vivo, we investigated lamin B in thymic lymphoma tissues costained with Hoechst (DNA; Fig. 5 E). We found similar levels of lamin B recruitment to micronuclei within Kif18a+/+, Trp53tm1 Tyj/tm1Tyj and Kif18agcd2/gcd2, Trp53tm1 Tyj/tm1Tyj tissues, where 48% and 52% of micronuclear envelopes lack robust recruitment of lamin B, respectively (Fig. 5 F and Table S9). These results are consistent with the frequency of laminar gaps within micronuclear envelopes identified via lamin A/C staining and suggest that lamin B is recruited to stable micronuclei within Kif18a mutant mice (Figs. 3 B and 5 F).
Micronuclei in KIF18A KO cells exhibit successful nuclear envelope expansion
Nuclear envelope stability also depends on efficient recruitment of membrane and membrane components from the ER as chromosomes decondense and nuclear area expands in late mitosis (Anderson and Hetzer, 2008; Hetzer, 2010; Clever et al., 2013; De Magistris and Antonin, 2018; Kuhn et al., 2019). Data from intact cells, as well as in vitro nuclear assembly systems, show that physically disrupting the connection between nuclei and the peripheral ER can indeed block nuclear expansion (Anderson and Hetzer, 2007). To investigate whether micronuclei in KIF18A KO cells are able to successfully expand and stabilize, we measured the change in both micronuclear and primary nuclear chromatin area over time as chromosomes decondensed in live telophase cells (Fig. 6 A). Micronuclear chromatin within KIF18A KO cells exhibited a 1.4-fold increase in area, similar to that of chromatin within primary nuclei (Fig. 6, B–D). In contrast, micronuclei forming as a result of nocodazole washout exhibited a significantly reduced expansion during telophase (P < 0.01). These results suggest that micronuclei forming after nocodazole washout experience chromatin restriction, which may increase the frequency of micronuclear envelope rupture.

Micronuclei in KIF18A KO cells exhibit chromatin expansion upon exit from mitosis. (A) Stills from time-lapse imaging of micronuclei (arrowheads) in KIF18A KO and nocodazole-treated cells transfected with GFP-H2B to label DNA. (B) Representative traces displaying fold change in micronuclear chromatin area beginning immediately after completion of chromosome segregation at the time of initial micronucleus formation until chromatin was decondensed. Traces shown in B match representative images shown in A. An individual fold change trace indicates a single representative micronucleus per condition. (C) Plot of final fold change in micronuclear area (final area divided by initial recorded micronuclear area) for the indicated conditions. Data points represent individual micronuclei. n = 35 (RPE1 + nocodazole), n = 19 (KIF18A KO untreated), n = 16 (KIF18A KO + DMSO), n = 32 (KIF18A KO + nocodazole). Data were collected from four independent experiments. *, P < 0.0001. Data points indicate individual micronuclei. Error bars indicate SD. (D) Final ratio of fold change in primary nuclear area from the same cells in which micronuclei were measured in C. n = 18 (RPE1 + nocodazole), n = 18 (KIF18A KO untreated), n = 12 (KIF18A KO + DMSO), n = 16 (KIF18A KO + nocodazole). P = 0.80, ns. Data points indicate individual primary nuclei. Error bars indicate SD. Statistical comparisons were made using a one-way ANOVA with Tukey’s multiple comparisons test. Noc., nocodazole.
Micronuclei in KIF18A KO cells exhibit chromatin expansion upon exit from mitosis. (A) Stills from time-lapse imaging of micronuclei (arrowheads) in KIF18A KO and nocodazole-treated cells transfected with GFP-H2B to label DNA. (B) Representative traces displaying fold change in micronuclear chromatin area beginning immediately after completion of chromosome segregation at the time of initial micronucleus formation until chromatin was decondensed. Traces shown in B match representative images shown in A. An individual fold change trace indicates a single representative micronucleus per condition. (C) Plot of final fold change in micronuclear area (final area divided by initial recorded micronuclear area) for the indicated conditions. Data points represent individual micronuclei. n = 35 (RPE1 + nocodazole), n = 19 (KIF18A KO untreated), n = 16 (KIF18A KO + DMSO), n = 32 (KIF18A KO + nocodazole). Data were collected from four independent experiments. *, P < 0.0001. Data points indicate individual micronuclei. Error bars indicate SD. (D) Final ratio of fold change in primary nuclear area from the same cells in which micronuclei were measured in C. n = 18 (RPE1 + nocodazole), n = 18 (KIF18A KO untreated), n = 12 (KIF18A KO + DMSO), n = 16 (KIF18A KO + nocodazole). P = 0.80, ns. Data points indicate individual primary nuclei. Error bars indicate SD. Statistical comparisons were made using a one-way ANOVA with Tukey’s multiple comparisons test. Noc., nocodazole.
Lagging chromosomes in KIF18A KO cells are located near the spindle poles
Previous work in both cultured human cells and Drosophila has demonstrated that micronuclear envelope stability is influenced by the subcellular location of nuclear envelope assembly around individual lagging chromosomes within the mitotic spindle (Afonso et al., 2014; Maiato et al., 2015; Liu et al., 2018). Our analyses of micronucleus formation in live KIF18A KO cells indicate that micronuclei form around lagging chromosomes 98% of the time (46 of 47 events from four independent experiments). Thus, we compared the locations of lagging chromosomes in KIF18A KO and nocodazole washout–treated RPE1 cells. Asynchronously dividing KIF18A KO cells were fixed and labeled with an antibody against γ-tubulin to mark spindle poles and DAPI to stain chromatin. Cells in late anaphase were scored for the presence of lagging chromosomes, which notably trailed the main chromatin masses. Lagging chromosomes were observed in 44% (52 of 118) of nocodazole washout–treated RPE1 cells and in 9% (4 of 43) of KIF18A KO cells (P < 0.001; Fig. S4, A and B). These data agree with our prior analyses of midzone lagging chromosomes in KIF18A KO cells (Fonseca et al., 2019) and suggest that differences in lagging chromosome positions may underscore the differences in micronuclear envelope stability exhibited by KIF18A KO and nocodazole washout cells.

Lagging chromosomes are infrequently observed in KIF18A KO late anaphase cells. (A) Representative late anaphase RPE1 cells treated with nocodazole washout or containing KIF18A KO mutations. Missegregating chromosomes in the midzone were quantified in late anaphase by eye and included both lagging chromosomes (as determined with DNA staining, white arrowhead) and chromatin bridges (yellow arrowhead). (B) Percentage of late anaphase cells containing one or more lagging chromosomes or chromatin bridges from the indicated experimental conditions. Lagging chromosomes were observed in 44% (52 of 118) of nocodazole washout–treated RPE1 cells and in 9% (4 of 43) of KIF18A KO cells. *, P < 0.001. Data are from one experiment. Indicated P value was calculated by χ2 analysis. (C) Plot of SDs of chromosome distance measurements in cells with chromosomes meeting the definition of “lagging” (see Fig. 7 B). Measurements in late anaphase RPE1 cells treated with nocodazole washout or containing KIF18A KO mutations. P = 0.14, ns. Noc., nocodazole.

Lagging chromosomes are infrequently observed in KIF18A KO late anaphase cells. (A) Representative late anaphase RPE1 cells treated with nocodazole washout or containing KIF18A KO mutations. Missegregating chromosomes in the midzone were quantified in late anaphase by eye and included both lagging chromosomes (as determined with DNA staining, white arrowhead) and chromatin bridges (yellow arrowhead). (B) Percentage of late anaphase cells containing one or more lagging chromosomes or chromatin bridges from the indicated experimental conditions. Lagging chromosomes were observed in 44% (52 of 118) of nocodazole washout–treated RPE1 cells and in 9% (4 of 43) of KIF18A KO cells. *, P < 0.001. Data are from one experiment. Indicated P value was calculated by χ2 analysis. (C) Plot of SDs of chromosome distance measurements in cells with chromosomes meeting the definition of “lagging” (see Fig. 7 B). Measurements in late anaphase RPE1 cells treated with nocodazole washout or containing KIF18A KO mutations. P = 0.14, ns. Noc., nocodazole.
To explore this question further and obtain precise measurements of lagging chromosome positions from a larger number of KIF18A KO cells, we synchronized cells in G2 phase and then released them into mitosis. This facilitated a similar enrichment of late anaphase cells as observed following nocodazole washout. Cells were then fixed and stained for antibodies against γ-tubulin and centromeres (Fig. 7 A). The positions of individual centromeres relative to the spindle pole were measured in each anaphase half-spindle. Centromere signals located farther than 2 SDs from the average centromere position within each half-spindle were identified as “lagging” (Fig. 7 B). Lagging chromosomes in KIF18A KO cells were located closer to the pole than those in nocodazole-treated cells (Fig. 7 C). Measurements of anaphase chromosome distributions indicated that chromosomes were similarly distributed within half-spindles of cells lacking KIF18A and those treated with nocodazole washout (P = 0.14; Fig. S4 C). In addition, the angle of each lagging chromosome centromere relative to the pole-to-pole axis was measured. There was not a significant difference between the angles of lagging chromosomes to the spindle in the two conditions (Fig. 7 D). These data indicate that lagging chromosomes in nocodazole washout cells are closer to the midzone than those in KIF18A KO cells, which could contribute to the observed decrease in micronucleus stability.

Lagging chromosomes in KIF18A KO cells are located near the spindle poles in late anaphase. (A) Representative images of late anaphase RPE1 cells that were fixed and labeled with antibodies against centromeres and spindle poles. Arrowheads indicate lagging chromosomes. (B) Left: Schematic depicting how lagging chromosome positions were measured and normalized within each half-spindle. Right: Plot showing normalized lagging chromosome-to-pole distances measured in KIF18A KO RPE1 cells and nocodazole washout–treated RPE1 WT cells. n = 47 (RPE1 WT + nocodazole), n = 27 (KIF18A KO). Data collected from three independent experiments. *, P < 0.01. Data points indicate individual lagging chromosomes. Error bars represent SD. (C) Left: Schematic depicting how lagging chromosome angles were measured relative to the central spindle axis. Measured angles were converted to equivalent angles within the range of 0° and 90°. Right: Plot of lagging chromosome angles relative to the central spindle axis for the indicated conditions. n = 29 (KIF18A KO), n = 47 (RPE1 nocodazole washout). P = 0.19, ns. Data collected from three independent experiments. Data points indicate individual lagging chromosomes. Statistical comparisons were made using a two-tailed unpaired Student’s t test. Avg, average; Noc., nocodazole.
Lagging chromosomes in KIF18A KO cells are located near the spindle poles in late anaphase. (A) Representative images of late anaphase RPE1 cells that were fixed and labeled with antibodies against centromeres and spindle poles. Arrowheads indicate lagging chromosomes. (B) Left: Schematic depicting how lagging chromosome positions were measured and normalized within each half-spindle. Right: Plot showing normalized lagging chromosome-to-pole distances measured in KIF18A KO RPE1 cells and nocodazole washout–treated RPE1 WT cells. n = 47 (RPE1 WT + nocodazole), n = 27 (KIF18A KO). Data collected from three independent experiments. *, P < 0.01. Data points indicate individual lagging chromosomes. Error bars represent SD. (C) Left: Schematic depicting how lagging chromosome angles were measured relative to the central spindle axis. Measured angles were converted to equivalent angles within the range of 0° and 90°. Right: Plot of lagging chromosome angles relative to the central spindle axis for the indicated conditions. n = 29 (KIF18A KO), n = 47 (RPE1 nocodazole washout). P = 0.19, ns. Data collected from three independent experiments. Data points indicate individual lagging chromosomes. Statistical comparisons were made using a two-tailed unpaired Student’s t test. Avg, average; Noc., nocodazole.
Lagging chromosome distance from the spindle pole predicts micronuclear envelope rupture
To test whether the probability of micronuclear envelope rupture is influenced by lagging chromosome position within anaphase spindles, we measured the location of micronuclear formation in live cells and subsequently tracked micronuclear integrity. Specifically, we transfected RPE1 cells that stably express CENP-A-GFP (to mark centromeres) and Centrin-1-GFP (to mark spindle poles) with plasmids that express NLS-EGFP (to indicate nuclear envelope integrity) and mCherry-H2B (to mark chromatin; Magidson et al., 2011). Cells expressing these fluorescent markers were then treated with nocodazole and imaged immediately following drug washout. This treatment was used to induce micronuclei forming at a range of locations within the anaphase spindle. We imaged 81 cell divisions with lagging chromosomes, which yielded 28 micronucleated daughter cells and a total of 31 micronuclei for analysis. Micronucleated cells were tracked to assess micronuclear rupture, as evidenced by loss of NLS-EGFP signal from the mCherry-H2B micronuclear chromatin (Fig. 8 A, Video 1, Video 2, and Video 3). The average distance of lagging chromosomes from the pole at the time when chromatin decondensation was first detectable for micronuclei that eventually ruptured was 7.7 ± 1.2 μm, while the average distance from the pole for lagging chromosomes that formed micronuclei that did not rupture was 5.5 ± 0.7 μm (Fig. 8 A). These data support a model in which the position of lagging chromosomes and, thereby, subcellular location of micronucleus formation predict resulting micronuclear envelope stability.

Lagging chromosomes that form micronuclei farther from the spindle pole are more likely to experience micronuclear envelope rupture. (A) Plot of locations where micronuclei formed relative to the pole after nocodazole washout as a function of time of micronuclear envelope rupture in RPE1 cells stably expressing Centrin-1-GFP and CENP-A-GFP and transfected with mCherry-H2B and NLS-EGFP. n = 31 micronuclei (17 remain intact and 14 rupture) collected across 14 independent experiments. Dashed line represents the average measured position of micronucleus formation for micronuclei that experienced micronuclear envelope rupture: 7.7 ± 1.2 μm from closest spindle pole. (B) Representative still images of a cell with two lagging chromosomes. Lagging chromosome farther from the pole is indicated by a white arrowhead. Bottom panels are annotated to indicate position of Centrin foci (green circles) and the distance between farthest lagging centromere and the pole (yellow line). (C) Still frames of daughter cells from division shown in B. Micronucleus that formed around lagging chromosome farthest from the pole indicated by white arrowhead in top panels. Micronuclear envelope rupture denoted by loss of micronuclear NLS-EGFP signal (green) from micronuclear chromatin (mCherry-H2B, red) is indicated by red arrowhead in bottom panels.
Lagging chromosomes that form micronuclei farther from the spindle pole are more likely to experience micronuclear envelope rupture. (A) Plot of locations where micronuclei formed relative to the pole after nocodazole washout as a function of time of micronuclear envelope rupture in RPE1 cells stably expressing Centrin-1-GFP and CENP-A-GFP and transfected with mCherry-H2B and NLS-EGFP. n = 31 micronuclei (17 remain intact and 14 rupture) collected across 14 independent experiments. Dashed line represents the average measured position of micronucleus formation for micronuclei that experienced micronuclear envelope rupture: 7.7 ± 1.2 μm from closest spindle pole. (B) Representative still images of a cell with two lagging chromosomes. Lagging chromosome farther from the pole is indicated by a white arrowhead. Bottom panels are annotated to indicate position of Centrin foci (green circles) and the distance between farthest lagging centromere and the pole (yellow line). (C) Still frames of daughter cells from division shown in B. Micronucleus that formed around lagging chromosome farthest from the pole indicated by white arrowhead in top panels. Micronuclear envelope rupture denoted by loss of micronuclear NLS-EGFP signal (green) from micronuclear chromatin (mCherry-H2B, red) is indicated by red arrowhead in bottom panels.
Live imaging of an RPE1 cell expressing CENP-A-GFP, Centrin-1-GFP, and NLS-EGFP following nocodazole washout. A lagging chromosome forms a single micronucleus. Images were captured every 30 s, and video is played back at 10 frames per second.
Live imaging of an RPE1 cell expressing CENP-A-GFP, Centrin-1-GFP, and NLS-EGFP following nocodazole washout. A lagging chromosome forms a single micronucleus. Images were captured every 30 s, and video is played back at 10 frames per second.
Live imaging of an RPE1 cell expressing CENP-A-GFP, Centrin-1-GFP, NLS-EGFP with two lagging chromosomes, leading to formation of two micronuclei following nocodazole washout. Position of micronucleus forming farther from spindle pole is tracked with a blue dot. Images were captured every 30 s, and video is played back at 10 frames per second.
Live imaging of an RPE1 cell expressing CENP-A-GFP, Centrin-1-GFP, NLS-EGFP with two lagging chromosomes, leading to formation of two micronuclei following nocodazole washout. Position of micronucleus forming farther from spindle pole is tracked with a blue dot. Images were captured every 30 s, and video is played back at 10 frames per second.
Live imaging of an RPE1 cell (continuation of Video 2,) expressing mCherry-H2B (to mark chromatin, left channel) and CENP-A-GFP, Centrin-1-GFP, and NLS-EGFP (to mark centromeres, spindle poles, and nuclear envelope integrity, respectively, right) with two micronuclei following nocodazole washout. Position of micronucleus forming farther from spindle pole (shown in Video 2) continues to be tracked with a blue dot. Rupture of this micronucleus (marked in blue, which formed farther from the spindle pole) occurs at 86 min (indicated via loss of NLS-EGFP signal [right] from corresponding micronuclear mCherry-H2B–indicated chromatin [left]). Images were caputred every 2 mins, and video is played back at 10 frames per second.
Live imaging of an RPE1 cell (continuation of Video 2,) expressing mCherry-H2B (to mark chromatin, left channel) and CENP-A-GFP, Centrin-1-GFP, and NLS-EGFP (to mark centromeres, spindle poles, and nuclear envelope integrity, respectively, right) with two micronuclei following nocodazole washout. Position of micronucleus forming farther from spindle pole (shown in Video 2) continues to be tracked with a blue dot. Rupture of this micronucleus (marked in blue, which formed farther from the spindle pole) occurs at 86 min (indicated via loss of NLS-EGFP signal [right] from corresponding micronuclear mCherry-H2B–indicated chromatin [left]). Images were caputred every 2 mins, and video is played back at 10 frames per second.
To explore other possible explanations for the differences in micronuclear envelope stability in KIF18A KO and nocodazole washout cells, we investigated micronuclear chromatin area, the DNA damage marker γH2AX, and the presence of centromeres within micronuclei. However, none of these factors had strong correlations with micronuclear envelope stability (Fig. S5, A–D).

Micronuclear envelope rupture incidence does not strongly correlate with initial chromatin area, micronuclear area, centromere presence, or γH2AX DNA damage status. (A) Plot of initial chromatin area, a proxy for chromosome size, for micronuclei forming in KIF18A KO or RPE1 nocodazole washout–treated cells. n = 35 (RPE1 + nocodazole), n = 19 (KIF18A KO untreated), n = 31 (KIF18A KO + nocodazole), n = 16 (KIF18A KO + DMSO). P = 0.73, ns. Data points indicate individual micronuclei. (B) Plot showing area of DAPI-stained micronuclear chromatin in an asynchronous, fixed-cell population parsed by completeness of lamin A/C signal for KIF18A KO or RPE1 nocodazole washout–treated cells. n = 219 (RPE1 + nocodazole), n = 310 (KIF18A KO). KIF18A KO intact versus ruptured micronuclei, P = 0.06, ns.; RPE1 + nocodazole intact versus ruptured micronuclei, P = 0.73, ns. (C) Representative images showing DAPI (DNA, to indicate micronuclei) along with antibodies against lamin A/C (to assess micronuclear envelope integrity), ACA (to assess centromere presence), and γH2AX (to assess DNA damage) associated with micronuclei arising in KIF18A KO cells and RPE1 nocodazole washout–treated cells. (D) Plot showing micronuclei positive for ACA signal (top graph; ACA signal indicates that micronuclei likely contain whole chromosomes, while loss of centromeric signal suggests fragmentation) and γH2AX (bottom graph; γH2AX indicates foci of DNA damage) by method of micronuclear induction and p53 status. Data are pooled from three independent experiments. n = 262 (RPE1 control KD), n = 304 (RPE1 control + p53 KD), n = 398 (KIF18A KO control KD), n = 359 (KIF18A KO control KD + p53 KD), n = 297 (RPE1 MAD2 KD), n = 295 (MAD2 KD + p53 KD), n = 312 (RPE1 + nocodazole washout), n = 518 (RPE1 1 Gy, control KD), n = 620 (RPE1 1 Gy, control KD + p53 KD). *, P < 0.0001 (ACA). Indicated P values for numerical data were obtained using unpaired Student’s t test for comparisons between two conditions or one-way ANOVA with Tukey’s post hoc test for comparisons among more than two conditions. Indicated P values for categorical data were calculated using χ2 analysis. Noc., nocodazole.

Micronuclear envelope rupture incidence does not strongly correlate with initial chromatin area, micronuclear area, centromere presence, or γH2AX DNA damage status. (A) Plot of initial chromatin area, a proxy for chromosome size, for micronuclei forming in KIF18A KO or RPE1 nocodazole washout–treated cells. n = 35 (RPE1 + nocodazole), n = 19 (KIF18A KO untreated), n = 31 (KIF18A KO + nocodazole), n = 16 (KIF18A KO + DMSO). P = 0.73, ns. Data points indicate individual micronuclei. (B) Plot showing area of DAPI-stained micronuclear chromatin in an asynchronous, fixed-cell population parsed by completeness of lamin A/C signal for KIF18A KO or RPE1 nocodazole washout–treated cells. n = 219 (RPE1 + nocodazole), n = 310 (KIF18A KO). KIF18A KO intact versus ruptured micronuclei, P = 0.06, ns.; RPE1 + nocodazole intact versus ruptured micronuclei, P = 0.73, ns. (C) Representative images showing DAPI (DNA, to indicate micronuclei) along with antibodies against lamin A/C (to assess micronuclear envelope integrity), ACA (to assess centromere presence), and γH2AX (to assess DNA damage) associated with micronuclei arising in KIF18A KO cells and RPE1 nocodazole washout–treated cells. (D) Plot showing micronuclei positive for ACA signal (top graph; ACA signal indicates that micronuclei likely contain whole chromosomes, while loss of centromeric signal suggests fragmentation) and γH2AX (bottom graph; γH2AX indicates foci of DNA damage) by method of micronuclear induction and p53 status. Data are pooled from three independent experiments. n = 262 (RPE1 control KD), n = 304 (RPE1 control + p53 KD), n = 398 (KIF18A KO control KD), n = 359 (KIF18A KO control KD + p53 KD), n = 297 (RPE1 MAD2 KD), n = 295 (MAD2 KD + p53 KD), n = 312 (RPE1 + nocodazole washout), n = 518 (RPE1 1 Gy, control KD), n = 620 (RPE1 1 Gy, control KD + p53 KD). *, P < 0.0001 (ACA). Indicated P values for numerical data were obtained using unpaired Student’s t test for comparisons between two conditions or one-way ANOVA with Tukey’s post hoc test for comparisons among more than two conditions. Indicated P values for categorical data were calculated using χ2 analysis. Noc., nocodazole.
Discussion
Micronuclei have been proposed not only as passive markers of genomic instability but also as active drivers of tumorigenesis (Stephens et al., 2011; Rausch et al., 2012; Holland and Cleveland, 2012; Crasta et al., 2012; Nones et al., 2014; Zhang et al., 2015; Luijten et al., 2018). Inconsistent with this proposal, Kif18a mutant mice readily form micronuclei in vivo but do not spontaneously develop tumors. We investigated this apparent contradiction by testing the contributions of two nonmutually exclusive models: (1) that p53 activity in Kif18a mutant mice prevents propagation of micronucleated cells and the subsequent reincorporation of damaged DNA into primary nuclei and (2) that micronuclei form stable nuclear envelopes. Our data favor the second model and indicate that micronuclei in Kif18a mutant cells, which form as a result of mitotic chromosome alignment defects (Fonseca et al., 2019), have stable nuclear envelopes that undergo expansion as cells exit mitosis. The more stable micronuclear envelopes in KIF18A KO cells are less prone to experiencing rupture events, as assessed both in cultured cells and in mouse tissue sections, and this stability is independent of p53 status. In contrast, micronuclei that resulted from improper kinetochore–microtubule attachments induced by nocodazole washout formed farther from mitotic spindle poles, had unstable nuclear envelopes, and failed to undergo expansion (Hatch et al., 2013; Zhang et al., 2015; Liu et al., 2018). Taken together, this work demonstrates that the underlying cause of lagging chromosomes can strongly impact the stability of micronuclear envelopes that form around them and, therefore, their threat to genomic stability (Ding et al., 2003; Hoffelder et al., 2004; Terradas et al., 2009; Terradas et al., 2010; Huang et al., 2011; Crasta et al., 2012; Hatch et al., 2013; Zhang et al., 2015; Liu et al., 2018).
We found that loss of Kif18a modestly reduced the survival of Trp53 homozygotes and did not affect the survival of Trp53 heterozygotes. These data are inconsistent with the idea that p53-dependent cell-cycle arrest prevents micronuclei from promoting tumor development in Kif18a mutant mice. The precise reason for the differential survival of Kif18agcd2/gcd2, Trp53tm1 Tyj/tm1 Tyj and Kif18agcd2/gcd2, Trp53+/tm1 Tyj mice is not known. A small fraction of Kif18agcd2/gcd2 mice die shortly after birth, and surviving mice may be sensitive to the rapid tumorigenesis that occurs in the Trp53tm1 Tyj/tm1 Tyj model. However, we cannot formally rule out other potential contributing factors to survival differences, including (1) the combination of increased micronuclei in Kif18agcd2/gcd2, Trp53tm1 Tyj/tm1 Tyj homozygous mice, paired with a similar rupture rate seen in Trp53 mutants increases tumorigenesis, or (2) differences in tumor spectrum between Kif18agcd2/gcd2, Trp53tm1 Tyj/tm1 Tyj and Kif18agcd2/gcd2, Trp53tm1 Tyj/+ genotypes. In addition, our results suggest that the formation of micronuclei per se does not necessarily lead to tumorigenesis. This, together with prior studies that (1) detected no apparent increase in aneuploidy in Kif18agcd2/gcd2 mouse embryonic fibroblasts (Czechanski et al., 2015) and (2) demonstrated that Kif18a mutant mice are not predisposed to tumor formation when challenged with colitis-associated colorectal cancer (Zhu et al., 2013), suggests that Kif18a mutant mice maintain genomic stability despite micronuclear loads that are typically seen in mice genetically predisposed to spontaneous tumorigenesis (i.e., Atm mutant mice; Fonseca et al., 2019). Thus, we propose that additional physical or genetic insults are needed to create permissive environments that drive genomic instability and cellular transformation in micronucleated cells or tissues.
Our data indicate that the positioning of lagging chromosomes, which often form micronuclei, is impacted by the type of insult leading to the chromosome segregation error. Prior studies that characterized the impact of micronuclei on genomic stability primarily used treatments, such as nocodazole washout, that promote improper kinetochore–microtubule attachments and give rise to micronuclei that form in the central-spindle, far from the spindle poles (Crasta et al., 2012; Zhang et al., 2015; Hatch et al., 2013; Liu et al., 2018). In contrast, lagging chromosomes in KIF18A KO cells were located closer to the poles in late anaphase. The fact that micronuclei in KIF18A KO cells are relatively stable compared with those in nocodazole-treated cells is consistent with work indicating that bundled microtubules and a gradient of Aurora B inhibit proper nuclear envelope reformation near the center of anaphase spindles (Afonso et al., 2014; Maiato et al., 2015; Liu et al., 2018). Our data also indicate that the distance of a lagging chromosome from the pole is more important for nuclear envelope reformation than its position relative to the pole-to-pole axis.
On the other hand, chromosome size, prevalence of DNA damage, and whether the micronuclear chromatin contained centromeres did not strongly correlate with micronuclear envelope rupture status. These results differ somewhat from studies that indicated a correlation between damaged micronucleated DNA and envelope rupture (Hatch et al., 2013; Zhang et al., 2015). This could possibly be explained by an enrichment of KIF18A mutant cells in G2 phase following micronucleation (Umbreit et al., 2020). Consistent with this idea, Kif18a mutant mouse embryonic fibroblasts display an increase in G2 cells compared with WT (Czechanski et al., 2015). Alternatively, it is possible that KIF18A KO micronuclei may accrue damage without rupturing micronuclear envelopes. These possibilities should be explored in future studies. Additionally, we observed a lower frequency of anticentromere antibody (ACA)–positive micronuclei following nocodazole treatment than was seen in previous studies (Worral et al., 2018). This could potentially be a result of differences in nocodazole treatment length, where the shorter drug treatment used in our studies may lead to increased spindle-induced chromosome damage. While we cannot rule out that there are other factors contributing to observed differences in micronuclear envelope stability seen in KIF18A KO and nocodazole-treated cells, our data are consistent with the idea that lagging chromosome position strongly influences nuclear envelope stability and that this effect may be relevant in vivo.
In addition to the negative regulation proposed by microtubule bundling and inhibitory Aurora gradients, it is possible that positive regulation by the spindle poles and ER membranes may promote stable nuclear envelope reformation. This idea is consistent with our observations that pole-proximal positioning of lagging chromosomes correlates with successful expansion of micronuclear chromatin area and recruitment of lamin B to micronuclear membranes in KIF18A KO cells. For example, if lagging chromosomes are positioned nearer to the stores of nuclear envelope components located in the mitotic ER, this pole-proximal location may enhance prompt recruitment of necessary proteins and membrane to micronuclear envelopes during telophase. Potential positive regulators that impact nuclear envelope stability will require further investigation.
Why does micronuclear envelope stability differ between normal and tumor tissues? One possibility is that changes occurring during the process of cellular transformation may increase the frequency of micronuclear rupture. For example, aneuploidy in tumor cells could result in lagging chromosomes being positioned closer to the midzone. Furthermore, a reduction of lamina in tumor cells has been associated with reduced stress resistance in the nuclear envelope, resulting in more frequent nuclear blebbing and rupture (Vergnes et al., 2004; Vargas et al., 2012; Hatch et al., 2013; Denais, et al., 2016). Thus, the increased stiffness of tumorous tissue, paired with increased cytoskeletal forces present, may contribute to the increased prevalence of micronuclear envelope rupture in this context. Although growing evidence links increased mechanical stress to elevated rupture of primary nuclei in cancer cells, more research is needed to completely map these mechanistic changes to micronuclear envelope rupture in an in vivo context.
In conclusion, our work raises a number of interesting questions about the impact of micronuclei in vivo. To what extent and under what cellular conditions do micronuclei behave as drivers of tumorigenesis, and barring those conditions, are micronuclei simply passive biomarkers of instability? How does the surrounding tissue architecture impact transmitted cytoskeletal forces and alter micronuclear behaviors and rupture incidence? To what degree are immune system inflammatory sensors successful at recognizing and clearing damaged extranuclear DNA in vivo, and how might inflammatory micronucleation alter the progression of tumorigenesis at an organismal level? The development of new models that allow investigators to tune micronuclear rupture in vivo will be required to fully understand the impact of micronuclei on tumorigenesis.
Materials and methods
Animal ethics statement
All procedures involving mice were approved by The Jackson Laboratory institutional animal care and use committee and performed in accordance with the National Institutes of Health guidelines for the care and use of animals in research.
Mouse development
A cohort of laboratory mice heterozygous for the null alleles Trp53tm1 Tyj and Kif18agcd2 were generated by in vitro fertilization of oocytes from 30 heterozygous Trp53tm1 TyJ females (JAX JR#2526, C.129S2(B6)-Trp53<tm1Tyj>/J) with sperm from a B6.Kif18a^gcd2 male (JAX JR#10508/MMRRC #034325-JAX). A total of 133 offspring (64 females, 69 males) were obtained from this expansion, and those that were doubly heterozygous for each allele were intercrossed to produce a large cohort of animals for survival analysis. Cohort size and sample groups by genotype were based on published tumorigenesis and survival data on the Trp53<tm1Tyj>/ allele (Jacks et al., 1994) and z-tests, α = 0.5, 85% power. Genotypes and sample groups, excluding censored individuals, were as follows: heterozygous p53, Kif18agcd2/gcd2, Trp53tm1 Tyj/+ (40 females, 35 males) versus Kif18a+/+, Trp53tm1 Tyj/+ (40 females, 38 males); homozygous p53, Kif18agcd2/gcd2, Trp53tm1 Tyj/tm1 Tyj (22 females, 20 males) versus Kif18a+/+, Trp53tm1 Tyj/tm1 Tyj (25 females, 33 males) or Kif18agcd2/+, Trp53tm1 Tyj/tm1 Tyj (13 females, 20 males). A cohort of Kif18agcd2/gcd2, Trp53+/+ (38 females, 34 males) genetic background controls was included, and no tumors were observed in this group of mice.
Two approaches were used for survival analysis. GraphPad Prism 8 and R software were used to generate survival curves and to perform Wang–Allison tests. These tests compare the number of subjects alive and dead beyond a specified time point (90th percentile) between two sample groups. To account for censored data, a nonparametric log-rank test was used to compare the survival distributions. Log-rank test results (χ2 statistic) were then used to calculate the significance of the test.
Peripheral blood micronucleus assays
Micronuclear assays of peripheral blood were conducted as previously described (Dertinger et al., 1996; Reinholdt et al., 2004). Peripheral blood was collected from the retro-orbital sinus of male and female laboratory mice, 12–18 wk of age, for each of the following genotypes (four males and four females per genotype). Genotypes were as follows: Kif18agcd2/gcd2, Trp53tm1 Tyj/tm1 Tyj; Kif18a+/+, Trp53tm1 Tyj/tm1 Tyj; Kif18agcd2/+, Trp53tm1 Tyj/tm1 Tyj; Kif18a+/+, Trp53+/+; and a cohort of Kif18agcd2/gcd2, Trp53+/+ (38 females, 34 males). Briefly, 75 μl of blood was immediately mixed with 100 μl of heparin, and the mixture was then pipetted into 2 ml of ice-cold (−80°C) 100% methanol with vigorous agitation to prevent clumping. Samples were stored at −80°C overnight before processing for flow cytometry.
Sample preparation and flow cytometry
Each blood sample was washed with 12 ml of sterile, ice-cold bicarbonate buffer (0.9% NaCl, 5.3 mM sodium bicarbonate, pH 7.5), centrifuged at 500g for 5 min, and resuspended in a minimum of carryover buffer (∼100 μl). 20 μl of each sample was added to a 5-ml polystyrene round-bottomed tube, and to each sample, an 80-μl solution of CD71-FITC and RNase A (1 mg/ml) was added. Additional control samples were CD71-FITC alone and bicarbonate buffer alone to which propidium iodide (PI) was later added (see below). Cells were incubated at 4°C for 45 min, washed with 2 ml cold bicarbonate buffer, and centrifuged as above. Cell pellets were stored on ice and then immediately before flow cytometric analysis, resuspended in 1 ml of ice-cold PI solution (1.25 mg/ml) to stain DNA.
Flow cytometry
Samples were processed on a BD Bioscience LSR II fluorescence-activated cell sorter gated for FITC and PI and set to collect 20,000 CD71+ events at 5,000 events/s. The CD71-FITC and PI control samples were used to calibrate for autofluorescence. Reticulocytes (Ret; CD71+, PI− [in the presence of RNase A]), mature RBCs (CD71−, PI−), micronucleated normochromatic erythrocytes (NCE-MN; CD71−, PI+), and micronucleated reticulocytes (Ret-MN; CD71+, PI+) were measured using FlowJo software. The total percentage of spontaneous micronuclei in NCE was NCE-MN / (NCE-MN + RBCs) × 100.
Cell culture and transfections
hTERT-RPE1 cells (American Type Culture Collection) were maintained at 37°C with 5% CO2 in MEM-α (Life Technologies) containing 10% FBS (Life Technologies) and 1% antibiotics. The Kif18A-deficient CRISPR line was produced as previously described (Fonseca et al., 2019). For fixed cell assays, cells were seeded on 12-mm acid-washed coverslips and transfected with 30 pmol siRNA complexed with RNAiMAX according to the manufacturer’s instructions. For live cell imaging, cells were subjected to plasmid transfections (2 μg each plasmid), performed using a 4D-Nucleofector system (Lonza) according to the manufacturer’s instructions. RPE1 cells were transfected with SF solution and electroporated with code EN-150. Following electroporation, cells were seeded in 35-mm poly L-lysine–coated glass-bottom dishes (MatTek) 8 h before the addition of siRNA.
Primary murine tumor extraction and histology sections
For derivation of primary murine tumors, mice were euthanized when they showed signs of labored breathing (suspected thymic lymphoma) or exhibited visible tumors causing difficulties in mobility (suspected muscular sarcoma). Mice were dissected; tissue samples were taken for genotype verification; and individual tumors were excised, washed in cold PBS, halved, and fixed in normal buffered formalin and embedded in paraffin. 5-μm step sections were mounted on microscope slides, and 10 slides per tissue sample were used for immunolabeling. Mounted paraffin sections were deparaffinized in xylene and rehydrated through a gradual ethanol series. Antigen retrieval was performed by boiling 0.01 M citric acid (pH 6) for 20 min. Slides were blocked in 20% goat serum in Abdil for 1 h before antibody incubation overnight and staining via Hoechst (1:2,000, H3570; Thermo Fisher Scientific). Stained sections were mounted in ProLong Gold Antifade Reagent without DAPI (Thermo Fisher Scientific).
Tissue samples were genotyped by The Jackson Laboratory Transgenic Genotyping Services. Tissue sectioning and slide preparation was performed by The Jackson Laboratory Histopathology Services.
Primary murine thymic lymphoma metaphase spreads
After mice were euthanized and individual thymic lymphoma tumors excised and washed in cold PBS (see above), primary single-cell suspension cultures of each biological thymic lymphoma sample were created by masticating tumor tissue with razor blades in a 100-mm cell culture dish containing 5 ml PBS followed by passing cells through a 0.22-gauge syringe. Individual cell suspensions were seeded into a six-well dish and fed in Roswell Park Memorial Institute media (Life Technologies) with 10% FBS (Life Technologies) and 1% antibiotics/antimycotics and incubated at 37°C in 5% CO2. Media were refreshed at 24 h, and once single-cell suspension cultures stabilized, cells were moved to T25 flasks and grown at low passage numbers. To enrich for mitotic cells, thymic lymphoma cultures were pelleted and resuspended in fresh media containing 15% FBS and 0.02 μg/ml Colcemid (KaryoMAX Colcemid solution in PBS, 15212012; Life Technologies) for 3 h while incubating at 37°C in 5% CO2. Thymic lymphoma cultures were pelleted, media were removed, and cells were resuspended in a hypotonic solution (0.56% KCl; Sigma-Aldrich) for 15 min at 37°C. Following incubation, cells were pelleted, the hypotonic solution was removed, and cells were resuspended in ice-cold fixative (3:1 methanol/glacial acetic acid; Sigma-Aldrich). Cells were pelleted and subsequently resuspended in fresh aliquots of ice-cold fixative three times before dropping 100 μl of fixed sample from a height of 1 ft onto Milli-Q water–rinsed slides. Slides were tilted at a 45° angle to create gravity-assisted chromosome spreads before drying on a hotplate for 2 h. Slides were mounted with ProLong Gold Antifade Reagent with DAPI (Thermo Fisher Scientific) and imaged using a 20× objective (Nikon Instruments). Only isolated chromosome spreads with clear spread patterns were quantified to assess chromosome copy numbers likely to have originated from individual nuclei rather than from multiple mitotic cells dropped in closer proximity.
Plasmids and siRNAs
H2B-GFP was a gift from Geoff Wahl (The Salk Institute, La Jolla, CA; Addgene plasmid no. 11680). mCherry-Nucleus-7 plasmid, referred to in the text as mCherry-NLS for simplicity, was generated by the Michael Davidson Plasmid Lab (Florida State University, Tallahassee, FL) and obtained from Addgene (Addgene plasmid no. 55110; http://n2t.net/addgene:55110; RRID:Addgene_55110). NLS-EGFP plasmid was generated by Rob Parton (The University of Queensland, Brisbane, Australia) and obtained from Addgene (Addgene plasmid no. 67652, http://n2t.net/addgene:67652; RRID:Addgene_67652; Ariotti et al., 2015). Cells were transfected using siRNAs targeting MAD2 sequence 5′-AGAUGGAUAUAUGCCACGCTT-3′ (QIAGEN); pools of siRNAs targeting the TP53 sequences 5′-GAAAUUUGCGUGUGGAGUA-3′, 5′-GUGCAGCUGUGGGUUGAUU-3′, 5′-GCAGUCAGAUCCUAGCG UC-3′, and 5′-GGAGAAUAUUUCACCCUUC-3′ (ON-TARGETplus; Dharmacon); or Silencer Negative Control #2 siRNA (Thermo Fisher Scientific).
Cell fixation and immunofluorescence
RPE1 cells were fixed in −20°C methanol (Thermo Fisher Scientific) and 1% paraformaldehyde (Electron Microscopy Sciences). Cells were then washed in 1× TBS and blocked in antibody dilution buffer (Abdil; TBS pH 7.4, 1% BSA, 0.1% Triton X-100, and 0.1% sodium azide) containing 20% goat serum. Cells were incubated with the following primary antibodies for 1 h at room temperature in Abdil: mouse anti-human lamin A/C (1:200 in cells or 1:1,000 for tissue sections, MAB3211; Millipore), rabbit anti-lamin A/C (1:200 in cells or 1:1,000 for tissue sections, ab26300; Abcam), rabbit anti-lamin B1 (1:200, ab16048; Abcam), rabbit anti-γH2AX (1:200, 9718S; Cell Signaling Technologies), rabbit anti-mCherry (1:200, ab167453; Abcam), mouse anti-γ-tubulin (1:200, T5192; Sigma-Aldrich), and rabbit anti-ezrin (1:1,000, 3145; Cell Signaling Technologies). Cells were incubated overnight at 4°C with human ACA (1:200, 15235; Antibodies Inc.). Cells were incubated for 1 h at room temperature, in the dark, with goat secondary antibodies against mouse, rabbit, or human IgG conjugated to Alexa Fluor 488, 594, or 647 (Molecular Probes by Life Technologies). Coverslips were mounted on glass slides with ProLong Gold Antifade Reagent plus DAPI (Thermo Fisher Scientific).
Microscopy
Cells were imaged on an ECLIPSE Ti-E inverted microscope (Nikon Instruments) controlled by NIS Elements software (Nikon Instruments) with a SPECTRA X light engine (Lumencor); Clara cooled CCD camera (Andor); 37°C environmental chamber; and the following Nikon objectives: 20× Plan Apo differential interference contrast (DIC) M N2 (NA 0.75), 40× Plan Apo DIC M N2 (NA 0.95), 60× Plan Apo λ (NA 1.42), and 100× APO (NA 1.49).
Imaging of nuclear envelope component lamin B1 for assessment in RPE1 cells and lamin A/C or lamin B1 assessment in histological sections of mouse tissues was performed at the Microscopy Imaging Center at the University of Vermont. Fixed cells or tissues were imaged using an A1R-ER confocal microscope (Nikon Instruments) controlled by NIS Elements software (Nikon Instruments) with a SOLA light engine (Lumencor); Nikon A1plus camera containing a hybrid resonant and high-resolution Galvano galvanometer scan head set on an inverted Ti-E system (Nikon Instruments); and the following Nikon objectives: 20× Plan Apo λ (NA 0.75), 40× Plan Fluor Oil DIC H N2 (NA 1.3), and 60× APO TIRF Oil DIC N2 (NA 1.49).
Live cell imaging
Cells were transferred into CO2-independent media with 10% FBS and 1% antibiotics (Life Technologies) for imaging via fluorescence microscopy. For long-term imaging of H2B-GFP– and/or mCherry-Nucleus-7–expressing cells, single-focal-plane images were acquired at 2-min intervals with a 20× or 40× objective. For imaging live micronucleus production and chromatin decondensation/expansion, fields were scanned and metaphase cells selected for imaging. For tracking lagging chromosomes leading to micronucleus formation in RPE1 cells expressing mCherry-H2B, CENP-A-GFP/-Centrin-1-GFP, and NLS-EGFP, single-focal-plane images were acquired at 30-s intervals with a 20× objective in the GFP channel only to prevent phototoxicity. Manual adjustments to the focus throughout acquisition were made to keep Centrin and lagging chromosomes in focus, as required. To track micronuclear envelope integrity after micronuclear formation, single-focal-plane images were acquired at 2-min intervals with a 20× objective in both the GFP and mCherry channels. Micronuclear envelope rupture was identified when NLS-EGFP signal was abruptly lost from micronuclear chromatin (indicated via mCherry-H2B).
Micronuclear analysis in fixed cells
For fixed cells, micronucleus counts were made using single-focal-plane images of DAPI-stained cells. Image acquisition was started at a random site at the bottom edge of the coverslip, and images were acquired every two fields of view using a 20× objective for micronucleus frequencies in each population. Micronuclear envelope rupture frequencies were determined using single-focal-plane images of DAPI-stained cells. Image acquisition was started at a random site at the bottom of the coverslip; all micronuclei that were observed were imaged using a 20× objective until ∼50 micronuclei were found via DAPI stain only (blind to nuclear envelope marker) in each condition. Once micronuclei were identified and specific x, y, z coordinates marked for imaging, micronucleated cells were imaged in all applicable fluorescent channels. Any micronuclear envelope without continuous lamin A/C was scored as “ruptured/absent,” and only micronuclei with continuous lamin A/C labeling were deemed “intact” to create a binary readout of lamin A/C status.
To validate the use of lamin A/C presence as a marker of intact micronuclear envelopes, KIF18A KO cells and RPE1 cells were transfected with mCherry-Nucleus-7 plasmid (mCherry tag fused to NLS repeats to allow targeted nuclear import of plasmid), seeded onto 12-mm acid-washed coverslips, and maintained for 24 h. After induction of micronuclei via nocodazole treatment and drug washout for RPE1 cells or without additional treatment in KIF18A KO cells, cells were fixed and stained with mouse anti-lamin A/C and rabbit anti-mCherry and mounted on glass slides with ProLong Gold Antifade Reagent plus DAPI. Coverslips were scanned in the DAPI channel only, and all micronuclei found (up to 50 micronuclei per experiment) were imaged in all channels to assess co-occurrence of lamin A/C and mCherry signals. Validation of lamin A/C signal to assess micronuclear envelope integrity was also performed in both KIF18A KO and RPE1 cells treated with nocodazole washout via costaining with antibodies against lamin A/C using the same imaging approach. To assess DNA damage in micronuclei, an antibody against γH2AX was used; any positive signal, including a single focus within the micronuclear chromatin, was recorded as γH2AX positive and included under the category “damaged.” Micronuclei without any detectable γH2AX signal were categorized as not exhibiting DNA damage.
Nuclear envelope protein assessment in micronuclei
Fixed cells with micronuclei were identified by scanning in DAPI. Relevant fields were recorded and imaged on a Nikon confocal microscope focused within a single central plane through main nuclei. Quantification of nuclear envelope components was performed in ImageJ using the Radial Profile Plot plugin. Briefly, the plugin produces a profile plot of integrated fluorescence intensity measurements, for a series of concentric circles, as a function of distance from the central point. A standardized circular region of interest (ROI) was used to collect all micronuclear radial profile measurements, with the center of the ROI placed over the center of each micronucleus. Radial profile plots were collected in DAPI (to determine the distance cutoff for each micronucleus circumference) and in the lamin B1 channel (to quantify its abundance within the outer rim of the micronuclear envelope). Background-subtracted lamin B1 measurements at the outer rim of each micronuclear envelope were recorded. This process was repeated to measure lamin B1 presence at the outer rim of primary nuclei and to report the relative ratio of lamin B1 incorporation within nuclear envelopes of micronuclei and primary nuclei occurring in the same cell for comparison. For primary nuclear measurements, ROIs were arranged around the smallest circular ROI touching three sides of the main nucleus.
Lagging chromosome measurements
KIF18A KO RPE1 cells were synchronized with 10 μM CDK-1 inhibitor R0-3306 (Sigma-Aldrich) diluted in MEM-α with 10% FBS and 1% antibiotics for 15 h before drug wash out. Cells were fixed 1 h after release to enrich for late anaphase cells. RPE1 WT cells were treated with 5 μM nocodazole (Sigma-Aldrich) for 2 h before drug wash out to induce merotelic attachments. Cells were fixed 45 min after washout to enrich for late anaphase cells.
Fixed cells in late anaphase were imaged in multiple z-stack focal planes to capture both focused spindle poles and individual ACA puncta. Image analysis was done in ImageJ with the straight line segment tool to obtain individual chromosome-to-pole distance measurements. One end of the line was anchored at the focused plane of a single spindle pole, and the other end was moved to the center of each focused ACA puncta (in the appropriate focal plane) for all 23 centromeres positioned for segregation to that pole (spindle-to-centromere distances taken for each respective half-spindle). All centromere positions were recorded, and the average chromosome distribution was calculated for each individual half-spindle measured to account for cells fixed in different stages of anaphase. Lagging chromosomes were determined as those centromeres with measured centromere-to-pole distances >2 SDs outside the average centromere-to-pole distance for all centromere puncta per each half-spindle. Normalized centromere-to-pole distances were obtained for each lagging chromosome by dividing each centromere’s distance-to-pole value by the average centromere-to-pole distance for its respective half-spindle.
Chromatin decondensation/micronuclear envelope expansion measurements
RPE1 cells were transfected with H2B-GFP plasmid. 24 h after transfection, cells were transferred to CO2-independent media for live imaging. For nocodazole or vehicle control DMSO conditions, RPE1 cells were treated with drug or vehicle control for 2 h before drug washout (cells flushed three times with PBS) immediately before transferring to CO2-independent media and beginning of filming. Cells found to be in metaphase were imaged every 2 min using a 40× objective and imaged for a duration of at least 4 h.
Chromatin decondensation measurements were obtained using ImageJ by applying the minimum threshold to completely cover chromatin (H2B-GFP) signal and measuring the area of the thresholded region corresponding to an individual chromatin mass forming either (1) a daughter nucleus or (2) a micronucleus. Frames that did not provide appropriate spatial separation to select only a single daughter cell nucleus or micronucleus without interference (overlapping other nuclei/edge of frame) were excluded from measurement. Area measurements began in the first frame of chromatin decondensation (following completion of chromatin segregation in late anaphase), and measurements were taken every subsequent frame for 1 h after anaphase onset or until the chromatin area plateaued.
Online supplemental material
Fig. S1 shows micronuclei identified in murine healthy thymus and thymic lymphoma from Kif18agcd2/gcd2, Trp53tm1 Tyj/tm1 Tyj and Kif18a+/+, Trp53tm1 Tyj/tm1 Tyj tissues stained with Hoescht (DNA), lamin A/C (nuclear envelopes), and an antibody against the plasma membrane protein ezrin. Fig. S2 shows metaphase chromosome spreads from primary murine lymphoma cultured cells from Kif18agcd2/gcd2, Trp53tm1 Tyj/tm1 Tyj and Kif18a+/+, Trp53tm1 Tyj/tm1 Tyj genotypes. Fig. S3 shows validation of the lamin A/C antibody signal in RPE1 cells, using live/fixed imaging of RPE1 cells expressing an mCherry-NLS plasmid. Fig. S4 shows frequency of lagging chromosomes observed in unsynchronized KIF18A KO cells and RPE1 cells treated with nocodazole washout. Fig. S5 shows characterization of micronuclei in RPE1 cells. Table S1 summarizes counts of micronucleated cells in vivo from healthy thymus, spleen, and liver. Table S2 summarizes counts of micronuclear loads within thymic lymphoma tissues. Table S3 summarizes counts of micronuclei lacking lamin A/C within thymic lymphoma tissues. Table S4 summarizes micronuclear load within thymic lymphoma for tissues also stained with the plasma membrane protein ezrin. Table S5 summarizes frequency of micronuclei displaying incomplete lamin A/C in thymic lymphoma for tissues also stained with the plasma membrane protein ezrin. Table S6 shows micronucleated RPE1 or KIF18A KO cells as a fraction of total cells following each of the used induction methods (see experimental design in Fig. 4 A). Table S7 summarizes the frequency of incomplete micronuclear envelopes observed in RPE1 or KIF18A KO cells following each induction method. Table S8 summarizes micronucleated cells lacking complete lamin A/C micronuclear envelopes in RPE1 and KIF18A KO cells subjected to nocodazole washout or DMSO vehicle control. Table S9 summarizes counts of micronuclei lacking lamin B within thymic lymphoma tissues. Videos 1 and 2 show positions of lagging chromosomes that form micronuclei, and Video 3 shows the continued integrity of these micronuclei over many hours.
Acknowledgments
We thank Nicole Bouffard and staff of the University of Vermont Microscopy Imaging Center for support regarding the imaging of histological tissues. We thank Alexey Khodjakov (Wadsworth Center, New York State Department of Health, Albany, NY) for CENP-A-GFP/-Centrin-1-GFP stable RPE1 cells and Alan Howe (University of Vermont) for rabbit anti-ezrin antibodies.
This work was supported by a Vermont Space Grant Consortium Fellowship awarded to L.A. Sepaniac under National Aeronautics and Space Administration Cooperative Agreement NNX15AP86H, a pilot award from the National Cancer Institute funded Cancer Center at The Jackson Laboratory (NIH/NCI P30CA034196) to L.G. Reinholdt and J. Stumpff, and a National Institutes of Health grant GM121491 and University of Vermont Cancer Center pilot grant to J. Stumpff. Confocal microscopy was supported by National Institutes of Health, National Center for Research Resources award 1S10OD025030-01.
The authors declare no competing financial interests.
Author contributions: Conceptualization: L.G. Reinholdt, J. Stumpff. Methodology: L.A. Sepaniac, W. Martin, L.A. Dionne, L.R. Reinholdt, and J. Stumpff. Investigation: L.A. Sepaniac, W. Martin, L.A. Dionne, L.G. Reinholdt, and J. Stumpff. Resources: W. Martin, L.A. Dionne, L.G. Reinholdt, and J. Stumpff. Biostatistics: T.M. Stearns. Writing, original draft: L.A. Sepaniac, L.G. Reinholdt, and J. Stumpff. Writing, review, and editing: L.A. Sepaniac, W. Martin, L.A. Dionne, T.M. Stearns, L.G. Reinholdt, and J. Stumpff. Visualization: L.A. Sepaniac, L.G. Reinholdt, and J. Stumpff. Supervision: L.G. Reinholdt and J. Stumpff.

