


The actin cytoskeleton is one of the targets of the pH gradient in tip-growing cells, but how cytosolic pH regulates the actin cytoskeleton remains largely unknown. We here demonstrate that Arabidopsis ADF7 and ADF10 function optimally at different pH levels when disassembling actin filaments. This differential pH sensitivity allows ADF7 and ADF10 to respond to the cytosolic pH gradient to regulate actin dynamics in pollen tubes. ADF7 is an unusual actin-depolymerizing factor with a low optimum pH in in vitro actin depolymerization assays. ADF7 plays a dominant role in promoting actin turnover at the pollen tube apex. ADF10 has a typically high optimum pH in in vitro assays and plays a dominant role in regulating the turnover and organization of subapical actin filaments. Thus, functional specification and cooperation of ADF isovariants with different pH sensitivities enable the coordination of the actin cytoskeleton with the cytosolic pH gradient to support pollen tube growth.
Introduction
Tip growth is a polarized cell growth process whereby the growth occurs predominantly or exclusively at the extreme tip of a cell. It is crucial for fundamental physiological processes, e.g., sexual reproduction and nutrition uptake in plants (Bibeau et al., 2021; Dumais, 2021; Qin and Yang, 2011; Rounds and Bezanilla, 2013). The polarized distribution of ions is important for the growth of tip-growing cells (Bascom et al., 2018) and tip growth is associated with a pH gradient (Gibbon and Kropf, 1994). The pollen tube, which delivers non-motile sperm cells for fertilization in flowering plants, is an ideal cellular system to uncover how ion gradients affect tip growth. Certain ions, such as calcium ions (Ca2+) and protons (H+), show polar distribution during pollen tube growth (Michard et al., 2017). H+ forms a gradient in lily and tobacco pollen tubes, resulting in an alkaline band at the base of the clear zone and a growth-dependent acidic tip domain (Feijó et al., 1999; Michard et al., 2008). In Arabidopsis pollen tubes, the pH gradually increases from the apex to the base (Chen et al., 2020; Hoffmann et al., 2020). Loss of function of H+-ATPases in pollen tubes affects their growth and fertility (Chen et al., 2020; Hoffmann et al., 2020). The self-incompatibility response causes dramatic acidification of the cytoplasm, which arrests pollen tube growth (Wilkins et al., 2015).
Although it is unclear how pH regulates pollen tube growth, the actin cytoskeleton is a known target of the cytosolic pH gradient in pollen tubes (Bascom et al., 2018). Cytosol acidification caused by loss of function of H+-ATPases disrupts the subapical actin structures (Hoffmann et al., 2020). As a pH-responsive actin-binding protein (ABP; Yonezawa et al., 1985), ADF/cofilin is a candidate for coordinating the cytosolic pH gradient with the actin cytoskeleton. ADF/cofilin prefers a high pH when severing and disassembling actin filaments (Bamburg et al., 1999; Maciver and Hussey, 2002). It was proposed that ADF promotes actin polymerization by fragmenting actin filaments and generating more free barbed ends to boost actin polymerization at the subapex, thus facilitating the construction of the actin fringe structure (Chen et al., 2002; Lovy-Wheeler et al., 2005). The role of ADF in regulating apical actin dynamics has received less attention, mainly due to the assumption that ADFs function optimally at high pH (Bamburg et al., 1999; Maciver and Hussey, 2002). The biochemical function and regulation of pollen ADFs have been documented quite extensively (Allwood et al., 2002; Lopez et al., 1996; Smertenko et al., 2001). Several Arabidopsis ADFs are present in pollen. ADF5, which is comparatively less abundant, stabilizes actin filaments by bundling them (Zhu et al., 2017). ADF7 and ADF10 are pollen-specific (Bou Daher et al., 2011; Daher and Geitmann, 2012) and very abundant; they both promote actin turnover (Jiang et al., 2017b; Wang et al., 2023; Zheng et al., 2013) and they are functionally distinct in promoting actin turnover in pollen (Jiang et al., 2022). We here demonstrate that ADF7 and ADF10 have different pH preferences in disassembling actin filaments, and they are differentially required for promoting actin turnover within different regions of the pollen tube growth domain in Arabidopsis. ADF7 and ADF10 thus coordinate the actin cytoskeleton with the pH gradient, which ensures that intracellular trafficking occurs efficiently to drive rapid polarized pollen tube growth.
Results and discussion
Arabidopsis ADF7 and ADF10 function optimally at different pH levels when disassembling actin filaments in vitro
We analyzed the impact of pH on the in vitro activity of two major Arabidopsis pollen ADFs, ADF7 and ADF10. High-speed F-actin cosedimentation experiments showed that ADF7 and ADF10 respond differently to pH when disassembling actin filaments (Fig. 1 A). ADF7 has higher actin disassembling activity at low pH and its activity gradually reduces as the pH rises (Fig. 1, A and B). ADF10 behaves more typically: it has higher actin disassembling activity at high pH, and its activity gradually increases as the pH rises (Fig. 1, A and B). These results were also confirmed by the kinetic actin depolymerization assay (Fig. 1, C and D). Next, we visualized the activity of ADF7 and ADF10 in shortening preassembled actin filaments. The length of actin filaments reduced as the concentration of ADF7 and ADF10 rose at both pH 6.5 and pH 8.0 (Fig. 1, E and F). However, ADF7 has higher filament shortening activity at pH 6.5 than at pH 8.0, and ADF10 has higher filament shortening activity at high pH 8.0 than at pH 6.5 (Fig. 1, E and F). We also examined how pH affects the binding affinity of ADF7 and ADF10 to actin monomers. By NBD-actin binding assay, we found that ADF7 quenched the NBD fluorescence of both NBD-ATP-G-actin and NBD-ADP-G-actin in a dose-dependent manner (Fig. 1, G and H). As the binding capability of ADF/cofilin to ADP-G-actin is closely related to its activity in disassembling actin filaments, we quantified the binding affinity of ADF7 and ADF10 to NBD-ADP-G-actin at three different pHs using the well-characterized ADF1 (Carlier et al., 1997) as the control. The binding affinity of ADF1 for NBD-ADP-G-actin increases as the pH rises (Fig. 1 I), and ADF10 behaves like ADF1, as its binding to NBD-ADP-G-actin also increases at high pH (Fig. 1 I). However, we found that ADF7 binds to NBD-ADP-G-actin with a higher affinity at low pH (Fig. 1 I). Thus, ADF7 and ADF10 have opposing pH preferences when disassembling actin filaments in vitro.
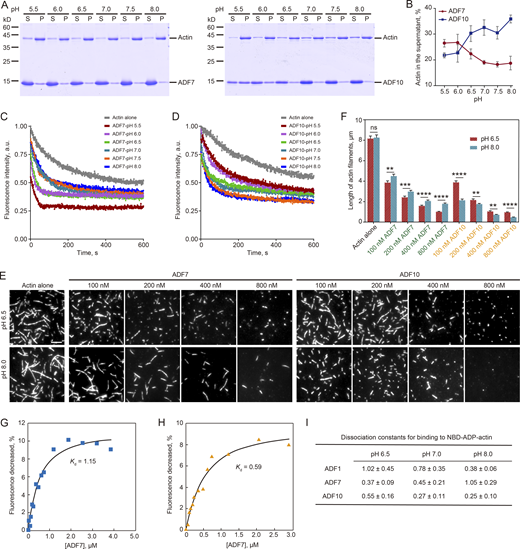
ADF7 and ADF10 have differential responses to pH in disassembling actin filaments in vitro. (A) High-speed F-actin cosedimentation experiments in the presence of ADF7 and ADF10 at different pH. Actin filaments at 3 μM were incubated with 20 μM ADF7 or 20 μM ADF10 at different pH for 30 min at room temperature and the mixtures were subjected to analysis by SDS-PAGE. S, supernatant; P, pellet. (B) Quantification of the amount of actin in the supernatant. The amount of actin in the supernatant from A was plotted. The data are presented as mean ± SD. (C and D) The effect of ADF7 (C) or ADF10 (D) on promoting dilution-mediated actin depolymerization under different pHs. Preassembled actin filaments at 5 μM (50% NBD-labeled) were diluted to 200 nM in the presence of 200 nM ADF7 or 200 nM ADF10 at pH ranging from 5.5 to 8.0. (E and F) ADF7 and ADF10 shorten actin filaments. (E) Representative images of actin filaments. Preassembled actin filaments (50% rhodamine-labeled) at 250 nM were incubated with various concentrations of ADF7 or ADF10 at either pH 6.5 or pH 8.0 for 5 min, and the images were then captured by TIRF microscopy. Bar = 5 μm. (F) The lengths of actin filaments in the presence of ADF7 or ADF10 were measured and plotted. Data are presented as mean ± SD. The statistical analysis was performed with an unpaired two-tailed Student’s t test. ****P < 0.0001; ***P < 0.001; **P < 0.01; ns, no significant difference. (G) NBD-actin binding assay to determine the binding activity of ADF7 to G-actin at pH 8.0. The representative Kd for binding of ADF7 to ADP-actin is 1.15 μM. (H) NBD-actin binding assay to determine the binding activity of ADF7 to G-actin at pH 6.5. The representative Kd for binding of ADF7 to ADP-actin is 0.59 μM. (I) The average Kd for the binding of ADFs to NBD-ADP-actin. The average Kd (mean ± SD) for binding of ADF1, ADF7, or ADF10 to ADP-actin is presented. The experiment was repeated three times. Source data are available for this figure: SourceData F1.
ADF7 and ADF10 have differential responses to pH in disassembling actin filaments in vitro. (A) High-speed F-actin cosedimentation experiments in the presence of ADF7 and ADF10 at different pH. Actin filaments at 3 μM were incubated with 20 μM ADF7 or 20 μM ADF10 at different pH for 30 min at room temperature and the mixtures were subjected to analysis by SDS-PAGE. S, supernatant; P, pellet. (B) Quantification of the amount of actin in the supernatant. The amount of actin in the supernatant from A was plotted. The data are presented as mean ± SD. (C and D) The effect of ADF7 (C) or ADF10 (D) on promoting dilution-mediated actin depolymerization under different pHs. Preassembled actin filaments at 5 μM (50% NBD-labeled) were diluted to 200 nM in the presence of 200 nM ADF7 or 200 nM ADF10 at pH ranging from 5.5 to 8.0. (E and F) ADF7 and ADF10 shorten actin filaments. (E) Representative images of actin filaments. Preassembled actin filaments (50% rhodamine-labeled) at 250 nM were incubated with various concentrations of ADF7 or ADF10 at either pH 6.5 or pH 8.0 for 5 min, and the images were then captured by TIRF microscopy. Bar = 5 μm. (F) The lengths of actin filaments in the presence of ADF7 or ADF10 were measured and plotted. Data are presented as mean ± SD. The statistical analysis was performed with an unpaired two-tailed Student’s t test. ****P < 0.0001; ***P < 0.001; **P < 0.01; ns, no significant difference. (G) NBD-actin binding assay to determine the binding activity of ADF7 to G-actin at pH 8.0. The representative Kd for binding of ADF7 to ADP-actin is 1.15 μM. (H) NBD-actin binding assay to determine the binding activity of ADF7 to G-actin at pH 6.5. The representative Kd for binding of ADF7 to ADP-actin is 0.59 μM. (I) The average Kd for the binding of ADFs to NBD-ADP-actin. The average Kd (mean ± SD) for binding of ADF1, ADF7, or ADF10 to ADP-actin is presented. The experiment was repeated three times. Source data are available for this figure: SourceData F1.
The actin severing activity of ADF7 and ADF10 decreases and increases, respectively, as the pH rises in vitro
As the actin filament severing activity of ADF/cofilin also contributes to its role in disassembling actin filaments, we asked how pH modulates the actin-severing activity of ADF7 and ADF10. We tested the effect of ADF7 and ADF10 on spontaneous actin polymerization at different pHs, as the actin-severing activity of ADF/cofilin also contributes to actin polymerization via generating more free ends of actin filaments. Both ADF7 and ADF10 promote spontaneous actin polymerization in a dose-dependent manner at pH 6.5 and 8.0 (Fig. 2, A and B). ADF7 promoted actin polymerization much more strongly at pH 6.5 than at pH 8.0 (Fig. 2 A), evidenced by the higher polymerization rate at pH 6.5 than at pH 8.0 in the presence of ADF7 (Fig. 2 C). However, the effect of ADF10 on actin polymerization was similar at the two pHs (Fig. 2 C). To explore whether the differential effect of pH on ADF7/10-mediated enhancement of actin polymerization is related to the differential effect of pH on the actin severing activity of ADF7/10, we visualized the effect of ADF7 and ADF10 on the dynamics of individual actin filaments by total internal reflection fluorescence microscopy (TIRFM). ADF7 and ADF10 induced fragmentation of actin filaments at both pH 6.5 and pH 8.0 (Fig. 2 D and Video 1), consistent with reports that they both sever actin filaments (Jiang et al., 2017b; Zheng et al., 2013). ADF7 fragmented actin filaments more potently at pH 6.5 than at pH 8.0, while ADF10 was more potent at pH 8.0 than at pH 6.5 (Fig. 2, D and E; and Video 1). In terms of promoting the dissociation of actin monomers from actin filaments, ADF7 was more effective at pH 6.5 than at pH 8.0, while ADF10 had higher activity at pH 8.0 than at pH 6.5 (Fig. 2 F). Thus, the actin disassembling activity of ADF7 and ADF10 reduces and increases, respectively, as the pH rises. ADF7 is an unusual ADF/cofilin that prefers low pH in severing/disassembling actin filaments in vitro.
![ADF7 and ADF10 differentially respond to pH in severing actin filaments and promoting actin monomer dissociation. (A and B) The effect of ADF7 and ADF10 on spontaneous actin polymerization at pH 6.5 and pH 8.0. Actin (3 μM, 10% pyrene-labeled) was polymerized in the presence of various concentrations of ADF7 and ADF10. (C) Plot of the actin polymerization rates in A and B. For each curve shown in A and B, the maximal slope is plotted. All reactions were repeated at least three times. The data are presented as mean ± SD. a.u., arbitrary units. (D) Time-lapse images of actin filaments. F-actin (50% rhodamine-labeled) at 250 nM was premixed with 100 nM ADF7 or ADF10 in TIRFM buffer at pH 6.5 or pH 8.0. The mixture was perfused into a chamber and photographed immediately for at least 200 time points at 2-s intervals. The yellow arrows indicate the severing events. Bar = 2 μm. (E) Quantification of actin-severing frequencies in the presence of 100 nM ADF7 or 100 nM ADF10. Average actin filament severing frequencies (number of breaks per unit length of actin filaments [μm] per second; breaks μm−1 s−1) were plotted. The mean values were indicated by black horizontal bars and the error values (SD) were indicated by vertical bars. Totally, 50 actin filaments were selected for measurements. The statistical analysis was performed with an unpaired two-tailed Student’s t test. ****P < 0.0001; ***P < 0.001. (F) Quantification of actin monomer dissociation rates in the presence of 100 nM ADF7 or 100 nM ADF10. Each data point represents monomer dissociation rate, defined as the number of dissociated actin monomers per second (subunits s−1). The mean values were indicated by black horizontal bar and the error values (SD) were indicated by vertical bars. Totally, 50 actin filaments were selected for measurements. The statistical analysis was performed with an unpaired two-tailed Student’s t test. **P < 0.01; *P < 0.05.](https://cdn.rupress.org/rup/content_public/journal/jcb/222/11/10.1083_jcb.202206074/1/m_jcb_202206074_fig2.png?Expires=1768944506&Signature=p83x5iv0uXHs6DaLW6x3RN9rlkLG-5Wojm0rhseryciHwgJgxh0HLa9~2sgPxpeP-DbTSL9sb5nvUhoV852gyuOEfvRx0DDFvLMmqxQmNMo8KTvyLrYCM5K4oY~Xg~wXUCh7QKALtSLHgHWP-rUDswZjuQtu62queTRCx4RyFQhJqd-MUB~bVq3ScuT4HCHw8pZQBGOsX-UPXlJeoI3cd8313pg3x4YQtsuqEaz5HEl0bF1TwS~UE~tWwCSsPHeGM0SsLZwmW4W6b5QxZLU3J6l7bgz9n4jZ4ygdY4RZ2PZfbYm3JzSzgVWd-S29F9nFv6imam-9HF16fx1qYxClwg__&Key-Pair-Id=APKAIE5G5CRDK6RD3PGA)
ADF7 and ADF10 differentially respond to pH in severing actin filaments and promoting actin monomer dissociation. (A and B) The effect of ADF7 and ADF10 on spontaneous actin polymerization at pH 6.5 and pH 8.0. Actin (3 μM, 10% pyrene-labeled) was polymerized in the presence of various concentrations of ADF7 and ADF10. (C) Plot of the actin polymerization rates in A and B. For each curve shown in A and B, the maximal slope is plotted. All reactions were repeated at least three times. The data are presented as mean ± SD. a.u., arbitrary units. (D) Time-lapse images of actin filaments. F-actin (50% rhodamine-labeled) at 250 nM was premixed with 100 nM ADF7 or ADF10 in TIRFM buffer at pH 6.5 or pH 8.0. The mixture was perfused into a chamber and photographed immediately for at least 200 time points at 2-s intervals. The yellow arrows indicate the severing events. Bar = 2 μm. (E) Quantification of actin-severing frequencies in the presence of 100 nM ADF7 or 100 nM ADF10. Average actin filament severing frequencies (number of breaks per unit length of actin filaments [μm] per second; breaks μm−1 s−1) were plotted. The mean values were indicated by black horizontal bars and the error values (SD) were indicated by vertical bars. Totally, 50 actin filaments were selected for measurements. The statistical analysis was performed with an unpaired two-tailed Student’s t test. ****P < 0.0001; ***P < 0.001. (F) Quantification of actin monomer dissociation rates in the presence of 100 nM ADF7 or 100 nM ADF10. Each data point represents monomer dissociation rate, defined as the number of dissociated actin monomers per second (subunits s−1). The mean values were indicated by black horizontal bar and the error values (SD) were indicated by vertical bars. Totally, 50 actin filaments were selected for measurements. The statistical analysis was performed with an unpaired two-tailed Student’s t test. **P < 0.01; *P < 0.05.
ADF7 and ADF10 differentially respond to pH in severing actin filaments and promoting actin monomer dissociation. (A and B) The effect of ADF7 and ADF10 on spontaneous actin polymerization at pH 6.5 and pH 8.0. Actin (3 μM, 10% pyrene-labeled) was polymerized in the presence of various concentrations of ADF7 and ADF10. (C) Plot of the actin polymerization rates in A and B. For each curve shown in A and B, the maximal slope is plotted. All reactions were repeated at least three times. The data are presented as mean ± SD. a.u., arbitrary units. (D) Time-lapse images of actin filaments. F-actin (50% rhodamine-labeled) at 250 nM was premixed with 100 nM ADF7 or ADF10 in TIRFM buffer at pH 6.5 or pH 8.0. The mixture was perfused into a chamber and photographed immediately for at least 200 time points at 2-s intervals. The yellow arrows indicate the severing events. Bar = 2 μm. (E) Quantification of actin-severing frequencies in the presence of 100 nM ADF7 or 100 nM ADF10. Average actin filament severing frequencies (number of breaks per unit length of actin filaments [μm] per second; breaks μm−1 s−1) were plotted. The mean values were indicated by black horizontal bars and the error values (SD) were indicated by vertical bars. Totally, 50 actin filaments were selected for measurements. The statistical analysis was performed with an unpaired two-tailed Student’s t test. ****P < 0.0001; ***P < 0.001. (F) Quantification of actin monomer dissociation rates in the presence of 100 nM ADF7 or 100 nM ADF10. Each data point represents monomer dissociation rate, defined as the number of dissociated actin monomers per second (subunits s−1). The mean values were indicated by black horizontal bar and the error values (SD) were indicated by vertical bars. Totally, 50 actin filaments were selected for measurements. The statistical analysis was performed with an unpaired two-tailed Student’s t test. **P < 0.01; *P < 0.05.
ADF7 and ADF10 fragment actin filaments and promote their disassembly. The movie corresponds to the time-lapse images shown in Fig. 2 D. Actin filaments were labeled with 50% rhodamine. Actin filaments, indicated by yellow arrows, are subject to severing, and filament severing events are indicated by cyan arrows. Images were captured at 2-s intervals over a period of 200 s. The movie was created with ImageJ software and displayed at 3 frames/s. Bar = 2 μm.
ADF7 and ADF10 fragment actin filaments and promote their disassembly. The movie corresponds to the time-lapse images shown in Fig. 2 D. Actin filaments were labeled with 50% rhodamine. Actin filaments, indicated by yellow arrows, are subject to severing, and filament severing events are indicated by cyan arrows. Images were captured at 2-s intervals over a period of 200 s. The movie was created with ImageJ software and displayed at 3 frames/s. Bar = 2 μm.
ADF7 and ADF10 are differentially localized within apical and subapical regions of pollen tubes
Next, we examined the localization and concentration of ADF7 and ADF10 in pollen tubes in vivo. As ADF7 and ADF10 are the two major ADF isovariants in pollen according to expression data (https://genevisible.com), we ignored ADF5 and assumed that the combined amount of ADF7 and ADF10 represents the total ADF protein in pollen. Thus, the concentration of ADF7 and ADF10 in pollen can be obtained by subtracting the concentration of ADF proteins in adf10 and adf7 mutant pollen, respectively, from that in WT pollen. To assess the abundance of ADF7 and ADF10 in pollen, we performed Western blot analysis of total protein isolated from WT, adf7, and adf10 pollen probed with an anti-ADF antibody that non-selectively detects ADF7 and ADF10 (Jiang et al., 2019). The amount of ADF proteins was reduced in pollen from both adf7 and adf10 mutants compared with WT, and the amount of ADFs in adf7 was much lower than that in adf10 (Fig. 3 A). This suggests that ADF7 is relatively more abundant in pollen. To calculate the concentration of ADF7 and ADF10 in pollen, we assessed the relative amount of ADFs in WT, adf7, and adf10 pollen by densitometry (Fig. 3 B). The concentration of total ADF protein was previously measured as 4.87 μM in Arabidopsis pollen (Jiang et al., 2019). Therefore, the concentration of ADF7 and ADF10 was determined to be 3.59 and 1.58 μM, respectively, in pollen (Fig. 3 C).
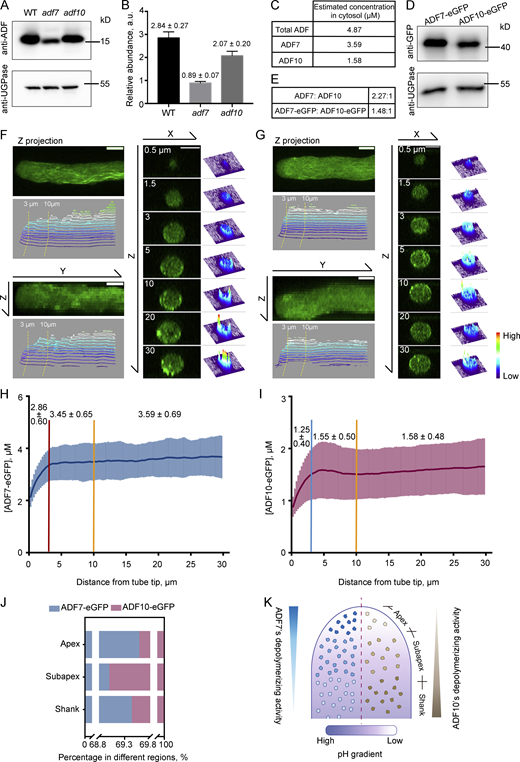
ADF7 is more abundant than ADF10 globally, and the two ADFs are differentially localized within the apical and subapical regions of the pollen tube. (A) Detection of ADF7 and ADF10 in Arabidopsis mature pollen by Western-blot analysis. ADF in total protein from Arabidopsis mature pollen was detected with an anti-ADF7 antibody, which recognizes both ADF7 and ADF10. UGPase, detected with an anti-UGPase antibody, was used as the loading control. The experiment was repeated more than three times and a representative result is shown. (B) Measurement of the relative abundance of ADF proteins in total protein from WT, adf7, and adf10 mature pollen. The average gray values of bands in A were measured. The relative abundance of ADF7 and ADF10 was calculated by dividing the gray values of the band probed with anti-ADF7 antibody by that of the band probed with anti-UGPase antibody. The relative abundance is marked on the top of each column. (C) The estimated concentration of total ADF, ADF7, and ADF10 in the cytosol. The calculation is described in the Materials and methods. (D) Western blot of total protein from Arabidopsis mature pollen derived from the transgenic plants ADF7pro::ADF7-eGFP;adf7 and ADF10pro::ADF10-eGFP;adf10. The blot was probed with anti-UGPase and anti-GFP antibodies. The experiment was repeated more than three times and a representative result is shown. (E) Ratio of ADF7 versus ADF10 in pollen. The ratios of ADF7 versus ADF10 and ADF7-eGFP versus ADF10-eGFP are presented. (F and G) Distribution of ADF7-eGFP (F) and ADF10-eGFP (G) in the XY, YZ, and XZ directions of the pollen tube. Z projection and X projection images are shown in the left panel with the corresponding 3D surface plot of fluorescence pixel intensity. Transverse sections at the indicated distance from the tube tips are shown in the right panel corresponding with the 3D distribution of fluorescence pixel intensity. Warm and cold colors indicate high and low fluorescence intensity, respectively. Bars = 5 μm in all images. (H and I) Quantification of the concentration of ADF7-eGFP and ADF10-eGFP from the extreme tip to the base of the pollen tube. The average concentration of ADF7-eGFP and ADF10-eGFP in different regions (0–3 μm, 3–10 μm, and 10–30 μm from the tube tip) is marked above the curve. More than 60 pollen tubes were measured for each protein. Data are presented as mean ± SD. (J) Percentage of ADF7-eGFP and ADF10-eGFP in different regions of pollen tubes. (K) Schematic showing the distribution of protein concentration and the assumed actin-depolymerizing activity of ADF7 and ADF10 in the pollen tube. The amount and activity of ADF7 and ADF10 are shown on the left and right sides, respectively, of the same pollen tube. Deeper colors represent higher disassembling activity. The color coding for the pH gradient is shown underneath the model. Source data are available for this figure: SourceData F3.
ADF7 is more abundant than ADF10 globally, and the two ADFs are differentially localized within the apical and subapical regions of the pollen tube. (A) Detection of ADF7 and ADF10 in Arabidopsis mature pollen by Western-blot analysis. ADF in total protein from Arabidopsis mature pollen was detected with an anti-ADF7 antibody, which recognizes both ADF7 and ADF10. UGPase, detected with an anti-UGPase antibody, was used as the loading control. The experiment was repeated more than three times and a representative result is shown. (B) Measurement of the relative abundance of ADF proteins in total protein from WT, adf7, and adf10 mature pollen. The average gray values of bands in A were measured. The relative abundance of ADF7 and ADF10 was calculated by dividing the gray values of the band probed with anti-ADF7 antibody by that of the band probed with anti-UGPase antibody. The relative abundance is marked on the top of each column. (C) The estimated concentration of total ADF, ADF7, and ADF10 in the cytosol. The calculation is described in the Materials and methods. (D) Western blot of total protein from Arabidopsis mature pollen derived from the transgenic plants ADF7pro::ADF7-eGFP;adf7 and ADF10pro::ADF10-eGFP;adf10. The blot was probed with anti-UGPase and anti-GFP antibodies. The experiment was repeated more than three times and a representative result is shown. (E) Ratio of ADF7 versus ADF10 in pollen. The ratios of ADF7 versus ADF10 and ADF7-eGFP versus ADF10-eGFP are presented. (F and G) Distribution of ADF7-eGFP (F) and ADF10-eGFP (G) in the XY, YZ, and XZ directions of the pollen tube. Z projection and X projection images are shown in the left panel with the corresponding 3D surface plot of fluorescence pixel intensity. Transverse sections at the indicated distance from the tube tips are shown in the right panel corresponding with the 3D distribution of fluorescence pixel intensity. Warm and cold colors indicate high and low fluorescence intensity, respectively. Bars = 5 μm in all images. (H and I) Quantification of the concentration of ADF7-eGFP and ADF10-eGFP from the extreme tip to the base of the pollen tube. The average concentration of ADF7-eGFP and ADF10-eGFP in different regions (0–3 μm, 3–10 μm, and 10–30 μm from the tube tip) is marked above the curve. More than 60 pollen tubes were measured for each protein. Data are presented as mean ± SD. (J) Percentage of ADF7-eGFP and ADF10-eGFP in different regions of pollen tubes. (K) Schematic showing the distribution of protein concentration and the assumed actin-depolymerizing activity of ADF7 and ADF10 in the pollen tube. The amount and activity of ADF7 and ADF10 are shown on the left and right sides, respectively, of the same pollen tube. Deeper colors represent higher disassembling activity. The color coding for the pH gradient is shown underneath the model. Source data are available for this figure: SourceData F3.
We next determined the local concentration of ADF7 and ADF10 by tracking GFP-fused ADF7 and ADF10 in pollen tubes. This roughly accords with the method of measuring protein concentration at cytokinesis contractile rings in fission yeast (Wu and Pollard, 2005). ADF7-eGFP and ADF10-eGFP were previously shown to respectively complement the actin turnover defects in adf7 and adf10 pollen (Jiang et al., 2017b; Zheng et al., 2013), which suggests that both GFP fusion proteins are functional in vivo. In addition, ADF7-eGFP was shown to retain actin filament severing and disassembling activities in vitro (Zheng et al., 2013). We here further showed that ADF7-eGFP prefers low pH and ADF10-eGFP prefers high pH in severing and disassembling actin filaments in vitro (Fig. S1). This demonstrates that both GFP fusion proteins have the same pH preference as the non-fusion proteins. Western blot analysis using an anti-GFP antibody showed that ADF7-eGFP was more abundant than ADF10-eGFP (Fig. 3 D), consistent with the analysis of the mutants (Fig. 3, A and B). The two different measurements showed slightly different molar ratios of ADF7 versus ADF10, but the trend is similar (Fig. 3 E), which suggests that the abundance of ADF fusion proteins expressed from native promoters is directly proportional to the number of molecules in live pollen cells. Next, we determined the concentrations of ADF7 and ADF10 within the apex (0–3 μm), subapex (3–10 μm), and shank region (10–30 μm), which differ in pH (Chen et al., 2020; Feijó et al., 1999; Hoffmann et al., 2020) and actin filament organization (Qu et al., 2015; Stephan, 2017). Both fusion proteins are more abundant in the shank (Fig. 3, F–I). The shank accounts for most of the pollen tube in terms of volume and amount of the cytoplasm. Therefore, we assumed that shank-localized ADF proteins represent total ADF proteins in the pollen tube, and we calculated the concentration of shank-localized ADF7 and ADF10 as 3.59 and 1.58 μM, respectively. Next, to determine the concentration of ADF7 and ADF10 within apical and subapical regions, we obtained the ADF7-eGFP:ADF10-eGFP fluorescence intensity ratio within these two regions relative to the shank. The concentration of ADF7 and ADF10 within the two regions was then obtained by multiplying the ratio with the concentration of ADF7 and ADF10 in the shank. The respective concentrations (mean ± SD) of ADF7 and ADF10 were calculated as 2.86 ± 0.6 μM and 1.25 ± 0.4 μM within the apical region, and 3.45 ± 0.65 μM and 1.55 ± 0.5 μM within the subapical region. Thus, ADF7 is more abundant overall within the entire pollen tube than ADF10. However, the ADF7:ADF10 ratio is relatively high at the apex and shank compared to the subapex (Fig. 3 J). This finding, together with the differential pH-dependent actin-disassembling activity and the effect of the depletion of ADF7/10 on the actin cytoskeleton in pollen tubes (see below), suggests that the actin-depolymerizing activity of ADF7 gradually decreases whereas the actin-disassembling activity of ADF10 gradually increases from the extreme apex to the subapex (Fig. 3 K).
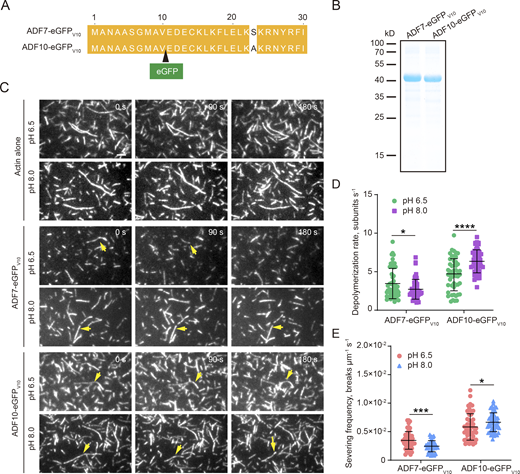
ADF7-eGFP and ADF10-eGFP exhibit differential pH sensitivity in disassembling and severing actin filaments in vitro. (A) Schematic diagram showing the insertion of eGFP to generate eGFP fusion proteins of ADF7-eGFP and ADF10-eGFP. The black triangle indicates that eGFP is inserted after valine (V) in position 10. (B) SDS-PAGE analysis of purified recombinant ADF7-eGFPV10 and ADF10-eGFPV10 fusion proteins. (C) Time-lapse images of actin filaments. F-actin (50% rhodamine-labeled) at 250 nM was premixed with 100 nM ADF7-eGFPV10 or ADF10-eGFPV10 in TIRFM buffer at pH 6.5 or pH 8.0. The mixture was perfused into a chamber and photographed immediately for at least 200 time points at 2-s intervals. The yellow arrows indicate the severing events. Bar = 2 μm. (D) Quantification of actin-severing frequencies in the presence of 100 nM ADF7-eGFPV10 or 100 nM ADF10-eGFPV10. Average actin filament severing frequencies (breaks μm−1 s−1) were plotted. The mean values are indicated by black horizontal bars, and the error values (SD) are indicated by vertical bars. In total, 50 actin filaments were selected for measurements. The statistical analysis was performed with an unpaired two-tailed Student’s t test. *P < 0.05; ****P < 0.0001. (E) Quantification of actin monomer dissociation rates in the presence of 100 nM ADF7 or 100 nM ADF10. Each data point represents a monomer dissociation rate (subunits s−1). The mean values are indicated by black horizontal bars, and the error values (SD) are indicated by vertical bars. In total, 50 actin filaments were selected for measurements. The statistical analysis was performed with an unpaired two-tailed Student’s t test. *P < 0.05; ***P < 0.001. Source data are available for this figure: SourceData FS1.
ADF7-eGFP and ADF10-eGFP exhibit differential pH sensitivity in disassembling and severing actin filaments in vitro. (A) Schematic diagram showing the insertion of eGFP to generate eGFP fusion proteins of ADF7-eGFP and ADF10-eGFP. The black triangle indicates that eGFP is inserted after valine (V) in position 10. (B) SDS-PAGE analysis of purified recombinant ADF7-eGFPV10 and ADF10-eGFPV10 fusion proteins. (C) Time-lapse images of actin filaments. F-actin (50% rhodamine-labeled) at 250 nM was premixed with 100 nM ADF7-eGFPV10 or ADF10-eGFPV10 in TIRFM buffer at pH 6.5 or pH 8.0. The mixture was perfused into a chamber and photographed immediately for at least 200 time points at 2-s intervals. The yellow arrows indicate the severing events. Bar = 2 μm. (D) Quantification of actin-severing frequencies in the presence of 100 nM ADF7-eGFPV10 or 100 nM ADF10-eGFPV10. Average actin filament severing frequencies (breaks μm−1 s−1) were plotted. The mean values are indicated by black horizontal bars, and the error values (SD) are indicated by vertical bars. In total, 50 actin filaments were selected for measurements. The statistical analysis was performed with an unpaired two-tailed Student’s t test. *P < 0.05; ****P < 0.0001. (E) Quantification of actin monomer dissociation rates in the presence of 100 nM ADF7 or 100 nM ADF10. Each data point represents a monomer dissociation rate (subunits s−1). The mean values are indicated by black horizontal bars, and the error values (SD) are indicated by vertical bars. In total, 50 actin filaments were selected for measurements. The statistical analysis was performed with an unpaired two-tailed Student’s t test. *P < 0.05; ***P < 0.001. Source data are available for this figure: SourceData FS1.
Loss of function of ADF7 or ADF10 has differential effects on the turnover and organization of apical and subapical actin filaments in pollen tubes
Next, we examined the effect of loss of function of ADF7 or ADF10 on the actin cytoskeleton within the apical and subapical regions. Actin filaments are less abundant at the extreme apex of WT pollen tubes (Fig. 4 A) in the region that corresponds to the acidic domain reported previously (Feijó et al., 1999). The loss of function of ADF7 increased the amount of actin filaments within the extreme apex (Fig. 4 A), which suggests that ADF7 is required for the rapid turnover of actin filaments therein. Optical sections confirmed that actin filaments are brighter at distances of 0.5–3 μm from the tip in adf7 pollen tubes compared with WT (Fig. 4 B). The amount of actin filaments increased more obviously at the extreme tip of adf7 pollen tubes compared with WT (Fig. 4, C–E). Compared with ADF7, the loss of ADF10 had less effect on the increasing amount of actin filaments in the extreme apical region (Fig. 4, A, B, D, and E). The majority of actin filaments are generated from the plasma membrane by class I formins (Cheung et al., 2010; Lan et al., 2018). Accordingly, accumulation of actin filaments close to the plasma membrane is obvious in adf7 pollen tubes compared with WT (Fig. 4 A, red and blue triangles). Actin filaments also accumulated close to the plasma membrane in adf10 pollen tubes (Fig. 4 A, green triangles), but to a lesser extent. The average length of apical actin filaments decorated with Lifeact-eGFP increased in both adf7 and adf10 pollen tubes compared with WT, and the increase was more prominent in adf7 (Fig. 4, F and G).

Loss of function of ADF7 and ADF10 has differential effects on the actin cytoskeleton at the apex and subapex of pollen tubes. (A) Images of actin filaments stained with Alexa-Fluor-488-phalloidin in pollen tubes of WT, adf7, and adf10. Full and half Z projection images are shown in the left panel, and the distances from the tube tip are indicated on the upper left side. The corresponding optical slices are shown in the right panel. Regions covered by yellow shaded boxes and between two colored dotted lines indicate pollen tube tips. The green arrows indicate disorganized actin filaments in adf10 pollen tubes. Colored triangles at pollen tube tips indicate the accumulation of actin filaments close to the plasma membrane. Bar = 5 μm. (B) Transverse sections at the indicated distance from tube tips are shown in yellow shaded boxes in A. Blue arrows indicate actin filaments within the inner region of adf7 pollen tube. (C) Schematic diagram of the method for measuring the relative fluorescence intensity of actin filament staining at the tip of pollen tubes. The left panel shows that a line can be considered as being composed of many points. For a thin line, each point corresponds to a pixel. To measure the fluorescence intensity of actin filaments stained with Alexa-488-phalloidin at the pollen tube tip, a 3-μm wide line that fully covers the pollen tube tip region (0–3 μm from the tube tip) was drawn as shown in the right panel. The fluorescence intensity of each point with the width of one pixel was measured using the “Plot Profile” plugin in ImageJ. The intensity at each point was subsequently divided by the average fluorescence intensity within this 3-μm wide line to yield the relative fluorescence intensity of actin filament staining at each point. (D) Quantification of the relative fluorescence intensity of actin filament staining within the yellow shaded boxes shown in A at pollen tube tips. A 3-µm thick line was drawn, covering the yellow boxes shown in A, and the fluorescence intensity of each point on this line was divided by the average fluorescence intensity within the band to yield the relative fluorescence intensity (the method for measuring the relative fluorescence intensity of actin filament staining see the schematic diagram shown in C), which was plotted versus the distance across the pollen tube. The abscissa “0” indicates the extreme tip of the pollen tube. At least 35 pollen tubes were measured for each genotype. Data are presented as mean ± SD. (E) Plot of the fluorescence intensity of actin filament staining at different positions across the width of pollen tubes. (F) Time-lapse images of actin filaments decorated by Lifeact-eGFP in growing WT, adf7, and adf10 pollen tubes. Yellow dotted lines indicate the base of the apical actin structure and green arrows indicate disorganized actin filaments. Enlarged kymograph analyses of apical actin filaments during pollen tube growth are shown in the right panels. The ribbon corresponds to the base of the apical actin structure. Bars = 5 μm in all images. (G) Quantification of the distance from the tube tip to the base of the actin fringe in pollen tubes of WT, adf7, and adf10 via kymograph analysis. The red line indicates the average length of apical actin filaments. *P < 0.05 (Student’s t test), **P < 0.01 (Student’s t test). (H) Quantification of filament angles in apical and subapical regions of pollen tubes. A schematic diagram of angle measurement is shown on the left. The midline was set as a reference line in the pollen tube. The angles were measured between filaments and the midline towards the growth direction of pollen tubes. For filaments spanning the reference midline, the angles on both sides were included. ns, no statistical difference, **P < 0.01 (Student’s t test). (I) Schematic depiction of the role of ADF7 and ADF10 in regulating actin dynamics via coordination with the pH gradient in pollen tubes. Within apical and subapical regions of a WT pollen tube, actin filaments are mainly polymerized from the plasma membrane by the membrane-anchored class I formins and are arrayed into a distinct “apical actin structure” (Xu and Huang, 2020). ADF7 and ADF10 are two major actin-depolymerizing factors that promote the turnover of actin filaments but exhibit differential roles in response to the cytosolic pH gradient in pollen tubes. Specifically, ADF7 functions better at low pH and plays an important role in enhancing the turnover of actin filaments originating from the plasma membrane. This process is crucial for the generation of an apical region with fewer actin filaments. ADF10 functions better at high pH and plays a prominent role in enhancing the turnover and facilitating the organization of actin filaments at the alkaline subapex. The concerted action of ADF7 and ADF10 thus shapes the formation of the unique “apical actin structure” in the pollen tube.
Loss of function of ADF7 and ADF10 has differential effects on the actin cytoskeleton at the apex and subapex of pollen tubes. (A) Images of actin filaments stained with Alexa-Fluor-488-phalloidin in pollen tubes of WT, adf7, and adf10. Full and half Z projection images are shown in the left panel, and the distances from the tube tip are indicated on the upper left side. The corresponding optical slices are shown in the right panel. Regions covered by yellow shaded boxes and between two colored dotted lines indicate pollen tube tips. The green arrows indicate disorganized actin filaments in adf10 pollen tubes. Colored triangles at pollen tube tips indicate the accumulation of actin filaments close to the plasma membrane. Bar = 5 μm. (B) Transverse sections at the indicated distance from tube tips are shown in yellow shaded boxes in A. Blue arrows indicate actin filaments within the inner region of adf7 pollen tube. (C) Schematic diagram of the method for measuring the relative fluorescence intensity of actin filament staining at the tip of pollen tubes. The left panel shows that a line can be considered as being composed of many points. For a thin line, each point corresponds to a pixel. To measure the fluorescence intensity of actin filaments stained with Alexa-488-phalloidin at the pollen tube tip, a 3-μm wide line that fully covers the pollen tube tip region (0–3 μm from the tube tip) was drawn as shown in the right panel. The fluorescence intensity of each point with the width of one pixel was measured using the “Plot Profile” plugin in ImageJ. The intensity at each point was subsequently divided by the average fluorescence intensity within this 3-μm wide line to yield the relative fluorescence intensity of actin filament staining at each point. (D) Quantification of the relative fluorescence intensity of actin filament staining within the yellow shaded boxes shown in A at pollen tube tips. A 3-µm thick line was drawn, covering the yellow boxes shown in A, and the fluorescence intensity of each point on this line was divided by the average fluorescence intensity within the band to yield the relative fluorescence intensity (the method for measuring the relative fluorescence intensity of actin filament staining see the schematic diagram shown in C), which was plotted versus the distance across the pollen tube. The abscissa “0” indicates the extreme tip of the pollen tube. At least 35 pollen tubes were measured for each genotype. Data are presented as mean ± SD. (E) Plot of the fluorescence intensity of actin filament staining at different positions across the width of pollen tubes. (F) Time-lapse images of actin filaments decorated by Lifeact-eGFP in growing WT, adf7, and adf10 pollen tubes. Yellow dotted lines indicate the base of the apical actin structure and green arrows indicate disorganized actin filaments. Enlarged kymograph analyses of apical actin filaments during pollen tube growth are shown in the right panels. The ribbon corresponds to the base of the apical actin structure. Bars = 5 μm in all images. (G) Quantification of the distance from the tube tip to the base of the actin fringe in pollen tubes of WT, adf7, and adf10 via kymograph analysis. The red line indicates the average length of apical actin filaments. *P < 0.05 (Student’s t test), **P < 0.01 (Student’s t test). (H) Quantification of filament angles in apical and subapical regions of pollen tubes. A schematic diagram of angle measurement is shown on the left. The midline was set as a reference line in the pollen tube. The angles were measured between filaments and the midline towards the growth direction of pollen tubes. For filaments spanning the reference midline, the angles on both sides were included. ns, no statistical difference, **P < 0.01 (Student’s t test). (I) Schematic depiction of the role of ADF7 and ADF10 in regulating actin dynamics via coordination with the pH gradient in pollen tubes. Within apical and subapical regions of a WT pollen tube, actin filaments are mainly polymerized from the plasma membrane by the membrane-anchored class I formins and are arrayed into a distinct “apical actin structure” (Xu and Huang, 2020). ADF7 and ADF10 are two major actin-depolymerizing factors that promote the turnover of actin filaments but exhibit differential roles in response to the cytosolic pH gradient in pollen tubes. Specifically, ADF7 functions better at low pH and plays an important role in enhancing the turnover of actin filaments originating from the plasma membrane. This process is crucial for the generation of an apical region with fewer actin filaments. ADF10 functions better at high pH and plays a prominent role in enhancing the turnover and facilitating the organization of actin filaments at the alkaline subapex. The concerted action of ADF7 and ADF10 thus shapes the formation of the unique “apical actin structure” in the pollen tube.
Next, we examined the actin cytoskeleton at the subapical region, which corresponds to the tip of the inverted V-shape cone of the vesicle accumulation region. The membrane-originated subapical actin filaments appear normally organized in adf7 pollen tubes (Fig. 4, A and F), but they are severely disorganized in adf10 pollen tubes (Fig. 4, A and F, green triangles; Jiang et al., 2017b). The disorganization was assessed by analyzing the angles formed between subapical actin filaments and the pollen tube growth axis (Fig. 4 H, left panel). The angles increased in adf10 pollen tubes, but not in adf7, compared with WT (Fig. 4 H, right panel). Thus, loss of ADF10 has more profound effects on the organization of subapical actin filaments than loss of ADF7. These data together suggest that ADF7 and ADF10 play prominent roles in regulating actin dynamics at the apex and subapex, respectively, and the cooperation of ADF7 and ADF10 shapes the overall organization of the apical actin filaments to facilitate the construction of the “apical actin structure” (Fig. 4 I).
Loss of function of ADF7 specifically impairs the accumulation of vesicles at the pollen tube tip
Next, we asked if adf7 and adf10 pollen tubes exhibit differential defects in tip-directed vesicle transportation and apical accumulation. We visualized YFP-RabA4b-decorated transport vesicles as described before (Zhang et al., 2010). The vesicles accumulated at the pollen tube tip and assumed an inverted V shape distribution in WT and adf7 (Fig. 5 A). In adf10, the vesicle accumulation region was enlarged (Fig. 5 A; Jiang et al., 2017b). This was supported by the quantitative measurement of the angle formed at the base of the V, the distances from the top of the V to the bottom of the V, and the extreme tip of the pollen tube as described previously (Jiang et al., 2017b). The V angles were reduced significantly in adf10 pollen tubes, but not in adf7 (Fig. 5 B). The depth of the V and the distance of the V from the tip increased significantly in both adf7 and adf10 pollen tubes, although the effect was much more severe in adf10 than in adf7 (Fig. 5, C and D). This is consistent with the notion that inner actin filaments within the apical and subapical regions can act as a physical barrier to prevent the backward movement of vesicles and spatially restrict them (Qu et al., 2017) and the fact that the disorganization of the inner actin filaments is much more severe in adf10. We further explored vesicle transport using fluorescence recovery after photobleaching (FRAP). We bleached a region just below the tip and imaged the unbleached tip to monitor vesicle movement. Soon after bleaching, the V-shaped conical distribution pattern of YFP-RabA4b-decorated vesicles is easily identified in WT and adf7 pollen tubes but not in adf10 (Fig. S2 A). The recovery rate of YFP-RabA4b fluorescence was reduced within the growth domain of both adf7 and adf10 pollen tubes; however, the effect was much more severe in adf10 (Fig. 5, E–G). This is consistent with the notion that actin filaments within the apical and subapical regions can actively transport vesicles to the pollen tube tip (Qu et al., 2017) and the fact that adf10 pollen tubes exhibit much more severe defects in the organization of actin filaments within those regions.

Loss of function of ADF7 and ADF10 has differential effects on vesicle trafficking in pollen tubes. (A) Images of pollen tubes harboring YFP-RabA4b. Yellow dots mark the V-shaped region of vesicle accumulation in WT, adf7, and adf10 pollen tubes. Bar = 5 μm. (B) Quantification of the average angles of the V-shaped area of vesicle accumulation in the apical region of WT adf7 and adf10 pollen tubes. Values represent mean ± SD. n > 25. **P < 0.01 (unpaired two-tailed Student’s t test). (C) Quantification of the distance of the top of the V shape from the bottom of the V (depth of V) in the pollen tube. Values represent mean ± SD, n > 15. **P < 0.01 (unpaired two-tailed Student’s t test). (D) Quantification of the distance of the top of the V from the tip of the pollen tube. Values represent mean ± SD, n > 15. **P < 0.01 (unpaired two-tailed Student’s t test). (E) Time-lapse images of YFP-RabA4b fluorescence recovery after photobleaching at the tip of pollen tubes. The red box indicates the photobleached region. Bar = 5 μm. (F) The fitted fluorescence recovery curves of Col-0 (WT), adf7, and adf10 were obtained by measuring the fluorescence intensities in the 5 μm region at the tube tips. More than 20 pollen tubes for each genotype were included. (G) YFP-RabA4b fluorescence recovers much more slowly after photobleaching in adf10 pollen tube tips than in Col-0 (WT) and adf7 pollen tubes. Error bars indicate SE (n > 20). ***P < 0.001 by all-pairwise one-way ANOVA test. (H) Transverse sections of the pollen tubes are shown in A. The distances from the extreme tip are indicated in the images. Bar = 5 μm. (I) Plot of the fluorescence intensity of YFP-RabA4b at the pollen tube tip within the band perpendicular to the growth axis of pollen tubes. (J) Plot of the fluorescence intensity of YFP-RabA4b at the pollen tube tip within the band that is parallel to the growth axis of pollen tubes. (K) Kymographs of RabA4b-positive particles in the first 30 s after photobleaching. The upper panel shows the gray-shaded region of the photobleached pollen tube which was included to build the kymograph. White arrowheads indicate the regions where RabA4b-positive particles are accumulated, and yellow triangles indicate the extreme apical region of vesicle accumulation. Bar = 2 μm.
Loss of function of ADF7 and ADF10 has differential effects on vesicle trafficking in pollen tubes. (A) Images of pollen tubes harboring YFP-RabA4b. Yellow dots mark the V-shaped region of vesicle accumulation in WT, adf7, and adf10 pollen tubes. Bar = 5 μm. (B) Quantification of the average angles of the V-shaped area of vesicle accumulation in the apical region of WT adf7 and adf10 pollen tubes. Values represent mean ± SD. n > 25. **P < 0.01 (unpaired two-tailed Student’s t test). (C) Quantification of the distance of the top of the V shape from the bottom of the V (depth of V) in the pollen tube. Values represent mean ± SD, n > 15. **P < 0.01 (unpaired two-tailed Student’s t test). (D) Quantification of the distance of the top of the V from the tip of the pollen tube. Values represent mean ± SD, n > 15. **P < 0.01 (unpaired two-tailed Student’s t test). (E) Time-lapse images of YFP-RabA4b fluorescence recovery after photobleaching at the tip of pollen tubes. The red box indicates the photobleached region. Bar = 5 μm. (F) The fitted fluorescence recovery curves of Col-0 (WT), adf7, and adf10 were obtained by measuring the fluorescence intensities in the 5 μm region at the tube tips. More than 20 pollen tubes for each genotype were included. (G) YFP-RabA4b fluorescence recovers much more slowly after photobleaching in adf10 pollen tube tips than in Col-0 (WT) and adf7 pollen tubes. Error bars indicate SE (n > 20). ***P < 0.001 by all-pairwise one-way ANOVA test. (H) Transverse sections of the pollen tubes are shown in A. The distances from the extreme tip are indicated in the images. Bar = 5 μm. (I) Plot of the fluorescence intensity of YFP-RabA4b at the pollen tube tip within the band perpendicular to the growth axis of pollen tubes. (J) Plot of the fluorescence intensity of YFP-RabA4b at the pollen tube tip within the band that is parallel to the growth axis of pollen tubes. (K) Kymographs of RabA4b-positive particles in the first 30 s after photobleaching. The upper panel shows the gray-shaded region of the photobleached pollen tube which was included to build the kymograph. White arrowheads indicate the regions where RabA4b-positive particles are accumulated, and yellow triangles indicate the extreme apical region of vesicle accumulation. Bar = 2 μm.

Schematic describing the organization of actin filaments and distribution of vesicles in WT, adf7, and adf10 pollen tubes. (A) Loss of function of ADF7 and ADF10 has differential effects on the recovery pattern of the backward movement of vesicles in pollen tubes. The left column shows prebleached pollen tubes. Yellow boxes indicate the photobleached regions. The right panels show the time-lapse images of pollen tubes after photobleaching. The signals within the unbleached tip region initially decrease after bleaching due to the backward movement of unbleached vesicles, and the signals then recover after the tipward movement of fluorescent vesicles. Insets show the full view of the distribution of RabA4b vesicles lingering in the tip before the fluorescence signals of the unbleached apex region reach a minimum. The V-shaped accumulation pattern of RabA4b vesicles can be distinguished at the very early stage of recovery. The accumulation of RabA4b mainly occurred at the very tip of the WT pollen tubes. By comparison, vesicles accumulated in a region a bit further away from the very tip of the adf7 pollen tube, and vesicles accumulated within a much wider apical region in adf10 pollen tubes. The brightness of all images was adjusted intentionally for optimal presentation. Bars = 5 μm. (B) The left panels show the organization of actin filaments and overall distribution of vesicles in WT, adf7, and adf10 pollen tubes. The right panels, within the dashed blue box, show the postulated process of vesicle delivery and eventual accumulation of vesicles at the tip of WT, adf7, and adf10 pollen tubes. Transport vesicles are delivered to the tip of WT pollen tubes using apical actin filaments at the cortex as tracks. Vesicles are released after reaching the tip. This tip-directed vesicle transportation is differentially impaired in adf7 and adf10 pollen tubes because of differential disorganization of apical actin filaments at the cortex. In WT pollen tubes, transport vesicles are released and accumulate in the region with fewer actin filaments, which is indicated by the dashed white circle in the left panel. In adf7 pollen tubes, fewer vesicles accumulate within the corresponding region because the amount of actin filaments is increased. In WT pollen tubes, the released vesicles are physically restricted by the inner apical actin filaments that naturally assume an inverted V cone-shaped distribution (Qu et al., 2017). In adf10 pollen tubes, the region of vesicle accumulation is enlarged because the disorganized inner apical actin filaments are defective in spatially restricting the vesicles. By comparison, the pattern of apical vesicle accumulation in adf7 pollen tubes is similar to that in WT, as the organization of inner apical actin filaments appears quite similar to that in WT. Green and red arrows indicate the direction of tip-directed and backward movement of vesicles, respectively. The green dashed lines in the left panel indicate the border of vesicle accumulation.
Schematic describing the organization of actin filaments and distribution of vesicles in WT, adf7, and adf10 pollen tubes. (A) Loss of function of ADF7 and ADF10 has differential effects on the recovery pattern of the backward movement of vesicles in pollen tubes. The left column shows prebleached pollen tubes. Yellow boxes indicate the photobleached regions. The right panels show the time-lapse images of pollen tubes after photobleaching. The signals within the unbleached tip region initially decrease after bleaching due to the backward movement of unbleached vesicles, and the signals then recover after the tipward movement of fluorescent vesicles. Insets show the full view of the distribution of RabA4b vesicles lingering in the tip before the fluorescence signals of the unbleached apex region reach a minimum. The V-shaped accumulation pattern of RabA4b vesicles can be distinguished at the very early stage of recovery. The accumulation of RabA4b mainly occurred at the very tip of the WT pollen tubes. By comparison, vesicles accumulated in a region a bit further away from the very tip of the adf7 pollen tube, and vesicles accumulated within a much wider apical region in adf10 pollen tubes. The brightness of all images was adjusted intentionally for optimal presentation. Bars = 5 μm. (B) The left panels show the organization of actin filaments and overall distribution of vesicles in WT, adf7, and adf10 pollen tubes. The right panels, within the dashed blue box, show the postulated process of vesicle delivery and eventual accumulation of vesicles at the tip of WT, adf7, and adf10 pollen tubes. Transport vesicles are delivered to the tip of WT pollen tubes using apical actin filaments at the cortex as tracks. Vesicles are released after reaching the tip. This tip-directed vesicle transportation is differentially impaired in adf7 and adf10 pollen tubes because of differential disorganization of apical actin filaments at the cortex. In WT pollen tubes, transport vesicles are released and accumulate in the region with fewer actin filaments, which is indicated by the dashed white circle in the left panel. In adf7 pollen tubes, fewer vesicles accumulate within the corresponding region because the amount of actin filaments is increased. In WT pollen tubes, the released vesicles are physically restricted by the inner apical actin filaments that naturally assume an inverted V cone-shaped distribution (Qu et al., 2017). In adf10 pollen tubes, the region of vesicle accumulation is enlarged because the disorganized inner apical actin filaments are defective in spatially restricting the vesicles. By comparison, the pattern of apical vesicle accumulation in adf7 pollen tubes is similar to that in WT, as the organization of inner apical actin filaments appears quite similar to that in WT. Green and red arrows indicate the direction of tip-directed and backward movement of vesicles, respectively. The green dashed lines in the left panel indicate the border of vesicle accumulation.
To link the role of ADF7 to the regulation of vesicle trafficking, we carefully examined the distribution of vesicles at the extreme apex where the amount of actin filaments increases significantly in adf7 pollen tubes. The density of transport vesicles was obviously lower in adf7 than in WT (Fig. 5 A). This was confirmed by comparing transverse sections of pollen tubes and the fluorescence intensity of YFP-RabA4b (Fig. 5, H–J).
Tip-directed vesicle transport appears to be normal in adf7 pollen tubes. Therefore, the reduction in the density of transport vesicles might be due to the increased amount of actin filaments, which may create a physical barrier to prevent the diffusion and release of vesicles when they are transported to the tip. Kymograph analysis of the dynamic recovery of YFP-RabA4b fluorescence during the early stage (30 s) after photobleaching showed that RabA4b-positive particles were transported swiftly to the tip end and accumulated there in WT pollen tubes (Fig. 5 K). In adf7, the transported particles appeared a bit further away from the tip, which suggests that the further invasion of vesicles into the extreme tip was prevented (Fig. 5 K). In adf10, hardly any vesicles were detected at the corresponding region (Fig. 5 K), which again suggests that tipward movement of vesicles is severely impaired in adf10. Thus, accumulation of vesicles at pollen tube tips appears to require rapid turnover of inner apical actin filaments to generate a region with fewer actin filaments. In summary, these findings suggest that ADF10-mediated regulation of the dynamics and organization of subapical actin filaments facilitates the tip-directed transportation of vesicles and their backward movement, while ADF7 is strictly required for the rapid turnover of actin filaments at the extreme apex, which permits the accumulation of vesicles therein (Fig. S2 B).
Two pollen ADFs from tomatoes have different pH preferences when disassembling actin filaments in vitro
The genome of the tomato Solanum lycopersicum encodes four subclass II ADFs (Fig. S3 A). Three of them, Solyc01g094400, Solyc03g025750, and Solyc10g017050, are likely expressed in pollen, as they show expression in unopened and fully opened flowers (Fig. S3 B). Semi-quantitative RT-PCR analysis showed that Solyc01g094400 (encoding SlADF1) and Solyc03g025750 (encoding SlADF3) are expressed in the pollen (Fig. S3 C). By high-speed F-actin cosedimentation assay, we found that SlADF1 behaves like a typical actin-depolymerizing factor as its actin disassembling activity increases with the rise in pH; by contrast, the actin disassembling activity of SlADF3 is higher at low pH (Fig. S3, D and E). Thus, the expression of pollen ADF isovariants with different pH sensitivities might be a common phenomenon in flowering plants.
![Two pollen ADF isovariants from S. lycopersicum show pH-dependent activity in the in vitro actin filament disassembling assay. (A) Phylogenetic analysis of ADFs from several plant species. The maximum-likelihood phylogenetic tree of ADFs from several plant species was generated by the Maximum Likelihood method based on the JTT matrix-based model (Jones et al., 1992). Four subclasses of ADFs are highlighted with different colors. Species abbreviations are as follows: At, Arabidopsis thaliana; Zm, Zea mays; Os, Oryza sativa; Solyc, S. lycopersicum; Bd, Brachypodium distachyon; Php, Physcomitrella patens. PhpADF was used as an outlier. The indicated numbers of the branch nodes in the phylogenetic tree refer to posterior probabilities. Bootstrap = 500. The protein accession numbers from GeneBank were as follows: AtADF1, NP_190187; AtADF2, NP_566882; AtADF3, NP_851227; AtADF4, NP_851228; AtADF5, NP_565390; AtADF6, NP_565719; AtADF7, NP_194289; AtADF8, NP_567182; AtADF9, NP_195223; AtADF10, NP_568769; AtADF11, NP_171680; Solyc01g094400, XP_019068822; Solyc01g111380, XP_004231029; Solyc03g025750, XP_010317604; Solyc04g011370, XP_004236758; Solyc06g005360, XP_004240356; Solyc06g035980, XP_004240732; Solyc09g010440, XP_004246462; Solyc09g072590, XP_004247519; Solyc09g090110, XP_004247731; Solyc10g017550, XP_019071428; Solyc10g084660, XP_004249528; OsADF1, XP_015622816; OsADF2, XP_015630947; OsADF3, XP_015632173; OsADF4, XP_015632174; OsADF5, XP_015631622; OsADF6, XP_015637229; OsADF8, XP_015644676; OsADF9, XP_015645783; OsADF10, XP_015613388; OsADF11, XP_015618885; Zm2G015127, NP_001148445; ZmADF1, XP_008651860; ZmADF2, NP_001105590; ZmADF3, CAA66311; ZmADF5, XP_008681563; ZMADF6, ACG32422; BdADF1, XP_003570044; BdADF2, XP_003558421; BdADF3, XP_010227648; BdADF4, XP_010227656; BdADF5, XP_003558363; BdADF6, XP_014751334; BdADF9, XP_010238336; BdADF10, XP_003574212; PhpADF, PNR26890. (B) Tissue expression of subclass II ADFs from S. lycopersicum. Based on the phylogenetic analysis shown in A, four S. lycopersicum ADFs (Solyc01g094400 (SlADF1), Solyc03g025750 (SlADF3), Solyc06g035980 (SlADF6), and Solyc10g017550 (SlADF10)) were classified into subclass II. The original tissue expression datasets were retrieved from the eFP Browser (http://bar.utoronto.ca/). (C) The expression of SlADF1, SlADF3, and SlADF10 in S. lycopersicum pollen was assessed by RT-PCR analysis. (D and E) SDS-PAGE analysis of samples from high-speed F-actin cosedimentation experiments. [F-actin], 3 μM; [ADF], 20 μM. S, supernatant; P, pellet. (F) The amount of actin in the supernatant was quantified and plotted versus pH. Data are presented as mean ± SD, n = 3. Source data are available for this figure: SourceData FS3.](https://cdn.rupress.org/rup/content_public/journal/jcb/222/11/10.1083_jcb.202206074/1/m_jcb_202206074_figs3.png?Expires=1768944506&Signature=zylT1ry5FI-ILh6~NiQx4AptcIF~jgT-puqq7tOpHcZZy0iI9aqPGYxdljJE9m3reXkisPw1hNvv62DV-jSw4UJoXa5u5IIbz6L84nX-HXs3POMpjVVYqhtQcI1H6QfJWPbEllxC4MLZSAASuEl5JWS6lyAfIPq4G-tphTGaSGBPHcREAN2t55iFO9U~ZLzQ5ASge096fnSNArMmWZ95v3~pK~r8hVbdOJalLKb7SLzpzH6imRpzevP7sNVdHTXao~GQnAeDOBD5Lm7c~90lD~YRnvennGBNguOgnZap898MLBi4jN17UT8XTAhPixrvrLwqfjTJ6B9uikGDz8gaXQ__&Key-Pair-Id=APKAIE5G5CRDK6RD3PGA)
Two pollen ADF isovariants from S. lycopersicum show pH-dependent activity in the in vitro actin filament disassembling assay. (A) Phylogenetic analysis of ADFs from several plant species. The maximum-likelihood phylogenetic tree of ADFs from several plant species was generated by the Maximum Likelihood method based on the JTT matrix-based model (Jones et al., 1992). Four subclasses of ADFs are highlighted with different colors. Species abbreviations are as follows: At, Arabidopsis thaliana; Zm, Zea mays; Os, Oryza sativa; Solyc, S. lycopersicum; Bd, Brachypodium distachyon; Php, Physcomitrella patens. PhpADF was used as an outlier. The indicated numbers of the branch nodes in the phylogenetic tree refer to posterior probabilities. Bootstrap = 500. The protein accession numbers from GeneBank were as follows: AtADF1, NP_190187; AtADF2, NP_566882; AtADF3, NP_851227; AtADF4, NP_851228; AtADF5, NP_565390; AtADF6, NP_565719; AtADF7, NP_194289; AtADF8, NP_567182; AtADF9, NP_195223; AtADF10, NP_568769; AtADF11, NP_171680; Solyc01g094400, XP_019068822; Solyc01g111380, XP_004231029; Solyc03g025750, XP_010317604; Solyc04g011370, XP_004236758; Solyc06g005360, XP_004240356; Solyc06g035980, XP_004240732; Solyc09g010440, XP_004246462; Solyc09g072590, XP_004247519; Solyc09g090110, XP_004247731; Solyc10g017550, XP_019071428; Solyc10g084660, XP_004249528; OsADF1, XP_015622816; OsADF2, XP_015630947; OsADF3, XP_015632173; OsADF4, XP_015632174; OsADF5, XP_015631622; OsADF6, XP_015637229; OsADF8, XP_015644676; OsADF9, XP_015645783; OsADF10, XP_015613388; OsADF11, XP_015618885; Zm2G015127, NP_001148445; ZmADF1, XP_008651860; ZmADF2, NP_001105590; ZmADF3, CAA66311; ZmADF5, XP_008681563; ZMADF6, ACG32422; BdADF1, XP_003570044; BdADF2, XP_003558421; BdADF3, XP_010227648; BdADF4, XP_010227656; BdADF5, XP_003558363; BdADF6, XP_014751334; BdADF9, XP_010238336; BdADF10, XP_003574212; PhpADF, PNR26890. (B) Tissue expression of subclass II ADFs from S. lycopersicum. Based on the phylogenetic analysis shown in A, four S. lycopersicum ADFs (Solyc01g094400 (SlADF1), Solyc03g025750 (SlADF3), Solyc06g035980 (SlADF6), and Solyc10g017550 (SlADF10)) were classified into subclass II. The original tissue expression datasets were retrieved from the eFP Browser (http://bar.utoronto.ca/). (C) The expression of SlADF1, SlADF3, and SlADF10 in S. lycopersicum pollen was assessed by RT-PCR analysis. (D and E) SDS-PAGE analysis of samples from high-speed F-actin cosedimentation experiments. [F-actin], 3 μM; [ADF], 20 μM. S, supernatant; P, pellet. (F) The amount of actin in the supernatant was quantified and plotted versus pH. Data are presented as mean ± SD, n = 3. Source data are available for this figure: SourceData FS3.
Two pollen ADF isovariants from S. lycopersicum show pH-dependent activity in the in vitro actin filament disassembling assay. (A) Phylogenetic analysis of ADFs from several plant species. The maximum-likelihood phylogenetic tree of ADFs from several plant species was generated by the Maximum Likelihood method based on the JTT matrix-based model (Jones et al., 1992). Four subclasses of ADFs are highlighted with different colors. Species abbreviations are as follows: At, Arabidopsis thaliana; Zm, Zea mays; Os, Oryza sativa; Solyc, S. lycopersicum; Bd, Brachypodium distachyon; Php, Physcomitrella patens. PhpADF was used as an outlier. The indicated numbers of the branch nodes in the phylogenetic tree refer to posterior probabilities. Bootstrap = 500. The protein accession numbers from GeneBank were as follows: AtADF1, NP_190187; AtADF2, NP_566882; AtADF3, NP_851227; AtADF4, NP_851228; AtADF5, NP_565390; AtADF6, NP_565719; AtADF7, NP_194289; AtADF8, NP_567182; AtADF9, NP_195223; AtADF10, NP_568769; AtADF11, NP_171680; Solyc01g094400, XP_019068822; Solyc01g111380, XP_004231029; Solyc03g025750, XP_010317604; Solyc04g011370, XP_004236758; Solyc06g005360, XP_004240356; Solyc06g035980, XP_004240732; Solyc09g010440, XP_004246462; Solyc09g072590, XP_004247519; Solyc09g090110, XP_004247731; Solyc10g017550, XP_019071428; Solyc10g084660, XP_004249528; OsADF1, XP_015622816; OsADF2, XP_015630947; OsADF3, XP_015632173; OsADF4, XP_015632174; OsADF5, XP_015631622; OsADF6, XP_015637229; OsADF8, XP_015644676; OsADF9, XP_015645783; OsADF10, XP_015613388; OsADF11, XP_015618885; Zm2G015127, NP_001148445; ZmADF1, XP_008651860; ZmADF2, NP_001105590; ZmADF3, CAA66311; ZmADF5, XP_008681563; ZMADF6, ACG32422; BdADF1, XP_003570044; BdADF2, XP_003558421; BdADF3, XP_010227648; BdADF4, XP_010227656; BdADF5, XP_003558363; BdADF6, XP_014751334; BdADF9, XP_010238336; BdADF10, XP_003574212; PhpADF, PNR26890. (B) Tissue expression of subclass II ADFs from S. lycopersicum. Based on the phylogenetic analysis shown in A, four S. lycopersicum ADFs (Solyc01g094400 (SlADF1), Solyc03g025750 (SlADF3), Solyc06g035980 (SlADF6), and Solyc10g017550 (SlADF10)) were classified into subclass II. The original tissue expression datasets were retrieved from the eFP Browser (http://bar.utoronto.ca/). (C) The expression of SlADF1, SlADF3, and SlADF10 in S. lycopersicum pollen was assessed by RT-PCR analysis. (D and E) SDS-PAGE analysis of samples from high-speed F-actin cosedimentation experiments. [F-actin], 3 μM; [ADF], 20 μM. S, supernatant; P, pellet. (F) The amount of actin in the supernatant was quantified and plotted versus pH. Data are presented as mean ± SD, n = 3. Source data are available for this figure: SourceData FS3.
In conclusion, our results indicate that ADF7 enhances actin remodeling at the apex, and ADF10 is strictly required for regulating the turnover and spatial organization of subapical actin filaments. Thus, coordination of ADF7 and ADF10 ensures the regulation of actin dynamics within the apical and subapical regions, which in turn facilitates the construction of the apical actin structure in pollen tubes (Fig. 4 I). Our study suggests that the pH-dependent activity of ADF isovariants enables the function of the actin cytoskeleton in controlling the intracellular trafficking system in growing pollen tubes. Therefore, the functional coordination of ADF7 and ADF10 ensures the dynamic interplay between pH gradient, actin remodeling, and intracellular trafficking to drive rapid polarized pollen tube growth. Our findings significantly enhance our understanding of the cellular mechanisms that drive polar pollen tube growth.
Our findings also suggest that the pollen tube is an ideal cellular system to analyze the functional association of cytosolic pH with actin dynamics. This is mainly due to the fact that pollen tubes harbor a pH gradient at the tip (Feijó et al., 1999; Michard et al., 2008) and an ordered actin cytoskeleton (Fu, 2015; Stephan, 2017; Xu and Huang, 2020). Specifically, lily pollen tubes have a slightly acidic apex (pH ∼6.8) and a subapical alkaline band (pH ∼7.5; Feijó et al., 1999, 2001; Lovy-Wheeler et al., 2006; Messerli and Robinson, 1998). In addition, actin filaments have distinct spatial organizations at the apex and subapex of pollen tubes and they exhibit distinct functions in regulating vesicle trafficking (Xu and Huang, 2020; Zhang et al., 2023). This allows us to observe and quantify changes in the dynamics and organization of the apical and subapical actin cytoskeleton in response to functional alterations in pH-responsive actin regulatory proteins. Our findings about the regulation of actin dynamics by pH-sensitive ADF isovariants in pollen tubes may have general implications in other cellular systems. There are three different mammalian ADF/cofilin proteins (Cof1, Cof2, and ADF) and some cell types express all of them (Hotulainen et al., 2005; Kanellos et al., 2015; Tahtamouni et al., 2013; Vartiainen et al., 2002; Zuchero et al., 2015). Genetic studies showed that they have non-equivalent physiological roles (Estornes et al., 2007; Flynn et al., 2012; Gurniak et al., 2005; Ikeda et al., 2003). Their differential response to pH remains uncharacterized; however, biochemical analyses showed that they have differential capabilities in severing and disassembling filaments in vitro (Chin et al., 2016; Yeoh et al., 2002). We speculate that mammalian ADF/cofilin proteins might have different pH preferences in severing and disassembling actin filaments, which enables the functional coordination of actin with cytosolic pH within different cell physiology contexts. This is worthy of future investigations.
Materials and methods
Plant material and growth condition
Arabidopsis thaliana Columbia ecotype (Col-0) was used as WT. Information on the adf7 (salk_024576) and adf10 (ADF10 TALEN knockout mutant) mutants, and on the adf7 and adf10 mutants harboring Lat52::Lifeact-eGFP (Lat52::Lifeact-eGFP;adf7; and Lat52::Lifeact-eGFP;adf10) or Lat52::YFP-RabA4b (Lat52::YFP-RabA4b;adf7; and Lat52::YFP-RabA4b;adf10) has been described previously (Jiang et al., 2017b; Zheng et al., 2013). Lat52::Lifeact-eGFP;wt and Lat52::YFP-RabA4b;wt were used as controls. Arabidopsis plants were cultured in medium or soil at 22°C under a 16-h light/8-h dark cycle. S. lycopersicum plants were grown in the soil at 26°C under a 16-h light/8-h dark cycle in a greenhouse under natural light.
Western blot analysis and quantification of the amount of ADF7 and ADF10 in pollen
Total pollen protein extraction was performed according to our previously published method (Chang and Huang, 2015). Briefly, pollen derived from WT, adf7, adf10, ADF7pro::ADF7-eGFP; adf7, and ADF10pro::ADF10-eGFP; adf10 plants (Jiang et al., 2017b; Zheng et al., 2013) was collected by vortexing and centrifugation and subsequently ground in liquid nitrogen. Protein extraction buffer (25 mM Tris-HCl, pH 7.5, 250 mM NaCl, 0.1% NP-40, cOmplete, EDTA-free Protease Inhibitor Cocktail [4693159001; Sigma-Roche], 1% phosphatase inhibitor cocktail 2 [P5726; Sigma-Aldrich], and 10 mM DTT) was then added to the ground pollen and mixed by vortexing. The mixture was finally centrifuged at 13,523 g for 30 min at 4°C and the supernatant was collected. Total pollen protein was separated on 10% SDS-polyacrylamide gels, and Western blotting was performed according to the manufacturer’s instructions (Bio-Rad). The native non-fusion ADF7 and ADF10 were detected with an anti-ADF7 antibody that non-selectively recognizes ADF7 and ADF10 (Jiang et al., 2019), and the ADF7-eGFP and ADF10-eGFP fusion proteins were detected with an anti-GFP antibody (EASYBIO, GFP-Tag Rabbit Polyclonal Antibody). The amount of UGPase, detected with an anti-UGPase antibody (AS05086; Agrisera), was used as the loading control. To determine the amount of ADF7 or ADF10 in pollen, the abundance of ADF protein in WT, adf7, and adf10 pollen was determined by densitometry with ImageJ software after probing with anti-ADF7 antibody, and the relative abundance of ADF in WT, adf7, and adf10 was obtained by normalizing to the amount of UGPase. Based on the premise that ADF7 and ADF10 are two major pollen ADFs and their content represents the total ADF proteins in pollen, the amount of ADF7 protein in pollen was obtained by subtracting the amount of ADF protein in the adf10 mutant from that in WT pollen, and the amount of ADF10 protein was obtained by subtracting the amount of ADF protein in the adf7 mutant from that in WT pollen. Data analysis was performed with GraphPad Prism 9.
Visualization and quantification of intracellular localization of ADF7-eGFP and ADF10-eGFP in pollen tubes
To quantify the intracellular localization of ADF7-eGFP and ADF10-eGFP in pollen tubes, a line covering the whole tube was drawn, and the fluorescence intensity of ADF7-eGFP and ADF10-eGFP along the tube growth axis was measured using ImageJ software (http://rsbweb.nih.gov/ij/; version 1.46) with the “Plot Profile” plugin. More than 60 pollen tubes derived from ADF7pro::ADF7-eGFP; adf7 and ADF10pro::ADF10-eGFP; adf10 plants (Jiang et al., 2017b; Zheng et al., 2013) were measured. To determine the concentration of ADF7-eGFP and ADF10-eGFP within different regions of the pollen tube, it was assumed that the amount of ADF7 or ADF10 in the shank region (10–30 µm from the tube tip) represents the total amount of ADF7 or ADF10 in the pollen tube. The amount of each protein within the apical and subapical regions was subsequently obtained based on the ratio of fluorescence intensity between the apical/subapical region and the shank region. The distribution pattern of ADF7-eGFP and ADF10-eGFP in different directions of the pollen tube was generated using the “volume viewer” plugin in ImageJ software. The 3D distribution of fluorescence intensity was generated using the “3D surface plot” plugin.
Visualization of actin filaments in fixed Arabidopsis pollen tubes
Pollen was germinated on the surface of solid germination medium (GM: 1 mM CaCl2, 1 mM Ca(NO3)2, 1 mM MgSO4, 0.01% [wt/vol] H3BO3, and 18% [wt/vol] sucrose solidified with 0.8% [wt/vol] agarose, pH 6.9–7.0) at 28°C under moist conditions according to the previously published method (Wu et al., 2010). To reveal the organization of the actin cytoskeleton in pollen tubes by labeling with fluorescent phalloidin, pollen tubes were subjected to fixation with 300 μM 3-maleimidobenzoic acid N-hydroxysuccinimide ester crystalline (MBS; M2786; Sigma-Aldrich) for 1 h at 28°C after the average tube length reached 100–150 μm. After three washes with TBS buffer (50 mM Tris-HCl, pH 7.4, 200 mM NaCl, 400 mM sucrose, and 0.05% NP-40), pollen tubes were incubated with 100 nM Alexa-Fluor-488-phalloidin overnight at 4°C as described previously (Qu et al., 2020). Actin filaments were observed with an Olympus FV1000MPE multiphoton laser scanning confocal microscope equipped with a 100× objective (UPLSAPO100XO, numerical aperture of 1.4). The Alexa-Fluor-488-phalloidin was excited with an argon laser at 488 nm and the emission wavelength was set in the range of 505–605 nm. The Z-series images were acquired with the step size set at 0.5 μm. To analyze the relative fluorescence intensity of actin filaments in the pollen tube tip region (0–3 μm from the tube tip), Z projection images were generated using ImageJ software. A 3-μm wide line was drawn along the direction perpendicular to the growth axis. The line covered the tip region of the pollen tube. The fluorescence intensity of actin filament staining at each point within the covered region was measured with the “Plot Profile” plugin in ImageJ software and the average fluorescence intensity was calculated. To assess the relative amount of actin filaments within the covered region, the fluorescence intensity at each point was subsequently divided by the average fluorescence intensity. More than 35 pollen tubes were measured for each genotype. Transverse sections of pollen tubes were generated using “Image-Stacks-Reslice.” GraphPad Prism 9 was used for data analysis and graphing.
Visualization of actin filaments in living Arabidopsis pollen tubes
Actin filaments were decorated with Lifeact-eGFP in WT, adf7, and adf10 pollen tubes, as described previously (Jiang et al., 2017b; Zheng et al., 2013). Pollen tubes derived from Lat52::Lifeact-eGFP;wt, Lat52::Lifeact-eGFP;adf7, and Lat52::Lifeact-eGFP;adf10 were observed under an IX81 microscope (Olympus) equipped with a CSUX1 scanning head (Yokogawa Electric) using a 100× oil immersion objective (UPLSAPO100XO, 1.4 numerical aperture), and the time-lapse Z-series images were collected every 2 s with an iXon3 DU888 EMCCD camera (Andor Technology) using MetaMorph software (Molecular Devices) with the step size set at 0.7 μm. A kymograph taken along the growth direction at the center of the pollen tube was created to analyze the F-actin intensity along the growing pollen tube as described previously (Qu et al., 2013). To display the difference in the “apical actin structure,” kymograph analysis was carried out using ImageJ software as described previously (Qu et al., 2017). Briefly, a 3-μm-wide line along the pollen tube growth axis was drawn, and the plugin StackProfileData (http://rsb.info.nih.gov/ij/macros/StackProfileData.txt) in ImageJ was used to measure the gray values along the line. The kymograph was generated by inputting the text file into ImageJ. The angle formed between each actin filament and the growth axis of the pollen tube was measured using ImageJ software with the built-in “angle tool.”
Visualization and quantification of the overall distribution of RabA4b-positive vesicles in pollen tubes
RT-PCR analysis
Total RNA was isolated from S. lycopersicum pollen with TRIzol reagent (Invitrogen). Total RNA was subsequently used for reverse transcription with MMLV reverse transcriptase (Promega) according to the manufacturer’s instructions to synthesize cDNA. The relative amount of SlADF1, SlADF3, and SlADF10 transcripts was determined by RT-PCR analysis with the primer pairs SlADF1-RT-F (5′-ATGGCGAATTCGGCATCAGG-3′)/SlADF1-RT-R (5′-CCATCAAGAAAAAGGGCCTA-3′), SlADF3-RT-F (5′-ATGGCAAATGCTGTGTCT-3′)/SlADF3-RT-R (5′-GACTCAGTAGGCTCGCGATT-3′), and SlADF10-RT-F (5′-ATGGCGAATTCGGCATCAGG-3′)/SlADF10-RT-R (5′-TATTTCTGGGCCAGCGACTAA-3′), respectively.
Plasmid construction and protein production
To generate constructs expressing GFP fusion proteins with eGFP inserted between Val10 (V10) and Glu11 (E11) of ADF7 and ADF10, which were designated as ADF7-eGFPV10 and ADF10-eGFPV10, two fragments for each fusion construct were initially amplified. Briefly, one fragment containing eGFP was amplified with primer pair KG-ADF7-linker1-eGFP-F1 (5′-TGGTGGTGGTGGAATTCTAATGGCGAACGCGGCGTCGGGGATGGCAGTGGGCGGTGGAGGCAGTGGCGGTGGAAGCAAGGGCGAGGAGCTG-3′)/Linker2-eGFP-R1 (5′-ACTACTTCCACTTCCTGTACTTCCTGTTCCATCTCCCTTGTACAGCTCGTCCAT-3′) or KG-ADF10-linker1-eGFP-F1 (5′-GTGGTGGTGGTGGAATTCTAATGGCGAACGCGGCGTCGGGGATGGCGGTGGGCGGTGGAGGCAGTGGCGGTGGAATGGTGAGCAAGGGCGAG-3′)/Linker2-eGFP-R1 using the plasmid containing eGFP as the template, designated as ADF7 (N1-10Aa)-eGFP or ADF10 (N1-10Aa)-eGFP, and the other fragment was amplified with EGFP-linker2-ADF7-F2 (5′-GTACAGGAAGTGGAAGTAGTGAGGACGAGTGCAAGCTGAA-3′)/KG-ADF7-HindIII-R2 (5′-CAGTCACGATGAATAAGCTTCTAGAGAGCTCGGCTTTTGA-3′) using pGEX-KG-ADF7 (Zheng et al., 2013) or pGEX-KG-ADF10 (Jiang et al., 2017b) as the template, designated as ADF7 (dN10Aa) or ADF10 (dN10Aa). The ADF7-eGFPV10 or ADF10-eGFPV10 plasmid was constructed through the In-Fusion Cloning system by combining ADF7 (N1-10Aa)-eGFP with ADF7 (dN10Aa) or ADF10 (N1-10Aa)-eGFP with ADF10 (dN10Aa) in the presence of linearized pGEX-KG. To generate recombinant SlADF1 and SlADF3, their coding sequences were amplified from total cDNAs isolated from S. lycopersicum pollen with primer pairs pCold-SlADF1-F (5′-GGAATTCCATATGATGGCGAATTCGGCATCAGG-3′)/pCold-SlADF1-R (5′-AAAACTGCAGTCAGAGAGCTCTGCAAATGA-3′) and pCold-S3ADF1-F (5′-GGAATTCCATATGATGGCAAATGCTGTGTCT-3′)/pCold-SlADF3-R (5′-AAAACTGCAGTCAGTAGGCTCGCGATTTAA-3′), respectively. The PCR products were cloned into pCold I to generate pCold I-SlADF1 and pCold I-SlADF3. To generate recombinant SlADF1, SlADF3, ADF7, ADF10, ADF7-eGFPV10, and ADF10-eGFPV10 proteins, their expression plasmids were transformed into the Escherichia coli BL21 (DE3) strain. Expression of ADF proteins was induced by the addition of 0.4 mM isopropyl β-D-thiogalactopyranoside, followed by incubation at 16°C overnight. Bacterial cells were collected by centrifugation at 4,000 × g for 10 min at 4°C. To purify SlADF1 and SlADF3, bacterial cells were resuspended and lysed by sonication in lysis buffer solution (25 mM Tris-HCl, 5 mM imidazole, 250 mM KCl, 1 mM PMSF, pH 8.0). The sonicate was centrifuged at 20,000 × g for 30 min at 4°C, and the supernatants were incubated with nickel-nitriloacetic acid resin (Novagen) according to the manufacturer’s instructions. After extensive washing with wash buffer (25 mM Tris-HCl, 20 mM imidazole, 250 mM KCl, pH 8.0), SlADF1 and SlADF3 were eluted with elution buffer (25 mM Tris-HCl, 250 mM imidazole, 250 mM KCl, pH 8.0). Purification of recombinant ADF7, ADF10, ADF7-eGFPV10, and ADF10-eGFPV10 proteins was performed as described previously (Zheng et al., 2013). Briefly, bacterial cells were resuspended and lysed by sonication in lysis buffer solution (137 mM NaCl, 2.7 mM KCl, 10 mM Na2HPO4, 1.8 mM KH2PO4, 1 mM PMSF, pH 7.4). The sonicate was centrifuged at 20,000 × g for 30 min at 4°C. The supernatants were incubated with glutathione–sepharose resin (GE Healthcare) according to the manufacturer’s instructions. GST-ADF7 or GST-ADF-eGFP was digested with thrombin (Sigma-Aldrich) overnight at 4°C to remove the GST-tag. All purified proteins were dialyzed against 5 mM Tris-HCl, pH 8.0, flash-frozen in liquid nitrogen, and stored at −80°C. Rabbit muscle actin was purified according to the previously published method (Pollard, 1984; Spudich and Watt, 1971), and labeling of actin with Oregon-green and 7-chloro-4-nitrobenzo-2-oxa-1,3-diazole (NBD) was performed as described previously (Amann and Pollard, 2001; Chaudhry et al., 2007).
High-speed F-actin cosedimentation assay
The high-speed F-actin cosedimentation assay was performed as described previously (Shi et al., 2013). Briefly, preassembled actin filaments at 3 μM were incubated with various concentrations of ADF7, ADF10, SlADF1, or SlADF3 at different pH for 30 min at room temperature, and the mixtures were subsequently subjected to centrifugation at 100,000 g for 30 min at 4°C. The amount of actin in the supernatant was quantified by densitometry with ImageJ software.
NBD-actin binding assay
Kinetic F-actin depolymerization assay
Preassembled actin filaments at 5 μM, which were polymerized from the mixture with equal amounts of non-labeled G-actin and NBD-labeled G-actin, were used as the stock. To initiate actin depolymerization, F-actin was diluted to a final concentration at 200 nM in buffer G in the presence of ADF proteins under pH ranging from 5.5 to 8.0. The decrease in NBD fluorescence accompanying actin depolymerization was monitored by a QuantaMaster Luminescence QM 3 PH fluorometer with the excitation and emission wavelengths set at 475 and 530 nm, respectively.
Spontaneous actin polymerization assay
Spontaneous actin polymerization was performed as described previously (Shi et al., 2013). Briefly, actin at 3 µM (10% pyrene-labeled) was incubated with various concentrations of ADF7 or ADF10 for 2 min at room temperature, and actin polymerization was initiated by the addition of 1/10 volume of 10× KMEI buffer (100 mM imidazole-HCl, pH 7.0, 500 mM KCl, 10 mM MgCl2, and 10 mM EGTA). The increase in pyrene fluorescence accompanying actin polymerization was monitored by a QuantaMaster Luminescence QM 3 PH Fluorometer with excitation and emission wavelengths set at 365 and 407 nm, respectively. To calculate the actin polymerization rate, the linear least squares method was used to record the maximal slope at the growth phase of actin polymerization curves as described previously (Doolittle et al., 2013). The datasets were analyzed in Excel and GraphPad Prism 9 software.
Monitoring and quantification of the severing and monomer dissociation of individual actin filaments by TIRFM
TIRFM was performed to visualize the dynamics of individual actin filaments in vitro as described previously (Jiang and Huang, 2017). F-actin (50% rhodamine-labeled) at 250 nM together with various concentrations of ADF proteins in 1×TIRFM buffer (10 mM imidazole, pH 7.0, 50 mM KCl, 1 mM MgCl2, 1 mM EGTA, 50 mM DTT, 0.2 mM ATP, 50 mM CaCl2, 15 mM glucose, 20 μg/ml catalase, 100 μg/ml glucose oxidase, and 0.5% methylcellulose) were injected into a flow chamber and was observed under an Olympus IX81 microscope equipped with a 100× oil objective (UPLSAPO100XO, 1.4 numerical aperture) and TIRF illumination system. Time-lapse images were captured at 2 or 3 s intervals with an Andor iXon3 DU888 EMCCD camera with microManager software (www.micro-manager.org). Quantifications of actin filament severing frequency (breaks μm−1 s−1) and monomer dissociation rate (subunits s−1) were performed as previously described (Andrianantoandro and Pollard, 2006; Shi et al., 2013). Briefly, to determine the average severing frequency, breaks along single-actin filaments in all images were counted after the addition of protein. The severing frequency for actin filaments was calculated as the number of breaks per unit filament length per unit time (breaks/μm/s). More than 20 actin filaments with a length >10 μm were selected for analysis of each protein. Measurements were performed from at least three time-lapse series that were captured under each experimental condition. To determine the monomer dissociation rate (subunits s−1), filament length for at least 10 actin filaments was measured, and plots of filament length versus elapsed time were made.
Phylogenetic analysis
Amino acid sequences of ADF homologs were retrieved from TAIR and NCBI, aligned by ClustalW, and phylogenetic analysis was done by using the Maximum Likelihood method based on the JTT matrix-based model (Jones et al., 1992). The tree with the highest log likelihood is shown, bootstrap = 500. The percentage of trees in which the associated taxa clustered together was shown next to the branches. Initial tree(s) for the heuristic search were obtained automatically by applying Neighbor-Join and BioNJ algorithms to a matrix of pairwise distances estimated using the JTT model and then selecting the topology with superior log likelihood value. The tree was drawn to scale, with branch lengths measured in the number of substitutions per site. All positions containing gaps and missing data were eliminated. Evolutionary analyses were conducted in MEGA7 (Kumar et al., 2016).
Statistical analysis
Datasets were compared with the unpaired two-tailed Student’s t test. Data distribution was assumed to be normal but this was not formally tested. P values <0.05 were considered to be statistically significant.
Online supplemental material
Fig. S1 shows that ADF7-eGFP and ADF10-eGFP exhibit differential pH sensitivity in disassembling and severing actin filaments in vitro. Fig. S2 shows a schematic describing the organization of actin filaments and distribution of vesicles in WT, adf7, and adf10 pollen tubes. Fig. S3 shows two pollen ADF isovariants from S. lycopersicum show pH-dependent activity in the in vitro actin filament disassembling assay. Video 1 shows ADF7 and ADF10 fragment actin filaments and promotes their disassembly. Related to Fig. 2.
Data availability
Acknowledgments
We thank Dr. Yiyan Zheng for the initial characterization of pH regulation of ADF7 in vitro.
This work was supported by grants from the National Natural Science Foundation of China (32270338 and 31970180).
Author contributions: Conceptualization, S. Huang; Methodology, J. Wang, J. Shen, Y. Xu, and Y. Jiang; Investigation, J. Wang, J. Shen, Y. Xu, Y. Jiang, X. Qu, W. Zhao, and Y. Wang; Resources, S. Huang; Writing, S. Huang, J. Wang, Y. Xu, and J. Shen; Funding acquisition, S. Huang; Supervision, S. Huang.
