Neuronal signaling requires large amounts of ATP, making neurons particularly sensitive to defects in energy homeostasis. Mitochondrial movement and energy production are therefore regulated to align local demands with mitochondrial output. Here, we report a pathway that arrests mitochondria in response to decreases in the ATP-to-AMP ratio, an indication that ATP consumption exceeds supply. In neurons and cell lines, low concentrations of the electron transport chain inhibitor antimycin A decrease the production of ATP and concomitantly arrest mitochondrial movement without triggering mitophagy. This arrest is accompanied by the accumulation of actin fibers adjacent to the mitochondria, which serve as an anchor that resists the associated motors. This arrest is mediated by activation of the energy-sensing kinase AMPK, which phosphorylates TRAK1. This mechanism likely helps maintain cellular energy homeostasis by anchoring energy-producing mitochondria in places where they are most needed.
Introduction
Mitochondria are dynamic, energy-producing organelles that move, change shape, and tune metabolite production to match cellular demand. Cells such as neurons require a large amount of ATP for energy-intensive functions such as neurotransmission (Howarth et al., 2012; Attwell and Laughlin, 2001). In addition, neurons must employ mechanisms to distribute mitochondria throughout the entire cell, including its distal processes, to balance energy demand and supply. Thus, the movement and position of mitochondria are important for efficiently fueling cellular functions.
Processive mitochondrial movement occurs on microtubule tracks and requires dynein and kinesin for anterograde and retrograde movement. Mitochondria are coupled to these molecular motors via motor/adaptor proteins in which Miro and TRAK are central (van Spronsen et al., 2013; Glater et al., 2006). These motor/adaptors regulate mitochondrial position and movement, an example of which is the mitochondrial arrest caused by the O-GlcNAcylation of TRAK (Pekkurnaz et al., 2014). When shifted from a low- to high-glucose environment, mitochondria become immobilized by associating with the actin cytoskeleton. This arrest is caused by O-GlcNAcylation of TRAK1, which subsequently recruits to mitochondria the actin-interacting protein FHL2, thus immobilizing these organelles in regions of high glucose (Basu et al., 2021; Pekkurnaz et al., 2014). Another much-studied form of mitochondrial arrest is the response to rapid loss of mitochondrial membrane potential, including studies in which the electron transport chain (ETC) is inhibited by high concentrations of potent mitochondrial toxins (Wang et al., 2011; Shlevkov et al., 2016; Liu et al., 2012). Under these conditions, mitochondrial arrest is mediated by PINK1 and Parkin, and the degradation of Miro. The consequent arrest is a precursor to mitophagic elimination of the depolarized organelle (Jin et al., 2010).
While mitochondria are essential for all cell types, neurons are particularly vulnerable to fluctuations in fuel availability because they consume large amounts of ATP and yet are unable to store glycogen or perform beta oxidation (Yellen, 2018). The significance of mitochondrial energy production becomes evident from the many neurological diseases, both developmental and neurodegenerative, that are associated with mitochondrial dysfunction (Walker et al., 2022; Nunnari and Suomalainen, 2012; Ramos et al., 2021; Hou et al., 2019; Nicholls and Ferguson, 2013; Koopman et al., 2013). Notably, mutations in ETC genes required for mitochondrial energy production are the most common cause of pediatric metabolic disease, often with neurological consequences (Walker et al., 2022).
Here, we show that mitochondrial motility is sensitive to the ratio of ATP to AMP, a parameter that declines when ATP use is not adequately compensated by ATP production. AMP-activated protein kinase (AMPK), the ATP:AMP-sensing kinase, mediates this arrest by phosphorylating TRAK1 and triggering an association of the mitochondria with the actin cytoskeleton.
Results
We examined the effects of 4 nM antimycin A (AntA), an inhibitor of the ETC complex III, on mitochondrial motility in rat hippocampal neurons expressing mitochondria-targeted dsRED. After 1 h, basal oxygen consumption was reduced, the cytoplasmic ATP:ADP ratio was reduced, and axonal mitochondria ceased moving (Fig. 1, A–E). We also tested rat embryonic fibroblasts (hereafter referred to as fibroblasts) to determine whether this effect was neuron-specific.
Standard cell culture techniques promote glycolytic growth in fibroblasts and most common cell lines, thus minimizing the effects of ETC inhibitors on ATP levels. To bypass this problem, we cultured fibroblasts in media containing galactose instead of glucose. In these conditions, inhibiting the ETC with 40 nM AntA for 1 h reduced the ATP:ADP ratio and the decline in the ratio could be rapidly reversed by supplying glucose 30 min after treatment (Fig. 1, F and G). Using software previously developed that measures pixel variance as an indicator of mitochondrial movement in nonneuronal cells (Basu and Schwarz, 2020), we found that 40 nM AntA also decreased mitochondrial motility in fibroblasts (Fig. 1, H and I). The arrest produced by the low concentrations of AntA used here is unlikely to be due to insufficient ATP because Rab5 and lysosomal movement was comparatively unaffected (Fig. S1, A–D).
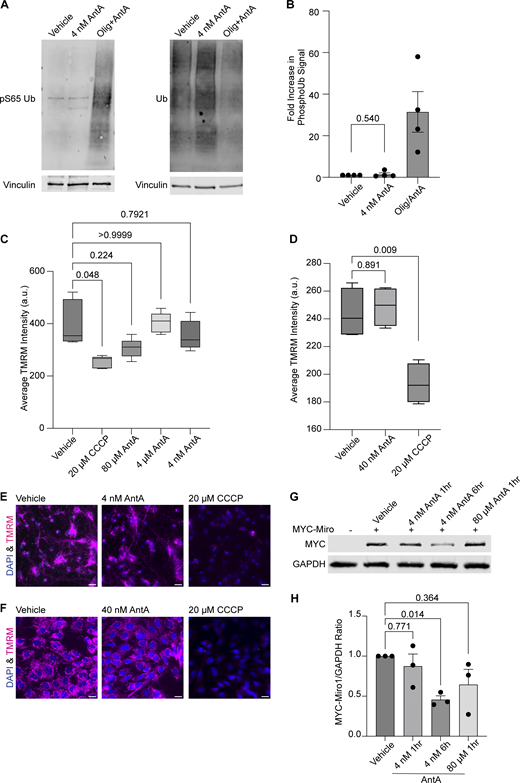
The PINK1/Parkin pathway arrests depolarized mitochondria by modifying and then degrading Miro1 (Wang et al., 2011; Liu et al., 2012). To determine whether the concentrations of AntA used here caused mitochondrial arrest by the same pathway, we measured phosphorylated ubiquitin (pS65 ubiquitin), a well-established product of PINK1 activation (Koyano et al., 2014; Antico et al., 2021). In contrast to what is observed with higher concentrations of ETC inhibitors, 1 h of 4 nM AntA did not change the levels of pS65 ubiquitin (Fig. S2, A and B). This finding is consistent with the preservation of mitochondrial membrane potential as measured with tetramethylrhodamine methyl ester (TMRM) fluorescence in neurons and fibroblasts (Fig. S2, C–F). We also expressed myc-Miro1 from the neuron-specific human synapsin I promoter and found that the levels of myc-Miro1 were not significantly decreased by 1 h of exposure to 4 nM AntA (Fig. S2, G and H). With longer AntA treatments or higher concentrations, myc-Miro1 was degraded, consistent with previous findings (Wang et al., 2011; Liu et al., 2012).
There are two modes by which 4 nM AntA may be arresting axonal mitochondria: (1) they may be passively stopped, e.g., by being detached from their motors and microtubules as occurs upon Miro degradation; or (2) they may be actively anchored in place, e.g., by binding to microtubules or the actin cytoskeleton (Basu et al., 2021; Kang et al., 2008). To distinguish among these possibilities, we used a chemical-induced heterodimerization system to artificially tether a constitutively active kinesin to the mitochondrial outer membrane (Fig. 2 A) (van Spronsen et al., 2013). This system employs the FRB domain of mTOR, the FKBP domain of FKBP12, and rapalog (a metabolically inert rapamycin analog) to irreversibly couple two proteins of interest that are tagged with those domains. By targeting the FKBP domain to the outer mitochondrial membrane and attaching the FRB domain to the motor domain of human kinesin-1, the addition of rapalog forces these two fusion proteins to interact, thus driving active kinesin onto mitochondria (Kapitein et al., 2010). Passively arrested axonal mitochondria should then be dragged down the axons to microtubule + ends, but actively anchored mitochondria should be held in place if the anchor is robust enough to withstand the pulling force of the kinesin. While many mitochondria can be efficiently dragged down the axon in control conditions (Fig. 2, B and D), as previously observed (Gutnick et al., 2019), the mitochondria in AntA-treated cultures remained largely stationary (Fig. 2, C and E). This anchoring was not due to the inability of the kinesin to access the mitochondria; a mCherry-FRB reporter could be recruited to the mitochondria in the same conditions (Fig. S3 A). Thus, AntA-treated mitochondria behave as if they are actively held in place.
The actin cytoskeleton in several cell lines becomes transiently associated with mitochondria during mitochondrial depolarization (Fung et al., 2019; Fung et al., 2022; Chakrabarti et al., 2022; Li et al., 2015) and serves to immobilize mitochondria downstream of TRAK1 GlcNAcylation (Pekkurnaz et al., 2014; Basu et al., 2021). We therefore assessed whether the neuronal actin cytoskeleton was required for mitochondrial anchoring in response to AntA. Indeed, pretreatment with latrunculin A (LatA), which binds actin monomers to prevent their polymerization, prevented the arrest of axonal mitochondria by subsequent addition of AntA (Fig. 2, F and G). Oxidative stress has been shown to stabilize the neuronal actin cytoskeleton (Bernstein et al., 2006; Calabrese et al., 2022), and by quantifying phalloidin staining, we found that 4 nM AntA stabilized neuronal F-actin; LatA could not disrupt much of the already polymerized actin cytoskeleton once it had formed (Fig. S3, B and C). Consistent with that finding, while LatA pretreatment prevented mitochondrial arrest by AntA, mitochondrial movement could not be restored by adding LatA to cultures in which AntA had induced mitochondrial arrest and stabilized the actin (Fig. S3 D).
The dependence of the AntA effect on actin polymerization led us to evaluate whether this mild ETC inhibition induced mitochondria-associated actin structures. However, in fluorescence microscopy of axons, because of their small diameter, mitochondria and F-actin signals always overlap. The association of mitochondria with actin was therefore more easily quantified in fibroblasts (Fig. 3, A–D; and Fig. S3, E and F). Within 10–20 min after the addition of 40 nM AntA, actin filaments appeared to encase the mitochondria and mitochondria then remained in this close association with actin (Fig. 3, A and B). In contrast to earlier studies of a phenomenon termed “acute damage–induced actin” in which actin transiently associates with mitochondria (Fung et al., 2019; Fung et al., 2022; Li et al., 2015; Chakrabarti et al., 2022), the actin associations induced by 40 nM AntA remained for 12 h. When imaged at high resolution (Airyscan), actin fibers were visible that appeared to span the length of each mitochondrion, often with two filaments spiraling around the organelle (Fig. 3 C). These fibers resemble previous reports of perimitochondrial actin filaments (Fung et al., 2019; Fung et al., 2022; Chakrabarti et al., 2022). In rare cases, within an AntA-treated cell, a few mitochondria were observed that, for unknown reasons, did not detectably have adjacent actin; those mitochondria retained more motility than those associated with actin (Fig. S3 E). Consistent with these filaments forming in response to ATP depletion, adding glucose (but not galactose) quickly eliminated them (Fig. 3 D and Fig. S3 F).
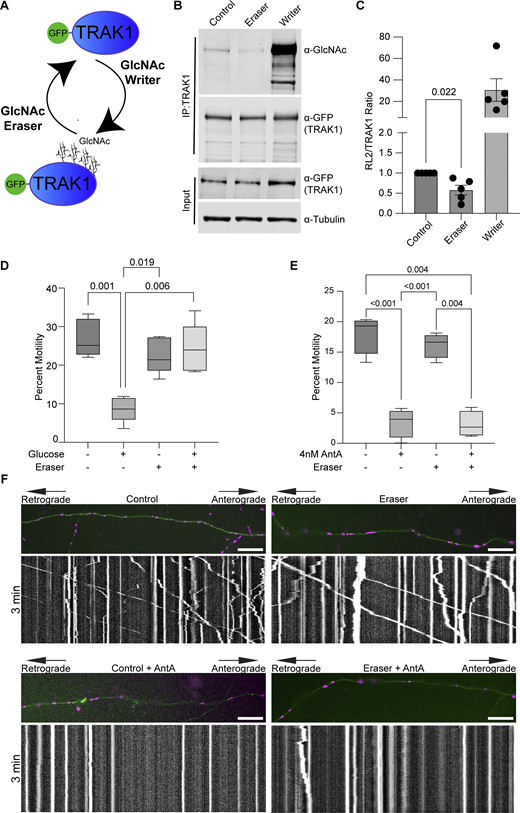
We previously described a mechanism by which mitochondria associated with and anchored to actin. This association was triggered by increasing O-GlcNAc transferase (OGT)–mediated GlcNAcylation of TRAK1 (Basu et al., 2021). To determine whether AntA employs the same mechanism, we used the writer/eraser system designed to tether either OGT or OGA (O-GlcNAcase) to a protein of interest (Ge et al., 2021; Ramirez et al., 2020). We co-expressed GFP-hTRAK1 with an empty vector control, a GFP nanobody coupled to OGT (O-GlcNAc writer), or a GFP nanobody coupled to OGA (the O-GlcNAc eraser) (Fig. 4 A) and asked whether the forced de-GlcNAcylation of TRAK1 prevented mitochondrial arrest by AntA. We first used HEK cells to test the efficacy of the OGT writer and OGA eraser constructs on co-expressed GFP-tagged hTRAK1. Upon immunoprecipitation (IP) of the TRAK1, the expected changes in the levels of O-GlcNAc moieties were observed (Fig. 4, B and C). Having confirmed the efficacy of the O-GlcNAc eraser for TRAK1 modification, we asked whether it could prevent the glucose-triggered arrest of neuronal mitochondria. As previously described (Pekkurnaz et al., 2014), we cultured hippocampal neurons in 5 mM glucose media until DIV13, at which point we added glucose to the culture to a final concentration of 25 mM for 3 h to induce GlcNAcylation of hTRAK1. Co-expression of the OGA eraser eliminated the OGT-triggered mitochondrial arrest (Fig. 4 D). In contrast, the OGA eraser did not rescue mitochondrial motility in AntA-treated cultures (Fig. 4, E and F), indicating that AntA acted through a different pathway. OGT drives actin association with mitochondria by recruiting the actin-binding protein FHL2 to TRAK1 (Basu et al., 2021). In response to AntA, however, no enrichment of FHL2 on mitochondria was observed (Fig. S4, A and B) and depleting Fhl2 in hippocampal neurons failed to rescue the AntA-induced mitochondrial arrest (Fig. S4 C). Mitochondrial depolarization by CCCP can cause actin association via the atypical myosin motor, MYO6 (Kruppa et al., 2018), but MYO6 colocalization with fibroblast mitochondria was not increased by 40 nM AntA (Fig. S4, D and E). Thus, neither GlcNAcylation of hTRAK1 nor recruitment of FHL2 or MYO6 appears responsible for arrest by 4 nM AntA. Furthermore, actin accumulated on mitochondria in PINK1 knockout fibroblasts in response to 40 nM AntA, confirming our findings (Fig. S2) that the arrest does not involve the PINK1/Parkin pathway (Fig. S4 F).
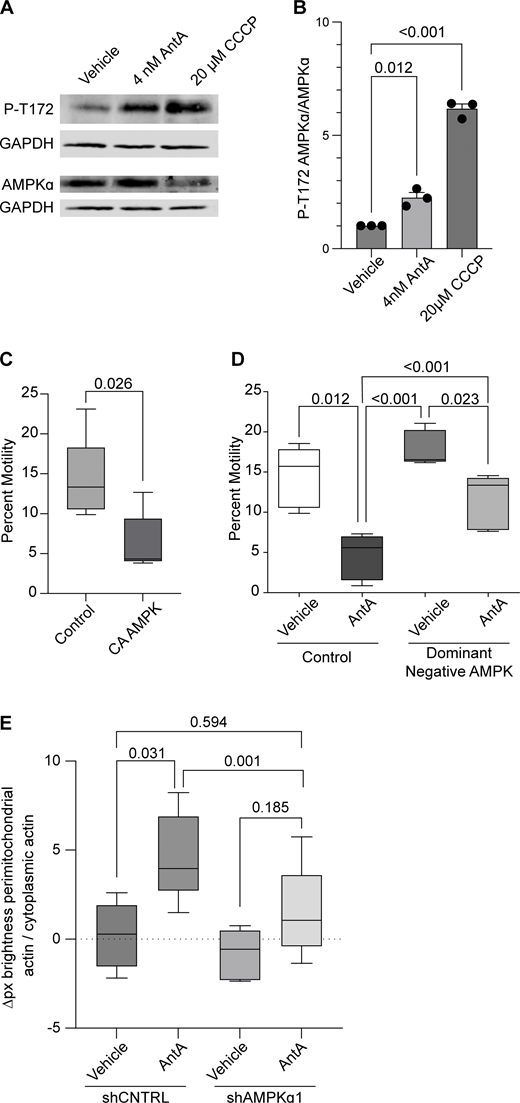
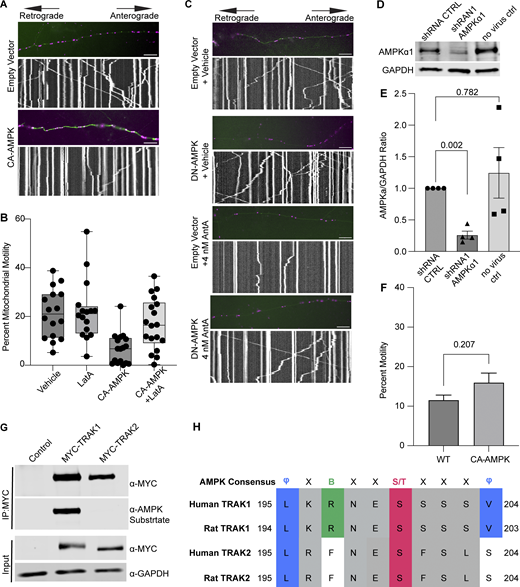
Having excluded several previously described mitochondrial arrest mechanisms, we examined other potential means. Previous reports showing that mitochondria require their own ATP supply to remain motile suggested that AntA may arrest mitochondria by depleting ATP (Zala et al., 2013). At the concentrations used here, however, AntA did not decrease the movement of other organelles (Fig. S1); this mild ETC inhibition, though it altered the ATP/ADP ratio, cannot have caused neuronal ATP levels to fall below those necessary for motors to function. Similarly, if ATP depletion per se were responsible, LatA depletion of F-actin would not prevent the arrest. Inhibiting respiration or glycolysis, by shifting the ratio of ATP to AMP, can activate AMPK (Trefts and Shaw, 2021). This heterotrimeric kinase complex is expressed in neurons and can be directly activated by AMP, among other pathways (Lee et al., 2022; Tilokani et al., 2022; Toyama et al., 2016; Williams et al., 2011; Muraleedharan and Dasgupta, 2022; Lewis et al., 2018). Indeed, autophosphorylation at threonine 172 indicated that the kinase was activated in hippocampal cultures by 4 nM AntA within 1 h (Fig. 5, A and B). We therefore expressed in hippocampal neurons either a constitutively active form of the kinase (CA-AMPK) or a dominant negative form (DN-AMPK) (Egan et al., 2011; Mu et al., 2001). The overexpression of CA-AMPK decreased the fraction of moving neuronal mitochondria, mimicking the effect of AntA (Fig. 5 C and Fig. S5 A). The CA-AMPK–induced arrest could largely be rescued with LatA treatment (Fig. S5 B), and DN-AMPK largely prevented the mitochondrial arrest caused by AntA (Fig. 5 D and Fig. S5 C). Similarly, the actin associations required for the arrest in fibroblasts were largely eliminated by a shRNA targeting one of the catalytic subunits of AMPK (Fig. 5 E; and Fig. S5, D and E). Thus, AMPK activation is sufficient to arrest mitochondria and is necessary for the AntA-triggered, actin-mediated arrest. The AMPK-elicited mitochondrial arrest is most likely specific to mitochondria as Rab5 endosome movement was not inhibited by short AntA treatment or CA-AMPK expression (Fig. S1, A and B; and Fig. S5 F).
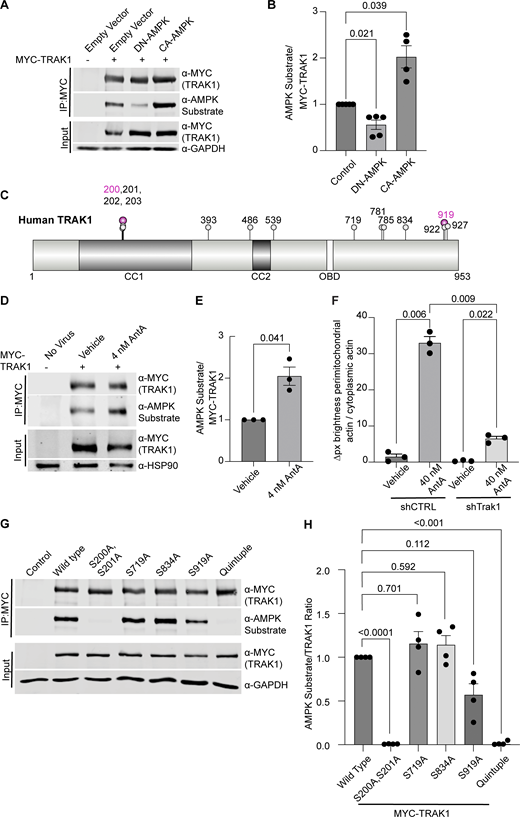
To determine whether AMPK might regulate the motor/adaptor complex itself, we queried the ScanSite database for AMPK target consensus sites in the two human paralogs of each core component: Miro1/2 and TRAK1/2 (Obenauer et al., 2003). Multiple potential AMPK phosphorylation sites were predicted in TRAK1, and a single potential site was identified in TRAK2. We expressed myc-tagged TRAK1 in HEK293T cells either alone or together with CA-AMPK or DN-AMPK, immunoprecipitated the myc-tagged protein, and assessed its phosphorylation state with an antibody selective for the phosphorylated AMPK substrate motif (D’Amico et al., 2015; Wang et al., 2018; Zhang et al., 2016; Noren Hooten et al., 2016). Myc-TRAK1 was immunopositive for this phosphorylation in control conditions; the phosphorylation was decreased by the expression of DN-AMPK and increased by CA-AMPK (Fig. 6, A and B). We pursued the phosphorylation of TRAK1 by mass spectrometry of myc-TRAK1 immunoprecipitated from cells co-expressing CA-AMPK or DN-AMPK. Phosphopeptides were detected for each of the sites that had been predicted by ScanSite (Fig. 6 C). Importantly, when cortical neuron cultures were treated with 4 nM AntA, MYC-TRAK1 expressed from the human synapsin promoter became more immunopositive for the AMPK substrate motif (Fig. 6, D and E). If the modification of TRAK1 was essential for the AntA-induced, actin-dependent arrest of mitochondria, we reasoned that TRAK1 should be required for the accumulation of actin around mitochondria. As predicted, knockdown of TRAK1 by shRNA greatly reduced the formation of perimitochondrial actin (Fig. 6 F). Site-directed mutagenesis of five putative AMPK consensus sites eliminated the TRAK1 phosphorylation detected by the antibody against AMPK phosphosubstrates, and the vast majority of the signal was eliminated when only two sites, S200 and S201, were mutated to alanine (Fig. 6, G and H). The S200 and S201 consensus sites are not conserved in TRAK2, and myc-TRAK2 was not immunopositive for the AMPK phosphorylation site after expression with CA-AMPK (Fig. S5, G and H). TRAK1 has a putative AMPK phosphorylation site at S919, and the AMPK phosphosubstrate signal was marginally decreased by the S919A mutation. This site may also be phosphorylated by AMPK. Although TRAK2 has a predicted AMPK site at the equivalent position in its C terminus, TRAK2 was not immunopositive for the AMPK phosphosubstrate antibody. Thus, S200 and S201 are likely the primary AMPK phosphorylation sites of TRAK1.
We next asked whether the AMPK S200/S201 phosphorylation sites of TRAK1 altered mitochondrial movement after ETC inhibition. The expression of TRAK1 S200A/S201A alone did not significantly alter the mitochondrial movement in comparison with overexpression of wild-type TRAK1. However, after a 2-h treatment with 4 nM AntA, the overexpression of TRAK1 S200A/S201A completely eliminated the decrease in mitochondrial movement observed after the same treatment of neurons expressing wild-type TRAK1 (Fig. 7, A and B). As an alternative means of activating AMPK, we acutely inhibited glycolysis by replacing glucose with 2-deoxyglucose in the neuronal culture media, which caused the expected decrease in mitochondrial movement. This inhibition of motility was diminished by the overexpression of TRAK1 S200A/S201A, but not wild-type TRAK (Fig. 7 C).
Discussion
Our experiments indicate that changes in the energetic state of a cell, as reflected by the ATP:AMP ratio, can feed back to regulate the movement of mitochondria, a major site of ATP production. Our findings support a model in which activation of AMPK causes the phosphorylation of the motor/adaptor protein TRAK1, which results in a change to the actin cytoskeleton that immobilizes mitochondria and may help position mitochondria at places where the ATP:AMP ratio is low. Evidence that this regulation is mediated by AMPK includes the following: (1) AMPK was activated by ETC inhibition as monitored by its phosphorylation state (Fig. 5, A and B); (2) CA-AMPK mimicked the effect of ETC inhibition (Fig. 5 C); (3) DN-AMPK prevented the arrest caused by ETC inhibition (Fig. 5 D); and (4) shRNA against AMPKa1 prevented the association of mitochondria with filamentous actin (Fig. 5 E), which is essential for the arrest (Fig. 2, F and G; and Fig. 3); (5) AMPK causes TRAK1 phosphorylation at two residues (S200 and S201) (Fig. 6); (6) shRNA against TRAK1 decreases the recruitment of actin to mitochondria in response to ETC inhibition (Fig. 6 F); and (7) mutation of the AMPK phosphorylation sites in TRAK1 prevents ETC inhibition from arresting mitochondrial motility (Fig. 7). Though the phosphorylation sites fit the consensus for AMPK targets, it remains possible that AMPK activates an intermediary kinase. The requirement for filamentous actin in this metabolic control of mitochondrial motility was shown by the ability of LatA to prevent the effect (Fig. 2) and the induction of actin filaments in the vicinity of mitochondria upon ETC inhibition (Fig. 3).
Metabolites, though often treated simply as substrates for cellular reactions, can also function as potent signaling molecules (Baker and Rutter, 2023; Chouchani, 2022). Activation of AMPK in response to energy stress is one of the best-characterized examples of such regulation. Axons, like all cells, contain many ATPases, including Na+/K+-ATPases, motor proteins, and actin itself. When mitochondrial production of ATP is impaired, these ATPases continue to generate ADP and AMP. When ATP consumption exceeds ATP resynthesis, AMP levels rise, and AMP binds to the gamma subunit of AMPK (Yeh et al., 1980). Activation of AMPK preserves energy homeostasis by enhancing pathways involved in energy conservation and inhibiting those that consume energy (Hardie, 2014; Auciello et al., 2014). AMPK activation inhibits growth-promoting pathways, upregulates autophagy, alters mitochondrial fission–fusion dynamics and flux through the TCA cycle, and activates mitochondrial biogenesis (Toyama et al., 2016; Egan et al., 2011; Malik et al., 2023; Di Nardo et al., 2014). The ATP:AMP ratio can vary greatly, even over short intracellular distances, allowing cells to optimize energy production where it is needed. One notable example of this is AMPK’s role in controlling mitochondrial localization to the leading edge of migrating cells (Cunniff et al., 2016), and TRAK1 phosphorylation by AMPK might contribute to this localization. Neurons are particularly sensitive to defects in energy distribution due to their large size, dynamic energy demands, and inability to store cellular fuels such as glycogen. Arresting mitochondria where ATP consumption is high, such as at synapses, can be a mechanism to match energy supply and demand.
Mitochondria also have many cellular functions outside of ATP production, which are reflected in the growing number of signaling pathways that control mitochondrial distribution. Through a related pathway, the GlcNAcylation of TRAK1 by OGT, mitochondria can be arrested when they encounter high glucose conditions (Pekkurnaz et al., 2014; Basu et al., 2021). Thus, both need for mitochondria’s output (ATP) and abundance of fuel such as glucose can have the similar effect of locally capturing mitochondria, and both achieve this in an actin-dependent manner that involves the posttranslational modification of TRAK (Basu et al., 2021; Pekkurnaz et al., 2014). These signals may operate at different time courses. A rise in AMP acts rapidly and is rapidly reversed if proper ATP synthesis is restored. A rise in glucose and the consequent change in TRAK1 GlcNAcylation may operate at a slower timescale. Perhaps this represents an acute need to correct inadequate ATP synthesis versus a chronic advantage to placing mitochondria where they can be most efficient. Other regulators of mitochondrial movement, and by extension position, include exposure to reactive oxygen species, increases in cytosolic calcium levels, and cell cycle progression (Chung et al., 2016; Debattisti et al., 2017; Wang and Schwarz, 2009). These pathways all impinge on the proteins of the motor/adaptor complex, making it a nexus for controlling mitochondrial positioning.
Several of these pathways act via TRAK1 and its paralog TRAK2, both of which are widely expressed. AMPK phosphorylation, however, was only readily detected on TRAK1 (Fig. S5 G). It is possible that TRAK2 is also an AMPK substrate whose phosphorylation sites are not recognized by the phosphosubstrate antibody (either at sites equivalent to S200 or S919). Nevertheless, because knockdown of TRAK1 (Fig. 6 F) greatly decreased the AntA-induced perimitochondrial actin, TRAK1 is the primary target to link actin to mitochondria during energetic stress in these cells. Few functional differences between these paralogs have been reported, but it has been proposed that TRAK1 preferentially localizes to axons and TRAK2 to dendrites due to differential affinities for kinesin versus dynein motors. This difference may arise from a conformational change in TRAK2 (not found in TRAK1) that prevents it from interacting with kinesin motors (van Spronsen et al., 2013). A similar mechanism was proposed for the Drosophila homolog Milton, whose splice isoforms differ in their interaction with kinesin (Glater et al., 2006). Studying how TRAK1 and TRAK2 differ in their regulation may provide insight into how mitochondria fulfill specialized functions in axons and dendrites.
TRAK1 is not the only mitochondrial substrate of AMPK; others regulate fission, local translation, the TCA cycle, mitophagy, and mitochondrial metabolism (Trefts and Shaw, 2021; Herzig and Shaw, 2018). Yet, little is known about how AMPK signaling is activated by different stimuli, particularly on mitochondria. Intriguingly, there appear to be distinct pools of AMPK subunits that preferentially localize to the mitochondrial outer membrane, raising the question of whether mitochondrial AMPK is selectively activated upon ETC inhibition or whether this also activates cytoplasmic and lysosomal AMPK-localized complexes (Schmitt et al., 2021, Preprint). Evaluating how different types of energy stress affect these targets may provide insight into how AMPK rewires metabolism. Because much work on AMPK has been conducted in cell lines, it may be particularly illuminating to find additional substrates in neurons where energy regulation is so critical.
AMP may not be the only signal activating AMPK when the ETC is inhibited. In neurons and other cells, increases in Ca2+ can activate CamKKβ, an upstream-activating kinase of AMPK. Supporting this hypothesis, synaptic activity has been shown to activate AMPK in neurons and arrest mitochondria at synapses (Li et al., 2020). Mild inhibition of the ETC might impair mitochondrial Ca2+ buffering and cause local Ca2+ increases that activate CamKKβ. Further work will need to evaluate the potential AMPK-activating role of Ca2+ and other potential signals after mild mitochondrial ETC inhibition.
Here, we find that mitochondria become anchored on the actin cytoskeleton in response to mild ETC inhibition; if we prevent the polymerization of actin with latrunculin, the arrest is prevented. Moreover, as observed in fibroblasts, each mitochondrion becomes tightly associated with one or more actin filaments (Fig. 3). Similar but exceptionally transient actin–mitochondrion associations have been reported to occur during the cell cycle and upon mitochondrial depolarization in nonneuronal cells (Fung et al., 2019, 2022; Li et al., 2015; Chakrabarti et al., 2022; Kruppa et al., 2018; Moore et al., 2016). We were unable to see whether ETC inhibition triggers a comparable enrichment of actin on axonal mitochondria due to the high density of actin in axons. Indeed, because actin filaments are already likely to be near most mitochondria in the close confines of the axon, it may suffice simply to attach them to those preexisting filaments.
What links actin to the outer membrane of ETC-inhibited mitochondria? ETC-inhibited mitochondria apparently are anchored independently of the actin-binding protein Fhl2 (Fig. S4, A–C) (Pekkurnaz et al., 2014; Basu et al., 2021). Formins such as INF2 or SPIRE1 are likely candidates that may activate local actin polymerization on mitochondria (Calabrese et al., 2022; Manor et al., 2015; Korobova et al., 2013). It is also tempting to speculate that in cases where damage to mitochondria compromises the ETC, actin recruitment may function to quarantine mitochondria and prevent them from fusing with their healthy counterparts. Actin filaments may also slow the process of mitophagy and allow time for ATP synthesis to be restored. Our data support a model in which actin filaments form an early response to mitochondrial malfunction, preceding mitochondrial depolarization, activation of PINK1, and recruitment of pro-mitophagy factors such as Parkin and MYO6. As has previously been proposed, mitochondrion–actin associations may also regulate the balance between oxidative phosphorylation and glycolysis to maintain ATP levels (Fung et al., 2019; Fung et al., 2022; Chakrabarti et al., 2022). In the case of neuronal stimulation, when ATP levels are low due to electrical activity, this arrest mechanism may help position mitochondria at active synapses. This arrest mechanism most likely promotes efficient ATP use and distribution and thereby supports the healthy function and survival of cells.
Materials and methods
Cell culture
Rat embryonic neurons: E18 hippocampal and cortical neurons were isolated from Long Evans rats as previously described (Nie and Sahin, 2012). Neurons were plated at a density of 5–7 × 10^4 cells/cm2. Neurons used for imaging were plated on 20 µg/ml polylysine and 4 µg/ml laminin (PDL)-coated 24-well or 35-mM glass-bottom dishes (P24-1.5H-N and D35-20-1.5-N, respectively; Cellvis). Neurons used for IPs or whole-cell lysates were plated on PDL-coated tissue culture-treated 10-cm or 6-well dishes. All cultures were grown in Neurobasal plus media (A3582901; Thermo Fisher Scientific) supplemented with L-glutamine and penicillin–streptomycin (10378-016; Thermo Fisher Scientific) and B27 supplement (17504044; Thermo Fisher Scientific) unless otherwise noted.
HEK293T/17 cells (CRL-11268; ATC) were cultured in DMEM (10566-016; Thermo Fisher Scientific) supplemented with penicillin–streptomycin (P4333; Thermo Fisher Scientific) and 10% FBS (S11150H; Atlanta Biologicals). HEK293T/17 cell stocks obtained from the ATCC were expanded and tested for Mycoplasma (on 6/25/2019) before use.
Rat embryonic fibroblasts: Fibroblasts were harvested from E18 Long Evans rat embryos (Charles River Laboratories) as previously described for mouse embryonic fibroblasts (Durkin et al., 2013). Cells were cultured in DMEM with standard supplements unless stated in the figure legend (see HEK293T/17 cell culture).
Procedures involving the use of animals followed NIH guidelines and were approved by the Institutional Animal Care and Use Committee at Boston Children’s Hospital (animal protocol numbers 00002228 and 00002539). Care was taken to minimize the number of animals used, as well as pain and suffering of the animals required for these procedures.
Low-glucose and galactose cultures
Low-glucose neuron cultures were grown in standard Neurobasal plus culture media (see cell culture methods). On DIV5, Neurobasal plus media were exchanged for low-glucose neuronal media (Neurobasal A without glucose or pyruvate) (A2477501; Thermo Fisher Scientific) supplemented with 1X glutamine and penicillin–streptomycin (10378-016; Thermo Fisher Scientific), 1.2 mM sodium pyruvate (P8574; Sigma-Aldrich) 1 mM sodium L-lactate (71718; Sigma-Aldrich), 5 mM dextrose (G8270; Sigma-Aldrich), and 1X B27 supplement (17504044; Thermo Fisher Scientific). Neuronal cultures were fed daily (50% medium change) until DIV12, when motility experiments were performed.
Fibroblasts were seeded into 35-mm glass-bottom dishes at a density of 20,000–40,000 cells per dish in DMEM (see HEK293T/17 cell culture). The day after seeding, standard DMEM were fully exchanged for galactose media (glucose-free DMEM [1443001; Thermo Fisher Scientific], 10 mM galactose [G5388-100G; MilliporeSigma], 10% FBS, 2 mM GlutaMAX, 1 mM sodium pyruvate [P8574-5G; Sigma-Aldrich], and penicillin–streptomycin [P4333; Thermo Fisher Scientific]). Galactose media were fully exchanged each day, and experiments were performed after 2 days of growth in these media.
Antibodies and reagents
Antibodies are listed in Table S3 and can be identified by their research resource IDs (RRIDs). All other reagents, such as plasmids and chemicals, are also listed, along with their source/vendor and catalog number, or, where appropriate, reference.
Plasmid constructs
Table S1 along with Table S3 lists all primers and plasmids used in this study, as well as their respective sources. Apart from fluorescently tagged Sigma-Aldrich Mission shRNAs (available from Sigma-Aldrich), all plasmids created for this manuscript will be available on Addgene (https://www.addgene.org/Thomas_Schwarz/) or by request from the Schwarz lab. Details on the construction of plasmids made for this manuscript are listed below. All PCRs were performed with Q5 High Fidelity Master Mix; ligations were done with T4 ligase per the manufacturer’s protocol (M0202S; New England Biolabs), and ligation reactions were transformed into XL10-Gold Escherichia coli according to Mix and Go Competent Cell Kit (T3002; Zymo Research). Gibson assembly reactions were performed per manufacturer’s protocol (E2611L; New England Biolabs). Site-directed mutagenesis was performed with Q5 Site-Directed Mutagenesis Kit (E0552S; New England Biolabs). Clones were validated with Plasmidsaurus by whole-plasmid sequencing (https://www.plasmidsaurus.com).
Published and purchased constructs
The following plasmids were previously published or were received as gifts: hTRAK2 (Davis et al., 2022; JF345), MYC-hTRAK1 (Pekkurnaz et al., 2014; JF190), HA-Kif5b-MD-FRB (Kapitein et al., 2010; JF184), nGFP-OGT-4 (Ramirez et al., 2020; JF426), (294) pcdna3.1-myc-OGA(1–400) (Ge et al., 2021; JF423), (369) pcdna3.1-HA-nLaGG-OGA-(544–706) (nGFP-C3) (Ge et al., 2021; JF425), MYC-Miro1 (Fransson et al., 2006; JF151), and PINK1-D110-YFP-FKBP (Lazarou et al., 2012; JF6). pLVX-CAG-MCS-IRES-mCherry was a gift from Matthew J. Lavoie (Brigham and Women’s Hospital, Boston, MA) (JF250), and pTomm20-mCherry-FKBP was a gift from Takanari Inoue (Johns Hopkins School of Medicine, Baltimore, MD) (JF41).
The following plasmids were obtained from Addgene: pMD2.G (CAT#12259; JF440), psPAX2 (CAT#12260; JF439), pAMPK alpha2 K45R (CAT#15992; JF451), CMV-PercevalHR (CAT#163061; JF639), pCherry-FRB (CAT#25920; JF196), pEBG-AMPK α1(1–312) (CAT#27632; JF450), FUGW-PercevalHR (CAT#49083; JF629), mEmerald-Rab5a-7(CAT#54243; JF124), mEGFP-N1 (CAT#54767; JF31), AmCyan-P2A-mCherry (CAT#45350; JF75), mRaspberry-Mito-7(CAT#55931; JF46), pEGFP-C1 F-tractin-EGFP (CAT#58473; JF258), pbetaActin-HALO-GFP-preActA (pERB254) (CAT#67762; JF11), paGFP-OMP25 (CAT#69598; JF19), pLV-EF1a-IRES-Hygro (CAT#85134; JF276), pLV-hSYN-RFP (CAT#22909; JF252), and dsRED2-Mito-7 (CAT#55838; JF262), piRFP702-N1 (CAT#45456; JF105), dsRED2-N1 (CAT#54493; JF30), pERB254 pbetaActin-HALO-GFP-preActA (CAT#67762; JF11), and meGFP-C1 (CAT# 54759; JF154).
pExpress-MYO6 was obtained from transOMIC (CAT# BC146764; JF155).
Cloned constructs used for experiments
All primers and plasmids are listed in Tables S1 and S3. Plasmids for RNAi were obtained from Sigma-Aldrich, and the puromycin resistance cassettes were replaced with iRFP to generate shRNA AMPKa1 NLS-iRFP (JF587) and control shRNA2 NLS-iRFP (JF585). iRFP702 was amplified from plasmid JF105 with primers 551 and 738 (which also encoded the nuclear localization sequence, i.e., NLS). This PCR product and the shRNA vector backbone were digested with MluI-HF and BamHI-HF, and the products were ligated at a 3:1 ratio. A similar cloning strategy was taken to mark the TRAK1 shRNA (JF684) and control shRNA1 NLS-iRFP (JF306) with NLS-iRFP. NLS-iRFP was amplified from JF105 using primers 551 and 546 and cloned into the BamHI-HF and Kpn1-HF sites of the purchased shRNA vectors. 2X-FKBP-meGFP-OMP25 mts (JF188) was constructed as follows: FKBP was PCR-amplified from plasmid JF6 with primers 475 and 476. Plasmid JF61 and the FKBP PCR product were digested with AscI and Age1 and ligated at a 3:1 insert-to-vector ratio. To construct pLVX-CAG-mito-dsRED2 (JF264), mito-dsRED was amplified from JF262 with primers 519 and 518. This PCR product and JF250 were digested with BsrGI-HF and Not1-HF and ligated at a 3:1 ratio. To make iRFP-Trim46 (JF292), iRFP702 was amplified from JF105 with primers 552 and 553. This PCR and JF236 were digested overnight with MauBI and EcoRI-HF in the fast digest buffer from Thermo Fisher Scientific. Products were ligated at a 3:1 ratio. To make GFP-hTRAK1(JF474), JF154 was digested with BamHI-HF and EcoRI-HF. hTRAK1 was PCR-amplified from JF190 with primers 639 and 640 and digested with the same enzymes. The digested products were ligated at a 3:1 ratio. pLVX-EF1a-mito-mRaspberry (JF536) was made by PCR-amplifying mito-mRaspberry from plasmid JF46 with primers 705 and 706. Plasmid JF277 and the mito-mRaspberry PCR product were digested with NotI-HF and BsrGI-HF and ligated at a 3:1 insert-to-vector ratio. pLVX-CAG-F-tractin-GFP (JF529) was made by amplifying F-tractin-EGFP from plasmid JF258 using primers 696 and 695. Plasmid JF264 and the F-tractin-EGFP PCR product were digested with MluI-HF and BamHI-HF and ligated at a 3:1 insert-to-vector ratio. pLVX-CAG-meGFP-Myo6 (JF619) was made by amplifying meGFP-Myo6 from plasmid JF576 using primers 743 and 744. Plasmid JF580 and the meGFP-Myo6 PCR product were digested with SpeI-HF and MauBI and ligated at a 3:1 insert-to-vector ratio. pLVX-CAG-Fhl2-HA-P2A-mitomeGFP (JF626) was made by amplifying Fhl2-HA-P2A-mitomeGFP from plasmid JF570 using primers 741 and 742. Plasmid JF580 and the meGFP-Myo6 PCR product were digested with SpeI-HF and MluI and ligated at a 3:1 insert-to-vector ratio. pLVX-hSYN-MYC-Miro1 (JF525) was made by amplifying MYC-Miro1 from plasmid JF151 using primers 688 and 689. Plasmid JF276 and the MYC-Miro1 PCR product were digested with MluI-HF and EcoRI-HF and ligated at a 3:1 insert-to-vector ratio.
Site-directed mutagenesis was performed to make the TRAK1 phosphomutants. MYC-hTRAK1(S919A) (JF543) was made with JF190 as a template using primers 716 and 717. Likewise, MYC-hTRAK1(S719A) (JF557) was created by site-directed mutagenesis using plasmid JF190 and primers 723 and 724, MYC-hTRAK1(S200A, S201A) (JF559) using plasmid JF190 and primers 725 and 726, MYC-hTRAK1(T834A) (JF571) using plasmid JF190 and primers 732 and 733, and MYC-hTRAK1(S200A, S201A, S719A, T834A, S919A) (JF579) using plasmid JF565 with primers 732 and 733.
Cloned constructs used as cloning intermediates/templates
pLVX-hSYN-mito-dsRED2 (JF276) was made by amplifying hSYN from JF252 using primers 530 and 531. The resulting PCR product and plasmid JF264 were digested with SpeI-HF and ClaI and then ligated at a 3:1 ratio. pLVX-EF1a-mito-dsRED2 (JF277) was made by amplifying the EF1a promoter from JF276 with primers 532 and 533. The PCR product and plasmid JF264 were digested with SpeI-HF and ClaI. Products were ligated at a 3:1 ratio. pLVX-CAG-mito-dsRED2 (JF264) was made by amplifying mito-dsRED from JF262 with primers 519 and 518. The resulting PCR product and JF250 were digested with BsrGI-HF and NotI-HF and cloned with T4 ligase at a 3:1 ratio. GFP-HALO-OMP25 (JF20) was made by amplifying the OMP25 mitochondrial targeting sequence from JF19 with primers 61 and 63. The vector plasmid JF11 and OMP25 insert were digested with EcoRI-HF and NotI-HF and ligated at a 1:1 ratio. To make pchBA-meGFP-HALO-OMP25(MTS) (JF61), Halo-meGFP was amplified out of JF51 with primers 218 and 217. Plasmid JF20 and the PCR product were digested with BsrGI and AscI and ligated at a 3:1 ratio. pLVX-CAG-MCS (JF580) was made by digesting plasmid JF264 and a gene fragment harboring a multiple cloning site (see primer table for sequence) with NotI-HF and MluI-HF. Products were ligated at a 3:1 ratio. hTRAK1(S200A, S201A, S719A, S919A) (JF565) was made by performing site-directed mutagenesis on plasmid JF560 using primers 725 and 726. hTRAK1(S719A, S919A) (JF560) was made by performing site-directed mutagenesis on plasmid JF560 using primers 725 and 726. pCMV-meGFP-Myo6 (JF576) was made by amplifying human Myo6 (GenBank: BC146764.1) from JF155 (pExpress-MYO6; transOMIC) using primers 731 and 728. Plasmid JF154 and the Myo6 PCR product were digested with EcoRI-HF and PspoMI and ligated at a 3:1 insert-to-vector ratio. To make TOMM20(MTS)-HaloTag-mEGFP (JF51), TOMM20(MTS)-HALO was amplified from JF47 using template primers 197 and 198. Plasmid JF31 and the PCR product were digested with HindIII-HF and BamHI-HF. Digest products were ligated at a 3:1 ratio. To make pCMV-TOMM20(MTS)-Halo-dsRED2 (JF47), JF39 was digested with EcoRI and BglII. The insert (TOMM20) was amplified from plasmid JF41 using primers 162 and 163. The products were ligated at a 3:1 ratio. pCMV-HALO-dsRED2-N1 (JF39) was made by amplifying the HALO tag from JF11 with primers 127 and 129. The PCR product and vector JF30 were digested with BamHI and EcoRI and ligated at a 1:1 ratio. pCMV-MCS-P2A-mCherry-N1(JF128) was made by amplifying P2A-mCherry from JF75 with primers 371 and 370. Plasmid JF31 and the P2A-mCherry product were digested with BAMHI-HF and NotI-HF and ligated at a 1:1 ratio. Fhl2-HA-P2A-meGFP(omp25 mts) (JF570) was made by PCR-amplifying Fhl2-HA-P2A from plasmid JF349 using primers 729 and 730. Plasmid JF146 and the Fhl2-HA-P2A PCR product were digested with BglII and PsPOMI and ligated at a 3:1 insert-to-vector ratio. To create pCMV-MCS-P2A-meGFP(omp25 mts) (JF146), JF128 was linearized by PCR with primers 415 and 418 (eliminating P2A-mCherry present in the parental vector). meGFP(omp25 mts) was amplified using primers 416 and 417 from JF61, and the products were assembled in a Gibson assembly reaction.
Transfections and transductions
Neuron cultures were transfected on DIV5–9 with Lipofectamine 2000 as previously described (11668-019; Thermo Fisher Scientific) (Basu et al., 2021). Briefly, cells were gently washed three times with Neurobasal plus media lacking B27 (i.e., plain Neurobasal, A3582901; Thermo Fisher Scientific). A mix of endotoxin-free plasmid DNA, Lipofectamine 2000, and Neurobasal was added to the washed cells and incubated at 37°C. Cells were again washed twice with plain Neurobasal plus media and then cultured in standard neuron culture media at 37°C unless otherwise noted. Neuronal lentiviral transductions were done on DIV2–5 to minimize transduction of other cell types in the cultures. Lentivirus was thawed on ice and then added directly to the culture media, and the cells were returned to the incubator. The virus was washed off one to 2 days after transduction.
Transductions in fibroblasts were performed 1 day after plating, and the virus was washed off the following day.
Transfections in HEK293T cells were done at 70–95% confluence; HEK293T/17 cells were transfected with the desired plasmid constructs using PEI MAX (24765-100; Polysciences) or calcium phosphate (Kingston et al., 2003). One day after transfection, cells were washed and used for experiments one to 2 days later.
Lentivirus production
HEK293T/17 cells (CRL-11268; ATC) were plated in 10-cm dishes and grown in standard DMEM (see Cell culture methods) until 95% confluent. Second-generation lentiviral packaging constructs were used in combination with various lentiviral transfer plasmids (listed in the Reagent Table) to make the desired virus. Viral packaging and transfer constructs were transfected into HEK293T/17 cells with PEI max (24765-100; Polysciences), and the mix was removed the following day. Virus was produced in these cells for 2 days, after which the supernatant was filtered through a 0.45-µm filter (97066-206; VWR), aliquoted and stored at −80, or concentrated to approximately ∼500×. To concentrate the virus, filtered viral supernatants were pelleted for 2 h at 50,000 × g in a Beckman Coulter Ultracentrifuge using an SW32Ti swinging bucket rotor, resuspended in phosphate-buffered saline, and snap-frozen in liquid nitrogen.
Live-cell imaging
Motility analysis
All organelle movement experiments were performed on a widefield Nikon Ti Eclipse inverted microscope illuminated with SOLA LED light Engine (Lumencore) using a 63×, NA 1.4 Plan Apo objective (Nikon). Images were taken with a Zyla 5.5 sCMOS camera (Andor). Imaging was performed at 37°C in a humidified chamber supplied with a 5% CO2/air mix regulated by a Tokai Hit environmental chamber.
Imaging movement of mitochondria and Rab5 endosomes in neurons
Live-cell imaging of axonal mitochondria and axonal rab5 vesicles was performed on the widefield Ti-Eclipse microscope described above. Images were acquired at 0.5-s intervals for 2–5 min. Distal neurites were defined as axons if they exceeded 1 mm in length. Distal axonal mitochondria or Rab5 vesicles were imaged 2–3 days after transfection, ∼200 µM away from the axon tip. Rab5 vesicles were imaged in Hibernate E media (BrainBits HELF500) supplemented with B27 and penicillin–streptomycin (P4333; Thermo Fisher Scientific). Mitochondria were imaged in standard Neurobasal culture media unless otherwise noted. Kymographs were generated in Fiji using the Kymolyzer image analysis code (Schindelin et al., 2012). The data represented in each graph show the average percent motility as previously described with the exception of Fig. S5 B in which individual the percent motility for individual axons is shown (Basu et al., 2020; Basu et al., 2021). Briefly, mitochondrial tracks in each kymograph were manually traced and then analyzed in Fiji using the previously published Kymolyzer plug-in. Percent time in motion was scored for each mitochondrial track and then averaged for all tracks in the image.
Axonal rapalog imaging was performed the day after transfection, and mitochondria were imaged within 60–120 µm on the cell body. Axons were identified using Trim46-iRFP to mark the axon initial segment (Van Beuningen et al., 2015). Rapalog was added at a 1:500 dilution (10 µM) 3–6 min before imaging. Kymographs were generated and analyzed as described above.
Imaging mitochondrial and lysosomal movement in fibroblasts
Rat embryonic fibroblasts were used to image the movement of both mitochondria and lysosomes. Mitochondria were imaged on the widefield Ti-Eclipse microscope described above, and images were acquired at 0.5-s intervals for 3 min. Image analysis was performed using QuoVadoPro, which has been previously described in detail (Basu and Schwarz, 2020). Lysosomal motility was also imaged on the same widefield microscope, and these organelles were visualized by treating cells with 50 nM LysoTracker Red DND-99 for 30 min (Invitrogen, L7528). Image analysis was performed using TrackMate 7, a previously described Fiji plug-in (Ershov et al., 2022).
Perimitochondrial actin imaging and quantification
Live-cell confocal actin imaging was done on either a Nikon Ti inverted microscope equipped with 405-, 488-, 561-, and 640-nm laser lines (Spinster) or one with 405-, 445-, 488-, 515-, 561-, and 640-nm laser lines (Garfunkel). Both microscopes use a Yokogawa W1 spinning disk with a 50-µm pinhole and a Zyla 4.2 Plus sCMOS camera (Andor). Imaging was performed with 60×/NA 1.4 Plan Apo objective (Nikon) using Nikon Elements Acquisition Software AR 5.02. Cells were maintained at 37°C with 5% CO2 with an OKO-Lab environmental chamber. Analysis to quantify perimitochondrial actin was performed in ImageJ as previously described6. In brief, intensity of the actin signal was quantified using a mask based on the mitochondrial marker but enlarged slightly so as to include actin immediately adjacent to the mitochondrion.
Super-resolution images were acquired on a Zeiss LSM 980 confocal microscope using the SR mode of an Airyscan detector. Images consisting of a 12-slice z-stack were collected (voxel size: 186 × 186 pixels, total field of view: 7.92 × 7.92 µm, z-step: 170 nm) using a Plan Apo 63×/1.4 Oil objective. The Airyscan detector was set at an 8-bit depth; digital gain, 1; binning, 1 × 1; line averaging, 2; and unidirectional scanning, scan speed 8. Image data were analyzed in ImageJ using the BioFormats plug-in.
Mitochondrial membrane potential in neurons
As described above, neuronal cultures were grown on PDL-coated dishes in standard Neurobasal plus culture media. On the day of the experiment, cells were treated with drug or vehicle (as indicated in the figure legends), after which 100 nM TMRM (I34361; Thermo Fisher Scientific) was added according to the manufacturer’s protocol. 2 µM Hoechst (62249; Thermo Fisher Scientific) was also included in the same TMRM staining solution. Samples were imaged on the widefield Nikon Ti Eclipse microscope (as described above for neuronal motility analyses), and average field intensities were measured using one Z-section. Average TMRM intensities were normalized to the nuclear count per field (as measured by Hoechst staining).
Mitochondrial membrane potential in fibroblasts
Fibroblasts were cultivated in galactose media for 2 days, at which point cells were treated with 40 nM AntA or vehicle. Cells were stained with TMRM and Hoechst as described above in the protocol for neurons. Image acquisition was performed using a Nikon Ti Eclipse widefield microscope (as described above for neuronal motility analyses). Analysis was performed by measuring the mean field brightness in both TMRM and Hoechst channels. The TMRM signal was normalized to the average Hoechst signal.
PercevalHR
Ratiometric PercevalHR imaging in neuronal cell bodies was performed on the spinning disk Garfunkel (described in the section on live-cell actin imaging). Neurons were transduced with lentivirus harboring the PercevalHR sensor (Tantama et al., 2013) transduced on DIV2 and then imaged between DIV7–9. Ratiometric images were taken by acquiring Z-stacks with a Plan Apo 100× Oil objective and a Zyla 4.2 Plus sCMOS camera (Andor). Cells were illuminated with the 488 and 405 lasers, and emission spectra for both channels were collected using the 525/36 filter set. Seventeen Z-sections were taken for each field at 0.5 µm per section. A summed intensity projection was made for each image, and mean plate background intensities were calculated and subtracted from the PercevalHR signal in each channel. The ratio of the ATP (488) to ADP (405) summed cellular signal was then calculated. Imaging was performed in Hibernate E media (BrainBits HELF500) supplemented with B27, and cells were maintained at 37°C with an OKO-Lab environmental chamber. Imaging PercevalHR in fibroblasts was performed similarly after transduced cells had been cultured in galactose media for 2 days. Fibroblasts were imaged with a 20× objective and nine 1-µm sections and were maintained while imaging at 37°C with 5% CO2 with an OKO-Lab environmental chamber.
Imaging fixed cells
Neuronal phalloidin staining
Neurons were fixed for 5 min at room temperature in a formaldehyde solution (3.5% paraformaldehyde [15714; Electron microscopy science], 4% sucrose [S0389-1KG; Sigma-Aldrich] in 1X dPBS, pH 7.1 [i.e., dPBS, 14080055; Thermo Fisher Scientific]), and then immediately washed three times in dPBS. Cells were permeabilized for 15 min with 0.3% Triton X-100 (T8787-250ML; Sigma-Aldrich) dissolved in dPBS. The permeabilization buffer was then washed once with dPBS and then phalloidin buffer (1% BSA [wt/vol] dissolved in dPBS). The phalloidin buffer was washed off, and the sample was incubated for 30 min with AF488-conjugated phalloidin (sc-36379; Santa Cruz) dissolved in 1:1,000 in phalloidin buffer. Images were acquired on the widefield Nikon Ti Eclipse described for neuronal motility analyses. Imaging was done at 25°C.
Myo6
Lentiviruses expressing Myo6-meGFP and mRaspberry-Mito-7 were transduced into fibroblasts grown in standard DMEM, which was exchanged for galactose media upon the addition of the virus. The lentivirus was washed off after 1 day, and cells were treated with AntA or vehicle after 2 days in galactose media. Fibroblasts to be treated with CCCP were transduced and treated in standard DMEM. Three days after plating, drug-treated fibroblasts were fixed for 5 min in formaldehyde buffer (3.5% paraformaldehyde, 4% sucrose dissolved in 1X dPBS, pH 7.1) prewarmed to 37°C. The formaldehyde buffer was washed off with 1X dPBS, pH 7.1, at room temperature. Fixed cells were imaged on the spinning disk described above (Garfunkel). Imaging was done at 25°C.
Immunocytochemistry
Cells were fixed at 37°C for 5 min in prewarmed formaldehyde buffer (3.5% paraformaldehyde, 4% sucrose dissolved in 1X dPBS, pH 7.1). The formaldehyde solution was washed off with dPBS at room temperature, and cells were permeabilized for 15 min in 0.3% Triton X-100 (T8787-250ML; Sigma-Aldrich) diluted in dPBS. Samples were washed three times in dPBS and incubated at 4°C overnight in blocking buffer (5% BSA wt/vol dissolved in dPBS). For Fhl2-HA-P2A-mitomeGFP, a CoraLite Plus fluorescent secondary–coupled anti-HA primary antibody (CL647-66006; Proteintech) diluted 1:200 in antibody buffer was added to the samples for 2 h, after which samples were washed three times with dPBS and imaged. Fixed cells were imaged on the spinning disk described above (Garfunkel). Imaging was done at 25°C.
Immunoprecipitations
HEK293T/17 cell IPs: Two to 3 days after transfection, HEK293T/17 cells were washed once with PBS and then lysed on ice with 1.8 mL NP-40 lysis buffer (1% NP-40, 15 mM Tris-HCl, pH 7.5, 150 mM NaCl, 1 mM EDTA, pH 8.0, 1 mM dithiothreitol (DTT), 1 mM PMSF, and a protease inhibitor cocktail (11836170001; Roche)). Lysates were centrifuged at 13,000 × g in a tabletop centrifuge for 10 min at 4°C. Supernatants were collected, 50uL of which as boiled with SDS Laemmli buffer and used as input samples. The remaining supernatant was used for the IP.
For IP of MYC-TRAK2 and MYC-TRAK1 (wild-type and phosphomutants), 3 µg of anti-MYC (SC-40; Santa Cruz) was added to lysates for 1–2 h at 4°C with a rotator. Protein A Sepharose beads (45-000-143; Thermo Fisher Scientific) were added to each IP for 1–2 h, again at 4°C with rotation, after which beads were spun down and washed three times with NP-40 lysis buffer. After the third spin, the wash was removed, and the beads were boiled in Laemmli buffer for 3 min at 95°C. The IP samples were loaded onto an 8% acrylamide gel along with 40 μl of the input samples. The proteins were transferred to a 0.45-µm nitrocellulose membrane and incubated at 4°C overnight in blocking buffer (5% BSA [wt/vol] dissolved in TBS-T [Tris-buffered saline with 0.1% Tween-20]). Membranes were incubated overnight at 4°C in primary antibody and washed three times in TBS-T and then at room temperature for 1 h with fluorescent secondary antibodies (LI-COR). Blots were imaged on an Odyssey CLX imager and then quantified in Image Studio Lite (LI-COR).
For IPs to detect O-GlcNAc moieties on GFP-TRAK1, 50 mM GlcNAc (A8625-5G; Sigma-Aldrich) and 2 µM ThiametG (110165CBC; MilliporeSigma) were also added to the IP buffer described above. IPs were performed as described above except the primary antibody used to immunoprecipitate GFP-TRAK was 3 µg of anti-TRAK1 (HPA005853; Sigma-Aldrich).
IPs from neurons: 5 × 10^6 neurons were lysed in 1 ml of the abovementioned NP-40 lysis buffer on ice. Lysates were centrifuged at 13,000 × g in a tabletop centrifuge for 10 min at 4°C. Supernatants were collected, 50 μl of which was boiled with SDS Laemmli buffer and used as input samples. The remaining supernatant was used for the IP. MYC-TRAK1, expressed from the human synapsin promoter (hSYN1), was immunoprecipitated with 10 μl MYC-Trap magnetic agarose beads for 2 h at 4°C. IP samples were washed three times with NP-40 lysis buffer and boiled in 30 μl of 1X Laemmli buffer. IP samples were run out on a 6% acrylamide gel and blotted as described above but using anti-HSP90 (60318-1-Ig; Proteintech) as a loading control.
Western blotting
All cell types (neurons, fibroblasts, and HEKs) were lysed in NP-40 lysis buffer (see the Immunoprecipitations section for details) with the exception of the neuron lysates to detect ubiquitin and phospho-S65 ubiquitin, which were lysed as previously described (https://content.protocols.io/files/c39abixhp.pdf). SDS-PAGE was performed, and proteins were transferred and blocked as described above (see the Immunoprecipitations section). All blots were probed overnight at 4°C with the following antibody dilutions: rabbit anti-AMPK-α (1:1,000), rabbit anti-AMPK-α1 (1:1,000), rabbit anti-phospho-AMPK substrate motif (1:1,000), rabbit anti-phospho-AMPKα(T172) (1:1,000), rabbit anti-GAPDH (1:3,000), mouse anti-GAPDH (1:5,000), rabbit anti-GFP (1:1,000), mouse anti-HSP90 (1:5,000), mouse anti-MYC (9E10) (1:500), rabbit anti-phospho-ubiquitin (Ser65) (E2J6T) (1:1,000), mouse anti-O-linked N-acetylglucosamine (RL-2) (1:2,000), rabbit anti-tubulin (1:1,000), mouse anti-tubulin (DM1A) (1:2,000), mouse anti-vinculin (1:10,000), rabbit anti-vinculin (1:10,000), and mouse anti-ubiquitin (P4D1) (1:1,000). After the primary antibody incubation, blots were washed three times for 10 min in TBS-T and incubated for 1–2 h with the following LI-COR antibodies at a 1:5,000 dilution: anti-rabbit IRDye 800CW, anti-rabbit IRDye 680RD, anti-mouse IRDye 680RD, and anti-mouse IRDye 800CW. Blots were again washed three times for 10 min in TBS-T and imaged on an Odyssey CLX imager (LI-COR). All antibodies are listed in Table S3. Western blot images were quantified in Image Studio Lite (LI-COR). Quantifications were calculated using default Image Studio Light settings. Briefly, the pixel values of a region of interest (ROI) were first summed to general the “total” value. The product of the median background signal around the ROI and the ROI area were then subtracted from the total value to generate the “signal” value. Quantifications were normalized to a loading control to negate differences in lysate concentration and gel loading artifacts.
LC-MS/MS sample preparation (in-gel digestion)
Using a light box to illuminate the gel, the protein bands were excised and cut into smaller pieces, then destained according to the vendor protocol (Pierce Silver Stain for Mass Spectrometry, Thermo Fisher Scientific), dehydrated by the addition of acetonitrile (ACN) (∼3 times the volume of gel pieces), and incubated at room temperature for 10 min. Gel pieces are shrunk and turn opaque, and ACN was removed. To reduce the cysteine residues, gel pieces were covered with a solution of freshly prepared 10 mM DTT in 50 mM ammonium bicarbonate (ABC) and agitated for 45 min at 55°C, and then, the reducing solution was removed. For the alkylation step, 55 mM acrylamide in 50 mM ABC was added and incubated at room temperature for 30 min. To terminate the alkylation, the solution was removed, and the gel pieces were washed twice under agitation for 10 min in 50 mM ABC followed by dehydration in ACN to turn opaque-white in color (∼5 min). Air-dried gel pieces were covered with 50 mM ABC containing 12.5 ng/µl trypsin (Promega) and allowed to swell for 60 min on ice. After rehydration, excess trypsin solution was removed, and gel pieces were covered with 50 mM ABC to ensure their immersion throughout digestion for 16 h at 37°C. The supernatant was transferred to a new tube, and the gel pieces were washed twice for 10 min with 300 μl of 2:1 (vol/vol) 50 mM ABC/ACN each and combined with the other supernatant. ACN was removed under reduced pressure, and samples were concentrated to ∼150 μl (Vacufuge plus, Eppendorf), acidified with formic acid (0.5%), desalted on NEST MicroSpin C18 spin columns (The Nest Group), concentrated to dryness using a speed vacuum (Vacufuge plus, Eppendorf), and resuspended in 5% formic acid/5% ACN loading buffer for LC-MS/MS.
LC-MS/MS measurements
All samples were analyzed using trapped ion mobility spectrometry–quadrupole time-of-flight (timsTOF Pro) mass spectrometer coupled with ultra-high-pressure nano-flow liquid chromatography nanoElute system (Bruker). Peptides were loaded onto a reverse-phase 25-cm Aurora Series C18 analytical column (25 cm × 75 µm ID, 1.6 µm C18) fitted with a CaptiveSpray insert (IonOpticks). Column temperature was maintained at 50°C, and mobile phase A (2% ACN and 0.1% formic acid in water) and mobile phase B (0.1% formic acid in ACN) were used for the separation of peptides with 400 nl/min constant flow using a linear gradient starting from 0 to 30% in 90 min, followed by an increase to 80% B within 10 min, followed by washing and re-equilibration for 20 min. Mass spectra were acquired on a hybrid timsTOF Pro mass spectrometer with a modified nano-electrospray CaptiveSpray ion source (Bruker Daltonics). Mass spectrometer was operated in Parallel Accumulation SErial Fragmentation (PASEF) mode. Full mass spectra were acquired in a mass range of 100–1,700 m/z and ion mobility (1/k0) range from 0.60 to 1.60. 10 PASEF MS/MS scans per topN acquisition cycle were acquired.
Analysis of MS data and identification of phosphorylation sites
The DDA timsTOF data were converted into MGF format using Bruker Data Analysis software. Files were searched using MASCOT Daemon search tool against the human UniProt reference proteome with digestion mode set to trypsin, fixed modification propionamide (C), and variable modifications acetyl (K), GG (K), oxidation (M), and phospho (ST). Files were also searched with MSFragger with the same search parameters, and all phosphorylation sites identified were compared. Average intensities of the phosphorylated peptides, normalized to total peptides of TRAK1, were converted to Log2, and the frequency of phosphorylation sites per group was calculated (see Table S2).
Oxygen consumption (OCR)
E18 dissociated cortical neurons were plated on PDL-coated Seahorse 96-well cell culture dishes (see Cell culture methods) included in Seahorse XFe96 FluxPaks (102601-100; Agilent Technologies) at 5–7 × 10^4 cells/cm2. Flux packs were prepared according to the manufacturer’s protocol. One hour before the oxygen consumption measurements were made, 4 nM AntA (A8674; Sigma-Aldrich) or vehicle (i.e., dimethyl sulfoxide, D2650; Sigma-Aldrich) was added to neuronal Seahorse media (Ribeiro et al., 2014) and basal oxygen consumption was measured on a Seahorse XFe-96 analyzer. Immediately after Seahorse measurements were made, the number of nuclei per field was measured by fixing and Hoechst staining 5 wells each from AntA or vehicle-treated wells. Oxygen consumption was normalized to these counts.
Statistical analysis
Plots were generated, and statistical analyses were performed using GraphPad Prism 10. All box and whiskers plots show the median value (middle bar) and the 25th and 75th quartiles (lower and upper bars of each box). The whiskers displayed are the 10th and 90th percentiles with the exception of Fig. S5 B, in which they show the minimum to maximum values. Ns are defined in each figure legend. While power analysis was not performed, sample sizes are similar to those commonly reported in the field. Formal testing for normally distributed data was not performed.
Online supplemental material
Fig. S1 presents data in support of a model in which mitochondrial movement specifically, and not organelle movement in general, is decreased by 4 nM AntA treatment. Fig. S2 shows that the mitochondrial arrest caused by 4 nM AntA treatment is PINK1-independent. Fig. S3 provides controls for the rapalog system used in Fig. 2, as well as additional images and a montage of the perimitochondrial actin encasements described in Fig. 3. Fig. S4 demonstrates that Fhl2, Myo6, and PINK1 do not contribute to the arrest caused by 4 nM AntA. Fig. S5 displays kymographs and supporting data connecting AMPK to the AntA-induced mitochondrial arrest and the phosphorylation of TRAK1 (related to Figs. 5, 6, and 7). Table S1 lists primers used in this study; Table S2 lists phosphoproteomics data; and Table S3 lists plasmids, tool, and other reagents with their respective RRIDs.
Data availability
The data are available from the corresponding author upon reasonable request.
Acknowledgments
We would like to acknowledge the Cellular Imaging Core of the IDDRC at Boston Children’s Hospital (NIH U54 HD090255), as well as the immense help of Paula Montero Llopis, Praju Vikas Anekal, and Adrienne Wells of the Microscopy Resources on the North Quad Core at Harvard Medical School (NINDS P30 Core Center grant no. NS072030). We would also like to thank the Haigis lab for the use of their Agilent Seahorse XF Pro analyzer. We thank Isaac Chiu (Harvard Medical School, Boston, MA) for the LVX-hSYN1-mNeonGreen plasmid, Christina Woo (Harvard, Cambridge, MA) for the OGT/OGA writer and eraser plasmids, Casper Hoogenraad (Utrecht University, Utrecht, the Netherlands) for the HA-Kif5b-MD-FRB plasmid, Richard Youle (National Institutes of Health, Bethesda, MD) for the PINK1-D110-YFP-FKBP plasmid, Matthew Lavoie (Brigham and Women’s Hospital and Harvard Medical School, Boston, MA) (Johns Hopkins University, Baltimore, MD) for the pLVX-CAG-MCS-IRES-mCherry plasmid, and Takanari Inoue for the pTomm20-mCherry-FKBP plasmid. We are enormously thankful for the helpful input provided by Gary Yellen, Paul Rosen, and Aaron Bowen. Thanks to the Schwarz lab for useful conversations.
This work was supported by National Institutes of Health (NIH) grants 1R01NS107490 and R01GM069808 to T.L. Schwarz. J.E. Falk was supported by NIH training grant T32NS007473, 1F32GM126758, and Parkinson’s Foundation Postdoctoral Fellowships for Basic Scientists.
Author contributions: Jill E. Falk: conceptualization, data curation, formal analysis, funding acquisition, investigation, methodology, supervision, validation, visualization, and writing—original draft, review, and editing. Tobias Henke: conceptualization, data curation, formal analysis, investigation, software, validation, visualization, and writing—original draft, review, and editing. Sindhuja Gowrisankaran: investigation. Simone Wanderoy: investigation. Himanish Basu: data curation, methodology, software, and visualization. Sinead Greally: investigation. Judith Steen: conceptualization, data curation, formal analysis, funding acquisition, investigation, methodology, project administration, resources, software, supervision, validation, visualization, and writing—review and editing, Thomas L. Schwarz: conceptualization, data curation, funding acquisition, project administration, supervision, and writing—review and editing.
References