


Type 2 ryanodine receptor (RYR2) is a cardiac Ca2+ release channel in the ER. Mutations in RYR2 are linked to catecholaminergic polymorphic ventricular tachycardia (CPVT). CPVT is associated with enhanced spontaneous Ca2+ release, which tends to occur when [Ca2+]ER reaches a threshold. Mutations lower the threshold [Ca2+]ER by increasing luminal Ca2+ sensitivity or enhancing cytosolic [Ca2+] ([Ca2+]cyt)-dependent activity. Here, to establish the mechanism relating the change in [Ca2+]cyt-dependent activity of RYR2 and the threshold [Ca2+]ER, we carried out cell-based experiments and in silico simulations. We expressed WT and CPVT-linked mutant RYR2s in HEK293 cells and measured [Ca2+]cyt and [Ca2+]ER using fluorescent Ca2+ indicators. CPVT RYR2 cells showed higher oscillation frequency and lower threshold [Ca2+]ER than WT cells. The [Ca2+]cyt-dependent activity at resting [Ca2+]cyt, Arest, was greater in CPVT mutants than in WT, and we found an inverse correlation between threshold [Ca2+]ER and Arest. In addition, lowering RYR2 expression increased the threshold [Ca2+]ER and a product of Arest, and the relative expression level for each mutant correlated with threshold [Ca2+]ER, suggesting that the threshold [Ca2+]ER depends on the net Ca2+ release rate via RYR2. Modeling reproduced Ca2+ oscillations with [Ca2+]cyt and [Ca2+]ER changes in WT and CPVT cells. Interestingly, the [Ca2+]cyt-dependent activity of specific mutations correlated with the age of disease onset in patients carrying them. Our data suggest that the reduction in threshold [Ca2+]ER for spontaneous Ca2+ release by CPVT mutation is explained by enhanced [Ca2+]cyt-dependent activity without requiring modulation of the [Ca2+]ER sensitivity of RYR2.
Introduction
The type 2 ryanodine receptor (RYR2) is a Ca2+ release channel in the SR/ER that has an indispensable role in excitation–contraction coupling in the heart. In cardiac myocytes, RYR2 is activated by Ca2+ influx through L-type Ca2+ channels during action potential with a Ca2+-induced Ca2+ release (CICR) mechanism to release more Ca2+, which causes muscle contraction (Fabiato, 1983; Bers, 2002). In contrast, spontaneous Ca2+ release, such as Ca2+ waves, which underlies delayed afterdepolarization of the plasma membrane via a Na+–Ca2+ exchange reaction, often results in triggered activity (Tsien et al., 1979; Lakatta, 1992). Spontaneous Ca2+ release can be seen when cardiomyocytes are Ca2+-overloaded, even in healthy hearts, but is more likely to occur in the myocardium of heart failure patients or carriers of RYR2 mutations associated with sudden cardiac death syndrome.
RYR2 mutations have been linked to several types of arrhythmogenic diseases, such as catecholaminergic polymorphic ventricular tachycardia (CPVT), left ventricular noncompaction, and idiopathic ventricular fibrillation (Priori et al., 2001; Tester et al., 2004; Medeiros-Domingo et al., 2009; Priori and Chen, 2011; Kawamura et al., 2013; Fujii et al., 2017; Uehara et al., 2017; Nozaki et al., 2020; Hirose et al., 2022). Among the nearly 300 arrhythmogenic mutations reported to date, CPVT is the most common RYR2-related arrhythmogenic disorder and is induced in response to sympathetic nerve activation without structural abnormalities of the heart (Priori et al., 2001). CPVT-linked RYR2 mutations previously characterized were associated with gain-of-function phenotypes, which are prone to induce spontaneous Ca2+ release from the SR.
Two Ca2+-dependent regulatory mechanisms of RYR2—the regulation from the luminal side of the SR/ER (luminal control) and that from the cytoplasmic side (cytoplasmic control)—may be involved in the spontaneous Ca2+ release. Many reports have described that SR/ER luminal Ca2+ plays a role in controlling Ca2+ release through RYR2 in cardiac cells (Bassani et al., 1995; Lukyanenko et al., 1996; Sitsapesan and Williams, 1997). In addition, effects of ER luminal Ca2+ on RYR2 channels have been extensively investigated under artificial noncardiac conditions using a HEK293 expression system. Single-channel analyses have indicated that luminal Ca2+ ([Ca2+]ER) activates RYR2 at ∼10−3 M in the presence of calsequestrin 2 and at 10−2 M in its absence (Qin et al., 2008). In contrast, the role of cytosolic Ca2+ is known as the CICR mechanism (Endo, 1977; Fabiato, 1983; Murayama and Kurebayashi, 2011; Guo et al., 2012; Rios, 2018). The cytoplasmic Ca2+ ([Ca2+]cyt) activates RYR2 at Ca2+ low concentrations, below ∼10−4 M, but suppresses it at higher Ca2+ concentrations (above ∼10−3 M), resulting in a bell-shaped [Ca2+]cyt dependence (Murayama and Kurebayashi, 2011; Rios, 2018). Therefore, a small local Ca2+ leak from the ER, which is more likely to occur at high [Ca2+]ER, may activate RYR2 from the cytoplasmic side to trigger massive Ca2+ release by the positive feedback nature of CICR.
A question of whether CPVT mutations primarily affect the cytoplasmic or luminal regulation of RYR2 is currently under debate. Chen and colleagues (Jiang et al., 2004; Jiang et al., 2005) indicated that the spontaneous Ca2+ release, called store-overload–induced Ca2+ release (SOICR), in RYR2-expressing HEK293 cells occurs when [Ca2+]ER reaches a certain critical threshold level, and they found that the CPVT-linked RYR2 cells showed a lower threshold [Ca2+]ER for spontaneous Ca2+ release compared with WT RYR2 (Jones et al., 2008). They reported that some of the CPVT-linked RYR2 channels (e.g., R2474S and R4497C) increased luminal Ca2+ sensitivity, with no significant effects on [Ca2+]cyt dependence (Jiang et al., 2005), suggesting that the lower threshold [Ca2+]ER with these CPVT mutations is due to sensitization to luminal Ca2+ but not to cytosolic Ca2+. In contrast, Wehrens et al. (2003) reported that the same mutation, R2474S, increased [Ca2+]cyt sensitivity via the phosphorylation of RYR2 by protein kinase A due to the dissociation of FKBP12.6. We also found that R2474S showed higher [Ca2+]cyt-dependent activity at resting [Ca2+]cyt (Uehara et al., 2017). The reason for this discrepancy may be better understood through a more quantitative analysis.
The HEK293 cell expression system allows for both functional and biochemical analyses of exogenously expressed RYRs (Jiang et al., 2002; Jiang et al., 2004; Murayama et al., 2015). In HEK293 cells, regulatory proteins specific to the myocardium, such as calsequestrin and FKBP12.6, are absent; thus, the use of these cells enables evaluation of the direct effect of mutations on RYR2 activity. Previously we have quantitatively evaluated the Ca2+ release activity of RYR1 using the HEK293 expression system and showed that [Ca2+]ER signals correlated well with the [Ca2+]cyt-dependent [3H]ryanodine binding activity of RYR1 (Murayama et al., 2015; Murayama et al., 2016). In this study, we investigated the correlation between [Ca2+]cyt-dependent activity and [Ca2+]ER in HEK293 cells using 10 CPVT and 6 artificial RYR2 mutations. In addition, we further validated this correlation using a mathematical model. Our results suggest that the changes in threshold [Ca2+]ER for spontaneous Ca2+ release by CPVT mutation are explained by the [Ca2+]cyt-dependent activity of RYR2 without considering a change in the [Ca2+]ER sensitivity.
Materials and methods
Generation of stable inducible HEK293 cell lines
Full-length mouse RYR2 cDNA was constructed from cDNA fragments that were PCR-amplified from mouse ventricles and then cloned into a tetracycline-induced expression vector (pcDNA5/FRT/TO; Life Technologies; Fujii et al., 2017; Uehara et al., 2017). Mutations corresponding to V2321M, R2474S, D3638A, Q4201R, K4932R, R4497C, K4751Q, H4762P, K4805R, and I4867M were introduced by inverse PCR and confirmed by DNA sequencing (Table 1). The expression vector was cotransfected with pOG44 into Flp-In T-REx HEK293 cells (Life Technologies), according to the manufacturer’s instructions. Clones with suitable doxycycline-induced expression of RYR2 expression were selected and used in the experiments.
List of CPVT mutations examined in this study
| Position | Age at diagnosis (yr), gender (arrhythmic event) | Domain | Reference |
|---|---|---|---|
| V2321M | 22, F (SUD) | Helical domain, helix 5a | Nishio et al. (2008) |
| R2474S | 8, M (syncope)a; 7, M (SUD)a | Helical domain, helix 7a | Priori et al. (2001, 2002) |
| D3638A | 2, M (SCD) | Central domain, helix 1 | Kawamura et al. (2013) |
| Q4201R | 14, M; 23, M; 29, M; 27, F (SCD); 46–74, 2F and 1M (asymptomatic) | Central domain, just after helix 23 (U-motif) | Laitinen et al. (2001) |
| K4392R | 26, F; mother is not affected | Divergent region 1 (not conserved) | Arakawa et al. (2015) |
| R4497C | 30, F (palpitation); 14, F, 16, F (SCD); 28, 36 (biVT on exercise test); 59, F (asymptomatic) | S1′ | Priori et al. (2001) and Tester et al. (2004) |
| K4751Q | 6, F (CPVT and AF) | Joint region between S4 and S4–S5 linker | Kawamura et al. (2013) and Uehara et al. (2017) |
| H4762P | 13, F (VT)b; mother and two children are clinically unaffected | S4–S5 linker | Postma et al. (2005) |
| K4805R | 2, F | Pore forming loop | Medeiros-Domingo et al. (2009) and Lieve et al. (2019) |
| I4867M | 9, M | S6 | Priori et al. (2002) |
AF, atrial fibrillation; biVT, bidirectional ventricular tachycardia; SCD, sudden cardiac death; SUD, sudden unexplained death; VT, ventricular tachycardia.
Twin brothers.
This proband carries two separate mutations, H4762P and G4662S.
Single-cell Ca2+ imaging
HEK293 cells grown on a glass-bottomed dish were treated with doxycycline 26–28 h before measurement to induce the expression of RYR2, unless otherwise noted. Single-cell Ca2+ imaging was carried out in HEK293 cells expressing WT or mutant RYR2 in Krebs solution (140 mM NaCl, 5 mM KCl, 2 mM CaCl2, 1 mM MgCl2, 11 mM glucose, and 5 mM HEPES, pH 7.4; Murayama et al., 2015; Uehara et al., 2017). All measurements were performed at 26°C by perfusing solutions using an in-line solution heater/cooler (Warner Instruments).
For cytosolic Ca2+ measurements, cells were loaded with 4 µM fluo-4 AM in culture medium for 30 min at 37°C and then incubated with Krebs solution. Fluo-4 was excited at 488 nm through a 20× objective lens, and emitting light at 525 nm was captured with an electron multiplying–charge-coupled device camera at 700-ms intervals (Model 8509; Hamamatsu Photonics). The fluo-4 fluorescence signal was measured in normal Krebs solution for 5 min and then in 10 mM caffeine containing Krebs solution for 1.5 min, and at the end of each experiment the maximal fluorescence intensity (Fmax) of fluo-4 was determined with a 20Ca-ionomycin solution (140 mM NaCl, 5 mM KCl, 20 mM CaCl2, 1 mM MgCl2, 11 mM glucose, 20 µM ionomycin, and 5 mM HEPES, pH 7.4). The fluorescence signal (F) in individual cells in Krebs solution was determined using region of interest (ROI) analysis, and cell-free background fluorescence was subtracted from F and normalized by the value Fmax. The [Ca2+]cyt was calculated using the parameters of effective KD = 2.2 μM and n = 1 in situ (Harkins et al., 1993; Nelson et al., 2014). Since WT and most of mutant RYR2 mutant-expressing cells showed Ca2+ oscillations, the peak and resting fluorescence and Ca2+ oscillation frequency in normal Krebs solution were determined. For oscillation analysis, a series of cytosolic Ca2+ increase and decrease with ΔF/Fmax > 0.05 and a duration of 0.1–1 min was regarded as one Ca2+ oscillation. The oscillation frequency was determined by counting the number of oscillations during 5 min in normal Krebs solution in individual cells (n/min). Usually, during one measurement in a single cell, the peak amplitudes of the oscillations were very similar. To obtain the peak [Ca2+]cyt signal in individual cells, the maximum F/F0 during 5 min in Krebs solution was determined and subtracted from the fluctuation factor, 0.01 F/F0. To obtain the resting [Ca2+]cyt signal, the minimum F/F0 during the 5 min was determined and added with a fluctuation factor of 0.005 F/F0.
For [Ca2+]ER measurements, [Ca2+]ER and [Ca2+]cyt signals were simultaneously monitored using genetically encoded Ca2+ indicators R-CEPIA1er (Suzuki et al., 2014; Murayama et al., 2015; Uehara et al., 2017) and G-GECO1.1 (Zhao et al., 2011), respectively. Cells were transfected with G-GECO1.1 and R-CEPIA1er cDNA 26–28 h before measurements. Doxycycline was added to the medium at the same time as transfection in most experiments, or after transfection in experiments using cells with reduced RYR2 expression. Cytosolic and ER Ca2+ signals were determined in normal Krebs solution for 5 min and then in 10 mM caffeine containing Krebs solution for 1.5 min. After caffeine treatment, the cells were perfused with the following solutions: 0Ca-Krebs solution (140 mM NaCl, 5 mM KCl, 1 mM MgCl2, 11 mM glucose, and 5 mM HEPES, pH 7.4), BAPTA-0Ca-ionomycin solution (140 mM NaCl, 5 mM KCl, 5 mM 1,2-bis(o-aminophenoxy)ethane-N,N,N′,N′-tetraacetic acid [BAPTA], 1 mM MgCl2, 11 mM glucose, 20 μM ionomycin, 20 μM cyclopiazonic acid, and 5 mM HEPES, pH 7.4), 0Ca-Krebs solution, and then 20Ca-ionomycin solution. The Fmin and Fmax values were determined using the BAPTA-0Ca-ionomycin solution and 20Ca-ionomycin solution, respectively. Threshold and nadir [Ca2+]ER levels were determined using the same protocol used for peak and resting [Ca2+]cyt determination. Because G-GECO1.1 signals have a high Hill coefficient (n = 3.38; Suzuki et al., 2014), which results in a difficult [Ca2+]cyt calculation, only the R-CEPIA1er signal was used for the calculation of [Ca2+]ER. [Ca2+]ER was calculated using the parameters determined by in situ titration (KD = 565 μM, n = 1.7; Suzuki et al., 2014).
[3H]ryanodine binding and parameter analysis
Ca2+-dependent [3H]ryanodine binding was performed as previously described (Fujii et al., 2017; Nozaki et al., 2020). Briefly, microsomes isolated from HEK293 cells were incubated for 1 h at 25°C with 5 nM [3H]ryanodine in a medium containing 0.17 M NaCl, 20 mM 3-(N-morpholino)-2-hydroxypropanesulfonic acid, pH 7.0, 2 mM dithiothreitol, 1 mM AMP, 1 mM MgCl2, and various concentrations of free Ca2+ buffered with 10 mM EGTA. Free Ca2+ concentrations were calculated using the WEBMAXC STANDARD (https://somapp.ucdmc.ucdavis.edu/pharmacology/bers/maxchelator/webmaxc/webmaxcS.htm; Bers et al., 2010). The protein-bound [3H]ryanodine was separated by filtering through polyethyleneimine-treated GF/B filters using Micro 96 Cell Harvester (Skatron Instruments). Nonspecific binding was determined in the presence of 20 µM unlabeled ryanodine. The [3H]ryanodine binding data (B) were normalized to the maximum number of functional channels (Bmax), which was separately determined by Scatchard plot analysis using various concentrations (3–20 nM) of [3H]ryanodine in a high-salt medium containing 1 M NaCl. The resultant B/Bmax represents the average activity of each mutant.
For estimation of ryanodine binding at resting Ca2+, A at pCa 7.0 (Arest) for each mutant was calculated by Eqs. 1, 2, and 3 using the determined parameters (KACa, KICa, and Amax; Table 2), in which free [Ca2+] was set at 100 nM.
Parameters for [Ca2+]cyt-dependent Ca2+ release activities of CPVT and artificial mutants
| Parameter | Amax | KACa (mM) | KICa (mM) |
|---|---|---|---|
| Mock | 0 | ||
| WT | 0.1248 | 1.62 × 10⁻² | 3.002 |
| V2321M | 0.1847 | 1.10 × 10⁻² | 4.847 |
| R2474S | 0.2175 | 7.03 × 10⁻³ | 11.31 |
| D3638A | 0.1214 | 1.10 × 10⁻² | 2.058 |
| Q4201R | 0.1473 | 1.04 × 10⁻² | 4.454 |
| K4392R | 0.1324 | 1.80 × 10⁻² | 2.759 |
| R4497C | 0.1779 | 1.29 × 10⁻² | 5.553 |
| K4751Q | 0.2733 | 7.65 × 10⁻³ | 1,000 |
| H4762P | 0.09848 | 2.94 × 10⁻³ | 19.5 |
| K4805R | 0.2857 | 7.35 × 10⁻³ | 159.5 |
| I4867M | 0.08865 | 8.96 × 10⁻³ | 1.832 |
| T4754A | 0.1245 | 2.03 × 10⁻² | 2.178 |
| I4755A | 0.06616 | 8.18 × 10⁻³ | 1.829 |
| L4756A | 0.1925 | 2.22 × 10⁻³ | 741.6 |
| S4757A | 0.1684 | 1.38 × 10⁻² | 6.967 |
| S4758A | 0.05471 | 1.95 × 10⁻² | 3.245 |
| T4754I | 0.2953 | 8.40 × 10⁻³ | 17.13 |
Western blotting
Microsomal proteins were separated by SDS-PAGE and transferred onto a polyvinylidene difluoride membrane. Western blotting was performed using antibodies against RYR2 (Chugun et al., 2007) and calnexin (C4731; Sigma-Aldrich).
Simulation of RYR2 activity with luminal regulation
First, we performed simulations of [Ca2+]cyt-dependent [3H]ryanodine binding with and without luminal regulation, assuming that [Ca2+]ER was the same as [Ca2+]cyt, corresponding to the experimental conditions. We confirmed that the addition of E and KER,Ca had little effect on the fit curve of the [3H]ryanodine binding assay. Subsequently, we verified the manner in which RYR2 activity would change if the luminal Ca2+ concentration was maintained at high levels.
Mathematical model simulation
Parameters for cytosolic and ER Ca2+ binding sites
| Fixed parameters | Value | Reference |
|---|---|---|
| Vratio | 0.06 | Alberts (1983) |
| Ccyt (mM) | 11 | Means et al. (2006) and Nelson et al. (2014) |
| Kcyt (mM) | 0.3 | |
| CER (mM) | 3.6 | Means et al. (2006) |
| KER (mM) | 2 |
| Fixed parameters | Value | Reference |
|---|---|---|
| Vratio | 0.06 | Alberts (1983) |
| Ccyt (mM) | 11 | Means et al. (2006) and Nelson et al. (2014) |
| Kcyt (mM) | 0.3 | |
| CER (mM) | 3.6 | Means et al. (2006) |
| KER (mM) | 2 |
Data analysis
Online supplemental material
Fig. S1 shows calculated [Ca2+]cyt (in μM) converted from fluo-4 [Ca2+]cyt signals (as F/Fmax) in Fig. 2 (A and B) and average [Ca2+]cyt signals of fluo-4, which are the basis of Fig. 2 (C and D). Fig. S2 shows calculated [Ca2+]ER (in mM) converted from R-CEPIA1er [Ca2+]ER signals in Fig. 3 A, average [Ca2+]ER signals, which are the basis of Fig. 3 (B and C) and Fig. 5 (D and E), and correlation between nadir [Ca2+]ER and threshold [Ca2+]ER. Fig. S3 shows effects of mutations at the putative ER Ca2+ sensing site, E4872, on Ca2+ signaling and [3H]ryanodine binding of RYR2.
Results
Stable tetracycline-inducible HEK293 cell lines expressing WT and mutant RYR2s (10 CPVT and 6 artificial mutants) were generated. The CPVT mutations are in the N-terminal helical domain (V2321M, R2474S), central domain (D3638A, Q4201R), divergent region 1 (K4392R), and transmembrane domain (R4497C, K4751Q, H4762P, K4805R, and I4867M; Fig. 1 A and Table 1). Furthermore, artificial mutations were made by single alanine substitutions at the S4–S5 linker region, in which alanine substitutions differentially affect the [Ca2+]cyt-dependent Ca2+ release activity depending on the position of the α helix in RYR1 (Murayama et al., 2011). Fig. 1 B shows representative Western blots of WT and mutant RYR2s 26 h after induction. There was no significant difference in average expression levels between WT and mutant RYR2 proteins, except for K4751Q, K4805R, and L4757A (Fig. 1 C), the expression levels of which were lower than those of the other mutants. Low expression levels may correlate with high Ca2+ release activity, as described later.
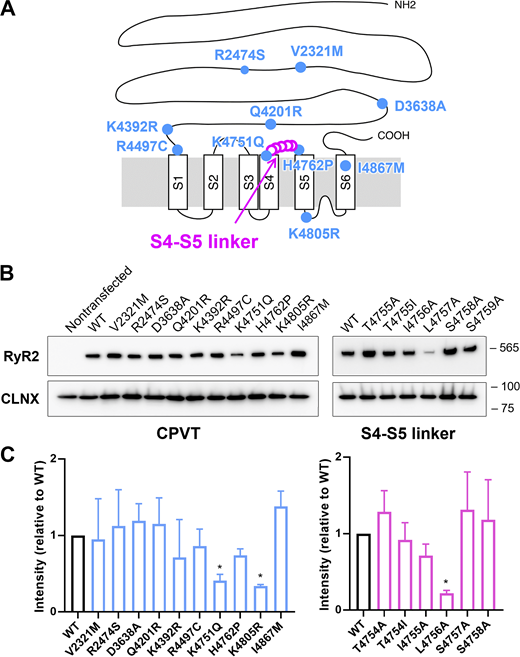
RYR2 mutations used in this study. (A) Location of mutations in the primary structure of RYR2. CPVT mutations (blue circles) were based on human disorders (see Table 1), whereas the mutations in S4–S5 linker regions (pink open circles) were artificial. (B) Representative Western blot of WT and RYR2 mutants expressed in HEK293 cells. Calnexin (CLNX) was used as a loading control. (C) Quantification of RYR2 protein expression in HEK293 cells (n = 6 each). Values were normalized to WT and are presented as the mean ± SD. *, P < 0.05. Note that the expression levels of K4751Q, K4805R, and L4757A were significantly lower than that of WT. Source data are available for this figure: SourceData F1.
RYR2 mutations used in this study. (A) Location of mutations in the primary structure of RYR2. CPVT mutations (blue circles) were based on human disorders (see Table 1), whereas the mutations in S4–S5 linker regions (pink open circles) were artificial. (B) Representative Western blot of WT and RYR2 mutants expressed in HEK293 cells. Calnexin (CLNX) was used as a loading control. (C) Quantification of RYR2 protein expression in HEK293 cells (n = 6 each). Values were normalized to WT and are presented as the mean ± SD. *, P < 0.05. Note that the expression levels of K4751Q, K4805R, and L4757A were significantly lower than that of WT. Source data are available for this figure: SourceData F1.
Ca2+ homeostasis in HEK293 cells expressing WT and CPVT mutant RYR2s
Single-cell Ca2+ imaging in HEK293 cells was performed 26–28 h after induction with doxycycline. Fig. 2 A shows representative cytoplasmic Ca2+ measurements determined using fluo-4. HEK293 cells expressing WT-RYR2 showed spontaneous Ca2+ oscillations, as reported previously (Fig. 2 A, left; Jiang et al., 2004; Fujii et al., 2017; Uehara et al., 2017). The application of 10 mM caffeine induced a transient Ca2+ release with an amplitude similar to that of spontaneous oscillations. Cells expressing R4497C- and R2474S-RYR2 showed Ca2+ oscillations with higher frequency and smaller amplitude compared with those of WT cells (Fig. 2 A [middle two], B, and C). Most of the H4762P cells showed no evident oscillations, and the application of caffeine caused only a small Ca2+ transient, as shown in Fig. 2 A, right. The oscillation frequencies, including no oscillation (0/min), in individual WT and mutant RYR2 cells are plotted in Fig. 2 B, with the median (red line). More than 70% of WT and CPVT mutant cells showed Ca2+ oscillations, with the exceptions of H4762P and K4805R. The average oscillation frequency was significantly higher in the CPVT mutants than in the WT, except for K4392R, H4762P, and K4805R (Fig. 2 B). In H4762P and K4805R cells, the median of the frequency was 0, although 10% of cells exhibited Ca2+ oscillations with higher frequency than those in WT cells (Fig. 2 B). The oscillation frequency in K4392R was not significantly different from that of WT. The average peak Ca2+ signals and calculated Ca2+ concentrations ([Ca2+]cyt) are shown in Figs. S1 B and 2 C, respectively. Peak [Ca2+]cyt was significantly smaller in CPVT than in WT, with the exception of K4392R. The average resting Ca2+ signals and calculated [Ca2+]cyt were significantly higher in K4751Q, H4762P, and K4805R cells (Figs. S1 B and 2 D). A significant negative correlation (P < 0.0001) was observed between the average oscillation frequency and peak amplitude (Fig. 2 E); that is, a higher frequency was associated with a smaller Ca2+ transient.
![Cytoplasmic Ca2+signals in HEK293 cells expressing WT and CPVT mutant RYR2. (A) Typical traces of fluo-4 Ca2+ signals in WT (left), R4497C (middle left), R2474S (middle right), and H4762P (right) cells. Fluorescence signals from fluo-4 (F) in individual cells were obtained in normal Krebs solution for 5 min followed by application of 10 mM caffeine (black line) for 1.5 min. At the end of each measurement, cells were treated with 0Ca-Krebs solution (thin line) and with 20Ca-ionomycin solution (open bar), giving the maximal fluorescence intensity of fluo-4 (Fmax). (B) Oscillation frequencies in WT and CPVT cells. Oscillation frequency was determined by counting the number of Ca2+ oscillations, including 0, that occurred during 5-min measurements and expressed as n/min. Data are expressed as violin plot with all the points. Medians are indicated with thick red lines, and quartiles are thin black lines. n = 150 from three dishes. *, P < 0.05; ***, P < 0.001 compared with WT tested by one-way ANOVA followed by multiple comparison. (C) Average peak [Ca2+]cyt in oscillating cells only. Data are mean ± SD. n = 150. ***, P < 0.001 compared with WT tested by one-way ANOVA followed by multiple comparison. NA, not applicable because fraction of oscillating cells was too small. (D) Average minimal/resting [Ca2+]cyt in both oscillating and nonoscillating cells. Data are mean ± SD. n = 150. ***, P < 0.001 compared with WT tested by one-way ANOVA followed by multiple comparison. (E) Relationship between average oscillation frequency and peak [Ca2+]cyt. WT (black open circle), CPVT (blue filled circle). Data of H4762P and K4805R are not included. The line is a simple linear regression (P < 0.0001).](https://cdn.rupress.org/rup/content_public/journal/jgp/154/9/10.1085_jgp.202112869/3/m_jgp_202112869_fig2.png?Expires=1773756248&Signature=mpvChj0-hBFAmdVg8Cb4cxw0iiaY6G3LLXzfqRfWiQgPEd1n46mwm0nKjCFRSGyAaleIIRsAO9Zr4UFAuniu8druqlPfLTe735kRCvetncA4E8Z7rUy4~DrpZjPRUYvuN7bxPiv4nmQ-Dh5Rm-Cgbq-CZb0QBNCjkCqUtRYCMdhlPQ2Oc7rzfFTIGMWifDnHTm4t8Ug3LeG2KAyr1zN15dqoZVlITBG6ysQCtbUDPp57mR1TQhaRdtOCMBW8LMCLzhLUB9708hLF6Nvc7VTyBaqV14v-1AIeZT0Mve8r~PLaV7JHXgFxlxiA8HjIcOJebaZzGb62GNO8f-MndNEY5Q__&Key-Pair-Id=APKAIE5G5CRDK6RD3PGA)
Cytoplasmic Ca 2+ signals in HEK293 cells expressing WT and CPVT mutant RYR2. (A) Typical traces of fluo-4 Ca2+ signals in WT (left), R4497C (middle left), R2474S (middle right), and H4762P (right) cells. Fluorescence signals from fluo-4 (F) in individual cells were obtained in normal Krebs solution for 5 min followed by application of 10 mM caffeine (black line) for 1.5 min. At the end of each measurement, cells were treated with 0Ca-Krebs solution (thin line) and with 20Ca-ionomycin solution (open bar), giving the maximal fluorescence intensity of fluo-4 (Fmax). (B) Oscillation frequencies in WT and CPVT cells. Oscillation frequency was determined by counting the number of Ca2+ oscillations, including 0, that occurred during 5-min measurements and expressed as n/min. Data are expressed as violin plot with all the points. Medians are indicated with thick red lines, and quartiles are thin black lines. n = 150 from three dishes. *, P < 0.05; ***, P < 0.001 compared with WT tested by one-way ANOVA followed by multiple comparison. (C) Average peak [Ca2+]cyt in oscillating cells only. Data are mean ± SD. n = 150. ***, P < 0.001 compared with WT tested by one-way ANOVA followed by multiple comparison. NA, not applicable because fraction of oscillating cells was too small. (D) Average minimal/resting [Ca2+]cyt in both oscillating and nonoscillating cells. Data are mean ± SD. n = 150. ***, P < 0.001 compared with WT tested by one-way ANOVA followed by multiple comparison. (E) Relationship between average oscillation frequency and peak [Ca2+]cyt. WT (black open circle), CPVT (blue filled circle). Data of H4762P and K4805R are not included. The line is a simple linear regression (P < 0.0001).
Cytoplasmic Ca 2+ signals in HEK293 cells expressing WT and CPVT mutant RYR2. (A) Typical traces of fluo-4 Ca2+ signals in WT (left), R4497C (middle left), R2474S (middle right), and H4762P (right) cells. Fluorescence signals from fluo-4 (F) in individual cells were obtained in normal Krebs solution for 5 min followed by application of 10 mM caffeine (black line) for 1.5 min. At the end of each measurement, cells were treated with 0Ca-Krebs solution (thin line) and with 20Ca-ionomycin solution (open bar), giving the maximal fluorescence intensity of fluo-4 (Fmax). (B) Oscillation frequencies in WT and CPVT cells. Oscillation frequency was determined by counting the number of Ca2+ oscillations, including 0, that occurred during 5-min measurements and expressed as n/min. Data are expressed as violin plot with all the points. Medians are indicated with thick red lines, and quartiles are thin black lines. n = 150 from three dishes. *, P < 0.05; ***, P < 0.001 compared with WT tested by one-way ANOVA followed by multiple comparison. (C) Average peak [Ca2+]cyt in oscillating cells only. Data are mean ± SD. n = 150. ***, P < 0.001 compared with WT tested by one-way ANOVA followed by multiple comparison. NA, not applicable because fraction of oscillating cells was too small. (D) Average minimal/resting [Ca2+]cyt in both oscillating and nonoscillating cells. Data are mean ± SD. n = 150. ***, P < 0.001 compared with WT tested by one-way ANOVA followed by multiple comparison. (E) Relationship between average oscillation frequency and peak [Ca2+]cyt. WT (black open circle), CPVT (blue filled circle). Data of H4762P and K4805R are not included. The line is a simple linear regression (P < 0.0001).
![Typical [Ca2+]cyt traces and average peak and resting Ca2+ signals in HEK293 cells expressing WT and mutant RYR2. (A) Representative time course of calculated [Ca2+]cyt (in micromolar) converted from fluo-4 [Ca2+]cyt signals (as F/Fmax) in Fig. 2 A into Ca2+ concentrations. Data were obtained in normal Krebs solution followed by application of 10 mM caffeine (black line). (B) Average [Ca2+]cyt signals of fluo-4, which are the basis of Fig. 2, C and D. Data are mean ± SD. n = 138–150. *, P < 0.05 compared with WT peak. #, P < 0.05 compared with WT rest. NA, not applicable because only a small number of cells show Ca2+ oscillations in H4762P and K4805R cells.](https://cdn.rupress.org/rup/content_public/journal/jgp/154/9/10.1085_jgp.202112869/3/m_jgp_202112869_figs1.png?Expires=1773756248&Signature=Y~r9CXdRbbtuGqr7m5cmEolGVqrsM5VMxHL1DQLSa52chXCdzbg25YRZsmG400zbmqOa7UtaN4XNC-FWmdk~a~gslidyklJY7iEdr9yMVlv96WvBeyIb4h9X6Ma1CnbnVUCO2dazJtFZWBCN~OC5wdVJlicEkaganDvJAnfnyG~leS9Xm1Kfi3hsdJpylqZnf1OU9qpikzUY~gzHhZTHTpyWG9WY4igOt2HLdQOzEHePMP2o0MNl2wzJyrxWCs2kOvrXwxYRSl-AXXuTGAPZuiFlnqmew-llvPnWfQwkHBw-GX9fws-yEyMpybtyxzmLAvnde6JFIPkz3dY-EwemOw__&Key-Pair-Id=APKAIE5G5CRDK6RD3PGA)
Typical [Ca2+]cyt traces and average peak and resting Ca2+ signals in HEK293 cells expressing WT and mutant RYR2. (A) Representative time course of calculated [Ca2+]cyt (in micromolar) converted from fluo-4 [Ca2+]cyt signals (as F/Fmax) in Fig. 2 A into Ca2+ concentrations. Data were obtained in normal Krebs solution followed by application of 10 mM caffeine (black line). (B) Average [Ca2+]cyt signals of fluo-4, which are the basis of Fig. 2, C and D. Data are mean ± SD. n = 138–150. *, P < 0.05 compared with WT peak. #, P < 0.05 compared with WT rest. NA, not applicable because only a small number of cells show Ca2+ oscillations in H4762P and K4805R cells.
Typical [Ca2+]cyt traces and average peak and resting Ca2+ signals in HEK293 cells expressing WT and mutant RYR2. (A) Representative time course of calculated [Ca2+]cyt (in micromolar) converted from fluo-4 [Ca2+]cyt signals (as F/Fmax) in Fig. 2 A into Ca2+ concentrations. Data were obtained in normal Krebs solution followed by application of 10 mM caffeine (black line). (B) Average [Ca2+]cyt signals of fluo-4, which are the basis of Fig. 2, C and D. Data are mean ± SD. n = 138–150. *, P < 0.05 compared with WT peak. #, P < 0.05 compared with WT rest. NA, not applicable because only a small number of cells show Ca2+ oscillations in H4762P and K4805R cells.
Next, we measured [Ca2+]ER levels using R-CEPIA1er, a genetically encoded ER Ca2+ sensor protein (Suzuki et al., 2014; Murayama et al., 2015; Murayama et al., 2016; Fujii et al., 2017; Uehara et al., 2017). Fig. 3 A shows representative [Ca2+]cyt and [Ca2+]ER signals from G-GECO1.1 and R-CEPIA1er, respectively, and Fig. S2 A shows the corresponding calculated [Ca2+]ER. HEK293 cells expressing WT RYR2 (Fig. 3 A, left) showed a periodic decrease in R-CEPIA1er signals in normal Krebs solution, which reflected Ca2+ release from the ER. Before each Ca2+ release, the R-CEPIA1er signal reached a maximal level (threshold), rapidly decreased to reach a minimal level (nadir), and then gradually increased again toward the threshold level. Both the threshold and nadir levels were reduced in R4497C and R2474S to varying degrees, while H4762P showed no oscillation with a further decrease in [Ca2+]ER (Fig. 3 A). The average ER Ca2+ signals and calculated [Ca2+]ER are shown in Fig. S2 B and Fig. 3, B and C, respectively. All CPVT cells showed significantly decreased threshold and nadir [Ca2+]ER, except for K4392R. A good correlation was observed between the nadir and the threshold [Ca2+]ER (Fig. S2 D).
![ER Ca2+signals in HEK293 cells expressing WT and CPVT mutant RYR2. (A) Representative traces of G-GECO1.1 (green) and R-CEPIA1er (red) signals for WT (left), R4497C (middle left), R2474S (middle right), and H4762P (right). Ca2+ signals in individual cells were obtained in normal Krebs solution and then in caffeine solution (thick line). At the end of each measurement, the cells were perfused with 0Ca-Krebs solution (thin line), BAPTA-ionomycin solution (hatched bar), 0Ca-Krebs solution (thin line), and then 20Ca-ionomycin solution (open bar). Fmin and Fmax values were obtained with BAPTA-ionomycin and 20Ca-ionomycin solution, respectively. (B) Average of maximal [Ca2+]ER, including threshold in oscillating cells and resting state in nonoscillation cells. Data are mean ± SD. n = 109–141. (C) Average of nadir [Ca2+]ER in oscillating cells. Data are mean ± SD, n = 86–131; *, P < 0.05; **, P < 0.01; ***, P < 0.001 compared with WT tested by one-way ANOVA followed by multiple comparison. NA, not applicable because only a small fraction of cells showed nadir.](https://cdn.rupress.org/rup/content_public/journal/jgp/154/9/10.1085_jgp.202112869/3/m_jgp_202112869_fig3.png?Expires=1773756248&Signature=bZ3Nura5zXgizhF2zA2c9m-twRrv~CxkqeoSOITZdoI3Pv31l83wzHRDv-r-Q~KtaXPnt10KDs~6If-IB9kCeR2XNf90BVAVMoxbJJ7ThPziLzpMknmHjBLpC6Cc2mPslrGhZjfLCyNkCUVreACwCqOyaj0sSYYA9MIKUNHP5iEUwNdGMof56447vYqMNdIPNFE0Je6hjHWjoMiEtT~deMNp~n6snrwhY1PRVbxrVJH1SMw7ZIjySjaWKpnVGp4KCSfRnmwlqtcMgyhT2UWJ8MU-WRb5ZCvOp2Em90xcNpJYWmsJWa9AuHu8KJClGDmb8nuUpccnzNRj4oz7WBfXVg__&Key-Pair-Id=APKAIE5G5CRDK6RD3PGA)
ER Ca 2+ signals in HEK293 cells expressing WT and CPVT mutant RYR2. (A) Representative traces of G-GECO1.1 (green) and R-CEPIA1er (red) signals for WT (left), R4497C (middle left), R2474S (middle right), and H4762P (right). Ca2+ signals in individual cells were obtained in normal Krebs solution and then in caffeine solution (thick line). At the end of each measurement, the cells were perfused with 0Ca-Krebs solution (thin line), BAPTA-ionomycin solution (hatched bar), 0Ca-Krebs solution (thin line), and then 20Ca-ionomycin solution (open bar). Fmin and Fmax values were obtained with BAPTA-ionomycin and 20Ca-ionomycin solution, respectively. (B) Average of maximal [Ca2+]ER, including threshold in oscillating cells and resting state in nonoscillation cells. Data are mean ± SD. n = 109–141. (C) Average of nadir [Ca2+]ER in oscillating cells. Data are mean ± SD, n = 86–131; *, P < 0.05; **, P < 0.01; ***, P < 0.001 compared with WT tested by one-way ANOVA followed by multiple comparison. NA, not applicable because only a small fraction of cells showed nadir.
ER Ca 2+ signals in HEK293 cells expressing WT and CPVT mutant RYR2. (A) Representative traces of G-GECO1.1 (green) and R-CEPIA1er (red) signals for WT (left), R4497C (middle left), R2474S (middle right), and H4762P (right). Ca2+ signals in individual cells were obtained in normal Krebs solution and then in caffeine solution (thick line). At the end of each measurement, the cells were perfused with 0Ca-Krebs solution (thin line), BAPTA-ionomycin solution (hatched bar), 0Ca-Krebs solution (thin line), and then 20Ca-ionomycin solution (open bar). Fmin and Fmax values were obtained with BAPTA-ionomycin and 20Ca-ionomycin solution, respectively. (B) Average of maximal [Ca2+]ER, including threshold in oscillating cells and resting state in nonoscillation cells. Data are mean ± SD. n = 109–141. (C) Average of nadir [Ca2+]ER in oscillating cells. Data are mean ± SD, n = 86–131; *, P < 0.05; **, P < 0.01; ***, P < 0.001 compared with WT tested by one-way ANOVA followed by multiple comparison. NA, not applicable because only a small fraction of cells showed nadir.
![[Ca2+]ER in HEK293 cells expressing WT and mutant RYR2. (A) Calculated [Ca2+]ER (in millimolar) converted from R-CEPIA1er [Ca2+]ER signals in Fig. 3 A. (B) Average [Ca2+]ER signals, which are the basis of Fig. 3, B and C; and Fig. 5, D and E. Data are mean ± SD. n = 71–120; *, P < 0.05 compared with WT threshold; #, P < 0.05 compared with WT nadir. (C) Average threshold and nadir [Ca2+]ER signals in cells expressing S4–S5 mutants, which are the basis of Fig. 5, D and E. Data are mean ± SD. n = 71–120; *, P < 0.05 compared with WT threshold; #, P < 0.05 compared with WT nadir. NA, not applicable. (D) Correlation between nadir [Ca2+]ER and threshold [Ca2+]ER.](https://cdn.rupress.org/rup/content_public/journal/jgp/154/9/10.1085_jgp.202112869/3/m_jgp_202112869_figs2.png?Expires=1773756248&Signature=H5INelb4scXkODMvn8xtcqn~TuSnf4QFhNSEvcpi0S8DVfHpmTIWbsvjdBNY8rxIk0ZYkF2PK0FkR2kgCz6OrS40y6Xn4u4YQvCRJZWLvisfbA6ldEkUo78NefQe5rNFezswbShyX0oj9jMnsXGvA5ErAjwwoxHsTVbFEot62liNUEIOeM~eV-h8J3Fka5HW4Azq9ln3j3QTpbCNLbNt0jfJGpCK0YTRS9S~hku9iOHajdaMAZ59be~RjlKjioXKm2oxCnQ2fE-bWt047aoDhwZV63oSzJjSHIfXO4b4acPDPK5D8SBjEtB-g0fwY6X0Jh3y8cnNOoA11cOuVQrxWQ__&Key-Pair-Id=APKAIE5G5CRDK6RD3PGA)
[Ca2+]ER in HEK293 cells expressing WT and mutant R Y R2. (A) Calculated [Ca2+]ER (in millimolar) converted from R-CEPIA1er [Ca2+]ER signals in Fig. 3 A. (B) Average [Ca2+]ER signals, which are the basis of Fig. 3, B and C; and Fig. 5, D and E. Data are mean ± SD. n = 71–120; *, P < 0.05 compared with WT threshold; #, P < 0.05 compared with WT nadir. (C) Average threshold and nadir [Ca2+]ER signals in cells expressing S4–S5 mutants, which are the basis of Fig. 5, D and E. Data are mean ± SD. n = 71–120; *, P < 0.05 compared with WT threshold; #, P < 0.05 compared with WT nadir. NA, not applicable. (D) Correlation between nadir [Ca2+]ER and threshold [Ca2+]ER.
[Ca2+]ER in HEK293 cells expressing WT and mutant R Y R2. (A) Calculated [Ca2+]ER (in millimolar) converted from R-CEPIA1er [Ca2+]ER signals in Fig. 3 A. (B) Average [Ca2+]ER signals, which are the basis of Fig. 3, B and C; and Fig. 5, D and E. Data are mean ± SD. n = 71–120; *, P < 0.05 compared with WT threshold; #, P < 0.05 compared with WT nadir. (C) Average threshold and nadir [Ca2+]ER signals in cells expressing S4–S5 mutants, which are the basis of Fig. 5, D and E. Data are mean ± SD. n = 71–120; *, P < 0.05 compared with WT threshold; #, P < 0.05 compared with WT nadir. NA, not applicable. (D) Correlation between nadir [Ca2+]ER and threshold [Ca2+]ER.
Ca2+-dependent [3H]ryanodine binding activity
The properties of cytosolic Ca2+-dependent channel activity were evaluated with the [3H]ryanodine binding assay (Fig. 4). Both WT and mutant RYR2 channels exhibited bell-shaped biphasic Ca2+ dependence (Fig. 4 A). Most CPVT mutations except K4392R showed higher [3H]ryanodine binding than WT, especially at 10−5 M or lower Ca2+ concentrations (Fig. 4 A), suggesting higher channel activity of CPVT mutants at physiological [Ca2+]cyt.
![Ca2+-dependent [3H]ryanodine binding activity and three parameters. (A) Ca2+-dependent [3H]ryanodine binding activity of WT and CPVT mutants. (B) Three parameters (Amax, KACa, and KIca) of bell-shaped Ca2+-dependent [3H]ryanodine binding activity (see Materials and methods). (C–E) Comparison of the three parameters, Amax (C), 1/KACa (D), and KIca (E), among WT and CPVT mutants. The three parameters were plotted as values relative to WT. Data are mean ± SD, n = 3. *, P < 0.05 compared with WT, tested by one-way ANOVA followed by multiple comparison. (F) Calculated [Ca2+]cyt-dependent Ca2+ release activities at resting [Ca2+]cyt (Arest) of CPVT mutants normalized to that of WT. (G) Relationship between average threshold [Ca2+]ER and Arest. (H) Relationship between average oscillation frequency and Arest.](https://cdn.rupress.org/rup/content_public/journal/jgp/154/9/10.1085_jgp.202112869/3/m_jgp_202112869_fig4.png?Expires=1773756248&Signature=CSBVbIkVksRPSNx0dHzdqQ5EOM~wL6dJIP9YhlAwVhxJz9SJj0tk0-z-q572es08wO1cNOOdOPPeY0b7CRaMoKpvBfuawftF9MhUQiNVx6zUvK9MGrFyvT1EBehxoV6GOFFN2VYqnofpuJZpmwhaMgQA5AcU0Y3S9PDUNf8yiGyNk~-HtR6Wf-A4FqjcKx2sTFri2vq64YoHGw6jRqRhXvXH6yItpfA-BOA8ux5GGsL4aTqHo6i52NzxceZpNgXFnG5-ClCBMbyzhAF8ipRtKKbMW7fYa2HyKNhN10NfA6BnaICYhGvVHauclqjXXLSWSUX0vwspOSQwscflhlD7iQ__&Key-Pair-Id=APKAIE5G5CRDK6RD3PGA)
Ca 2+ -dependent [ 3 H]ryanodine binding activity and three parameters. (A) Ca2+-dependent [3H]ryanodine binding activity of WT and CPVT mutants. (B) Three parameters (Amax, KACa, and KIca) of bell-shaped Ca2+-dependent [3H]ryanodine binding activity (see Materials and methods). (C–E) Comparison of the three parameters, Amax (C), 1/KACa (D), and KIca (E), among WT and CPVT mutants. The three parameters were plotted as values relative to WT. Data are mean ± SD, n = 3. *, P < 0.05 compared with WT, tested by one-way ANOVA followed by multiple comparison. (F) Calculated [Ca2+]cyt-dependent Ca2+ release activities at resting [Ca2+]cyt (Arest) of CPVT mutants normalized to that of WT. (G) Relationship between average threshold [Ca2+]ER and Arest. (H) Relationship between average oscillation frequency and Arest.
Ca 2+ -dependent [ 3 H]ryanodine binding activity and three parameters. (A) Ca2+-dependent [3H]ryanodine binding activity of WT and CPVT mutants. (B) Three parameters (Amax, KACa, and KIca) of bell-shaped Ca2+-dependent [3H]ryanodine binding activity (see Materials and methods). (C–E) Comparison of the three parameters, Amax (C), 1/KACa (D), and KIca (E), among WT and CPVT mutants. The three parameters were plotted as values relative to WT. Data are mean ± SD, n = 3. *, P < 0.05 compared with WT, tested by one-way ANOVA followed by multiple comparison. (F) Calculated [Ca2+]cyt-dependent Ca2+ release activities at resting [Ca2+]cyt (Arest) of CPVT mutants normalized to that of WT. (G) Relationship between average threshold [Ca2+]ER and Arest. (H) Relationship between average oscillation frequency and Arest.
We have previously shown that [Ca2+]cyt-dependent Ca2+ release activity of RYR2 can be described by Eqs. 1, 2, and 3 with three parameters: the gain (Amax) and dissociation constants for activating Ca2+ (KACa) and inactivating Ca2+ (KICa) with fixed Hill coefficients (nA = 2.0, nI = 1.0; Fujii et al., 2017; Nozaki et al., 2020; Itoh et al., 2021; Hirose et al., 2022; Fig. 4 B). The determined parameters for the mutant channels are listed in Table 2 and shown in Fig. 4, C–E, as relative values. Six CPVT mutants, V2321M, R2474S, Q4201R, R4497C, K4751Q, and K4805R, had significantly increased Amax, whereas four variants, D3638A, K4392R, H4762P, and I4867M, showed similar or slightly smaller Amax than WT. All CPVT mutants, except for K4392R, showed significant increases in 1/KACa. Among these mutants, R2474S, K4751Q, H4762P, and K4805R showed marked increases in 1/KACa (twofold or more). KICa was increased in most mutants, with the exceptions of D3638A, K4392R, and I4867M.
To gain insight into Ca2+ homeostasis in HEK293 cells expressing WT and mutant RYR2s, it is necessary to know [Ca2+]cyt-dependent Ca2+ release activity at resting Ca2+ (Arest). However, direct measurements by [3H]ryanodine binding are difficult due to the small values at resting Ca2+ (Fig. 4 A). We instead calculated Arest, [Ca2+]cyt-dependent Ca2+ release activity at 100 nM [Ca2+]cyt, by substituting the obtained three parameters (Table 2) into Eqs. 1, 2, and 3, and expressed it as a value relative to WT (Fig. 4 F). This procedure has been shown to effectively evaluate [Ca2+]cyt-dependent Ca2+ release activities of RYR1 (Murayama et al., 2015; Murayama et al., 2016). All mutations, except K4392R, enhanced Arest by a factor of ≥2. H4762P resulted in the greatest Arest, followed by K4805R, K4751Q, and R2474S in that order. The threshold [Ca2+]ER for Ca2+ release was plotted with Arest on a log scale (Fig. 4 G). There was a significant inverse correlation between them, suggesting that the threshold [Ca2+]ER is dependent on the [Ca2+]cyt-dependent Ca2+ release activity of RYR2. A significant correlation was also found between oscillation frequency and Arest, even though the two mutants with the greatest Arest, H4762P and K4805R, rarely showed Ca2+ oscillation (Fig. 4 H).
Effects of artificial mutations on [Ca2+]cyt-dependent Ca2+ release activity and [Ca2+]ER
The above results suggest that Ca2+ oscillation frequency and [Ca2+]ER correlate well with the [Ca2+]cyt-dependent Ca2+ release activity at resting [Ca2+]cyt. We next examined whether this is also the case for artificial mutations associated with various [Ca2+]cyt-dependent Ca2+ release activities. We previously reported that single alanine substitutions at the S4–S5 linker region in RYR1 differentially affect the three parameters of [Ca2+]cyt-dependent Ca2+ release activity, depending on the position of the α helix (Murayama et al., 2011). On the basis of a high degree of sequence homology between RYR1 and RYR2 at the S4–S5 linker region, the homologous mutations were made in RYR2, and their effects on [Ca2+]ER were examined (Fig. 5). The [3H]ryanodine binding assay indicated that the S4–S5 linker region mutations had different degrees of influence on the [Ca2+]cyt-dependent Ca2+ release activity, Arest, depending on the mutation site (Fig. 5, A and B). Arest was greatly enhanced by L4756A (82-fold) and T4754I (9-fold) and moderately enhanced by I4755A and S4757A (2-fold), but significantly suppressed by T4754A (0.6-fold) and S2758A (0.3-fold; Fig. 5 B). These changes due to individual mutations were similar to those observed at the corresponding sites in RYR1 (Murayama et al., 2011).
![Effects of artificial mutations at S4–S5 linker region on [Ca2+]cyt-dependent [3H]ryanodine binding activity and Ca2+homeostasis in HEK293 cells. (A) Ca2+-dependent [3H]ryanodine binding activity of WT and artificial mutants. (B) Calculated relative Arest based on the [3H]ryanodine binding data. (C) Representative [Ca2+]ER signals of WT, L4756A, and S4758A. [Ca2+]ER signals in individual cells were obtained in normal Krebs solution and then in caffeine solution (thick line). At the end of each measurement, the cells were perfused with 0Ca-Krebs solution (thin line), BAPTA-ionomycin-Krebs solution (hatched bar), 0Ca-Krebs solution (thin line), and then 20Ca-ionomycin solution (open bar). (D) Average threshold or resting [Ca2+]ER level obtained from oscillating and nonoscillating cells. Data are mean ± SD. n = 49–120. **, P < 0.01; ***, P < 0.001 compared with WT threshold. (E) Average nadir [Ca2+]ER, which was obtained only from oscillating cells. NA, not applicable because few cells showed Ca2+ oscillation. Data are mean ± SD. n = 30–86. *, P < 0.05; **, P < 0.01; ***, P < 0.001 compared with WT threshold. NA, not applicable because only a small fraction of cells showed nadir. (F) Oscillation frequency in cells expressing RYR2 with the S4–S5 linker region mutations. Data are expressed as violin plot with all the points. Medians are indicated with thick blue line, and quartiles are thin black lines. n = 150 from three dishes. *, P < 0.05; ***, P < 0.001 compared with WT tested by one-way ANOVA followed by multiple comparison. (G) Relationship between threshold/steady-state [Ca2+]ER and Arest. (H) Relationship between oscillation frequency and Arest. WT (black open circle), CPVT (blue filled circle), and S4–S5 linker mutants (pink open circle).](https://cdn.rupress.org/rup/content_public/journal/jgp/154/9/10.1085_jgp.202112869/3/m_jgp_202112869_fig5.png?Expires=1773756248&Signature=YGG7DNMqcRkjBmGAncy2gRvCvZOirxyQ2MZp9JuggmL4GplXxvcwJ42H~R5rC8HMvrDtRXXQEB4b6DXd8Tf6UTiQnmUgOCbZCYHL0Sw3MlbIIRatb5vw0aH6TGdd5dTbkEpV5~h83HUpifJbJ5cD3L7NxCHxPum6IdYCBYD3iTEwGih1j46HHOkQkOJpKKzOOhacrb5XMD6I3WBj6~HZGI27t16YLA3RdGTOtSfqdnGU0uH1dNOAYWyarWeqFpcfvgo7Ra5108122Oc~uR6W3VnAhgfG7-nbtPxztYg~MA7kNQ~WJKSKS0QUnH9WbWWPr9NaKZ6ADcu2qp2-Vvnr0Q__&Key-Pair-Id=APKAIE5G5CRDK6RD3PGA)
Effects of artificial mutations at S4–S5 linker region on [Ca 2+ ] cyt -dependent [ 3 H]ryanodine binding activity and Ca 2+ homeostasis in HEK293 cells. (A) Ca2+-dependent [3H]ryanodine binding activity of WT and artificial mutants. (B) Calculated relative Arest based on the [3H]ryanodine binding data. (C) Representative [Ca2+]ER signals of WT, L4756A, and S4758A. [Ca2+]ER signals in individual cells were obtained in normal Krebs solution and then in caffeine solution (thick line). At the end of each measurement, the cells were perfused with 0Ca-Krebs solution (thin line), BAPTA-ionomycin-Krebs solution (hatched bar), 0Ca-Krebs solution (thin line), and then 20Ca-ionomycin solution (open bar). (D) Average threshold or resting [Ca2+]ER level obtained from oscillating and nonoscillating cells. Data are mean ± SD. n = 49–120. **, P < 0.01; ***, P < 0.001 compared with WT threshold. (E) Average nadir [Ca2+]ER, which was obtained only from oscillating cells. NA, not applicable because few cells showed Ca2+ oscillation. Data are mean ± SD. n = 30–86. *, P < 0.05; **, P < 0.01; ***, P < 0.001 compared with WT threshold. NA, not applicable because only a small fraction of cells showed nadir. (F) Oscillation frequency in cells expressing RYR2 with the S4–S5 linker region mutations. Data are expressed as violin plot with all the points. Medians are indicated with thick blue line, and quartiles are thin black lines. n = 150 from three dishes. *, P < 0.05; ***, P < 0.001 compared with WT tested by one-way ANOVA followed by multiple comparison. (G) Relationship between threshold/steady-state [Ca2+]ER and Arest. (H) Relationship between oscillation frequency and Arest. WT (black open circle), CPVT (blue filled circle), and S4–S5 linker mutants (pink open circle).
Effects of artificial mutations at S4–S5 linker region on [Ca 2+ ] cyt -dependent [ 3 H]ryanodine binding activity and Ca 2+ homeostasis in HEK293 cells. (A) Ca2+-dependent [3H]ryanodine binding activity of WT and artificial mutants. (B) Calculated relative Arest based on the [3H]ryanodine binding data. (C) Representative [Ca2+]ER signals of WT, L4756A, and S4758A. [Ca2+]ER signals in individual cells were obtained in normal Krebs solution and then in caffeine solution (thick line). At the end of each measurement, the cells were perfused with 0Ca-Krebs solution (thin line), BAPTA-ionomycin-Krebs solution (hatched bar), 0Ca-Krebs solution (thin line), and then 20Ca-ionomycin solution (open bar). (D) Average threshold or resting [Ca2+]ER level obtained from oscillating and nonoscillating cells. Data are mean ± SD. n = 49–120. **, P < 0.01; ***, P < 0.001 compared with WT threshold. (E) Average nadir [Ca2+]ER, which was obtained only from oscillating cells. NA, not applicable because few cells showed Ca2+ oscillation. Data are mean ± SD. n = 30–86. *, P < 0.05; **, P < 0.01; ***, P < 0.001 compared with WT threshold. NA, not applicable because only a small fraction of cells showed nadir. (F) Oscillation frequency in cells expressing RYR2 with the S4–S5 linker region mutations. Data are expressed as violin plot with all the points. Medians are indicated with thick blue line, and quartiles are thin black lines. n = 150 from three dishes. *, P < 0.05; ***, P < 0.001 compared with WT tested by one-way ANOVA followed by multiple comparison. (G) Relationship between threshold/steady-state [Ca2+]ER and Arest. (H) Relationship between oscillation frequency and Arest. WT (black open circle), CPVT (blue filled circle), and S4–S5 linker mutants (pink open circle).
We then determined [Ca2+]ER in HEK293 cells. L4756A showed almost complete depletion of [Ca2+]ER and no Ca2+ oscillations (Fig. 5 C middle, Fig. 5, D–F). T4754I, I4755A, and S4757A also significantly reduced the threshold and nadir of [Ca2+]ER. In contrast, T4754A and S4758A showed significantly higher [Ca2+]ER than WT (Fig. 5, C right, D, and E; and Fig. S2 B). S4757A showed more frequent Ca2+ oscillations, whereas S4758A exhibited less frequent oscillations than WT (Fig. 5 F). In T4754I, high-frequency Ca2+ oscillations were observed in 35% of cells (52/150 cells), with a median of 0 due to the high proportion of cells without clear oscillation.
Taking the data of CPVT and S4–S5 mutants together, the relationship between threshold [Ca2+]ER and Arest was plotted (Fig. 5 G). The best-fit semilog lines of CPVT (blue line) and S4–S5 mutants (pink line) were very close to each other. In addition, a similar relationship was observed with CPVT and S4–S5 mutants between Ca2+ oscillation frequency and Arest (Fig. 5 H); that is, in cells with low Arest, Ca2+ oscillations rarely occur, whereas cells with higher RYR2 activity show a higher frequency of Ca2+ oscillations. However, in cells expressing mutant RYR2 with extremely high activity (L4756A), no Ca2+ oscillation occurs mainly due to the depletion of ER Ca2+. In H4762P, K4805R, and T4754I cells, which have high activity but weaker than L4756A, only a small fraction of cells showed obvious oscillations. Importantly our findings indicate that the threshold or steady-state [Ca2+]ER is highly dependent on Arest (Fig. 5 G), the [Ca2+]cyt-dependent Ca2+ release activity of RYR2 at resting [Ca2+]cyt, regardless of CPVT mutation or artificial mutation.
Effects of expression level of RYR2 on Ca2+ homeostasis
We previously showed that the threshold [Ca2+]ER for Ca2+ release decreased with time after the induction of RYR2 expression in HEK293 cells (Uehara et al., 2017). This implies that the threshold [Ca2+]ER is not fixed but is affected by the RYR2 expression levels. We examined the relationship between the threshold [Ca2+]ER and RYR2 expression using WT and R2474S. The protein expression of WT and R2474S increased with time after induction (Fig. 6 A) and reached a quasi-steady state at ∼24 h (Fig. 6 B). There was no significant difference in expression levels between WT and R2474S. The threshold [Ca2+]ER in both WT and R2474S cells decreased with time, but that of R2474S cells decreased faster than that of WT (Fig. 6, C and D). Consequently, the threshold [Ca2+]ER in R2474S cells was lower than that in WT cells at the same expression level (Fig. 6 E). Based on these findings, we hypothesized that the net Ca2+ release rates in situ in RYR2-expressing cells are proportional to the product of the number of RYR2 channels and their own Arest. There was a clear correlation between the threshold [Ca2+]ER and the net Ca2+ release rate, regardless of the type of mutant (Fig. 6 F). These results support the hypothesis that the threshold [Ca2+]ER is determined by both the [Ca2+]cyt-dependent Ca2+ release activity at resting [Ca2+]cyt and the density of RYR2 channels on the ER membrane.
![Correlation between threshold [Ca2+]ERand expression level of RYR2. (A) Typical Western blotting analysis of expression levels for WT and R2474S 0, 4, 8, 12, 18, and 24 h after induction. (B) Time course of average expression level after induction (n = 4 each). Values were normalized to WT and are presented as the mean ± SD. (C) Typical ER Ca2+ signals 2 and 26 h after induction. [Ca2+]ER signals in individual cells were obtained in normal Krebs solution and then in caffeine solution (thick line). (D) Time course of calculated threshold [Ca2+]ER after induction. Data are mean ± SD. n = 40–66. **, P < 0.01; ***, P < 0.001 compared with WT, tested by two-way ANOVA followed by multiple comparison. (E) Relationship between threshold [Ca2+]ER and expression level. Data are mean ± SD. n = 40–66. **, P < 0.01; ***, P < 0.001 compared with WT, tested by two-way ANOVA followed by multiple comparison. (F) Correlation between threshold [Ca2+]ER and net [Ca2+]cyt-dependent Ca2+ release activity at resting [Ca2+]cyt, a product of Arest and expression. Source data are available for this figure: SourceData F6.](https://cdn.rupress.org/rup/content_public/journal/jgp/154/9/10.1085_jgp.202112869/3/m_jgp_202112869_fig6.png?Expires=1773756248&Signature=bzysZCWiNL-iJqpkxbTfyl86-p~KyfZagYO13YGrwVCELQ0sp9iu5n2m24~o-SVa7feQKEt~eihMMsklFlhM1K5qlobFCUPl~PWZEdWQ~G7WoE6-~RBy3LfksXj~Tm9HUbfp17detHNIdigdVK4G6lK0BbGUbvCmqyzR8XfjhGXSyPvB~0kcYmM9EncqpwIZmXAaunjJ6q5UNvnqVv1I1MXRJnEq4t9N-aCbUlGnEqe3NyqKqD2CxqZwjA7xx-XdOzEljKbLOrbKZp5kHwKMGDCJmT0~pnsA2VKm4zFuz-l2I5c1o1Ijc26qI93xZsIBOEmfkZEwyU2wcM8er-C1QA__&Key-Pair-Id=APKAIE5G5CRDK6RD3PGA)
Correlation between threshold [Ca2+]ERand expression level of RYR2. (A) Typical Western blotting analysis of expression levels for WT and R2474S 0, 4, 8, 12, 18, and 24 h after induction. (B) Time course of average expression level after induction (n = 4 each). Values were normalized to WT and are presented as the mean ± SD. (C) Typical ER Ca2+ signals 2 and 26 h after induction. [Ca2+]ER signals in individual cells were obtained in normal Krebs solution and then in caffeine solution (thick line). (D) Time course of calculated threshold [Ca2+]ER after induction. Data are mean ± SD. n = 40–66. **, P < 0.01; ***, P < 0.001 compared with WT, tested by two-way ANOVA followed by multiple comparison. (E) Relationship between threshold [Ca2+]ER and expression level. Data are mean ± SD. n = 40–66. **, P < 0.01; ***, P < 0.001 compared with WT, tested by two-way ANOVA followed by multiple comparison. (F) Correlation between threshold [Ca2+]ER and net [Ca2+]cyt-dependent Ca2+ release activity at resting [Ca2+]cyt, a product of Arest and expression. Source data are available for this figure: SourceData F6.
Correlation between threshold [Ca2+]ERand expression level of RYR2. (A) Typical Western blotting analysis of expression levels for WT and R2474S 0, 4, 8, 12, 18, and 24 h after induction. (B) Time course of average expression level after induction (n = 4 each). Values were normalized to WT and are presented as the mean ± SD. (C) Typical ER Ca2+ signals 2 and 26 h after induction. [Ca2+]ER signals in individual cells were obtained in normal Krebs solution and then in caffeine solution (thick line). (D) Time course of calculated threshold [Ca2+]ER after induction. Data are mean ± SD. n = 40–66. **, P < 0.01; ***, P < 0.001 compared with WT, tested by two-way ANOVA followed by multiple comparison. (E) Relationship between threshold [Ca2+]ER and expression level. Data are mean ± SD. n = 40–66. **, P < 0.01; ***, P < 0.001 compared with WT, tested by two-way ANOVA followed by multiple comparison. (F) Correlation between threshold [Ca2+]ER and net [Ca2+]cyt-dependent Ca2+ release activity at resting [Ca2+]cyt, a product of Arest and expression. Source data are available for this figure: SourceData F6.
Simulation of [Ca2+]cyt-dependent and [Ca2+]ER-dependent RYR2 activity by a model incorporating luminal Ca2+ regulation
The significant correlation between threshold [Ca2+]ER and Arest suggests that threshold [Ca2+]ER may be mainly determined by [Ca2+]cyt-dependent Ca2+ release activity at resting [Ca2+]cyt as expressed in Eqs. 1, 2, and 3. We attempted to test the plausibility of this hypothesis by using a mathematical model. Before performing simulations of Ca2+ dynamics, we initially considered introducing the luminal Ca2+ regulation into Eqs. 1, 2, and 3 because RYR2 has been reported to be enhanced at high luminal Ca2+ (Bassani et al., 1995; Lukyanenko et al., 1996; Sitsapesan and Williams, 1997; Jiang et al., 2005; Qin et al., 2008). To accomplish this, we examined the possibility of including the luminal Ca2+ regulation in Amax or KACa. When we incorporated it into Amax, however, the maximal [Ca2+]cyt-dependent activity became very small at low [Ca2+]ER, which could not explain experimental data at all. Therefore, we included luminal regulation in KACa, that is, KACa is reduced to KACa,L, as described by Eqs. 4, 5, and 6, and examined whether the actual experimental data such as [3H]ryanodine binding and bilayer single-channel activity could be reasonably reproduced. KER,Ca was set as 3 mM considering that the activation of WT RYR2 by luminal Ca2+ occurs at ∼3 mM or more, and E was arbitrarily defined as 50 considering the activating ratio at high luminal Ca2+.
Fig. 7 shows the simulated static effects of luminal Ca2+ on putative [Ca2+]cyt-dependent [3H]ryanodine binding and bilayer single-channel experiments. Under experimental conditions for [3H]ryanodine binding, we assumed that [Ca2+]ER was equilibrated with [Ca2+]cyt (i.e., [Ca2+]ER = [Ca2+]cyt), because [3H]ryanodine binding did not change at all when the ER membrane was made permeable to Ca2+ by Ca2+ ionophore treatment (Fig. 7 A). Fig. 7 B shows the calculated [Ca2+]cyt-dependent RYR2 channel activity for WT and R2474S without (solid lines) and with (dotted lines) luminal regulation. Although the addition of luminal control makes the slope of Ca2+ activation slightly steeper, there were only minor differences between the two curves for both RYR2 WT and R2474S. This indicates that we can use the three parameters determined with [3H]ryanodine binding, even with the luminal regulation.
![Effects of putative luminal regulation on RYR2 activity. (A) Effects of Ca2+ ionophore ionomycin (5 μM) on [3H]ryanodine binding in RYR2 WT microsomal fraction. (B–D) Calculated activities of WT (black) and R2474S (red) RYR2 without (solid line) and with (dotted line) luminal regulation using Eqs. 1, 2, and 3, and Eqs. 4, 5, and 6, respectively. E and KER,Ca were set to 50 and 3 mM, respectively, in Eq. 6. (B) Calculated [Ca2+]cyt-dependent activity assuming [3H]ryanodine binding where [Ca2+]cyt = [Ca2+]ER. (C) Calculated [Ca2+]ER-dependent activity at [Ca2+]cyt = 10−7 M. (D) Calculated [Ca2+]cyt-dependent activity at [Ca2+]ER = 10−3 M. (E) Correlation between relative RYR2 activity at resting [Ca2+]cyt with (Arest,L) and without (Arest) luminal regulation.](https://cdn.rupress.org/rup/content_public/journal/jgp/154/9/10.1085_jgp.202112869/3/m_jgp_202112869_fig7.png?Expires=1773756248&Signature=vJ8pN7iLomcerC07L0-dVdUxwaeftQgtoQXViDqXA6klXg3ABSMaKUZk-vsqYg7c2E~N1ui9UA8o6ceJ-oyPMp4vmBgUwiFulzXpoHxcAVdQS5QDWHmkfnnKOFCeX~pPjiw-1loC8jxj6h7nkMd8IFfqHehfmZVO-uRg6Zd-VZRD5lxqvDbQCoYrypZwszuv7QKpiq1tTSYkd9ZSN33Swwp6I6-Kz4bVZcsOIxFbG0euJFoKgHBLtb7BvAoXN-GjM6ChZjnfptu3ANq2OSiDGT7EEFbcTSyEYxdlG95Ad6pp-Hmb--Drlqlksh3VH5-0QgW6vwuhC9nq33oz0KxhwQ__&Key-Pair-Id=APKAIE5G5CRDK6RD3PGA)
Effects of putative luminal regulation on RYR2 activity. (A) Effects of Ca2+ ionophore ionomycin (5 μM) on [3H]ryanodine binding in RYR2 WT microsomal fraction. (B–D) Calculated activities of WT (black) and R2474S (red) RYR2 without (solid line) and with (dotted line) luminal regulation using Eqs. 1, 2, and 3, and Eqs. 4, 5, and 6, respectively. E and KER,Ca were set to 50 and 3 mM, respectively, in Eq. 6. (B) Calculated [Ca2+]cyt-dependent activity assuming [3H]ryanodine binding where [Ca2+]cyt = [Ca2+]ER. (C) Calculated [Ca2+]ER-dependent activity at [Ca2+]cyt = 10−7 M. (D) Calculated [Ca2+]cyt-dependent activity at [Ca2+]ER = 10−3 M. (E) Correlation between relative RYR2 activity at resting [Ca2+]cyt with (Arest,L) and without (Arest) luminal regulation.
Effects of putative luminal regulation on RYR2 activity. (A) Effects of Ca2+ ionophore ionomycin (5 μM) on [3H]ryanodine binding in RYR2 WT microsomal fraction. (B–D) Calculated activities of WT (black) and R2474S (red) RYR2 without (solid line) and with (dotted line) luminal regulation using Eqs. 1, 2, and 3, and Eqs. 4, 5, and 6, respectively. E and KER,Ca were set to 50 and 3 mM, respectively, in Eq. 6. (B) Calculated [Ca2+]cyt-dependent activity assuming [3H]ryanodine binding where [Ca2+]cyt = [Ca2+]ER. (C) Calculated [Ca2+]ER-dependent activity at [Ca2+]cyt = 10−7 M. (D) Calculated [Ca2+]cyt-dependent activity at [Ca2+]ER = 10−3 M. (E) Correlation between relative RYR2 activity at resting [Ca2+]cyt with (Arest,L) and without (Arest) luminal regulation.
Fig. 7 C shows calculated [Ca2+]ER-dependent RYR2 activity at constant [Ca2+]cyt (100 nM). The [Ca2+]ER-dependent RYR2 activity increased with [Ca2+]ER by the incorporation of luminal regulation as expected, and the augmentation was more prominent in R2474S than in WT. Simulated [Ca2+]cyt-dependent RYR2 activity in the presence of 1 mM [Ca2+]ER is shown in Fig. 7 D. [Ca2+]cyt dependence for activating Ca2+ shifted leftward by incorporation of luminal regulation. These simulations suggest that apparent potentiation of RYR2 activity by luminal Ca2+ in CPVT mutant RYR2s (Fig. 7 C) is explained by increased [Ca2+]cyt-dependent activity without considering a change in parameters for ER Ca2+ regulation, E, and KER,Ca. It should be noted that [Ca2+]cyt-dependent activity at pCa 7.0 with and without luminal regulation—Arest,L and Arest, respectively—are nearly proportional as shown in Fig 7 E, indicating that the relative [Ca2+]cyt-dependent RYR2 activity at resting [Ca2+]cyt (Figs. 4 F and 5 B) does not change even in the presence of luminal regulation.
Simulation of cellular Ca2+ dynamics using mathematical model
Because Eqs. 4, 5, and 6 were able to reasonably reproduce the static effects of luminal Ca2+, we then attempted to mathematically describe calcium dynamics. Cells were assumed to comprise cytosolic and ER compartments (Fig. 8 A), where the transport of Ca2+ between the cytosol and ER involves Ca2+ release through RYR2, saturable ER Ca2+ uptake by SERCA, and a passive leakage pathway that is intrinsic to HEK293 cells. Cellular Ca2+ influx via the plasma membrane is assumed to obey zero-order kinetics provided that the extracellular bulk concentration is constant and Ca2+ efflux is driven by a presumptive Ca2+ pump. In addition, we assumed that SOCE operates when ER Ca2+ is depleted (Rios, 2010, 2013). In actual cells, it is necessary to consider the effect of diffusion; however, for the sake of simplicity, we assumed a rapid equilibrium of mobilized Ca2+. First, we tested if WT Ca2+ oscillations were reproduced by the model. For each mutant, the Amax, KACa, and KICa were the experimental values when nA and nI were regarded as 2 and 1, respectively (Table 2). The Vratio, Ccyt, Kcyt, CER, and KER values are listed in Table 3. The E and KER,Ca were set at 50 and 3 mM, respectively. The ε, kleak, Vmax,ER, Km,ER, vin, vin,SOC, KSOC, Vmax,out, and Km,out were set at 1,200, 0.035/s, 0.24 mM/s, 0.0003 mM, 0.001 mM/s, 0.002 mM/s, 0.170 mM, 0.01 mM/s, and 0.0004 mM, respectively (Fig. 8 A, right), to satisfy the following three conditions: (1) the Ca2+ concentration in ER at a steady state was 0.6–0.8 mM in mock HEK293 cells; (2) the maximum Ca2+ concentration in ER was 0.3–0.5 mM with a periodic time of ∼60 s for WT RYR2 cells; and (3) Ca2+ maximum concentration in ER was 0.1–0.2 mM in R2474S mutant.
![Mathematical model of Ca2+homeostasis based on [Ca2+]cyt-dependent Ca2+release activity. (A) Ca2+ dynamics model (left) and adjusted parameters for the simulation (right). (B) Typical traces of simulated [Ca2+]cyt and [Ca2+]ER in WT, R4497C, R2474S, and H4762P. (C–E) Relation between simulated oscillation frequency versus Arest (C), simulated peak and resting [Ca2+]cyt versus Arest (D), [Ca2+]ER versus Arest (E). In these calculations, Arest was changed by changing Amax (green dotted lines) or KACa (orange solid lines). Note that the relationship is close to a straight line in the Arest range of 0.3–10.](https://cdn.rupress.org/rup/content_public/journal/jgp/154/9/10.1085_jgp.202112869/3/m_jgp_202112869_fig8.png?Expires=1773756248&Signature=aIrcc5PUITQKfJ30LsalieplwICEhqZ7XdmclmOVW2vE2ns~0PECeEP0HWHzut9A2fkdBxQGeZ2NLVAk~zmAyZKiuQDBMWexFUaWNTDTaYDwzHjvXje4iQeCsfq5djAoZlZM5nTKcZDXeQYzU~EZCXBoJKzBiYbQSiQbrlhK50cNc3ejUtvQ6fEz3rW0YVoGLiKyYNJDVJ86B64gV~AmeMrXskaHNzs0OuNDPAe-oGoST561damLZTPGov8rfCnf4WrAVMrrMdKlJjKnhoDMljlidqAvaVBqUvi4qVXhLDMsRYUI-R9c-8kQbsfJY3-BgXozo87khOVfz--G0GSVNw__&Key-Pair-Id=APKAIE5G5CRDK6RD3PGA)
Mathematical model of Ca 2+ homeostasis based on [Ca 2+ ] cyt -dependent Ca 2+ release activity. (A) Ca2+ dynamics model (left) and adjusted parameters for the simulation (right). (B) Typical traces of simulated [Ca2+]cyt and [Ca2+]ER in WT, R4497C, R2474S, and H4762P. (C–E) Relation between simulated oscillation frequency versus Arest (C), simulated peak and resting [Ca2+]cyt versus Arest (D), [Ca2+]ER versus Arest (E). In these calculations, Arest was changed by changing Amax (green dotted lines) or KACa (orange solid lines). Note that the relationship is close to a straight line in the Arest range of 0.3–10.
Mathematical model of Ca 2+ homeostasis based on [Ca 2+ ] cyt -dependent Ca 2+ release activity. (A) Ca2+ dynamics model (left) and adjusted parameters for the simulation (right). (B) Typical traces of simulated [Ca2+]cyt and [Ca2+]ER in WT, R4497C, R2474S, and H4762P. (C–E) Relation between simulated oscillation frequency versus Arest (C), simulated peak and resting [Ca2+]cyt versus Arest (D), [Ca2+]ER versus Arest (E). In these calculations, Arest was changed by changing Amax (green dotted lines) or KACa (orange solid lines). Note that the relationship is close to a straight line in the Arest range of 0.3–10.
The mathematical model successfully reproduced the periodic cytoplasmic Ca2+ increase and [Ca2+]ER decrease in WT cells. This was similar to the [Ca2+]cyt and [Ca2+]ER observed in the experiments (Fig. 8 B, left). Then, Ca2+ oscillations for mutant cells were calculated using the same constants and Ca2+ release activity with the three parameters for individual mutants. The model also effectively reproduced a reduced threshold [Ca2+]ER for Ca2+ release and an increased oscillation frequency in R4497C and R2474S (Fig. 8 B, middle) and completely diminished Ca2+ oscillation with a further decrease in [Ca2+]ER in H4762P cells (Fig. 8 B, right). We then calculated the oscillation frequency, [Ca2+]cyt, and [Ca2+]ER at various Arest values, by changing the Amax or KACa values, and plotted their values in Fig. 8, C–E. Good correlations of simulated oscillation frequency versus Arest (Fig. 8 C), peak and resting [Ca2+]cyt versus Arest (Fig. 8 D), and simulated threshold [Ca2+]ER versus Arest (Fig. 8 E) were reproduced in the Arest range of 0.3–10. Furthermore, the lack of oscillation in cells with very large Arest, (>10), that is, H4762P and L4756A, was also reproduced (Fig. 8, C–E). These results strongly support the idea that [Ca2+]ER is largely determined by the [Ca2+]cyt-dependent Ca2+ release activity at resting [Ca2+]cyt.
Effects of mutations at the putative luminal Ca2+ sensing site on Ca2+ homeostasis in HEK293 cells and [3H]ryanodine binding
Chen et al. (2014) have proposed that a glutamate residue (E4872) in the helix bundle crossing the proposed gate of the RYR2 is important for luminal Ca2+ sensing, in which mutation in the residue (E4872A or E4872Q) abolished SOICR but not cytosolic RYR2 Ca2+ activation. To test this hypothesis, we carried out [Ca2+]ER measurements of these mutants in HEK293 cells. Introduction of E4872A or E4872Q mutation in WT, R2474S, and R4497C increased average [Ca2+]ER signals (Fig. S3, A and B) and no or substantially reduced Ca2+ oscillations (Fig. S3, A and C). This phenomenon was consistent with those reported previously (Chen et al., 2014).
![Effects of mutations at the putative ER Ca2+ sensing site, E4872, on Ca2+ signaling and [3H]ryanodine binding of RYR2. (A) Typical [Ca2+]ER signals from R-CEPIA1er in cells expressing WT or mutant RYR2. Data were obtained in normal Krebs solution followed by 10 mM caffeine Krebs solution (black line). (B) Average threshold/resting [Ca2+]ER. Data are mean ± SD; n = 58–89. ***, P < 0.001 compared with WT. #, P < 0.05 compared with EQ. (C) Ca2+ oscillation frequencies in cells expressing WT and mutant RYR2. Data are expressed as violin plot with all the points. Medians are indicated with thick black lines, and quartiles are indicated with thin black lines. n = 70. ***, P < 0.001 compared with WT. #, P < 0.05 compared with EQ. (D) Effects of E4871A (left) and E4871Q (right) mutations on Ca2+-dependent [3H]ryanodine binding activity. EA, E4871A; RS/EA, R2474S/E4871A; RC/EA, R4497C/E4871A; EQ, E4871Q; RS/EQ, R2474S/E4871Q; RC/EQ, R4497C/E4871Q.](https://cdn.rupress.org/rup/content_public/journal/jgp/154/9/10.1085_jgp.202112869/3/m_jgp_202112869_figs3.png?Expires=1773756248&Signature=5OeMdJb7W1FU9VwCuADewN~LsyxCKfNhuZgF7CzUUeIl4k-dRswyK1WAXWxMO4swakhmoHKbaAjuOs0VEx1gje644Jv8eWZu1wLKxHfxhyj30bZ43QEPbM~e2g988TcOM0-q~6892E42Nm~qa2EjTpSxtJV0FE-A-042qW~WFMrKryV2BayswO8mjDETkiUKG6Kj-HHEZdz2J4sRim5LsOrfckn2xzj4YVJ9jTZks62~z~raHo-dCvRcF0ycRyIGxxPRgt2MYP6ya4cFZLYzBl~XAN7kY27V7NGdkIYy8dG9o5zu0VCnMpbEY77~WuKz2SEMMe~l7WNbU8uuYeZm4g__&Key-Pair-Id=APKAIE5G5CRDK6RD3PGA)
Effects of mutations at the putative ER Ca 2+ sensing site, E4872, on Ca 2+ signaling and [ 3 H]ryanodine binding of RYR2. (A) Typical [Ca2+]ER signals from R-CEPIA1er in cells expressing WT or mutant RYR2. Data were obtained in normal Krebs solution followed by 10 mM caffeine Krebs solution (black line). (B) Average threshold/resting [Ca2+]ER. Data are mean ± SD; n = 58–89. ***, P < 0.001 compared with WT. #, P < 0.05 compared with EQ. (C) Ca2+ oscillation frequencies in cells expressing WT and mutant RYR2. Data are expressed as violin plot with all the points. Medians are indicated with thick black lines, and quartiles are indicated with thin black lines. n = 70. ***, P < 0.001 compared with WT. #, P < 0.05 compared with EQ. (D) Effects of E4871A (left) and E4871Q (right) mutations on Ca2+-dependent [3H]ryanodine binding activity. EA, E4871A; RS/EA, R2474S/E4871A; RC/EA, R4497C/E4871A; EQ, E4871Q; RS/EQ, R2474S/E4871Q; RC/EQ, R4497C/E4871Q.
Effects of mutations at the putative ER Ca 2+ sensing site, E4872, on Ca 2+ signaling and [ 3 H]ryanodine binding of RYR2. (A) Typical [Ca2+]ER signals from R-CEPIA1er in cells expressing WT or mutant RYR2. Data were obtained in normal Krebs solution followed by 10 mM caffeine Krebs solution (black line). (B) Average threshold/resting [Ca2+]ER. Data are mean ± SD; n = 58–89. ***, P < 0.001 compared with WT. #, P < 0.05 compared with EQ. (C) Ca2+ oscillation frequencies in cells expressing WT and mutant RYR2. Data are expressed as violin plot with all the points. Medians are indicated with thick black lines, and quartiles are indicated with thin black lines. n = 70. ***, P < 0.001 compared with WT. #, P < 0.05 compared with EQ. (D) Effects of E4871A (left) and E4871Q (right) mutations on Ca2+-dependent [3H]ryanodine binding activity. EA, E4871A; RS/EA, R2474S/E4871A; RC/EA, R4497C/E4871A; EQ, E4871Q; RS/EQ, R2474S/E4871Q; RC/EQ, R4497C/E4871Q.
We then determined [Ca2+]cyt-dependent [3H]ryanodine binding of these mutations. Introduction of E4872A mutation in WT (E4872A), R2474S (R2474S/E4872A), and R4497C (R4497C/E4872A) caused no measurable [3H]ryanodine binding (Fig. S3 D). The introduction of E4872Q mutation also abolished [3H]ryanodine binding in WT (E4872Q), but measurable binding was observed with double mutants, R2474S/E4872Q and E4497C/E4872Q, in which the former exhibited higher activity than the latter (Fig. S3 D, right). This order was the same as that of mutants without E4872Q mutation (Fig. 4, A and C). These results indicate that the primary effects of the E4872A and E4872Q mutations on Ca2+-dependent [3H]ryanodine binding was a reduction in Amax, and thereby a considerable reduction in [Ca2+]cyt-dependent RYR2 activity.
Pathological relevance of [Ca2+]cyt-dependent Ca2+ release activity in CPVT mutations
The results in Figs. 2, 3, and 4 successfully provided the [Ca2+]cyt-dependent Ca2+ release activities of individual CPVT mutants examined in this study. To address their pathological relevance, we plotted the age of onset of arrhythmia or SCD against Arest (Fig. 9). Mutations with high Arest, R2474S, K4751Q, and K4805R, caused disease at a young age (<8 yr), and only one or two (twin) individuals were affected in the family, suggesting very low penetrance. In contrast, two of the mild mutations, Q4201R and R4497C, were detected in multiple individuals of various ages of onset from young to old age, indicating relatively high penetrance (Laitinen et al., 2001; Priori et al., 2001). Only a single case has been reported for each of the other mutations with moderate [Ca2+]cyt-dependent Ca2+ release activity, V2321M, D3638A, and I4867M. There was a significant difference in the ages of onset between patients with moderate and severe RYR2 mutations. The H4762P proband carries another mutation, G4662S, and her three family members with the H4762P mutation have been reported to be asymptomatic. Notably, a patient with K4392R did not show any difference from the WT. The mother of this patient had the same mutation and was asymptomatic (Arakawa et al., 2015). Recently, K4392R (rs753733164) was found to be a benign variant that does not exert arrhythmogenic effects in the majority of its carriers.

Relationship between the age of onset of arrhythmic symptom or sudden cardiac death and relative A rest of CPVT mutants. Individual points indicate individual RYR2 mutation carriers. Note that some carriers of Q4201R and R4497C were asymptomatic even in old age. The data for the H4762P patient are not plotted because she had two mutations. *, P < 0.05 compared with moderate (green bar) and severe (purple bar) groups tested by unpaired t test.
Relationship between the age of onset of arrhythmic symptom or sudden cardiac death and relative A rest of CPVT mutants. Individual points indicate individual RYR2 mutation carriers. Note that some carriers of Q4201R and R4497C were asymptomatic even in old age. The data for the H4762P patient are not plotted because she had two mutations. *, P < 0.05 compared with moderate (green bar) and severe (purple bar) groups tested by unpaired t test.
Discussion
CPVT mutations in RYR2 are prone to cause abnormal spontaneous Ca2+ release, which leads to lethal arrhythmia. The HEK293 expression system is a good tool for studying the properties of mutant RYR2 and their effects on Ca2+ homeostasis. To explore the mechanisms controlling spontaneous Ca2+ release and threshold [Ca2+]ER level for the release, we measured [Ca2+]cyt and [Ca2+]ER in cells expressing WT and mutant RYR2 and determined [Ca2+]cyt-dependent Ca2+ release activity with a [3H]ryanodine binding assay. Our quantitative analysis indicates that all the CPVT mutations are associated with enhanced [Ca2+]cyt-dependent Ca2+ release activity at resting [Ca2+]cyt and enable ranking of the severity of these mutations. The model simulation reasonably explains the experimental results. Our results indicate that the [Ca2+]cyt-dependent Ca2+ release activity of RYR2 is critically involved in determining the threshold [Ca2+]ER for spontaneous Ca2+ release.
[Ca2+]cyt-dependent Ca2+ release activity at physiological [Ca2+]cyt is enhanced in all CPVT mutants
Chen and colleagues (Jiang et al., 2004; Jiang et al., 2005) have reported that CPVT mutations reduce threshold [Ca2+]ER for spontaneous Ca2+ release. Based on the findings that many CPVT mutations increase [Ca2+]ER-dependent activity without altering [Ca2+]cyt-dependent RYR2 activity, they suggested that these mutations increase luminal Ca2+ sensitivity. In this study, we confirmed the decrease in threshold [Ca2+]ER for spontaneous Ca2+ release by CPVT mutations. However, we show that all CPVT mutations have increased [Ca2+]cyt-dependent activity, which is in marked contrast to their finding.
A significant difference between this and the previous studies is the assessment of Ca2+-dependent [3H]ryanodine binding activity of the mutant RYR2. For example, R2474S and R4497C mutations did not significantly affect [Ca2+]cyt-dependent [3H]ryanodine binding in the studies by Jiang et al. (2004, 2005). In our studies, however, the two mutants exhibited increased [3H]ryanodine binding (Fig. 4).
There are two possible reasons for this difference. One is the data presentation of [3H]ryanodine binding. We expressed the binding activity as B/Bmax, in which the determined activity was normalized by the number of total RYR2 molecules in the preparation (Murayama and Kurebayashi, 2011; Murayama et al., 2015; Fujii et al., 2017; Uehara et al., 2017; see Materials and methods). Using this method, we showed that most CPVT mutants, including R2474S and R4497C, significantly increased the Amax (Fig. 4). In contrast, in some studies, the binding activity was normalized by the peak values at the optimal Ca2+ (pCa ∼4; Jiang et al., 2004; Jiang et al., 2005; Xiao et al., 2016). This is useful for evaluating the [Ca2+]cyt dependence but masks the difference in Amax values.
The second reason is the differences in experimental conditions. The Ca2+ sensitivity and maximum value of [3H]ryanodine binding vary depending on ionic strength, pH, Mg2+, and nucleotide concentrations (Meissner et al., 1997; Jiang et al., 2004; Chugun et al., 2007; Murayama and Kurebayashi, 2011). In addition, a difference in sample condition (microsomes or solubilized proteins) also affects the activity values (Murayama and Ogawa, 2004). These conditions affect not only the three parameters (Amax, KACa, and KICa) but also the Hill coefficients (nACa and nICa) in Eqs. 1, 2, and 3. Thus, the differences between ours and theirs in pH (7.0 versus 7.4), Mg2+ (1.0 versus 0 mM), and preparation (microsomes versus solubilized proteins) might contribute to the difference in experimental results.
In addition to the above, the fitting and extrapolation procedures using Eqs. 1, 2, and 3 enabled quantitative evaluation of [Ca2+]cyt-dependent Ca2+ release activity at resting [Ca2+]cyt, at which the direct determination of [3H]ryanodine binding activity is difficult. In particular, since the parameter KACa contributes to [Ca2+]cyt-dependent Ca2+ release activity with a squared weight, the determination of KACa by a fitting procedure is important. In fact, in the study by Jiang et al. (2005), R2474S appeared to have a smaller KACa than the WT. Although the activities at resting [Ca2+]cyt are very low compared with the maximum value, they are not zero and certainly cause Ca2+ release to affect basal [Ca2+]ER. A similar conclusion was obtained with HEK293 cells expressing RYR1 (Murayama et al., 2015; Murayama et al., 2016; Murayama et al., 2018). Consequently, the CPVT mutations increase [Ca2+]cyt-dependent Ca2+ release activity at resting [Ca2+]cyt, although the mechanism of activation is mutation-site specific; some substantially increased sensitivity for KACa, whereas others predominantly increased Amax.
[Ca2+]cyt-dependent Ca2+ release activity mainly determines threshold [Ca2+]ER
Previous reports have indicated that HEK293 cells expressing RYR2 with CPVT mutations show reduced threshold [Ca2+]ER for spontaneous Ca2+ release (Jiang et al., 2004; Jiang et al., 2005; Xiao et al., 2016). Using R-CEPIA1er, an ER-targeted Ca2+ indicator and proteins with low Ca2+ affinity (KD = 565 μM) and determining Fmax and Fmin values in the Ca2+ ionophore–containing solutions (Suzuki et al., 2014; Bovo et al., 2016; Fujii et al., 2017; Uehara et al., 2017), we confirmed these results in a more quantitative manner. There are two possible explanations for this phenomenon: [Ca2+]ER is determined either by [Ca2+]cyt-dependent Ca2+ release activity, the regulation by Ca2+ on the cytoplasmic side, or by the SOICR mechanism, which is regulated by Ca2+ on the ER luminal side. Our results indicate a good correlation between [Ca2+]cyt-dependent Ca2+ release activity at resting [Ca2+]cyt and [Ca2+]ER (Fig. 5 G). More precisely, the threshold [Ca2+]ER for Ca2+ release in individual mutants varies depending on the net permeability of Ca2+ through RYR2 channels: (1) with the same mutant, higher expression of RYR2 channels lowers the threshold [Ca2+]ER; (2) at the same expression level, RYR2 mutants with higher [Ca2+]cyt-dependent Ca2+ release activity presented a lower threshold [Ca2+]ER; and (3) the [Ca2+]ER is inversely correlated with net [Ca2+]cyt-dependent Ca2+ release activity at rest, as a product of mutant-specific [Ca2+]cyt-dependent Ca2+ release activity at rest and density of RYR2 molecules in the cell, on the ER membrane (Fig. 6 F). Xiao et al. (2016), also reported that many RYR2 CPVT mutations enhance cytosolic Ca2+ activation and decrease threshold [Ca2+]ER for Ca2+ release. These results support the idea that [Ca2+]cyt-dependent Ca2+ release activity, but not SOICR, mainly determines threshold [Ca2+]ER.
A model compatible with [Ca2+]cyt-dependent and [Ca2+]ER-dependent RYR2 activity and effects of mutations at putative luminal Ca2+ sensing site
To express both bell-shaped cytoplasmic [Ca2+]cyt-dependent RYR2 activity (Murayama and Kurebayashi, 2011; Uehara et al., 2017; Nozaki et al., 2020; Hirose et al., 2022) and [Ca2+]ER-dependent activations at ∼1 mM or more (Bassani et al., 1995; Lukyanenko et al., 1996; Sitsapesan and Williams, 1997; Gyorke and Gyorke, 1998; Jiang et al., 2004), we incorporated parameters for luminal Ca2+ activation (E and KLCa) into Eqs. 1, 2, and 3 to obtain Eqs. 4, 5, and 6, where we assumed that KACa is reduced by [Ca2+]ER. These equations predict that an increase in [Ca2+]cyt-dependent RYR2 activity causes an apparent increase in [Ca2+]ER-dependent RYR2 activity with unchanged E and KLCa (Fig. 7 C). This can be easily understood by considering that the channel activity at resting [Ca2+]cyt was originally higher in CPVT mutants than WT, even though their absolute values are apparently small, and luminal activation equally enhances the [Ca2+]cyt-dependent activity to make them more visible.
To obtain further insight into the luminal Ca2+ regulation, we examined effects of mutations at the putative luminal Ca2+ sensing site, E4872A or E4872Q, which have been reported to increase SOICR threshold with unchanged cytosolic RYR2 Ca2+ activation (Chen et al., 2014). Contrary to our expectation, these mutations exhibited strongly suppressed [Ca2+]cyt-dependent [3H]ryanodine binding, the properties of which are similar to those of loss-of-function disease mutations (Fujii et al., 2017; Hirose et al., 2022). E4872 is located in the cytoplasmic side of S6 segment and may form an intersubunit salt-bridge with R4874 (Peng et al., 2016). Thus, E4872 may not contribute to RYR2 activation by luminal Ca2+. Further structural and functional studies of RYR2 will be required to understand the molecular basis of luminal Ca2+ activation of RYR2.
Mathematical model for Ca2+ handling in cells expressing RYR2
We simulated Ca2+ influx and efflux across the cytoplasmic and ER membranes in HEK293 cells using a minimal essential model instead of detailed models with many components (Fig. 8). Our simple model reasonably reproduced the Ca2+ oscillations and the effects of changes in [Ca2+]cyt-dependent Ca2+ release activity on Ca2+ oscillation frequency, threshold [Ca2+]ER level, and peak amplitude of [Ca2+]cyt in WT and mutant RYR at constant luminal Ca2+ regulation parameters, E and KER,Ca. However, the simulation and actual measurements suggest that Ca2+ oscillations may not always be observed. In any case, resting/threshold [Ca2+]ER levels will vary depending on the RYR2 activity, with or without oscillations. Ca2+ oscillation does not occur if the RYR2 activity is too low or too high (Fig. 3 A, H4762P; Fig. 5 C, L4756A; and Fig. 8, C–E). In addition, Ca2+ oscillations were rarely seen in HEK293 cells expressing WT or mutant RYR1, but [Ca2+]ER drastically changes depending on RYR1 activity (Murayama et al., 2015; Murayama et al., 2016). The Amax, KACa, KICa, nACa, and dependence on [Ca2+]ER of RYR1 are different from those of RYR2. Moreover, it should be noted that in the actual experiments, there were cell-to-cell variations in oscillation frequency, threshold and nadir [Ca2+]ER, and peak [Ca2+]cyt. These variations are probably due to cell-to-cell variations in Ca2+ influx and efflux parameters.
Ca2+ oscillations would appear when the [Ca2+]cyt-dependent Ca2+ release parameters and the Ca2+ flux parameters were well balanced. They can occur under conditions favorable for the regenerative activation of RYR2. For example, Ca2+ oscillation is probably more likely to occur with higher Hill coefficients for activating [Ca2+]cyt, because released Ca2+ will increase [Ca2+]cyt to activate RYR2 to induce more Ca2+ release. But this is not an absolute requirement. Our understanding of the mechanism by which RYR2 causes Ca2+ oscillation is not yet sufficient. More systematic simulation and experimental data will help elucidate the mechanism.
Our simulation indicates that the effects of CPVT mutations on the basic phenomenon of cytoplasmic Ca2+ oscillations and corresponding [Ca2+]ER changes can be explained only by the difference in [Ca2+]cyt-dependent Ca2+ release activity at resting [Ca2+]cyt determined by [3H]ryanodine binding measurements. However, it is possible that some specific mutants may have a larger E or smaller KACa,L compared with WT. In this case, these mutants will show more severe leak and greater reduction in [Ca2+]ER than expected from the cytoplasmic three parameters. The model simulation would be useful to find such mutations. In addition, combination of model simulation and measurements using HEK293 expression system may be also helpful in exploring effects of the parameters of Ca2+ influx and efflux through plasma membrane and ER membrane, such as effects of the adrenergic β stimulation, which induces CPVT by affecting RYR2 phosphorylation, SERCA activity, and Ca2+ influx through plasma membrane.
[Ca2+]cyt-dependent Ca2+ release activity at resting [Ca2+]cyt is a useful parameter in predicting the severity of CPVT mutations
Next-generation sequencing technology has revealed numerous novel RYR2 mutations linked to arrhythmias. However, it is difficult to predict their functional effects from the results of such sequencing. Heterologous expression systems with HEK293 cells have been successfully used to assess the phenotypes resulting from mutations in RYR2 that cause both loss-of-function and gain-of-function mutations (Jiang et al., 2002; Jones et al., 2008; Fujii et al., 2017; Uehara et al., 2017; Hirose et al., 2022; Nozaki et al., 2020). Here we show that the [Ca2+]cyt-dependent Ca2+ release activity at resting [Ca2+]cyt, Arest, of mutant RYR2 correlates well with the age of onset of arrhythmia or SCD, an index of severity of the disease (Fig. 9): mutations with Arest 2 to 3 times higher than WT tend to cause relatively mild familial arrhythmias, whereas mutations with Arest 10 times higher than WT cause more severe arrhythmias at younger age. However, SCD may occur even with mutations with mild effects. Quantitative analysis of the [Ca2+]cyt-dependent Ca2+ release activity will be useful not only to distinguish the phenotypes but also to assess the severity of diseases.
Limitations
In this study, we investigated the properties of the homotetrameric mutant channels expressed in HEK293 cells. Because CPVT patients have heterozygous RYR2 channels, their changes in activity are expected to be smaller than those of homozygous channels. Therefore, the [Ca2+]ER in cells with heterozygous channels may not be reduced as much as that in cells with homozygous channels. However, we need to determine the activities of heterotetrameric channels consisting of WT and mutant RYR2 in various combinations. The second limitation is that we do not know the effects of mutations on interactions between RYR2 and cardiomyocyte-specific proteins such as FKBP12.6, triadin, calsequestrin, PKA, and CaMKII, because we performed observations only in HEK293 cells. In particular, effects of adrenergic stimulations that cause CPVT need to be investigated more with cardiomyocytes or HEK293 cells expressing cardiac proteins. Furthermore, other genetic and environmental factors are also considered to be involved in human diseases. However, clarifying the impact of mutations on RYR2 channel activity provides an essential basis for understanding mutant RYR2 channel regulation and for designing therapeutic strategies.
Acknowledgments
Eduardo Ríos served as editor.
We thank Ikue Hiraga and the Laboratory of Radioisotope Research, Research Support Center, Juntendo University Graduate School of Medicine, for their technical assistance. We also thank Edanz for editing the English text of the draft of this manuscript.
This work was supported by JSPS KAKENHI grants 19K07105 and 22K06652 to N. Kurebayashi and 19H03404 and 22H02805 to T. Murayama; the Practical Research Project for Rare/Intractable Diseases (19ek0109202 to S. Ohno and N. Kurebayashi) from the Japan Agency for Medical Research and Development (AMED); Platform Project for Supporting Drug Discovery and Life Science Research (Basis for Supporting Innovative Drug Discovery and Life Science Research grant JP20am0101080 to T. Murayama and N. Kurebayashi); an Intramural Research Grant (2-5) for Neurological and Psychiatric Disorders from the National Center of Neurology and Psychiatry to T. Murayama; and the Vehicle Racing Commemorative Foundation to T. Murayama (grants 6114, 6237, and 6303).
The authors declare no competing financial interests.
Author contributions: N. Kurebayashi, T. Murayama, and T. Kobayashi performed the cell biological experiments; R. Ota and F. Yamashita developed the simulation program; R. Ota, F. Yamashita, and N. Kurebayashi performed the simulations and analyses; J. Suzuki, K. Kanemaru, and M. Iino provided experimental tools; N. Kurebayashi, T. Murayama, R. Ota, J. Suzuki, K. Kanemaru, T. Kobayashi, and T. Sakurai analyzed the experimental data; S. Ohno and M. Horie analyzed the clinical data; and N. Kurebayashi, T. Murayama, S. Ohno, M. Iino, and F. Yamashita wrote the manuscript. All authors discussed the results and approved the final version of the manuscript.
References
This work is part of a special issue on excitation–contraction coupling.

