
Skip Nav Destination
Close Modal


1-20 of 81588
Follow your search
Access your saved searches in your account
Would you like to receive an alert when new items match your search?
1
Journal Articles
Journal:
Journal of Experimental Medicine
J Exp Med (2026) 223 (4): e20250005.
Published: 06 February 2026
Includes: Supplementary data
in Zbtb32 promotes CD8+ T cell differentiation and function in cancer
> Journal of Experimental Medicine
Published: 06 February 2026
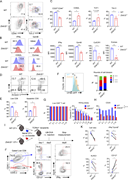
Figure 1. Zbtb32 expression is selectively upregulated in T tex tumor-infiltrating CD8 + T cells. (A) Fold change in the expression level of different TFs in Tpex and Ttex OT-I TILs in E.G7. (B) Volcanic plot showing the differential More about this image found in Zbtb32 expression is selectively upregulated in T ...
in Zbtb32 promotes CD8+ T cell differentiation and function in cancer
> Journal of Experimental Medicine
Published: 06 February 2026
Figure 2. The CD28-PI3K axis induces Zbtb32 expression after CD8 + T cell activation. (A) The level of Zbtb32 expression was measured by RT-qPCR in activated CD8+ T cells in vitro (n = 3 for each group). (B) Quantifications of Zbtb32 More about this image found in The CD28-PI3K axis induces Zbtb32 expression after CD8 ...
in Zbtb32 promotes CD8+ T cell differentiation and function in cancer
> Journal of Experimental Medicine
Published: 06 February 2026
Figure 3. Zbtb32 augments the short-term immune responses of CD8 + T cells. (A) Representative FACS plots of TCF1 and Tim-3, CD25, and CD44 in WT and Zbtb32−/− CD8+ cells activated in vitro. (B) Histogram plots (left panel) and MFI (right More about this image found in Zbtb32 augments the short-term immune responses of CD8 + T cel...
in Zbtb32 promotes CD8+ T cell differentiation and function in cancer
> Journal of Experimental Medicine
Published: 06 February 2026
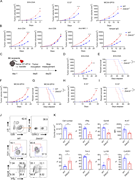
Figure 4. Loss of Zbtb32 inhibits the anti-tumor response of CD8 + T cells. (A) Tumor growth in WT and Zbtb32−/− mice after transplantation of 1 × 10⁶ B16, E.G7, or MC38 cells (n = 6 for each group). (B) Tumor growth in WT and Zbtb32−/− mice More about this image found in Loss of Zbtb32 inhibits the anti-tumor response of CD8 + T cel...
in Zbtb32 promotes CD8+ T cell differentiation and function in cancer
> Journal of Experimental Medicine
Published: 06 February 2026
Figure 5. Zbtb32 overexpression enhances CD8 + T cell anti-tumor rejection. (A) Quantifications of specific genes expressions in WT, Zbtb32 OE activated CD8+ T cells measured by RT-qPCR (n = 3 for each group). (B) Schematic diagram of the More about this image found in Zbtb32 overexpression enhances CD8 + T cell anti-tumor rejecti...
in Zbtb32 promotes CD8+ T cell differentiation and function in cancer
> Journal of Experimental Medicine
Published: 06 February 2026
Figure 6. The impaired tumor control as a result of Zbtb32 deficiency in T cells is rescued in ICB treatment. (A) Schematic diagram of anti–PD-1 treatment assay in B16-OVA tumor-bearing mice, transferred with 3 × 10⁵ WT or 3 × 10⁵Zbtb32−/− naïve More about this image found in The impaired tumor control as a result of Zbtb32 deficienc...
in Zbtb32 promotes CD8+ T cell differentiation and function in cancer
> Journal of Experimental Medicine
Published: 06 February 2026
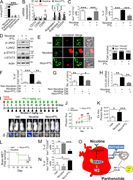
Figure 7. Zbtb32 transcriptionally regulates tumor-infiltrating CD8 + T cell function. (A) Schematic diagram of the co-transfer of 1.5 × 10⁵ WT and 1.5 × 10⁵Zbtb32−/− naïve OT-I cells prior to 1 × 10⁶ B16-OVA inoculation (n = 6 for each More about this image found in Zbtb32 transcriptionally regulates tumor-infiltrating CD8 + T ...
in Zbtb32 promotes CD8+ T cell differentiation and function in cancer
> Journal of Experimental Medicine
Published: 06 February 2026
Figure 8. Zbtb32 regulates the epigenetic landscape of CD8 + TILs. (A) Distribution of differential chromatin accessible regions in WT and Zbtb32−/− OT-I TILs across the genome. (B) Enrichment of known TF-binding motifs in chromatin More about this image found in Zbtb32 regulates the epigenetic landscape of CD8 + TILs. (A) ...
in Zbtb32 promotes CD8+ T cell differentiation and function in cancer
> Journal of Experimental Medicine
Published: 06 February 2026
Figure 9. Zbtb32 and Bcl6 exert antagonistic functions in tumor-specific CD8 + T cells. (A) Consensus binding sequences of Zbtb32 and Bcl6. (B) Quantification of the ratios of ChIP-seq overlapped peaks bound by Zbtb32 and specific TFs in More about this image found in Zbtb32 and Bcl6 exert antagonistic functions in tumor-specific CD8 + ...
in Zbtb32 promotes CD8+ T cell differentiation and function in cancer
> Journal of Experimental Medicine
Published: 06 February 2026
Figure 10. Zbtb32 upregulates Id2 to enhance CD8 + T cell–mediated tumor rejection. (A) Fold changes in the expression levels of different TFs in DEGs in Zbtb32−/− and WT CD8+ TILs. (B) The occupancies of Zbtb32 and Bcl6 at the Id2 gene More about this image found in Zbtb32 upregulates Id2 to enhance CD8 + T cell–mediated tumor ...
Journal Articles
Journal:
Journal of Experimental Medicine
J Exp Med (2026) 223 (3): e2019113101262026c.
Published: 05 February 2026

in Correction: Nicotine promotes brain metastasis by polarizing microglia and suppressing innate immune function
> Journal of Experimental Medicine
Published: 05 February 2026
Figure 6. PTL suppresses brain tumor progression by blocking nicotine-induced M2 microglia polarization. (A) Human microglia cells (HMC3) with the Arg1 reporter plasmid were cultured in the presence or absence of compounds that were identified More about this image found in PTL suppresses brain tumor progression by blocking nicotine-induced M2 micr...

Journal Articles
Journal:
Journal of Experimental Medicine
J Exp Med (2026) 223 (3): e20241707.
Published: 28 January 2026
Includes: Supplementary data
Journal Articles
Journal:
Journal of Experimental Medicine
J Exp Med (2026) 223 (3): e20250569.
Published: 28 January 2026
Journal Articles
Journal:
Journal of Experimental Medicine
J Exp Med (2026) 223 (3): e20250594.
Published: 28 January 2026
Includes: Supplementary data
in Epigenetic and metabolic reprogramming support plasma cell differentiation in germinal centers
> Journal of Experimental Medicine
Published: 28 January 2026
Figure 1. Characterizing pre-plasma B cells through scRNA-seq analysis. (A) UMAP visualization of 10 GC B cell clusters. (B) UMAP visualization of Irf4 expression and enrichment of PC signature in clusters as in A (left). Dot plot showing the More about this image found in Characterizing pre-plasma B cells through scRNA-seq analysis. (A) UMAP vis...
in Epigenetic and metabolic reprogramming support plasma cell differentiation in germinal centers
> Journal of Experimental Medicine
Published: 28 January 2026
Figure 2. Kdm6b is upregulated in prePCs. (A) Genome track view of the Irf4 locus showing H3K27me3 (blue, above the line) and H3K4me3 (red, below the line) peaks. (B) Expression of Ezh2, Kdm6a, and Kdm6b in indicated clusters visualized using More about this image found in Kdm6b is upregulated in prePCs. (A) Genome track view of the Irf4...
1

