
Skip Nav Destination
Close Modal

![Validation of an in vitro–priming approach to generate functional pathogen-specific Th cells.(A) Schematic overview of the priming system and workflow. (B) Top row: Representative CFSE dilution graph and cytokine (IFNγ and IL-17A) staining from CFSE+ and CFSE− populations. Bottom row: Histogram of CD25, CD44, and ICOS from CFSE+ and CFSE− populations. Cells were cocultured for 10–12 d before analysis. (C) Representative intracellular cytokine staining of IFNγ- and IL-17A–producing Th cells following priming by CD11c+ DCs stimulated with Lm, Cr, or Sa lysates. (D) Secreted protein levels of IFNγ, IL-17A, and IL-13 in the supernatants of cocultures as in C, measured by ELISA. n = 5. Un, unstimulated. (E) Scatter plot of mRNA expression values (log10[reads per kilobase of transcript per million mapped reads/RPKM]) obtained from RNA-seq of Lm- or Cr-specific CFSE− Th cells. Data were averaged from two independent samples. Blue data points indicate differentially expressed genes (fold change ≥2). (F) Percentages of IFNγ- and IL-17A–producing cells in pathogen- or commensal-specific Th cells. Naive WT CD4 T cells were primed by DCs stimulated with heat-killed commensal bacteria Bf, La (multiplicity of infection [MOI] = 3) or 10 µg/ml Lm/Cr lysate. Intracellular cytokine was examined at day 10. n = 2–4. (G) Experimental design for testing in vivo specificity (top) and the mismatch scheme (bottom). (H) Expansion of transferred (in vitro primed with Lm or Cr) CD4 T cells in the spleen at day 5 after infection of Lm (shown as fold change comparing CD45.2+ percentage of infected mouse to paired PBS control). n = 7 mice per group. (I) Mean fluorescence intensity (MFI) of surface ICOS on donor CD45.2+ T cells from the same experiment as G and H. n = 7 mice per group. Data are representative or combined from two to five independent experiments. All plots are pregated on live cells. Error bars represent mean ± SEM, and P values were determined by paired Student’s t test (D, H, and I) or two-way ANOVA with Tukey correction (F). ns, not significant; *, P < 0.05; **, P < 0.01; ***, P < 0.001.](https://cdn.rupress.org/rup/content_public/journal/jem/217/4/10.1084_jem.20190476/6/s_jem_20190476_fig1.png?Expires=2147483647&Signature=FNugFyP7glQ9io4T5F9D7dPUMhyPcp6glKM5My2EqWBzF8242kdlbL-YWhM9ht9nhgURb~L-p~Bn1IUCz4-gFOWrPRb343A6AQFzC6EoyV4wCrd8DXaBJAQw9gFfReWmzRkjfjezXjNVr2kYDq9vGOMoXKtTw5jOC6a3gFb~6wFZrrOKvcav-RrAnQEal0g1gR6wed8cfpr5YxEHkSWrrvbTl4Ao3ZpVVh2godiYHNyxKYMTgZ4MLyPDg7AW02kzoRiLDS3c~ws80vk-wSD0H2KSniGkLRG4E1k7FmWeExt2VaS1Y4YXnsohiFxHaHI7CMP7oDpdmObmkgnLlUwXUA__&Key-Pair-Id=APKAIE5G5CRDK6RD3PGA)
![Comparative transcriptional analysis reveals caspase-1 as a T cell–intrinsic regulator of Th17 differentiation.(A) tdT+ percentage of unstimulated (Un), Lm-primed, Cr-primed, or Th17-polarized 17A-fm CD4 T cells. Un, n = 4; Lm and Cr, n = 5; Th17, n = 2. (B) Heatmap of Th17-associated cytokine and TF expression in CFSE+, CFSE−tdT−, and CFSE−tdT+ populations from Cr-primed T cells. (C) Representative flow plots showing IFNγ-YFP+ percentage of CFSE−tdT+ population, from 17-γ double reporter T cells under ppTh17 (Cr-primed) or cdTh17 conditions at early (day 5) and late (day 10) stages of differentiation. (D) Representative flow plots showing IFNγ-YFP+ percentage of CD4+CD90+tdT+ population, from mLN of 17-γ double reporter mice at 10 dpi of Cr. 17-fm mice that do not carry the YFP allele were used as negative signal control. (E) Confirmation of representative differentially expressed genes shown in Fig. 2 by qRT-PCR, n = 2. (F) Expression levels of Casp1 and Casp11 in murine T cell populations, extracted from the Immgen database. n = 2–3; heatmap is shown as mean expression value. SPN, Spleen; sLN, skin-draining lymph node; PP, Peyer’s patches. (G) WT or Casp1Δ10 naive T cells were primed for 10 d with WT DCs stimulated with heat-killed Bf (MOI = 3). Flow plot shows the percentage of IL-17A– and IFNγ-producing cells in live CFSE−CD90+ population. n = 2–3. (H) Overlay of CFSE dilution histograms (left) 10–12 d after Cr-priming and quantified CD4 T cell proliferation (CFSE−%; right). n = 5. Δ10, Casp1Δ10. (I) tdT+ percentage in CFSE−CD90+ CD4 T cell population primed with Cr-stimulated DCs in vitro for the indicated time. (J) Western blot analysis of procaspase-1 (p45) and cleaved caspase-1 (p20) of Cr-primed CD4 T cells. Cells are sorted into CFSEhigh (hi), CFSEintermediate (int), and CFSEnegative (neg) populations and compared with WT macrophages (MΦ) undergoing inflammasome activation (4 h LPS + 30 min ATP [L+A]). (K) WT naive CD4 T cells were primed with Cr-stimulated WT DCs. At day 7, indicated inhibitors were added to the culture. Casp1 expression in FACS-sorted CFSE−CD90+ T cells was determined at day 10. Concentration of the inhibitors used were p38i (SB203580), 5 µM; JNKi (CAS 129–56-6), 2 µM; MEKi (U0126), 2 µM; JAKi (Ruxolitinib), 500 nM; IRAK1/4i (CAS 509093–47-4), 5 µM; IKKi (CAS 873225–46-8), 500 nM. n = 2–3. (L) IL-17A+ percentage of CFSE−CD90+ WT or Casp1Δ10 CD4 T cells primed with Cr-stimulated WT DCs in vitro. DMSO or Z-YVAD-fmk (20 µM) was present in the culture medium throughout the priming period. n = 3. (M) IL-17A+ percentage of CFSE−CD90+ WT or Casp1Δ10 CD4 T cells primed with Cr-stimulated WT DCs in vitro. Cultures were supplemented with 10 ng/ml IL-1α or IL-1β. n = 4. (N) Bicistronic hCD2 expression on the surface of Th17 cells transduced with indicated vector. Data are pooled from or representative of at least two independent experiments. Statistics represent mean ± SEM, and P values were determined by paired Student’s t test (A and H) or paired two-way ANOVA (L and M). ns, not significant; *, P < 0.05.](https://cdn.rupress.org/rup/content_public/journal/jem/217/4/10.1084_jem.20190476/6/s_jem_20190476_figs2.png?Expires=2147483647&Signature=WOqvKwdPzbBokaOVTwWpB3hLb1v0Iyu6iKWNq9TP0naKxCJCHeGwZw8WTQCBc7pgHfO0M00bZgLpjaSd7a8RrITXcSytjpxcJ~ND-hdrW5gfHWkIpMLmQ~qh1gkOrNL9zWtjFHCmXxFvrk6GOxSs2-IABq6Eaon~WNdgEt~KZcRrJVQFASHpEzvXxho-vDQDFPQtzfv7sZTWyw-uRrOIYFPLLv7n3N3KorWjrJvcCObMi6umOdWVpwMQ1ab8OKCyO7rn3evCw3z7MKlBxBLEwJ~swAvzGudThalh9lfMbwXDBUPORc5SOVt7tKk9HbEDBSd4QIwcTxSTjikHWfhK9Q__&Key-Pair-Id=APKAIE5G5CRDK6RD3PGA)

![Caspase-1 promotes the differentiation of Th17 lineage independent of its enzymatic activity or inflammasome activation.(A) Differentially expressed transcripts between ppTh17 and cdTh17 cells. Each dot represents the average of three independent experiments. Blue dots indicate differentially regulated genes (fold change >1.5, false discovery rate <0.05). Black dots indicate differentially regulated transcripts described in Fig. 2. Red dots indicate Casp1 and Casp11 transcripts. (B) mRNA expression of Casp1 relative to 18s rRNA in sorted naive (CFSE+), ppTh17, cdTh17, or ex vivo tdT+ cells from mLNs of Cr-infected 17A-fm mice (10 dpi), quantified by independent qRT-PCR experiments. n = 2. (C) Naive CD4 T cells from WT or Casp1Δ10 (Δ10) mice were primed in vitro by Cr lysate–stimulated WT splenic CD11c+ DCs, and IL-17A– and IFNγ-producing cells were measured by intracellular cytokine staining and flow cytometry analysis of CD90+CFSE− live CD4 T cells (left); IL-17A+ percentages were quantified (right). n = 7. (D) IL-17A in the supernatant from experiments in C, measured by ELISA. n = 3. Δ10, Casp1Δ10. (E) IFNγ+ and IL-13+ percentage of CD90+CFSE− live cells, quantified from experiments in C. n = 7. Δ10, Casp1Δ10. (F) Relative expression (normalized to 18s rRNA and relative to day 3) of Casp1 mRNA at indicated time points after Cr-priming. n = 4. (G) Western blot analysis of procaspase-1 (p45) and cleaved caspase-1 (p20) from naive CD4 T cells, sorted CD90+CFSE− Cr-primed Th cells, or WT bone marrow–derived macrophages (MΦ) that were unstimulated or under conventional inflammasome activation (4 h LPS + 30 min ATP [L+A]). (H) Naive WT, Casp1Δ10 (Δ10), Pycard−/−, Il1b−/− CD4 T cells were primed with Cr-stimulated WT DCs. IL-17A+ percentage of CFSE−CD90+ live cells was measured by intracellular cytokine staining and quantified. n = 5. (I) Casp1Δ10 CD4 T cells were differentiated to Th17 lineage and retrovirally reconstituted with MSCV-IRES-hCD2 alone (Vector), full-length Casp1 (FL), Casp1 deficient of CARD (Casp1ΔCARD), or enzymatically (Enz) inactive form of Casp1 (EnzDead, C284A) and quantified for IL-17A+ percentage (gated on live, hCD2+ population). n = 4. (J) Log2(fold change) of major Th cell cytokine and TF expression comparing WT and Casp1Δ10 Cr-specific Th cells. WT or Casp1Δ10 naive CD4 T cells were primed with Cr-stimulated WT DCs for 10 d. CFSE−CD90+ population was FACS-sorted and subjected to mRNA-seq and analysis. n = 2. (K) Heatmap and hierarchical clustering of differentially expressed (>1.5 fold) genes comparing WT and Casp1Δ10 (Δ10) Cr-specific Th cells. Genes of interest were labeled by the heatmap. Each column represents one independent replicate. (L) Activation z-score of pathways enriched in WT or Casp1Δ10 Cr-specific Th cells. Pathway analysis was performed using Ingenuity Pathway Analysis. Data are representative of or combined from two to seven independent experiments. Statistics represent mean ± SEM, and P values were determined by paired Student’s t test (C–E and H) or one-way ANOVA with Tukey correction (I). ns, not significant; *, P < 0.05; **, P < 0.01; ***, P < 0.001.](https://cdn.rupress.org/rup/content_public/journal/jem/217/4/10.1084_jem.20190476/6/s_jem_20190476_fig3.png?Expires=2147483647&Signature=BzWRZr7kbeFsDRhYs9y50xRyhl75qyAO--r2YBx~T2B1Gy649AXUetCOz5NHIG7E2DzyLdcOr0~A6Fx7U09uOMu8HeG4qmdEO3Iy1joGgOhnfk6tg~RaOvGC1toHovmCWuWUa1MtN~uEwyfSFE2vYu7llQLgGaUkN9DxsqJ1R4uESLxnyVe6U90iT3peYmXYgCJbbtqIJjYJZQtbCzRgpD7GMSuGFCXkLi87j4e-zkSIg05yKFrkLt8z-WaY7hK4ro4m~DUJWtuqqfObKOiJ~Vx7SmTt88fwbEm6Qp6WZcpNKOUwPJdvMD4IXmbZO-KzFHG727PDpEi5eJnIhbAX3w__&Key-Pair-Id=APKAIE5G5CRDK6RD3PGA)
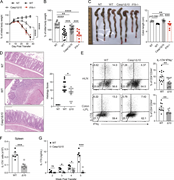
![T cell–intrinsic caspase-1 is required for host protection and Th17-mediated autoinflammatory disease.(A) Naive CD4 T cells from WT or Casp1Δ10 (Δ10) mice were isolated and polarized to cdTh17 cells. Representative flow cytometry plot (left) and quantifications of IL-17A+ percentage (right) are shown. n = 4. (B) Representative histogram overlay of CFSE dilution from experiments in A. (C) CFSE− percentage of transferred CD4 T cells, examined at 10 dpi. n = 8–9 mice per group. Δ10, Casp1Δ10. (D) Percentage of cytokine-positive cells in CD90+CD4− population (ILCs) from the same experiments in Fig. 4. n = 5 mice per group. (E) Colonic crypt length measured from histology images in Fig. 5 D. n = 3–5 mice per group. NT, nontransferred (i.p. PBS). Δ10, Casp1Δ10. (F and G) WT and Casp1Δ10 CD45RBhi CD4 cells were transferred to Rag1−/− mice. 3 wk after transfer, LPL cells were isolated and stained with FAM-FLICA to detect activation of caspase-1. FLICA+PI+ indicates inflammasome-activated cells. WT and Casp1Δ10 bone marrow–derived DCs (BMDCs) that were treated with inflammasome-activating ligands (4 h LPS [100 ng/ml] and 30-min 5 mM ATP) were used as positive and negative controls for FLICA staining. Representative flow plot is shown in F and quantified in G; n = 2–4/group. (H and I) IL-17A+IFNγ− percentage (H) and IFNγ+IL-17A− percentage (I) of CD4+CD90+CD44+ T cells in the mLN or colonic LP (Colon-LPL) of Rag1−/− mice 4 wk after transfer of WT or Casp1Δ10 naive CD4 T cells. n = 8–13 mice per group. (J) Percentages and numbers of CD4+CD90+ T cells from Colon-LPL of Rag1−/− mice 4 wk after transfer of WT or Casp1Δ10 naive CD4 T cells. n = 6–7 mice per group. Data are representative of or pooled from two to four independent experiments. Statistics represent mean ± SEM, and P values were determined by paired Student’s t test (A), one-way ANOVA with Tukey correction (E), or unpaired Student’s t test (G–I). ns, not significant; *, P < 0.05; ***, P < 0.001.](https://cdn.rupress.org/rup/content_public/journal/jem/217/4/10.1084_jem.20190476/6/s_jem_20190476_figs3.png?Expires=2147483647&Signature=o29qe3L8drK~p42nBu-r0zW8YXQXbKxBZpro2RstJh4qW2gz0hX2oZYga0D6RrCA31ICb1Id1lXmiv0aDTzFURENBrfzHUN7InF49vKwizqU4sdDId5Ad~Zv8Fl81kSD2p3XzzG0Imut-6Ss5Vm72GURUhCMwNRBADTImwj1xuwfZsoNa7r1TUV-5-zJdEWcHMBIwVN7wfbvlaYNdTkZRzu8hWx70EJi6USBA1-WLnU0CGfby1-VTnC1OeH7OLnYFlwqlccWh0mWJc3aC0ZbnuDq5RVWBBYicrBDv~ic82k1SH1ay4LZE5uBSr9hv9MPkRxhnNuy00Ok7itUb~19bw__&Key-Pair-Id=APKAIE5G5CRDK6RD3PGA)


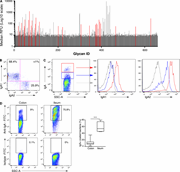


![Human monoclonal IgA bind a broad but nevertheless private pattern of commensals. Related to Fig. 4. (A) Flow cytometric sorting of intestinal IgA+ memory B cells (defined as CD19+, cell surface IgA+ IgD−). Sort gate among CD19+ B cells is shown. Doublets and dead cells were excluded before CD19 gating, CD19+ cells were gated among CD45+ cells (not shown). Representative images from three independent sorts are shown. (B) Transduced B cells exhibited a stable germinal center–like phenotype and maintained IgA expression. Transduced B cells were surface-labeled with anti-CD38, anti-CD95, or anti-IgA (orange lines) or appropriate isotype antibody controls (gray dotted lines). Representative images of eight monoclonal B cell lines, evaluated in three independent experiments, are shown. (C) Monoclonal B cell lines produced dimeric IgA. Representative immunoblotting showing high molecular weight dimeric mAb in nonreducing conditions for mAb 8. Representative image of eight mAbs and two independent experiments are shown. (D) Representative flow cytometric plot of microbiota B stained with anti-IgG Alexa Fluor 647 and anti-IgA FITC. The same experiment was repeated twice. (E) Heatmap diagram of EI of the 50 most frequent genera from microbiota A. Hierarchical clustering grouped mAb+ fractions and genera. (F) Heatmap diagram of EI of the 50 most frequent genera from microbiota B. Hierarchical clustering grouped mAb+ fractions and genera. (G) Flow cytometric analysis of mAb or negative control (mAb− supernatant [left] or irrelevant IgG [right, anti-TNFα IgG1]) staining of pure bacterial strains (two independent experiments).](https://cdn.rupress.org/rup/content_public/journal/jem/217/3/10.1084_jem.20181635/18/s_jem_20181635_figs4.png?Expires=2147483647&Signature=zAXVGNT39r8u3eSPXrK3Oh1IyJA37hL~7oEcVIYABGm03XrrKybEnY9zHQE0HN-38HixKPl1I7EMDr64lDJRhbr0O8FlCup0E~heyIqLjwqnfBz87xy0tQtxnuoXbFNDgxfMfJ8pe05x4zOadKOUR7NhijJKRF-SA6zrr3Bjsg~aRLm--6NPExWgHdsZ07UuPyo96TlHDK9dMhYO3wcyYblzFUTAEzMeNxmHB9uvs6dtCkjcUPkm-mCKRke3xQQgoDGDhDCZ2cnc2H444yVDp033Jwzvtp4ccQhmJiXRkhfj-ij6owDGf8IXmtpGXiF8yOcZViRheEcYzCQDitAnGg__&Key-Pair-Id=APKAIE5G5CRDK6RD3PGA)
![Human monoclonal IgA target highly diverse commensal bacteria.(A) Representative flow cytometry plot of microbiota reactivity for mAb#2 and human IgA2 anti-TNP. mAbs 1–8 are gut monoclonal IgA2 expressed as dimeric IgA. SSC-A, side scatter area. (B) mAb coating of IgA-free microbiota. mAbs are classified in increasing fluorescence intensity order (median fluorescence intensity [MFI], range 2,080–10,724). The same experiment was repeated twice. (C) Somatic mutations of mAbs are not correlated to IgA staining intensity. Somatic mutations in the V-region of IGH gene were analyzed. Nonparametric Spearman correlation was calculated. (D) Representative flow cytometry plot of microbiota reactivity for mAb 10 and human IgG1 anti-TNFα. mAbs 9–16 are gut monoclonal IgA2 expressed as IgG1 (Benckert et al., 2011). (E) mAb coating of IgA and IgG-free microbiota. MAbs are classified in increasing fluorescence intensity order (MFI, range 3,585–17,683). The same experiment was repeated twice. (F) Somatic mutations of mAbs are not correlated to mAb staining intensity. Somatic mutations in V-region of IGH gene were analyzed. Nonparametric Spearman correlation was calculated. (G) mAb+ and mAb− fractions of IgA-free gut microbiota were sorted by flow cytometry, and their composition was analyzed by 16S rRNA sequencing. (H) Relative abundance of phyla in whole microbiota (input) and mAb+ fractions. Microbiota A is IgA-free, while microbiota B is IgA- and IgG-free. 16S rRNA sequencing data were from two independent experiments. (I) Relative abundance of genera in whole microbiota A (input) and mAb+ fractions. (J) Relative abundance of genera in whole microbiota B (input) and mAb+ fractions. (K) Scatter dot plot of median relative abundance of genera from mAb+ and mAb− fractions. ns, not significant.](https://cdn.rupress.org/rup/content_public/journal/jem/217/3/10.1084_jem.20181635/18/s_jem_20181635_fig4.png?Expires=2147483647&Signature=F-hfcNrkHlcC2TViSGPhRMrrqZxSP~lMTcgBRG4yRANNsYp7VpYhuKD-5vXRRYfCmGJaXI3tAJUcr7cDY7oV9xbRgeLyShOooCaMSY90oY7CuJcRy9TYDt-QQMayb4tiC3hAc97alfBzu0zQ5i4BxJf5Og91rrmtzCejdkGYAgrhlzP59Xo9aD2t-0sOgi6zUXyYIsUhGepYLTSDO67VI3wqoDGK3ArJdj4C0I2aIAo78XgmhsgDpus7b-dKCi6q2YJ3FEHTszL8bVY7rcg92Iu~MIja2WNF1vlU19xqnz-qGmLfI~NSgkgNG1ycADRrBJsIjEVAMltfhqUqxpOCSA__&Key-Pair-Id=APKAIE5G5CRDK6RD3PGA)


1-20 of 68
Follow your search
Access your saved searches in your account
Would you like to receive an alert when new items match your search?
1
Journal Articles
Journal:
Journal of Experimental Medicine
J Exp Med (2020) 217 (4): e20190476.
Published: 22 January 2020
Includes: Supplementary data
in Transcriptional profiling identifies caspase-1 as a T cell–intrinsic regulator of Th17 differentiation
> Journal of Experimental Medicine
Published: 22 January 2020
Figure S1. An in vitro priming approach to generate functional pathogen-specific Th cells. (A) Top: Purity of isolated naive CD4 T cells (CD4+MHCII−CD62L+CD44−) from two independent experiments. Bottom: Purity of CD11c+ DCs before or after More about this image found in An in vitro priming approach to generate functional pathogen-specific Th ce...
in Transcriptional profiling identifies caspase-1 as a T cell–intrinsic regulator of Th17 differentiation
> Journal of Experimental Medicine
Published: 22 January 2020
Figure 1. Validation of an in vitro–priming approach to generate functional pathogen-specific Th cells. (A) Schematic overview of the priming system and workflow. (B) Top row: Representative CFSE dilution graph and cytokine (IFNγ and IL-17A) More about this image found in Validation of an in vitro–priming approach to generate functional pathogen-...
in Transcriptional profiling identifies caspase-1 as a T cell–intrinsic regulator of Th17 differentiation
> Journal of Experimental Medicine
Published: 22 January 2020
Figure S2. Comparative transcriptional analysis reveals caspase-1 as a T cell–intrinsic regulator of Th17 differentiation. (A) tdT+ percentage of unstimulated (Un), Lm-primed, Cr-primed, or Th17-polarized 17A-fm CD4 T cells. Un, n = 4; Lm and More about this image found in Comparative transcriptional analysis reveals caspase-1 as a T cell–intrinsi...
in Transcriptional profiling identifies caspase-1 as a T cell–intrinsic regulator of Th17 differentiation
> Journal of Experimental Medicine
Published: 22 January 2020
Figure 2. Comparative transcriptional analysis reveals major divergence in programming between ppTh17 and cdTh17 cells . (A) Experimental design for transcriptional profiling of CFSE+ (naive), ppTh17 (Cr-specific, day 12), cdTh17 (day 5), or ex More about this image found in Comparative transcriptional analysis reveals major divergence in programmin...
in Transcriptional profiling identifies caspase-1 as a T cell–intrinsic regulator of Th17 differentiation
> Journal of Experimental Medicine
Published: 22 January 2020
Figure 3. Caspase-1 promotes the differentiation of Th17 lineage independent of its enzymatic activity or inflammasome activation. (A) Differentially expressed transcripts between ppTh17 and cdTh17 cells. Each dot represents the average of More about this image found in Caspase-1 promotes the differentiation of Th17 lineage independent of its e...
in Transcriptional profiling identifies caspase-1 as a T cell–intrinsic regulator of Th17 differentiation
> Journal of Experimental Medicine
Published: 22 January 2020
Figure S3. T cell–intrinsic caspase-1 is required for host protection and Th17-mediated autoinflammatory disease. (A) Naive CD4 T cells from WT or Casp1Δ10 (Δ10) mice were isolated and polarized to cdTh17 cells. Representative flow cytometry More about this image found in T cell–intrinsic caspase-1 is required for host protection and Th17-mediate...
in Transcriptional profiling identifies caspase-1 as a T cell–intrinsic regulator of Th17 differentiation
> Journal of Experimental Medicine
Published: 22 January 2020
Figure 4. T cell–intrinsic caspase-1 is required for host protection against Cr. (A) Schematic of the experiment. (B) Representative intracellular cytokine staining of IFNγ, IL-22, and IL-17A in CD4+CD90+CD44+ T cells in the mLNs at 10 dpi of More about this image found in T cell–intrinsic caspase-1 is required for host protection against Cr
in Transcriptional profiling identifies caspase-1 as a T cell–intrinsic regulator of Th17 differentiation
> Journal of Experimental Medicine
Published: 22 January 2020
Figure 5. T cell–intrinsic caspase-1 is required for Th17-mediated colitis. (A) Weight change of Rag1−/− mice that received WT, Casp1Δ10, or Il1b−/− naive CD4 T cells (CD45RBhi) at indicated time points (n = 6–10 mice for each group). NT, More about this image found in T cell–intrinsic caspase-1 is required for Th17-mediated colitis. (A) Wei...
Journal Articles
In Special Collection:
Immunology: New Insights and Resources
, Tissue Immune Responses: Immune Cells and Mechanisms
Journal:
Journal of Experimental Medicine
J Exp Med (2019) 217 (3): e20181635.
Published: 31 December 2019
Includes: Supplementary data
Published: 31 December 2019
Figure 1. Carbohydrate-binding profile of polyclonal IgA1 and IgA2 antibodies. (A) Glycan reactivity of serum polyclonal IgA1 and IgA2 (n = 5 healthy donors pooled in one experiment). Each peak represents an individual glycan recognized by IgA1 More about this image found in Carbohydrate-binding profile of polyclonal IgA1 and IgA2 antibodies. (A) ...
Published: 31 December 2019
Figure S1. Gut bacteria segregate into IgAbright and IgAlow fractions in healthy humans. Related to Figs. 1 and 2 . (A) The secretory component binds a modest range of carbohydrates. Glycan reactivity with the secretory component was More about this image found in Gut bacteria segregate into IgAbright and IgAlow frac...
Published: 31 December 2019
Figure 2. IgA1 targets IgA2-coated bacteria. (A) Representative flow cytometry analysis of endogenous IgA1 and IgA2 fecal or ileal microbiota coating. (B) Endogenous IgA1 and IgA2 microbiota coating levels in 20 fecal and 5 ileal healthy More about this image found in IgA1 targets IgA2-coated bacteria. (A) Representative flow cytometry anal...
Published: 31 December 2019
Figure S2. IgA1+IgA2+- and IgA2+-sorted fractions show distinct compositions within the same donor and between donors . Related to Fig. 4 . (A) Sorting strategy of IgA1- and IgA2-coated bacteria (representative of five independent More about this image found in IgA1+IgA2+- and IgA2+-sorted fractions sho...
Published: 31 December 2019
Figure 3. IgA1 coordinates with IgA2 to coat distinct commensal bacteria. (A) Median relative abundance of the four most frequent families in sorted fractions from five healthy donors. Each dot represents one donor. Boxes extend from the 25th More about this image found in IgA1 coordinates with IgA2 to coat distinct commensal bacteria. (A) Media...
Published: 31 December 2019
Figure S3. IgA1- and IgA2-coated bacteria promote cytokine production by macrophages. (A) One out of three representative flow cytometric analyses of human gut microbiota purified from an IgA-deficient donor incubated with breast milk IgA and More about this image found in IgA1- and IgA2-coated bacteria promote cytokine production by macrophages. ...
Published: 31 December 2019
Figure S4. Human monoclonal IgA bind a broad but nevertheless private pattern of commensals. Related to Fig. 4 . (A) Flow cytometric sorting of intestinal IgA+ memory B cells (defined as CD19+, cell surface IgA+ IgD−). Sort gate among CD19+ B More about this image found in Human monoclonal IgA bind a broad but nevertheless private pattern of comme...
Published: 31 December 2019
Figure 4. Human monoclonal IgA target highly diverse commensal bacteria. (A) Representative flow cytometry plot of microbiota reactivity for mAb#2 and human IgA2 anti-TNP. mAbs 1–8 are gut monoclonal IgA2 expressed as dimeric IgA. SSC-A, side More about this image found in Human monoclonal IgA target highly diverse commensal bacteria. (A) Repres...
Published: 31 December 2019
Figure 5. Microbial surface glycans are common targets of gut human IgA. (A) Glycan reactivity for five mAbs (5 µg/ml) was assessed using glycan microarray technology (660 structures). Representative median RFUs of mAb1 are shown. Glycan ID More about this image found in Microbial surface glycans are common targets of gut human IgA. (A) Glycan...
Published: 31 December 2019
Figure S5. Self-reactivity and glycan reactivity of antigen-selected secretory IgA . (A) Median frequency of nonsilent (black) and silent (gray) somatic mutations in CDRs and VH FWRs in mAb IGH genes (n = 16 mAbs, four independent More about this image found in Self-reactivity and glycan reactivity of antigen-selected secretory IgA . ...
1

