


Given the clinical, economic, and societal impact of obesity, unraveling the mechanisms of adipose tissue expansion remains of fundamental significance. We previously showed that white adipose tissue (WAT) levels of 3-mercaptopyruvate sulfurtransferase (MPST), a mitochondrial cysteine-catabolizing enzyme that yields pyruvate and sulfide species, are downregulated in obesity. Here, we report that Mpst deletion results in fat accumulation in mice fed a high-fat diet (HFD) through transcriptional and metabolic maladaptation. Mpst-deficient mice on HFD exhibit increased body weight and inguinal WAT mass, reduced metabolic rate, and impaired glucose/insulin tolerance. At the molecular level, Mpst ablation activates HIF1α, downregulates subunits of the translocase of outer/inner membrane (TIM/TOM) complex, and impairs mitochondrial protein import. MPST deficiency suppresses the TCA cycle, oxidative phosphorylation, and fatty acid oxidation, enhancing lipid accumulation. Sulfide donor administration to obese mice reverses the HFD-induced changes. These findings reveal the significance of MPST for white adipose tissue biology and metabolic health and identify a potential new therapeutic target for obesity.

Introduction
The main function of white adipose tissue (WAT) is to serve as an energy reservoir that responds to hormonal and energetic cues. WAT stores calories in the form of triglycerides when nutrients are available in excess, and it releases fatty acids during times of negative energy balance to support the body’s metabolic needs. Overnutrition and limited physical activity in affluent societies have fueled an obesity epidemic over the past 50 yr (González-Muniesa et al., 2017). With an estimated >2 billion overweight and obese individuals worldwide, obesity is now recognized as a disease and a major risk factor for the accelerated development of cardiovascular disease, type 2 diabetes, and multiple types of cancers (Di Cesare et al., 2016; Williams et al., 2015).
Large population studies, along with animal and cellular data, have suggested that the sulfur-containing amino acid cysteine is obesogenic (Elshorbagy, 2014; Elshorbagy et al., 2012). On one hand, plasma cysteine levels positively correlate with fat mass (Elshorbagy et al., 2008) and body mass index (El-Khairy et al., 1999; El-Khairy et al., 2003; Elshorbagy et al., 2008). On the other hand, the restriction of sulfur amino acids results in higher energy expenditure, lower adiposity, enhanced insulin sensitivity, and increased lifespan (Hine et al., 2015; Hine et al., 2018; Stone et al., 2014). One of the biologically important products of cysteine catabolism is the signaling molecule hydrogen sulfide (H2S). H2S is enzymatically generated by 3-mercaptopyruvate sulfurtransferase (MPST), as well as by the transsulfuration pathway enzymes, cystathionine γ-lyase (CSE) and cystathionine β-synthase (CBS). CSE, CBS, and MPST exhibit differences in their active site structure, cofactor and substrate preference, catalytic mechanism, mode of regulation, and tissue and subcellular localization and serve distinct biological roles in the cardiovascular and nervous systems (Kimura, 2014; Szabo and Papapetropoulos, 2017).
MPST is a redox-sensitive enzyme that belongs to the rhodanese/Cdc25 phosphatase superfamily (Nagahara, 2018; Pedre and Dick, 2021; Szabo and Papapetropoulos, 2017). It uses the substrate 3-mercaptopyruvate, which is formed from L-cysteine by transamination through the action of glutamate-oxaloacetate aminotransferase or from D-cysteine through the action of D–amino acid oxidase (Kabil and Banerjee, 2014; Shibuya et al., 2013). During the metabolism of 3-mercaptopyruvate, a sulfur atom is transferred to an active site cysteine residue in MPST (Nagahara and Nishino, 1996; Yadav et al., 2013), and the resulting persulfide is then transferred to other proteins and low molecular weight thiols or released as H2S or hydropersulfide (Filipovic et al., 2018; Mikami et al., 2011; Shibuya et al., 2009). Human MPST exists in two isoforms that are generated through alternative splicing (Fräsdorf et al., 2014). The longer isoform has 20 additional residues in the N-terminus and is localized in the cytosol, and the shorter isoform, which is the only one present in rodents, bears a mitochondrial targeting sequence that is responsible for its presence in the mitochondria (Fräsdorf et al., 2014; Nagahara et al., 1998). The genetic ablation of MPST in bacteria, zebrafish, and mammals increases oxidative stress and sensitivity to oxidants, indicating an evolutionarily conserved antioxidant role for MPST (Katsouda et al., 2020; Mironov et al., 2017; Peleli et al., 2020). Inactivating mutations of MPST in humans result in mercaptolactate-cysteine disulfiduria, a congenital metabolic disorder that is associated with mental retardation (Crawhall et al., 1968). Deletion of MPST in mice has been reported to lead to anxiety-like behavior (Nagahara et al., 2013).
MPST is expressed in the adipose tissue, as well as in pre-adipocytes and mature adipocytes (Comas et al., 2021; Katsouda et al., 2018; Tsai et al., 2015). In addition, Mpst has been identified as a positional candidate gene related to obesity by bioinformatic approaches based on quantitative trait loci mapping in multiple species (Morton et al., 2016). We have previously shown that MPST is downregulated in WAT of mice fed a high-fat diet (HFD), as well as in genetically obese (db/db) mice that lack the leptin receptor. Moreover, age-associated weight gain was concomitant with a decrease in MPST levels (Katsouda et al., 2018; Morton et al., 2016). Given the mitochondrial localization of MPST and our previous findings linking reduced MPST expression to obesity, we set out to investigate whether a causal link exists between MPST and adipose tissue expansion in the pathogenesis of obesity.
Results
Mpst deletion potentiates weight gain in mice
To determine the role of MPST in metabolism and obesity, mice with global deletion of the Mpst gene were used (Nagahara et al., 2013). It should be noted that MPST protein levels are selectively reduced in WAT in mice fed an HFD (Katsouda et al., 2018), while MPST abundance in other organs related to metabolism remains unaltered (Fig. S1 A). The lack of MPST in inguinal WAT (iWAT) was confirmed by Western blotting and was not associated with a compensatory increase in the expression of CBS or CSE, which also contribute to H2S production (Fig. S1 B). Lack of MPST resulted in reduced protein persulfidation in iWAT (Fig. S1 C), providing evidence that MPST is a major source for sulfide production in this tissue. Next, 6-wk-old WT and Mpst−/− mice were fed a normal chow diet (CD) or HFD, and their body weight was measured weekly over a 16-wk observation period. Mice of both genotypes maintained on CD exhibited similar body weights (Fig. S1, D and E). However, when male (Fig. 1, A and B) or female (Fig. S1, F and G) MPST-deficient mice were fed HFD, they gained significantly more weight than WT, as early as 2–4 wk after hypercaloric diet initiation, displaying an exacerbated obesity phenotype. Indirect whole-body calorimetry revealed no difference in the metabolic rate of 22-wk-old WT and Mpst−/− mice on CD (Fig. S1, H–J). Glucose tolerance, glucose and insulin levels, and homeostatic model assessment of insulin resistance (HOMA-IR) scores were also similar in the two genotypes on CD (Fig. S1, K–N). Although lack of MPST had no obvious metabolic consequences in young mice on a normal diet, the body weight of aged (18 mo) Mpst−/− mice was significantly greater than that of WT mice (Fig. 1, C and D). The increase in body weight for mice on CD was consistently noted at 10 mo of age (data not shown). This observation suggests that an underlying perturbation in the regulation of metabolism does exist in the absence of Mpst even on a normal diet, and that HFD expedites the appearance of an increased weight gain phenotype. Consistent with the obese phenotype, Mpst−/− mice on the HFD exhibited reduced O2 consumption (VO2) and CO2 production (VCO2), as well as a lower metabolic rate (Fig. 1, E–G). Given that obesity is associated with the development of diabetes, glucose-related measurements were performed. Mpst−/− mice on HFD displayed impaired glucose (Fig. 1 H) and insulin tolerance (Fig. 1 I), along with higher levels of fasting blood glucose (Fig. 1 J) and insulin (Fig. 1 K) and an elevated HOMA/IR score (Fig. 1 L) compared with WT mice. The correlation between MPST levels and body weight was also validated in human samples; MPST mRNA levels were lower in subcutaneous adipose tissue samples from obese humans (body mass index ≥30; Fig. 1 M).
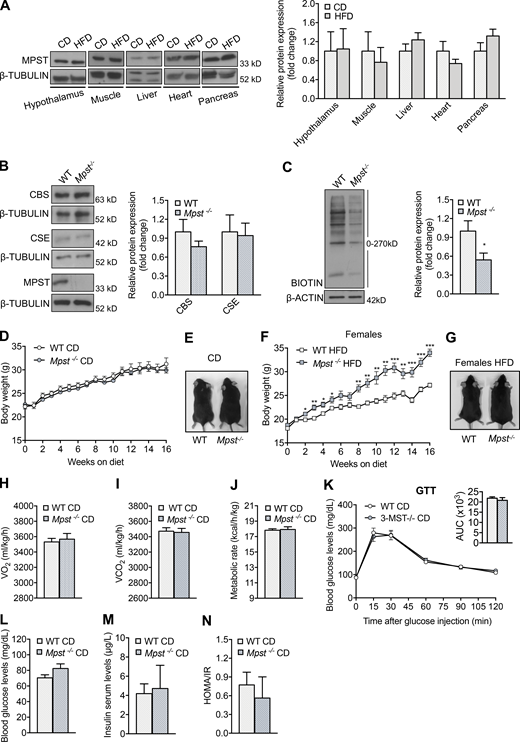
Metabolic parameters in young WT and Mpst−/−mice fed normal CD. (A) Representative blots and quantitation of MPST expression in different tissues of WT mice fed CD or HFD for 16 wk. (B) Representative Western blots and quantitation of MPST, CSE, and CBS protein levels in iWAT of WT and Mpst−/− mice. (C) Protein persulfidation in iWAT of WT and Mpst−/− mice. (D and E) 6-wk old WT and Mpst−/− mice were fed a normal CD (10% of calories from fat) for 16 wk and body mass was measured weekly. Body weight curve (D) and representative photograph (E) of WT and Mpst−/− mice after 16 wk on CD. (F and G) 6-wk old female WT and Mpst−/− mice were fed HFD (45% calories from fat) for 16 wk; body mass was measured weekly (F); representative photograph (G) of female WT and Mpst−/− after 16 wk on HFD. (H–J) VO2 (H), VCO2 (I), and metabolic rate (J) of WT and Mpst−/− mice on CD assessed by indirect calorimetry. (K) Glucose tolerance test in WT and Mpst−/− mice fed CD. The insets depict the areas under the curve (AUC) for the glucose tolerance test. (L–N) Fasting glucose (L), insulin levels (M), and HOMA/IR (N) in WT and Mpst−/− mice fed CD. Protein expression is presented as ratio over CD (A) or WT (B and C) group. Data are presented as means ±SEM; *, P < 0.05; **, P ≤ 0.01; ***, P ≤ 0.001; A–C, n = 5–6; D, F, K–N, n = 6–7; E, G–J, n = 4 mice per group. Source data are available for this figure: SourceData FS1.
Metabolic parameters in young WT and Mpst−/−mice fed normal CD. (A) Representative blots and quantitation of MPST expression in different tissues of WT mice fed CD or HFD for 16 wk. (B) Representative Western blots and quantitation of MPST, CSE, and CBS protein levels in iWAT of WT and Mpst−/− mice. (C) Protein persulfidation in iWAT of WT and Mpst−/− mice. (D and E) 6-wk old WT and Mpst−/− mice were fed a normal CD (10% of calories from fat) for 16 wk and body mass was measured weekly. Body weight curve (D) and representative photograph (E) of WT and Mpst−/− mice after 16 wk on CD. (F and G) 6-wk old female WT and Mpst−/− mice were fed HFD (45% calories from fat) for 16 wk; body mass was measured weekly (F); representative photograph (G) of female WT and Mpst−/− after 16 wk on HFD. (H–J) VO2 (H), VCO2 (I), and metabolic rate (J) of WT and Mpst−/− mice on CD assessed by indirect calorimetry. (K) Glucose tolerance test in WT and Mpst−/− mice fed CD. The insets depict the areas under the curve (AUC) for the glucose tolerance test. (L–N) Fasting glucose (L), insulin levels (M), and HOMA/IR (N) in WT and Mpst−/− mice fed CD. Protein expression is presented as ratio over CD (A) or WT (B and C) group. Data are presented as means ±SEM; *, P < 0.05; **, P ≤ 0.01; ***, P ≤ 0.001; A–C, n = 5–6; D, F, K–N, n = 6–7; E, G–J, n = 4 mice per group. Source data are available for this figure: SourceData FS1.

Excessive weight gain attenuated metabolic rate and impaired glucose/insulin tolerance in MPST-lacking mice. (A) 6-wk-old male WT and Mpst−/− mice were fed HFD (45% calories from fat) for 16 wk, and body mass was measured weekly. (B) Representative photograph of WT and Mpst−/− after 16 wk on HFD. (C and D) Body mass (C) and representative photograph (D) of 18-mo old WT and Mpst−/− mice fed a normal laboratory CD (10% calories from fat). (E–G) VO2 (E), VCO2 (F), and metabolic rate (G) of WT and Mpst−/− mice on HFD, assessed by indirect calorimetry. (H and I) Glucose (H) and insulin (I) tolerance test in WT and Mpst−/− mice fed HFD. The insets depict the areas under the curve (AUC) for the glucose and insulin tolerance tests. (J–L) Fasting glucose (J) and insulin (K) levels and HOMA/IR (L) in WT and Mpst−/− mice exposed to HFD. (M)MPST mRNA levels in subcutaneous fat in human cohorts of lean and obese individuals. BMI, body mass index. Data are presented as means ± SEM; *, P < 0.05; **, P ≤ 0.01; ***, P ≤ 0.001; A–L, n = 6–7 mice per group; M, n = 53–82 individuals per group.
Excessive weight gain attenuated metabolic rate and impaired glucose/insulin tolerance in MPST-lacking mice. (A) 6-wk-old male WT and Mpst−/− mice were fed HFD (45% calories from fat) for 16 wk, and body mass was measured weekly. (B) Representative photograph of WT and Mpst−/− after 16 wk on HFD. (C and D) Body mass (C) and representative photograph (D) of 18-mo old WT and Mpst−/− mice fed a normal laboratory CD (10% calories from fat). (E–G) VO2 (E), VCO2 (F), and metabolic rate (G) of WT and Mpst−/− mice on HFD, assessed by indirect calorimetry. (H and I) Glucose (H) and insulin (I) tolerance test in WT and Mpst−/− mice fed HFD. The insets depict the areas under the curve (AUC) for the glucose and insulin tolerance tests. (J–L) Fasting glucose (J) and insulin (K) levels and HOMA/IR (L) in WT and Mpst−/− mice exposed to HFD. (M)MPST mRNA levels in subcutaneous fat in human cohorts of lean and obese individuals. BMI, body mass index. Data are presented as means ± SEM; *, P < 0.05; **, P ≤ 0.01; ***, P ≤ 0.001; A–L, n = 6–7 mice per group; M, n = 53–82 individuals per group.
MPST loss/inhibition leads to increased lipid accumulation
There are significant functional differences in adipose tissue, depending on its type and anatomic location. We therefore measured the weight and assessed the morphology of two major WAT depots: iWAT and gonadal WAT (gWAT), as well as interscapular brown adipose tissue (iBAT). Mpst−/− mice fed a HFD showed increased iWAT mass, whereas no differences were observed in gWAT and iBAT (Fig. 2 A). H&E staining revealed that the enhanced mass of iWAT was due, at least in part, to increased lipid accumulation (Fig. 2 B). This observation was further confirmed by measuring adipocyte surface area: lack of MPST was associated with the presence of significantly larger adipocytes in iWAT (Fig. 2 C). Similar observations regarding iWAT mass and adipocyte size were also noted in 18-mo-old MPST-deficient mice fed a normal CD (Fig. 2, D–F). During prolonged excessive caloric intake, the storage capacity of the adipose tissue is exceeded; fat then accumulates ectopically causing lipotoxicity (Cohen and Spiegelman, 2016). One of the major ectopic fat storage sites is the liver. In line with the excessively obese phenotype of Mpst−/− mice on HFD, liver weight was increased in these mice and exhibited histological signs of steatosis (Fig. 2, G and H). Mass measurements and H&E and Oil Red O staining also revealed increased liver weight and greater tissue lipid content in aged Mpst−/− mice fed a CD (Fig. 2, I and J).

Increased adipocyte size, iWAT mass, and liver steatosis in Mpst−/−mice. (A) WT and Mpst−/− mice were fed HFD for 16 wk. After sacrifice, iWAT, gWAT, and iBAT mass were determined. (B and C) Representative photomicrographs from H&E-stained sections of the three adipose tissue types in the two groups (B) and adipocyte size measurements (C), quantified used ImageJ analysis software. (D–F) iWAT, gWAT, and iBAT mass (D), representative photomicrographs from H&E-stained sections (E), and adipocyte size measurements of indicated adipose tissue (F), isolated from aged (18 mo) WT and Mpst−/− mice fed CD. (G–J). Liver mass (G) and H&E- and Oil Red O–stained liver sections (H) of WT and MPST-lacking mice after 16 wk on HFD and 18 mo on CD (I and J). (K and L) Photomicrographs (K) and quantitation of lipid accumulation (L) in adipocytes in the presence and absence of an MPST inhibitor (I3MT-3). Preadipocytes were isolated from inguinal fat depots of WT mice and differentiated for 7 d. They were then treated with vehicle or I3MT-3 (50 μΜ) for 24 h before being exposed to FA. After incubation for 24 h, lipid accumulation was evaluated by Oil Red O staining. (M–O) WT differentiated adipocytes were transfected with an empty vector or an MPST-expressing vector, and lipid accumulation was measured by Oil Red O staining. MPST overexpression over endogenous MPST is quantified in the bar graph. Transfected MPST was V5-tagged. Optical density and protein expression are presented as ratio over vehicle (L) or vector (M and O) group. Data are presented as means ± SEM; *, P < 0.05; **, P ≤ 0.01; ***, P ≤ 0.001; A, D, G, and I, n = 6–7 and B, C, E, F, H, and J, n = 4 mice per group. K, M, and N, n = 4; L and O, n = 5–6 individuals cell cultures per group. Scale bar: 200 μm (B, E, H, and J) or 100 μm (K and N). Source data are available for this figure: SourceData F2.
Increased adipocyte size, iWAT mass, and liver steatosis in Mpst−/−mice. (A) WT and Mpst−/− mice were fed HFD for 16 wk. After sacrifice, iWAT, gWAT, and iBAT mass were determined. (B and C) Representative photomicrographs from H&E-stained sections of the three adipose tissue types in the two groups (B) and adipocyte size measurements (C), quantified used ImageJ analysis software. (D–F) iWAT, gWAT, and iBAT mass (D), representative photomicrographs from H&E-stained sections (E), and adipocyte size measurements of indicated adipose tissue (F), isolated from aged (18 mo) WT and Mpst−/− mice fed CD. (G–J). Liver mass (G) and H&E- and Oil Red O–stained liver sections (H) of WT and MPST-lacking mice after 16 wk on HFD and 18 mo on CD (I and J). (K and L) Photomicrographs (K) and quantitation of lipid accumulation (L) in adipocytes in the presence and absence of an MPST inhibitor (I3MT-3). Preadipocytes were isolated from inguinal fat depots of WT mice and differentiated for 7 d. They were then treated with vehicle or I3MT-3 (50 μΜ) for 24 h before being exposed to FA. After incubation for 24 h, lipid accumulation was evaluated by Oil Red O staining. (M–O) WT differentiated adipocytes were transfected with an empty vector or an MPST-expressing vector, and lipid accumulation was measured by Oil Red O staining. MPST overexpression over endogenous MPST is quantified in the bar graph. Transfected MPST was V5-tagged. Optical density and protein expression are presented as ratio over vehicle (L) or vector (M and O) group. Data are presented as means ± SEM; *, P < 0.05; **, P ≤ 0.01; ***, P ≤ 0.001; A, D, G, and I, n = 6–7 and B, C, E, F, H, and J, n = 4 mice per group. K, M, and N, n = 4; L and O, n = 5–6 individuals cell cultures per group. Scale bar: 200 μm (B, E, H, and J) or 100 μm (K and N). Source data are available for this figure: SourceData F2.
Having demonstrated that Mpst deletion promotes fat accumulation in iWAT, we sought to determine whether pharmacological inhibition of MPST phenocopies the effects seen in the genetic model. To this end, pre-adipocytes were isolated from iWAT of WT animals, differentiated into adipocytes, and treated with the MPST inhibitor, I3MT-3, in the presence or absence of a fatty acid supplement (FA). Oil Red O staining revealed enhanced lipid accumulation in the presence of the MPST inhibitor (Fig. 2, K and L). In contrast, the overexpression of MPST (approximately twofold) led to a reduction in adipocyte lipid accumulation (Fig. 2, M–O), suggesting a cell-autonomous, causal link between MPST inhibition and increased fat accumulation.
Deletion of Mpst affects the adipose tissue transcriptome
We next sought to identify the mechanisms through which lack of MPST leads to exacerbated obesity. Initially, we ruled out that the observed differences between the two genotypes were due to altered food consumption (Fig. S2 A) or physical activity (Fig. S2, B–D). To gain insight into the biological processes altered by Mpst deletion, RNA sequencing (RNA-seq) was performed using iWAT from WT and Mpst−/− mice maintained on HFD. Subsequent bioinformatic analyses revealed a plethora of differentially expressed genes (DEGs) between the two genotypes. The expression of 743 genes was significantly altered by MPST deletion; 494 were upregulated and 249 were downregulated by ≥0.8 ± log2fold, based on adjusted P values (Fig. 3 A). Gene Ontology (GO) analysis of the upregulated transcripts in Mpst−/− iWAT revealed inflammation- and immune response–related pathways among the most affected biological processes (Fig. 3 B). These findings are in line with the fact that obesity and inflammation are tightly interlinked biological events (Reilly and Saltiel, 2017). GO enrichment analysis of downregulated genes in Mpst−/− iWAT revealed major alterations in the transcripts encoding nucleus-encoded mitochondrial proteins (Fig. 3 C). Among the latter group were transcripts coding for subunits of the translocase of the inner membrane (TIM) or the outer mitochondrial membrane (TOM; Fig. 3, B and C) and included components of the mitochondrial respiratory chain (Fig. S2 E). Tomm6, Tomm7, Tomm40l, Tomm34, Timm17b, Timm50, Timm8b, Timm13, and Pam16 were among the significantly downregulated transcripts in HFD mice lacking MPST (Fig. 4, A and B). The RNA-seq results for some of the TIM/TOM complex subunits were confirmed by quantitative real-time PCR (qRT-PCR; Fig. 4 C) and the downregulation of TOMM40L and TIMM50 was demonstrated by Western blotting (Fig. 4 D). In line with our observations on tissue histology, the expression of Tomm7, Tomm40L, Timm17b, and Timm50 were not altered in gWAT and iBAT from Mpst−/− mice (Fig. 4, E and F); both Timm17b and Timm50 were reduced in iWAT from aged Mpst−/− given the CD diet (Fig. 4 G). Interestingly, the expression of Tomm7 and Tomm40l was attenuated in WT mice fed a HFD compared to WT mice on CD (Fig. 4 H), suggesting that reduced TIM/TOM subunit expression is a feature of obesity that is exacerbated by the lack of MPST. Despite changes in TIM/TOM protein levels, there was no evidence of a change in mitochondrial mass in Mpst−/− iWAT, as inferred by the similar amount of mitochondrial DNA in iWAT from WT and Mpst−/− mice (Fig. 4 I). In line with this observation, transmission EM experiments did not reveal any differences in mitochondrial area and number between WT HFD and Mpst−/− HFD mice (Fig. 4, J–L). However, a change in shape was noted, as mitochondria were more elongated in iWAT of WT HFD mice compared with Mpst−/− HFD (Fig. 4 M).

Effects of Mpst ablation on food intake, activity, and respiratory gene expression of mice fed HFD. (A–D) Food intake (A), total activity (B), ambulation (C), and rearing measurements (D) of WT and Mpst−/− on HFD. These measurements refer to the experiments depicted in Fig. 1 and represent measurements of indirect calorimetry. (E) Heatmap illustrating changes in gene expression of respiratory complexes I–V subunits in iWAT of WT vs. Mpst−/−. FC, fold change. Depicted changes were calculated from the RNA-seq dataset. Food intake is presented as ratio over WT HFD group. Data are presented as means ± SEM; A–D, n = 7; E, n = 3 mice per group.
Effects of Mpst ablation on food intake, activity, and respiratory gene expression of mice fed HFD. (A–D) Food intake (A), total activity (B), ambulation (C), and rearing measurements (D) of WT and Mpst−/− on HFD. These measurements refer to the experiments depicted in Fig. 1 and represent measurements of indirect calorimetry. (E) Heatmap illustrating changes in gene expression of respiratory complexes I–V subunits in iWAT of WT vs. Mpst−/−. FC, fold change. Depicted changes were calculated from the RNA-seq dataset. Food intake is presented as ratio over WT HFD group. Data are presented as means ± SEM; A–D, n = 7; E, n = 3 mice per group.

Deletion of Mpst leads to changes in the adipose tissue transcriptome. (A–C) Volcano plot of detected transcripts (A) and GO enrichment analysis regarding Biological Process (B) or Cellular Component (C) of DEGs (up- or downregulated) in iWAT of WT and Mpst−/− fed HFD. Data were obtained from RNA-seq. A–C, n = 3 mice per group.
Deletion of Mpst leads to changes in the adipose tissue transcriptome. (A–C) Volcano plot of detected transcripts (A) and GO enrichment analysis regarding Biological Process (B) or Cellular Component (C) of DEGs (up- or downregulated) in iWAT of WT and Mpst−/− fed HFD. Data were obtained from RNA-seq. A–C, n = 3 mice per group.

Mpst loss is associated with decreased transcript levels of TIM/TOM components in inguinal fat. (A) Heatmap depicting expression of the components of the translocase of the inner (TIM) and outer (TOM) membrane complex. FC, fold change. (B) Schematic representation of TIM/TOM complex architecture. (C and D) Differential gene and protein expression of selected TIM/TOM subunits between two genotypes was confirmed by RT-PCR (C) and Western blotting (D). (E and F)Tomm7, Tomm40l, Timm17b, and Timm50 expression in gWAT (E) and iBAT of WT and MPST-lacking mice fed a HFD (F). (G) Gene expression levels of selected TIM/TOM complex components in iWAT of aged WT and Mpst−/− mice fed a CD. (H)Tomm7, Tomm40l, Timm17b, and Timm50 expression in iWAT of WT mice fed CD or an HFD. (I) Mitochondrial number in iWAT from WT and Mpst−/− HFD mice was inferred by mitochondrial DNA content detected by RT-PCR. (J) Representative transmission EM photomicrograph from iWAT of WT and Mpst−/− mice after 16 wk of HFD. (K–M) Measurements of mitochondrial number (K), area (L), and shape (M) in iWAT of mice from the two genotypes on HFD. Gene expression and protein expression are presented as ratio over WT HFD (C–F and I) or WT CD (G and H) group. CT, connective tissue; LD, lipid droplet. Data are presented as means ± SEM; *, P < 0.05; **, P ≤ 0.01; ***, P ≤ 0.001; A and J, n = 3; C–F, n = 3–5; and G–I, n = 5–7 mice per group. K, n = 24–29 cells per group; L and M, n = 83–113 mitochondria per group. Scale bar: 1 μm (J). Source data are available for this figure: SourceData F4.
Mpst loss is associated with decreased transcript levels of TIM/TOM components in inguinal fat. (A) Heatmap depicting expression of the components of the translocase of the inner (TIM) and outer (TOM) membrane complex. FC, fold change. (B) Schematic representation of TIM/TOM complex architecture. (C and D) Differential gene and protein expression of selected TIM/TOM subunits between two genotypes was confirmed by RT-PCR (C) and Western blotting (D). (E and F)Tomm7, Tomm40l, Timm17b, and Timm50 expression in gWAT (E) and iBAT of WT and MPST-lacking mice fed a HFD (F). (G) Gene expression levels of selected TIM/TOM complex components in iWAT of aged WT and Mpst−/− mice fed a CD. (H)Tomm7, Tomm40l, Timm17b, and Timm50 expression in iWAT of WT mice fed CD or an HFD. (I) Mitochondrial number in iWAT from WT and Mpst−/− HFD mice was inferred by mitochondrial DNA content detected by RT-PCR. (J) Representative transmission EM photomicrograph from iWAT of WT and Mpst−/− mice after 16 wk of HFD. (K–M) Measurements of mitochondrial number (K), area (L), and shape (M) in iWAT of mice from the two genotypes on HFD. Gene expression and protein expression are presented as ratio over WT HFD (C–F and I) or WT CD (G and H) group. CT, connective tissue; LD, lipid droplet. Data are presented as means ± SEM; *, P < 0.05; **, P ≤ 0.01; ***, P ≤ 0.001; A and J, n = 3; C–F, n = 3–5; and G–I, n = 5–7 mice per group. K, n = 24–29 cells per group; L and M, n = 83–113 mitochondria per group. Scale bar: 1 μm (J). Source data are available for this figure: SourceData F4.
Defective mitochondrial protein import/functions in Mpst−/− HFD mice
Since mitochondria acquire more than 1,000 different proteins from the cytosol, we reasoned that reduced functionality of the TIM/TOM complex would have a significant impact on mitochondrial function. To provide evidence of functional alterations that accompany reduced TIM/TOM subunit expression in Mpst−/− mice, we measured the levels of two nuclear-encoded mitochondria-localized proteins, citrate synthase (CS) and superoxide dismutase 2 (SOD2). Total protein levels of CS and SOD2 were comparable between WT and Mpst−/− mice on HFD (Fig. 5 A). However, the mitochondria/cytosol ratio of these proteins was significantly altered: CS and SOD2 levels were lower in the mitochondrial and higher in the cytosolic fractions, suggesting that their import into the mitochondria is impaired (Fig. 5 A).
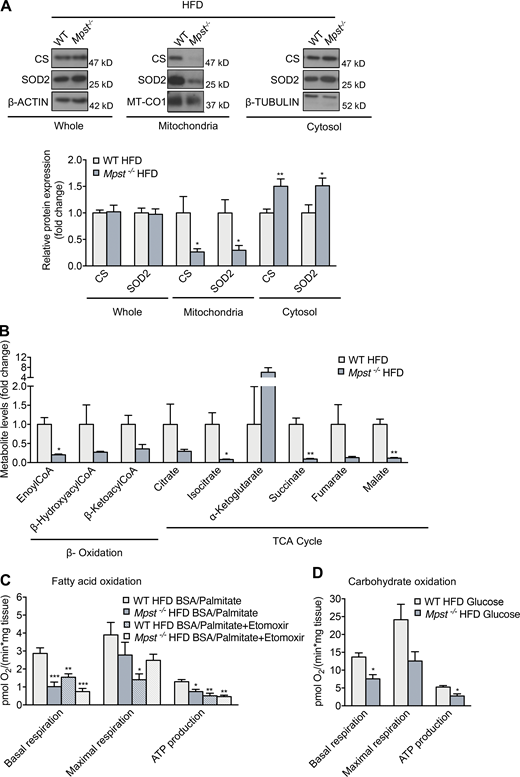
Mpst ablation reduces mitochondrial protein import, causing mitochondrial dysfunction. (A) Representative Western blots and quantitation of CS and SOD2 in total, mitochondrial, and cytosol lysates in iWAT from WT and MPST-lacking mice on HFD. (B) Targeted metabolomics analysis of β-oxidation and TCA cycle metabolites in iWAT from WT and Mpst−/− HFD mice. (C and D) Oxygen consumption rate measurements in iWAT of WT and Mpst−/− HFD mice in the presence of palmitate (C) or glucose (D) determined using a Seahorse Flux Analyzer. The assay protocol consisted of the subsequent addition of oligomycin, carbonyl cyanide-4 (trifluoromethoxy) phenylhydrazone, and a mixture of rotenone and antimycin A, as described in Materials and methods. Protein expression and metabolite levels are presented as ratio over WT HFD group. Data are presented as means ± SEM; *, P < 0.05; **, P ≤ 0.01; ***, P ≤ 0.001 (for C *vs. WT HFD BSA/Palmitate); A, n = 6–7; B, n = 3; C and D, n = 4–6 mice per group. Source data are available for this figure: SourceData F5.
Mpst ablation reduces mitochondrial protein import, causing mitochondrial dysfunction. (A) Representative Western blots and quantitation of CS and SOD2 in total, mitochondrial, and cytosol lysates in iWAT from WT and MPST-lacking mice on HFD. (B) Targeted metabolomics analysis of β-oxidation and TCA cycle metabolites in iWAT from WT and Mpst−/− HFD mice. (C and D) Oxygen consumption rate measurements in iWAT of WT and Mpst−/− HFD mice in the presence of palmitate (C) or glucose (D) determined using a Seahorse Flux Analyzer. The assay protocol consisted of the subsequent addition of oligomycin, carbonyl cyanide-4 (trifluoromethoxy) phenylhydrazone, and a mixture of rotenone and antimycin A, as described in Materials and methods. Protein expression and metabolite levels are presented as ratio over WT HFD group. Data are presented as means ± SEM; *, P < 0.05; **, P ≤ 0.01; ***, P ≤ 0.001 (for C *vs. WT HFD BSA/Palmitate); A, n = 6–7; B, n = 3; C and D, n = 4–6 mice per group. Source data are available for this figure: SourceData F5.
To evaluate the consequences of defective import of mitochondrial proteins on metabolic functions of this organelle, we first performed targeted metabolomics. Levels of several metabolites and intermediates of β-oxidation and the TCA cycle were reduced or showed a strong trend toward reduction in iWAT from Mpst−/− vs. WT mice on HFD (Fig. 5 B). In line with the attenuated expression of respiratory chain genes and the reduction in mitochondrial protein import, the oxygen consumption rate was decreased in iWAT from HFD MPST-deficient mice when either fatty acids (palmitate) or carbohydrates (glucose) were used as fuels to drive cellular bioenergetics (Fig. 5, C and D). Basal respiration and ATP production after palmitate exposure in the Mpst−/− HFD group was reduced to a level similar to the reduction observed in the presence of the carnitine palmitoyltransferase etomoxir (Fig. 5 C). A strong trend that did not reach statistical significance was also observed for maximal respiration between the Mpst−/− HFD and WT HFD groups. Since fatty acid breakdown occurs through β-oxidation, the TCA cycle, and oxidative phosphorylation, our findings suggest that increased lipid accumulation in iWAT likely results from suppressed fatty acid catabolism in Mpst−/− adipocytes.
Downregulation/inhibition of mitochondrial translocase results in increased fat deposition
To determine whether defective TIM/TOM complex function leads to adipocyte enlargement, gene silencing and pharmacological approaches were used. To mimic the simultaneous reduction in the expression of several translocase subunits, such as those occurring in the iWAT of Mpst−/− HFD mice, Tomm7, Tomm40l, Timm17b, and Timm50 were silenced in cultured WT adipocytes (Fig. 6, A–D). Oil Red O staining revealed that the knockdown of all four TIM/TOM components increased the lipid content of adipocytes treated with fatty acids (Fig. 6, E and F). It should be noted that knockdown of TIM/TOM subunits did not alter mitochondrial mass, as indicated by MitoTracker staining (Fig. 6, G and H). To determine the relative contribution of each TIM/TOM complex protein to the observed phenotype, individual subunits were also silenced. This approach revealed that silencing either Tomm7 or Tomm40l was sufficient to drive the enhanced storage of lipids (Fig. 6, I and J). The causal relationship between the integrity of mitochondrial protein import and lipid accumulation was confirmed by treating adipocytes with two chemically distinct inhibitors of TIM/TOM function, Mitoblock12 (M12) and Mitoblock 6 (M6; Fig. 6, K–N).

Inhibition of adipocyte mitochondrial translocase complex enhances lipid accumulation. (A–D) Adipocytes were differentiated and TIM/TOM complex components were knocked down using silencing RNA for 48 h. Reduction of Tomm7 (A), Tomm40l (B), Timm50 (C), and Timm17b (D) expression 48 h after transfection was confirmed by real-time PCR. (E and F) Lipid accumulation was determined using Oil Red O in adipocytes transfected with a control siRNA (siNeg; E) or a combination of siRNA targeting both the inner and outer mitochondrial complex (F). (G and H) Changes in mitochondrial mass were quantified by Mitotracker staining. (I and J) Individual TIM/TOM complex subunits were knocked down, and lipid accumulation was determined. (K–N) Lipid accumulation was also evaluated in adipocytes in which the function of the TIM/TOM complex was impaired using two distinct pharmacological inhibitors, M12 (K and L) and M6 (M and N). Differentiated adipocytes were treated with 4 μM M12 or 5 μM M6 for 1 h. They were then exposed to FA for 24 h and stained with Oil Red O. FA was also added in the transfected with the indicated siRNAs adipocytes, 24 h before staining. Gene expression, optical density, and integrated density are presented as ratio over siNeg (A–D, F, H, and J) or vehicle (L and N) group. Data are presented as means ± SEM; *, P < 0.05; **, P ≤ 0.01; ***, P ≤ 0.001 (for J, * vs. siNeg); A–D, G, H, L, and N, n = 5–6; E, I, K, and M, n = 4; F and J, n = 14 individual cell cultures per group. Scale bar: 100 μm (E, I, K, and M) or 200 μm (G).
Inhibition of adipocyte mitochondrial translocase complex enhances lipid accumulation. (A–D) Adipocytes were differentiated and TIM/TOM complex components were knocked down using silencing RNA for 48 h. Reduction of Tomm7 (A), Tomm40l (B), Timm50 (C), and Timm17b (D) expression 48 h after transfection was confirmed by real-time PCR. (E and F) Lipid accumulation was determined using Oil Red O in adipocytes transfected with a control siRNA (siNeg; E) or a combination of siRNA targeting both the inner and outer mitochondrial complex (F). (G and H) Changes in mitochondrial mass were quantified by Mitotracker staining. (I and J) Individual TIM/TOM complex subunits were knocked down, and lipid accumulation was determined. (K–N) Lipid accumulation was also evaluated in adipocytes in which the function of the TIM/TOM complex was impaired using two distinct pharmacological inhibitors, M12 (K and L) and M6 (M and N). Differentiated adipocytes were treated with 4 μM M12 or 5 μM M6 for 1 h. They were then exposed to FA for 24 h and stained with Oil Red O. FA was also added in the transfected with the indicated siRNAs adipocytes, 24 h before staining. Gene expression, optical density, and integrated density are presented as ratio over siNeg (A–D, F, H, and J) or vehicle (L and N) group. Data are presented as means ± SEM; *, P < 0.05; **, P ≤ 0.01; ***, P ≤ 0.001 (for J, * vs. siNeg); A–D, G, H, L, and N, n = 5–6; E, I, K, and M, n = 4; F and J, n = 14 individual cell cultures per group. Scale bar: 100 μm (E, I, K, and M) or 200 μm (G).
HIF1α activation links lack of MPST to reduced TIM/TOM function
Having established the importance of TIM/TOM function in lipid accumulation, we next investigated the molecular events connecting the lack of MPST to the downregulation of TIM/TOM components. Transcription factor enrichment analysis of DEGs in iWAT from WT and Mpst−/− mice on HFD (Table S1) revealed a major impact (top 10%) of hypoxia inducible factor 1α (HIF1α), which has already been associated with obesity (Jiang et al., 2011; Krishnan et al., 2012; Lee et al., 2014; Zhang et al., 2010). Gene set enrichment analysis confirmed that the inguinal fat of Mpst−/− HFD mice was significantly enriched in genes related to the HIF1α pathway (Fig. 7 A), and HIF1α expression itself was also increased in Mpst−/− HFD mice (Fig. 7B). Consistent with these findings, nuclear HIF1α levels were higher in iWAT extracts from Mpst−/− HFD mice compared with WT mice (Fig. 7 C). HIF1α can be activated by ROS, as well as by hypoxia, and increased H2O2 levels in iWAT from Mpst−/− animals might explain how Mpst ablation leads to HIF1α activation (Fig. S3 A).
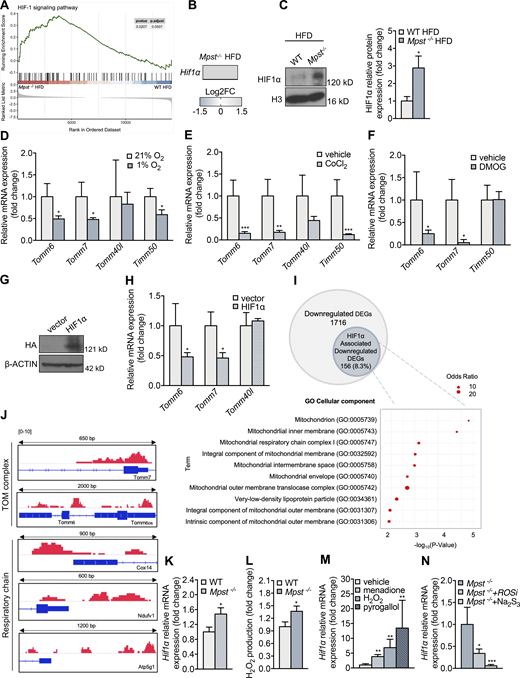
HIF1α contributes to TIM/TOM subunit expression. (A) Gene set enrichment analysis of the HIF pathway in iWAT Mpst−/− HFD mice. Data were obtained from RNA-seq. (B) HIF1α expression is upregulated in iWAT of Mpst−/− HFD mice. (C) Representative Western blot and quantitation of HIF1α in nuclear extracts of iWAT from WT and Mpst−/− HFD mice. FC, fold change; H3, histone 3. (D–F) Differentiated adipocytes were exposed to hypoxia (1% O2, 48 h; D), CoCl2 (300 μM, 24 h; E), or DMOG (1 mM, 48 h; F), and the expression levels of selected TIM/TOM complex components were measured by real-time PCR. (G and H) A nondegradable form of HIF1α was overexpressed in differentiated 3T3L1 adipocytes, and Tomm6, Tomm7, and Tomm40l levels were evaluated. Empty vector used a negative control. HIF1α was HA-tagged, so only the overexpressed HIF1α is detected using a HA antibody. (I) Venn diagram showing total and HIF1α-associated downregulated DEGs as defined by the respective RNA-seq and ChIP-seq datasets. GO enrichment analysis regarding Cellular Component of HIF1α-associated DEGs. (J) ChIP-seq was performed in the iWAT of Mpst−/− HFD; binding of HIF1α at the promoters of Tomm7 and Tomm6 and at the proximal DNA regulatory regions of respiratory complex subunits Cox14, Ndufv1, and Atp5g1 genes. The relative length of the represented genomic loci is also indicated. (K) HIF1α expression is upregulated in adipocytes from Mpst−/− mice. (L) H2O2 levels were measured using Amplex red in adipocytes from the two genotypes. (M) WT adipocytes were exposed to menadione (5 μM), H202 (150 μM), or pyrogallol (100 μM) for 24 h, and HIF1α mRNA levels were measured by RT-PCR. (N)Mpst−/− adipocytes were incubated for 24 h in 1% O2 in the absence or presence of ROS scavengers (ROSi: a combination of DMSO 130 mM, α-tocopherol 50 μM, and Tiron 10 mM) or Na2S3 (100 μM), and HIF1α mRNA levels were determined by RT-PCR. Gene expression and protein expression are presented as ratio over WT HFD (C), 21% O2 (D), vehicle (E, F, and M), vector (H), WT (K and L), and Mpst−/− (N) group. Data are presented as means ± SEM; *, P < 0.05; **, P ≤ 0.01; ***, P ≤ 0.001 (for M, * vs. vehicle; for N, vs. Mpst−/−); A and B, n = 3; C, n = 5; I, n = 1–3; J, n = 1 mouse/mice per group; D–F, H, K–M, n = 5–8; G, n = 1 individual cell cultures per group. Source data are available for this figure: SourceData F7.
HIF1α contributes to TIM/TOM subunit expression. (A) Gene set enrichment analysis of the HIF pathway in iWAT Mpst−/− HFD mice. Data were obtained from RNA-seq. (B) HIF1α expression is upregulated in iWAT of Mpst−/− HFD mice. (C) Representative Western blot and quantitation of HIF1α in nuclear extracts of iWAT from WT and Mpst−/− HFD mice. FC, fold change; H3, histone 3. (D–F) Differentiated adipocytes were exposed to hypoxia (1% O2, 48 h; D), CoCl2 (300 μM, 24 h; E), or DMOG (1 mM, 48 h; F), and the expression levels of selected TIM/TOM complex components were measured by real-time PCR. (G and H) A nondegradable form of HIF1α was overexpressed in differentiated 3T3L1 adipocytes, and Tomm6, Tomm7, and Tomm40l levels were evaluated. Empty vector used a negative control. HIF1α was HA-tagged, so only the overexpressed HIF1α is detected using a HA antibody. (I) Venn diagram showing total and HIF1α-associated downregulated DEGs as defined by the respective RNA-seq and ChIP-seq datasets. GO enrichment analysis regarding Cellular Component of HIF1α-associated DEGs. (J) ChIP-seq was performed in the iWAT of Mpst−/− HFD; binding of HIF1α at the promoters of Tomm7 and Tomm6 and at the proximal DNA regulatory regions of respiratory complex subunits Cox14, Ndufv1, and Atp5g1 genes. The relative length of the represented genomic loci is also indicated. (K) HIF1α expression is upregulated in adipocytes from Mpst−/− mice. (L) H2O2 levels were measured using Amplex red in adipocytes from the two genotypes. (M) WT adipocytes were exposed to menadione (5 μM), H202 (150 μM), or pyrogallol (100 μM) for 24 h, and HIF1α mRNA levels were measured by RT-PCR. (N)Mpst−/− adipocytes were incubated for 24 h in 1% O2 in the absence or presence of ROS scavengers (ROSi: a combination of DMSO 130 mM, α-tocopherol 50 μM, and Tiron 10 mM) or Na2S3 (100 μM), and HIF1α mRNA levels were determined by RT-PCR. Gene expression and protein expression are presented as ratio over WT HFD (C), 21% O2 (D), vehicle (E, F, and M), vector (H), WT (K and L), and Mpst−/− (N) group. Data are presented as means ± SEM; *, P < 0.05; **, P ≤ 0.01; ***, P ≤ 0.001 (for M, * vs. vehicle; for N, vs. Mpst−/−); A and B, n = 3; C, n = 5; I, n = 1–3; J, n = 1 mouse/mice per group; D–F, H, K–M, n = 5–8; G, n = 1 individual cell cultures per group. Source data are available for this figure: SourceData F7.

HIF1α binding profile in iWAT of Mpst − / − mice. (A) Hydrogen peroxide levels were measured in the iWAT of mice WT and Mpst−/− on HFD using Amplex red. (B and C) Photomicrographs (B) and quantitation (C) of lipid accumulation in differentiated adipocytes exposed to hypoxic conditions (1% O2, 48 h). These measurements refer to the experiments depicted in Fig. 7. (D) Tornado plot showing HIF1α binding throughout the peaks (±3 kb). (E) UCSC browser panels showing the identified HIF1α binding sites on the regulatory regions of Tomm7, Tomm6, Cox14, Ndufv1, and Atp5g1, as defined by the ConTra v3 web server using publicly available HIF1α binding motif data. Optical density and hydrogen peroxide levels are presented as ratio over 1% O2 (C) or WT HFD group (A). Data are presented as means ± SEM; *, P < 0.05; ***, P ≤ 0.001; A, n = 5; D, n = 1 mouse/mice per group; B and C, n = 10 individual cell cultures per group.
HIF1α binding profile in iWAT of Mpst − / − mice. (A) Hydrogen peroxide levels were measured in the iWAT of mice WT and Mpst−/− on HFD using Amplex red. (B and C) Photomicrographs (B) and quantitation (C) of lipid accumulation in differentiated adipocytes exposed to hypoxic conditions (1% O2, 48 h). These measurements refer to the experiments depicted in Fig. 7. (D) Tornado plot showing HIF1α binding throughout the peaks (±3 kb). (E) UCSC browser panels showing the identified HIF1α binding sites on the regulatory regions of Tomm7, Tomm6, Cox14, Ndufv1, and Atp5g1, as defined by the ConTra v3 web server using publicly available HIF1α binding motif data. Optical density and hydrogen peroxide levels are presented as ratio over 1% O2 (C) or WT HFD group (A). Data are presented as means ± SEM; *, P < 0.05; ***, P ≤ 0.001; A, n = 5; D, n = 1 mouse/mice per group; B and C, n = 10 individual cell cultures per group.
The involvement of HIF1α in the regulation of TIM/TOM gene expression was investigated by exposing differentiated adipocytes to hypoxia (1% oxygen). Hypoxic conditions elicited a significant reduction in Tomm6, Tomm7, and Timm50 levels (Fig. 7 D) as well as an increase in lipid accumulation (Fig. S3, B and C). Similar results were obtained by treating cells with CoCl2, an agent commonly used to cause chemical hypoxia (Fig. 7 E). Moreover, the pharmacological activation of HIF1α using the prolyl 4-hydroxylase inhibitor dimethyloxalylglycine (DMOG; Semenza, 2019; Fig. 7 F), and the overexpression of a mutant form of HIF1α that is resistant to degradation at normal oxygen tensions (Fig. 7, G and H), reduced adipocyte Tomm6 and Tomm7 levels. Taken together, our in vitro findings suggest that HIF1α activation suppresses mitochondrial translocase subunit expression levels which, in turn, reduce protein import in adipocytes.
To seek direct proof for a molecular link between HIF1α and downregulation of TIM/TOM subunits, chromatin immunoprecipitation (ChIP) was performed using iWAT from Mpst−/− mice on HFD, and HIF1α targets were identified by deep sequencing. As shown in the tornado plot (Fig. S3 D), there was robust binding of HIF1α throughout the genome. Bioinformatic analysis of the binding regions revealed several HIF1α target genes in adipose tissue. Interestingly, 8.3% of the genes identified as being downregulated in mice lacking MPST based on RNA-seq were related to HIF1α (Fig. 7 I). GO analysis of the overlapping genes indicated their strong association with mitochondrial structure and function (Fig. 7 I). HIF1α binding to the Tomm6 and Tomm7 promoters was observed, underscoring its importance in the transcriptional regulation of these two TOM subunits (Fig. 7 J). It should be noted that HIF1α binding was also detected in the proximal regulatory regions of the Cox14, Ndufv1, and Atp5g1 genes, which encode key mitochondrial respiratory chain complex proteins that were also downregulated in iWAT of the Mpst−/− mice fed HFD (Fig. 7 J). Additionally, motif analysis on the promoters of Tomm6, Tomm7, Cox14, Atp5g1, and Ndufv1 revealed robust binding of HIF1α and identified HIF1α binding sites, validating the results of the ChIP sequencing (ChIP-seq) experiments (Fig. S3 E).
To investigate the mechanism through which MPST deficiency leads to increased HIF1α activity, pre-adipocytes were isolated and differentiated into adipocytes in culture. Adipocytes from Mpst−/− mice expressed higher levels of HIF1α (Fig. 7 K) and produced greater amounts of H2O2 (Fig. 7 L). Exposure of WT adipocytes to the ROS-generating agents menadione and pyrogallol, as well as H2O2, resulted in increased HIF1α levels (Fig. 7 M). To determine the contribution of ROS to HIF1α expression in the absence of MPST, Mpst−/− adipocytes were cultured under hypoxia (1% O2) in the presence and absence of ROS scavengers. In these experiments, ROS scavenging and sodium trisulfide (Na2S3) administration attenuated HIF1α expression (Fig. 7 N).
Sulfide donor administration reduces obesity and restores metabolic health
MPST is a significant source of biologically active sulfide species. To assess whether the key role of MPST in energy homeostasis and metabolic health could be attributed to the altered generation of sulfide species, we studied the consequences of treating mice with the sulfide donor SG1002 (Szabo and Papapetropoulos, 2017). WT mice were placed on HFD for 10 wk to initiate obesity before being treated with the sulfide donor. HFD mice treated with SG1002 increased their body weight by an average of 8 g less than control HFD animals (Fig. 8, A and B). Administration of SG1002 to mice receiving a normal diet did not result in any weight reduction (Fig. S4 A). Moreover, no differences in food intake or activity of the animals on HFD receiving SG1002 was detected (Fig. S4, B–E). Enhanced sulfide levels after SG1002 administration were confirmed by measuring the footprint of increased hydrogen sulfide/persulfides on proteins; mice treated with SG1002 exhibited an increase in protein sulfhydration (Fig. 8 C). Importantly, SG1002 administration increased VO2, VCO2, and metabolic rate in mice given HFD (Fig. 8, D–F), suggesting that the sulfide-induced protection against weight gain is, at least in part, due to accelerated whole-body metabolism. SG1002 administration also increased the expression of Tomm17b and Tomm40l in WT HFD mice (Fig. S4 F). Improved metabolic health of animals given SG1002 was also evident by the improved responsiveness in the glucose and insulin tolerance tests (Fig. 8, G and H). In addition, SG1002 reduced iWAT mass and iWAT adipocyte size (Fig. 8, I–K). The beneficial effect of SG1002 in obesity was confirmed in Mpst−/− mice (Fig. S4 G), where it also reduced iWAT mass (Fig. S4 H) and adipocyte size (Fig. S4, I and J) and reversed the decrease in Tomm7 and Timm50 in iWAT (Fig. S4 K).
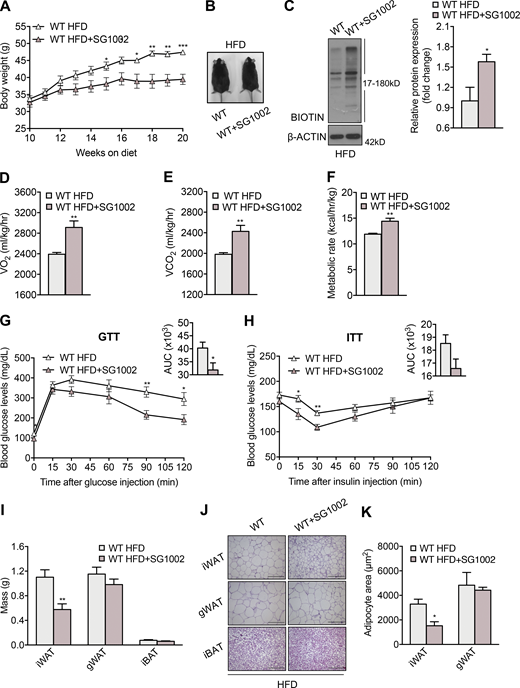
Therapeutic administration of a sulfide donor reduces HFD-induced obesity. WT mice were fed HFD (45% calories from fat) for 10 wk and were either switched to HFD containing the sulfide donor SG1002 or continued on a drug-free HFD. Based on daily chow consumption, mice received 40 mg/kg SG1002. (A) Body mass was measured weekly up to week 20. (B) Representative photograph of mice fed HFD with or without SG1002 at the end of the 20-wk experiment. (C) Representative Western blot and quantification of persulfidated adipose tissue proteins in mice demonstrating enhanced persulfidation in the SG1002 group. (D–F) VO2 (D), VCO2 (E), and metabolic rate (F) of mice fed HFD with or without SG1002 treatment. (G and H) Glucose (G) and insulin (H) tolerance test in HFD mice with and without SG1002 administration. The insets depict the areas under the curve (AUC) for the glucose and insulin tolerance tests. (I) iWAT, gWAT, and iBAT tissue mass of HFD mice with or without SG1002 treatment. (J and K) Representative photomicrographs of iWAT, gWAT, and BAT sections stained with H&E (J) and adipocyte size determination (K) in iWAT and gWAT in HFD mice with or without SG1002 treatment. Protein expression is presented as ratio over WT HFD group. Data are presented as means ± SEM; *, P < 0.05; **, P ≤ 0.01; ***, P ≤ 0.001; A, G, H, and I, n = 7; B–F, J, and K, n = 4 mice per group. Scale bar: 200 μm (J). Source data are available for this figure: SourceData F8.
Therapeutic administration of a sulfide donor reduces HFD-induced obesity. WT mice were fed HFD (45% calories from fat) for 10 wk and were either switched to HFD containing the sulfide donor SG1002 or continued on a drug-free HFD. Based on daily chow consumption, mice received 40 mg/kg SG1002. (A) Body mass was measured weekly up to week 20. (B) Representative photograph of mice fed HFD with or without SG1002 at the end of the 20-wk experiment. (C) Representative Western blot and quantification of persulfidated adipose tissue proteins in mice demonstrating enhanced persulfidation in the SG1002 group. (D–F) VO2 (D), VCO2 (E), and metabolic rate (F) of mice fed HFD with or without SG1002 treatment. (G and H) Glucose (G) and insulin (H) tolerance test in HFD mice with and without SG1002 administration. The insets depict the areas under the curve (AUC) for the glucose and insulin tolerance tests. (I) iWAT, gWAT, and iBAT tissue mass of HFD mice with or without SG1002 treatment. (J and K) Representative photomicrographs of iWAT, gWAT, and BAT sections stained with H&E (J) and adipocyte size determination (K) in iWAT and gWAT in HFD mice with or without SG1002 treatment. Protein expression is presented as ratio over WT HFD group. Data are presented as means ± SEM; *, P < 0.05; **, P ≤ 0.01; ***, P ≤ 0.001; A, G, H, and I, n = 7; B–F, J, and K, n = 4 mice per group. Scale bar: 200 μm (J). Source data are available for this figure: SourceData F8.

SG1002 reduces lipid accumulation and obesity in mice on HFD. (A) WT mice were fed CD for 10 wk and then switched to CD containing a sulfide donor (SG1002, approximate daily dose based on chow consumption 40 mg/kg) for an additional 10 wk or continued to be fed CD; body weight was measured weekly. (B–F) Food intake (B), total activity (C), ambulation (D), rearing (E), and TIM/TOM complex subunit expression (F) in iWAT of WT mice exposed to a HFD in the presence or absence of SG1002. These measurements refer to the experiments depicted in Fig. 8. Mpst−/− mice were fed HFD for 10 wk and then switched to HFD with a sulfide donor (SG1002, approximate daily dose based on chow consumption 40 mg/kg) for an additional 10 wk or continued on HFD. (G) Body weight was measured weekly. (H–K) Adipose tissue depot mass (H), representative H&E photomicrographs (I), quantitation of adipocyte size (J), and TIM/TOM complex subunit expression (K) in iWAT of Mpst−/− HFD mice with or without SG1002 treatment. Food intake and gene expression are presented as ratio over WT HFD (B and F) or Mpst−/− HFD (K) group. Data are presented as means ± SEM; *, P < 0.05; **, P ≤ 0.01; ***, P ≤ 0.001; A, F–H, n = 7; B–E, I, and J, n = 3–4; K, n = 5–6 mice per group. Scale bar: 200 μm.
SG1002 reduces lipid accumulation and obesity in mice on HFD. (A) WT mice were fed CD for 10 wk and then switched to CD containing a sulfide donor (SG1002, approximate daily dose based on chow consumption 40 mg/kg) for an additional 10 wk or continued to be fed CD; body weight was measured weekly. (B–F) Food intake (B), total activity (C), ambulation (D), rearing (E), and TIM/TOM complex subunit expression (F) in iWAT of WT mice exposed to a HFD in the presence or absence of SG1002. These measurements refer to the experiments depicted in Fig. 8. Mpst−/− mice were fed HFD for 10 wk and then switched to HFD with a sulfide donor (SG1002, approximate daily dose based on chow consumption 40 mg/kg) for an additional 10 wk or continued on HFD. (G) Body weight was measured weekly. (H–K) Adipose tissue depot mass (H), representative H&E photomicrographs (I), quantitation of adipocyte size (J), and TIM/TOM complex subunit expression (K) in iWAT of Mpst−/− HFD mice with or without SG1002 treatment. Food intake and gene expression are presented as ratio over WT HFD (B and F) or Mpst−/− HFD (K) group. Data are presented as means ± SEM; *, P < 0.05; **, P ≤ 0.01; ***, P ≤ 0.001; A, F–H, n = 7; B–E, I, and J, n = 3–4; K, n = 5–6 mice per group. Scale bar: 200 μm.
The effects of SG1002 were not restricted to this compound, but rather constitute a class effect, as Na2S3 was also able to mitigate obesity (Fig. S5 A). Na2S3 administration improved glucose tolerance, reduced iWAT and gWAT mass, and reduced iWAT adipocyte size (Fig. S5, B–E). At the cellular level, sulfide treatment prevented lipid accumulation in differentiated adipocytes (Fig. S5, F and G).

Sodium trisulfide reduces lipid accumulation and obesity in mice on HFD. WT mice were fed HFD for 12 wk and then switched to HFD with Na2S3 (5 mg/kg/d administrated via i.p. injection) for an additional 7 wk or continued on HFD. Body weight was measured weekly. (A–E) Body weight (A), glucose tolerance (B), adipose tissue depot mass (C), representative H&E photomicrographs (D), and quantitation of adipocyte size (E) of WT mice exposed to HFD in the presence or absence of the sulfide donor. The insets depict the areas under the curve (AUC) for the glucose tolerance test. (F and G) Photomicrographs (F) and quantitation of lipid accumulation (G) in adipocytes in the presence and absence of Na2S3 (100 μM). Adipocytes were differentiated from primary preadipocytes for 7 d. They were then treated with vehicle or Na2S3 for 24 h with or without FA. After incubation, lipid accumulation was evaluated by Oil Red O staining. Optical density is presented as ratio over vehicle group. Data are presented as means ± SEM; *, P < 0.05; **, P ≤ 0.01; ***, P ≤ 0.001; A–C, n = 5–7; D and E, n = 4 mice per group; F and G, n = 6 individuals cell cultures per group. Scale bar: 200 μm (D) or 100 μm (F).
Sodium trisulfide reduces lipid accumulation and obesity in mice on HFD. WT mice were fed HFD for 12 wk and then switched to HFD with Na2S3 (5 mg/kg/d administrated via i.p. injection) for an additional 7 wk or continued on HFD. Body weight was measured weekly. (A–E) Body weight (A), glucose tolerance (B), adipose tissue depot mass (C), representative H&E photomicrographs (D), and quantitation of adipocyte size (E) of WT mice exposed to HFD in the presence or absence of the sulfide donor. The insets depict the areas under the curve (AUC) for the glucose tolerance test. (F and G) Photomicrographs (F) and quantitation of lipid accumulation (G) in adipocytes in the presence and absence of Na2S3 (100 μM). Adipocytes were differentiated from primary preadipocytes for 7 d. They were then treated with vehicle or Na2S3 for 24 h with or without FA. After incubation, lipid accumulation was evaluated by Oil Red O staining. Optical density is presented as ratio over vehicle group. Data are presented as means ± SEM; *, P < 0.05; **, P ≤ 0.01; ***, P ≤ 0.001; A–C, n = 5–7; D and E, n = 4 mice per group; F and G, n = 6 individuals cell cultures per group. Scale bar: 200 μm (D) or 100 μm (F).
Discussion
Previous work from our group has shown that MPST is downregulated in adipose tissue in animal models of obesity (Katsouda et al., 2018). These findings were extended and found to occur in obese humans in the present study. We thus set out to investigate whether reduced MPST levels contribute to increased body weight, and if so, to identify the underlying molecular mechanisms. Several lines of in vitro and in vivo evidence presented herein demonstrate that MPST deficiency or pharmacological inhibition of MPST increases lipid accumulation, reduces metabolic rate, and exacerbates obesity. The significance of MPST in the regulation of metabolism is further underscored by the observation that aged Mpst−/− mice on normal diet exhibit increased body weight compared with WT animals. Most studies with mice lacking CSE or pharmacological inhibition of this related H2S-producing enzyme have demonstrated reduced or similar weight gain to controls or to WT mice placed on HFD (Geng et al., 2013; Guo et al., 2019; Yang et al., 2018). At the adipocyte level, CSE inhibition reduced lipid storage (Geng et al., 2013; Tsai et al., 2015), while in the present study we demonstrated that MPST inhibition increased lipid accumulation. These findings taken together highlight the distinct roles of MPST and CSE in energy homeostasis and metabolic health and demonstrate that H2S endogenously produced from different sources exerts divergent biological effects in the adipose tissue. In this context, it is important to emphasize that MPST and CSE have different cellular distribution (the former is mostly mitochondrial, and the latter is cytosolic) and have different enzymatic products; the former is a source of several sulfide species, and the latter mainly generates H2S (Filipovic et al., 2018; Kimura et al., 2017).
Diabetes development is a common consequence of obesity (Chobot et al., 2018). In line with this well-known link, WT mice fed HFD display increased glucose and insulin resistance compared with mice receiving normal laboratory CD. Young Mpst−/− mice on normal CD exhibited glucose and insulin tolerance similar to WT animals. On the other hand, Mpst−/− HFD mice, in addition to increased body weight, had higher fasting glucose and insulin levels, along with increased glucose and insulin resistance, indicating that MPST plays a significant physiological role in maintaining glucose homeostasis and metabolic health. It is worth noting that lack of thiosulfate sulfotransferase (TST; also known as rhodanese), an enzyme that is structurally related to MPST, also leads to exacerbated diabetes, but similar adiposity (Morton et al., 2016). Although typically listed as a sulfide-degrading enzyme, TST has also been found to produce hydrogen sulfide using thiosulfate as a substrate (Mikami et al., 2011).
Significant differences exist among adipose tissue depots with regard to lipokine production, lipolysis, and triglyceride synthesis (Chobot et al., 2018; Tchkonia et al., 2013). Grafting visceral fat to subcutaneous anatomic sites has minimal effects on metabolic health, whereas viscerally transplanted subcutaneous WAT reduces body weight and improves glucose metabolism, indicating the intrinsic beneficial metabolic properties of this depot and revealing its greater overall impact on metabolism (Tran and Kahn, 2010). In our study, Mpst−/− fed HFD showed selective expansion and increased adipocyte size in the iWAT. In search of the mechanisms underlying excessive weight gain in these animals, we performed whole-transcriptome analysis in iWAT. Overall, we found that MPST ablation resulted in major transcriptome reprogramming; GO analysis revealed that deletion of MPST results in enhanced expression of proinflammatory and immune response–associated genes. In contrast, transcripts of genes regulating mitochondrial function, such as those that code for respiratory complex proteins and mitochondrial membrane proteins, were downregulated. These findings are consistent with the fact that increased calorie intake leads to mitochondrial dysfunction through a variety of mechanisms, including inflammation and oxidative stress (Fernández-Sánchez et al., 2011; Gao et al., 2010; Sutherland et al., 2008; Valerio et al., 2006), and observations linking obesity to reduced expression levels of the genes that code for respiratory chain proteins (Fischer et al., 2015; Heinonen et al., 2015). Genes of glutathione-associated processes were also found to be downregulated in Mpst−/− mice, leading to enhanced oxidative stress; this was confirmed by measurements showing increased amounts of H2O2 in iWAT and supports the known increase in oxidative stress in obesity (Masschelin et al., 2020; McMurray et al., 2016) and the demonstrated antioxidant properties of MPST (Katsouda et al., 2020; Nagahara, 2018; Peleli et al., 2020).
Notably, among the mitochondrial membrane–associated genes that were downregulated in HFD Mpst−/− mice, we observed several members of the TIM/TOM complex, the gateway of nuclear-encoded mitochondria-targeted proteins. TIM/TOM consists of a translocase of the outer (TOM) and the inner (TIM) mitochondrial membrane. The TOM complex comprises the pore-forming TOMM40 and its isoform TOMM40L subunits, which are surrounded by the small proteins TOMM5, TOMM6, and TOMM7 that regulate complex cohesion and stability. TOMM20, TOMM22, TOMM70, and TOMM34 are referred to as TOM receptors and identify signal sequences contained in imported mitochondrial proteins (Wang et al., 2020). The TIM complex exists in two forms, TIM22 and TIM23, that sort proteins of the inner mitochondrial membrane and the matrix (Schmidt et al., 2010). TIMM23, TIMM17A, and TIMM17B form the entry channel of TOM23, while TIMM50 and TIMM21 interact with proteins exiting from TOM so that they are funneled toward TIM23 (Schmidt et al., 2010). Although the role and relative importance of several individual TIM/TOM subunits remains incompletely understood, uncompromised complex activity is crucial for mitochondrial structure and function. We observed that expression of Tomm6, Tomm7, Tomm40l, Tomm34, Timm17b, Timm50, Timm8b, Timm13, and Pam16 was reduced in the iWAT of HFD Mpst−/−, suggesting that protein import into this organelle could be impaired. Indeed, CS and SOD2 accumulated in the cytosol in the adipose tissue of Mpst−/− mice. Decreased levels of TOM subunits have been shown to occur in mitochondria of adipocytes in patients with type 2 diabetes (Gómez-Serrano et al., 2017); however, the mechanism of reduced TIM/TOM subunit expression and its contribution to weight gain had not been previously investigated.
To address the role of individual TIM/TOM subunits in weight gain, we silenced a selected number of them in differentiated adipocytes and measured lipid accumulation. Simultaneous silencing of Tomm7, Tomm40L, Timm50, and Timm17b in the presence of fatty acids, to recapitulate the in vivo conditions, increased lipid accumulation. Individual silencing of Tomm7 or Tomm40L sufficed to significantly enhance lipid content of adipocytes. In line with our findings about the importance of TIM/TOM for weight gain, it was recently demonstrated that amyloid precursor protein increase and pore obstruction leads to reduced protein uptake into the mitochondria and obesity in mice (An et al., 2019). Interestingly, we also observed increased expression of the App gene in adipose tissue of MPST-lacking HFD mice (RNA-seq data). The above findings taken together suggest that mitochondrial dysfunction in Mpst−/− HFD mice could be the result of a combination of (a) reduced TIM/TOM function due to attenuated TIM/TOM subunit expression and (b) reduced expression of respiratory chain complex expression. Mitochondrial dysfunction in turn leads to limited fatty acid breakdown, as evidenced by the attenuated levels of TCA cycle/β-oxidation metabolites and reduced mitochondrial bioenergetics resulting in increased lipid storage.
In spite of the undisputed importance of TIM/TOM in cellular homeostasis and disease, there is a paucity of information about pathways that control the expression of its subunits in cells and about the contribution of individual subunits to the physiological functions of the complex. To further investigate the mechanisms responsible for reduced TIM/TOM levels in Mpst−/− mice, we first used bioinformatic approaches, which revealed the enriched activity of HIF1α. We next validated this observation, measuring the nuclear levels of ΗIF1α in the iWAT of deficient mice. ChIP-seq experiments confirmed the binding of HIF1α to the promoter region of both Tomm6 and Tomm7. HIF1α binding was also detected to the proximal regulatory regions of Cox14, Ndufv1, and Atp5g1, implicating this transcription factor in the downregulation of several genes in the absence of MPST. The participation of HIF1α in TIM/TOM and respiratory complex gene expression is not surprising. Adipose tissue becomes hypoxic during obesity, and the exacerbated weight gain of mice in the absence of MPST would be expected to lead to greater tissue hypoxia and increased HIF1α activation. HIF1α can also be activated by ROS (Bonello et al., 2007; Chandel et al., 2000), which are increased in the adipose tissue of Mpst−/− mice exposed to HFD. Previous studies have shown that HIF1α suppresses the expression of respiratory chain complex subunits and oxidative metabolism, switching cell metabolism to anaerobic glycolysis (Okamoto et al., 2017; Semenza, 2011; Soro-Arnaiz et al., 2016). In line with our findings, increased HIF1α activity leads to deterioration of obesity-induced inflammation and insulin resistance, whereas HIF1α deficiency reduces fat deposition and improves insulin sensitivity in mice fed HFD (Jiang et al., 2011; Krishnan et al., 2012; Lee et al., 2014; Zhang et al., 2010). It is also worth noting that the induction of HIF1α has been associated with increased fat deposition that occurs with aging (Soro-Arnaiz et al., 2016).
We next interrogated the link between lack of MPST and HIF1α activation. Although most studies focus on HIF1α protein stability as a means of regulating its HIF1α levels, transcriptional control of HIF1α has also been shown to be important for its activity (Iommarini et al., 2017). We have found that lack of MPST is associated with oxidative stress and that ROS-generating agents increase HIF1α expression, whereas ROS-scavengers reduce hypoxia-stimulated HIF1α expression. It is possible that additional posttranslational mechanisms regulate HIF1α activity in cells lacking MPST. Along these lines, lack of the H2S-producing enzyme CBS was recently shown to decrease prolyl hydroxylase 2 function, leading to stabilization of HIF1α (Dey et al., 2020). In contrast, H2S donors were shown to prevent HIF1α activation (Kai et al., 2012; Wu et al., 2012).
In the last part of our study, we investigated whether administration of a sulfide donor could prevent further weight gain in obese mice and improve metabolic health. Indeed, SG1002 and Na2S3 both reduced weight gain in mice. Moreover, sulfide administration reduced adipocyte size and iWAT mass, improved glucose tolerance, and increased the metabolic rate in animals fed HFD. Beneficial results have also been obtained in some, but not all, studies using hydrogen sulfide donors (Barr et al., 2015; Geng et al., 2013; Gomez et al., 2019; Sun et al., 2015; Wu et al., 2016; Wu et al., 2015). Failure to mitigate obesity by exogenous sulfide might result from the inability of donors to increase sulfide levels in metabolically relevant tissues (e.g., adipose tissue) and/or cellular compartments, such as the mitochondria. Moreover, the sulfide donors used herein that were effective in reducing body weight and improving glucose homeostasis perhaps more closely mimic the rate of production and the sulfur species generated by MPST. In addition, our study is the first to show that sulfide donors can be used therapeutically after obesity is established.
In summary, our study establishes a role for MPST in subcutaneous WAT physiology. We provide evidence that lack of MPST reduces mitochondrial protein import, leading to attenuated β-oxidation, TCA cycle, and oxidative phosphorylation, thus increasing lipid storage. Importantly, we have demonstrated the importance of individual TIM/TOM subunits in lipogenesis and have identified HIF1α as a transcriptional regulator of TIM/TOM subunits. Our findings highlight the importance of the MPST/sulfide pathway in the maintenance of mitochondrial functions and in the support of cellular bioenergetic homeostasis and indicate that sulfide donors may have a potential role in the experimental therapy of obesity.
Materials and methods
Animal studies
C57Bl/6J mice were purchased from The Jackson Laboratory. Mpst knockout mice (Mpst−/−) were provided by Professor Noriyuki Nagahara (Nippon Medical School, Tokyo, Japan; Nagahara et al., 2013). The knockout animals were generated on a C57Bl/6J background and were never outcrossed to another strain. Mpst−/− and WT mice C57Bl/6J (which were used as controls) were bread separately in our facility and used for experiments. All animals used for experimentation were bred/housed in individual ventilated cages, under specific pathogen–free, temperature-controlled (22°C) and 12-h light/dark cycle conditions in full compliance with the guidelines of the Federation of Laboratory Animal Science Association recommendations in the Laboratory Animal Unit of Biomedical Research Foundation of the Academy of Athens (BRFAA) and allowed free access to diets and water. Mice were randomly assigned to diet or intervention groups. All studies were performed on male mice at the indicated age unless otherwise noted.
The Mpst gene is found right next to the paralogous Tst gene on mammalian chromosomes (Pedre and Dick, 2021). The proximity between these two genes may have important implications for the generation of transgenic animals. We have reported that TST levels are reduced in the heart of Mpst−/− (Peleli et al., 2020). However, TST expression was not altered in the iWAT of Mpst−/− under baseline conditions (data not shown).
For the experiments with HFD, mice were fed a diet containing 45% calories from fat, 20% calories from protein, and 35% calories from carbohydrates (D12451; Research Diets or E15744-34; Ssniff). CD (10% calories from fat, 20% calories from protein, and 70% calories from carbohydrates; D12450K; Research Diets or E157452-04; Ssniff) was used as the control diet. In all other studies, mice were fed a normal-fat diet (4RF22; Mucedola). All experimental procedures that compared WT and Mpst−/− mice on HFD were performed between week 10 and 16 of diet. Experimental procedures involving mice that received the polysulfide donors were performed between week 18 and 20 of diet.
The adipose tissue depots used were iWAT, gWAT, and iBAT. iWAT, gWAT, and iBAT from the right side of the experimental animals were used to determine the tissue weight. The left lateral lobe was used to determine the weight of the liver. The muscle used for analysis was the quadriceps.
All experimental procedures reported here were approved by the veterinary authority of the Prefecture of Athens, in accordance with the national Registration (Presidential Decree 56/2013) in harmony with the European Directive 63/2010.
Human adipose tissue analysis
Subcutaneous adipose tissue was collected from 135 patients undergoing cardiac surgery at the John Radcliffe Hospital and used for RNA isolation. Total RNA was isolated by phenol:chloroform (1:5 ratio) separation from adipose tissue homogenates followed by magnetic bead–based RNA purification on a KingFisher magnetic particle processor (Thermo Fisher Scientific) with the MagMAX mirVana total RNA isolation kit (A27828; Thermo Fisher Scientific). Reverse transcription RNA was reverse-transcribed to cDNA with SuperScript VILO mastermix (Thermo Fisher Scientific) following the manufacturer’s instructions. qRT-PCR was performed by manufactured TaqMan chemistry, using standard universal TaqMan protocol as indicated by the manufacturer, on a QuantStudio 7 flex real-time PCR system (Thermo Fisher Scientific). All samples were run in duplicate using 5 ng of cDNA as starting mass, and data were analyzed by the Pfaffl method. Cyclophilin A (PPIA) was used as housekeeping gene for human AT. The IDs of the TaqMan probes used are PPIA TaqMan gene expression assay, Thermo Fisher Scientific, Hs99999904_m1; and MPST TaqMan gene expression assay, Thermo Fisher Scientific, Hs01055678_m1.
The study was approved by the Oxfordshire Research Ethics Committee C, REC no. 11/SC/0140. All patients gave written informed consent for participation in the study and for the use of their tissue samples for research.
Indirect calorimetry
Metabolic measurements were performed using an Oxymax indirect calorimetry system (Oxymax Equal Flow System; Columbus Instruments). In short, preweighed mice were housed individually in specifically designed Oxymax calorimeter chambers with ad libitum access to diet and water for 96 h, a 12-h light/dark cycle, and an ambient temperature of 22°C. Mice were housed individually for 3 d before transferring into the calorimeter chamber. Rates of VO2 (ml/kg/h) and VCO2 were measured for each chamber every 20 min throughout the studies. Sensors were precalibrated with a mixture of known concentrations of O2, CO2, and N2, and Oxymax system settings were air flow, 0.6 liters/min; and sample flow, 0.5 liters/min. Metabolic rate was calculated as VO2 × (3.815 + [1.232 × respiratory exchange ratio]) and normalized for body mass (kcal/kg/h). VO2, VCO2 metabolic rate, food intake (grams), and activity (counts) were evaluated over a 72-h period. The first 24 h of the animals’ housing were considered a period of acclimation.
Glucose and insulin tolerance tests
Glucose tolerance was determined by i.p. administration of D-glucose (1 g/kg of body weight; A16828; Alfa Aesar) after fasting for 16 h. Insulin tolerance was determined by i.p. injection of Humulin NPH (HI 0319; Lilly; 1 U/kg) after fasting for 5 h. Glucose was measured before and 15, 30, 60, 90, and 120 min after injection in blood drawn from a tail venesection using a handheld glucometer (Contour XT) and strips (Contour Next).
HOMA-IR
After fasting for 16 h, mice were anesthetized using sevoflurane (AbbVie), and blood was collected from the retro-orbital sinus using heparinized capillaries (Thermo Fisher Scientific). After measuring blood glucose levels (using a glucometer and strips), blood samples were centrifuged (8,000 rpm, 4°C, 10 min), and the supernatants were used to determine serum insulin levels by ELISA (Mercodia). HOMA-IR index was calculated based on the mathematical model: HOMA-IR = serum fasting insulin levels (μU/ml) × blood glucose levels (mg/dl)/405 (Matthews et al., 1985).
Primary adipocyte culture
Preadipocytes were isolated from iWAT of 10-wk-old C57Bl/6 mice. Fat pads were dissected and incubated in a digestion buffer containing 10 mg/ml collagenase D (11088882001; Roche), 1× dispase II (04942078001; Roche), 10 mM CaCl2 (223506; Sigma-Aldrich), and 1% penicillin/streptomycin (P/S, LM-A4118; BioSera) in PBS (P04-36500; PAN-Biotech), at 37°C for 45 min. The digested tissue was filtered through a 100-μm cell strainer and centrifuged (500 g, 10 min) after adding 3× volume of complete DMEM (cDMEM)/F-12: DMEM/F-12 (10565018; Gibco), 10% FBS (10270-106; Gibco), and 1% P/S. The supernatant was discarded, and the pellet of the stromal vascular fraction was washed and dissolved in cDMEM/F-12. The cell suspension was passed through a 40-µm cell strainer to remove any remaining mature adipocytes. The sample was centrifuged (500 g, 10 min), and the cell pellet was resuspended in cDMEM/F-12, transferred in flasks, and incubated at 37°C under conditions of 5% CO2 and 21% O2. Medium was changed every 48 h, and cells were split using trypsin (LM-T1705/100; BioSera). To induce differentiation, the medium was changed to cDMEM/F-12 containing 850 nM insulin (I5500; Sigma-Aldrich), 2 μM dexamethasone (D4902; Sigma-Aldrich), 0.5 mM 3-isobutyl-10-methylxanthine (i5879; Sigma-Aldrich), and 1 μM rosiglitazone (R2408; Sigma-Aldrich; differentiation day 0). On day 2, medium was replaced by cDMEM/F-12 supplemented with 850 nM insulin and 1 μM rosiglitazone. On day 4, medium changed to cDMEM/F-12 enriched with 850 nM and replenished every other day. All experimental procedures were performed on days 7–9. The FA (F7050; Sigma-Aldrich) was added to adipocytes (0.5×) as indicated for the last 24 h. For hypoxic conditions, differentiated adipocytes were exposed to 1% O2 for 48 h.
3T3-L1 cell line culture
3T3-L1 cells (ATCC) were cultured in cDMEM (DMEM [P04-03590; PAN-Bioteck] enriched with 10% FBS and 1% P/S) and incubated at 37°C, 5% CO2, and 21% O2. cDMEM was changed every 72 h, and cells were split using trypsin. To induce differentiation, the medium was replaced by cDMEM supplemented with 10 μg/ml insulin, 1 μM dexamethasone, and 0.5 mM 3-isobutyl-10-methylxanthine (differentiation day 0). On day 3, medium was changed to cDMEM enriched with 10 μg/ml insulin and replenished every 72 h. The experimental procedures described for 3T3-L1 were performed on days 7–9.
Pharmacological approaches
To increase sulfide levels, SG1002 (Sulfagenix) and sodium trisulfide (Na2S3, SB03-10; Dojindo) donors were used. SG1002 was added in CD and HFD to achieve a dose of 40 mg/kg/d. Na2S3 was dissolved in PBS and administered to mice at a dose of 5 mg/kg/d by i.p. injection. PBS was injected daily i.p. in the control group. In experiments with adipocytes, Na2S3 was added at a concentration of 100 μM (in PBS) for 24 h. Cells treated with equal volume of PBS served as vehicle controls.
Inhibition of MPST was achieved using IMST-3 (Molport). Differentiated adipocytes were treated with 50 μM IMST-3 dissolved in DMSO (A3672; PanReac AppliChem) for 48 h. Vehicle: 1% DMSO, 48 h.
To inhibit the mitochondrial protein import via the TIM/TOM complex, MitoBloCK 12 (M12, 522-51-0; Focus Biomolecules) and MitoBloCK 6 (M6, 505759; Merck) were used. M12 was added to adipocytes at a concentration of 4 μM and M16 of 5 μM for 24 h. Inhibitors were dissolved in DMSO and as vehicle 0.4% (for experimental procedures with M12), and 0.1% (for experimental procedures with M6) of the dissolvent was used for 24 h. For pharmacological induction of HIF1α, DMOG (71210; Cayman Chemicals) was added to the differentiated adipocytes at a concentration of 1 mM in DMSO for 48 h Vehicle: 0.1% DMSO, 48 h.
Cobalt chloride (CoCl2, 131257; PanReac AppliChem) was added to adipocytes to mimic hypoxia (300 μM in PBS, 24 h). An equal amount of PBS was added to the control group.
Menadione (5 μM, M5750; Sigma-Aldrich), Η2O2 (150 μM, 216763; Sigma-Aldrich), or pyrogallol (100 μM, 100612; Merck) was added to differentiated adipocytes for 24 h to increase ROS levels. For ROS scavenging, cells were exposed to a combination (ROSi) of DMSO (130 mM), α-tocopherol (50 μM, 613420; Merck), and Tiron (10 mM, 172553; Sigma-Aldrich) for 24 h. All reagents were dissolved or further diluted in PBS, and an equal amount of its was added to each control group.
The structures of the compounds used for the pharmacological approaches of the study are presented in Table S2.
Knockdown and overexpression
To silence the expression of Tomm7, Tomm40l, Timm50, and Timm17b genes, an siRNA (s124785, s82717, s83419, s75153; Invitrogen) specific for each sequence was transfected in adipocytes using lipofectamine reagent (13778150; Invitrogen), according to the manufacture’s protocol (12.5 pmol siRNA/well of a 24-well plate for 48 h). The control group was transfected with a scramble siRNA (AM4611; Invitrogen) under the same conditions.
Overexpression of MPST and HIF1α proteins in differentiated adipocytes was performed using V5-MPST-pCDNA3.1 and HA-HIF1α P402A/P564A-pcDNA3 and the JetPrime transfection reagent (114-15; Polyplus transfection) following the manufacturer’s instructions (1 μg/well of a 12-well plate for 48 h). Control groups were transfected with empty vector under the same conditions.
H&E staining
Tissues were isolated and fixed in 4% paraformaldehyde (P6148; Sigma-Aldrich) solution in PBS overnight, before paraffin embedding. Hematoxylin (95057-844; VWR) and eosin (95057-848; VWR) staining was performed on 5-μm tissue sections following standard procedures. Images were obtained using a bright-field Leica DMLS2 (Leica Biosystems) microscope, and adipocyte diameter was measured using ImageJ (National Institutes of Health).
Oil red O staining
Liver tissues were isolated, embedded in optimal cutting temperature compound (Tissue-Tek), and placed at −80°C. Tissue cryosections were fixed in 10% formalin solution (HT501128; Sigma-Aldrich) for 10 min, and Oil Red O staining was performed using a 0.3% Oil Red O (O0625; Sigma-Aldrich) in 60% isopropanol solution (10 min), according to standard procedures. Cryosections were then stained with hematoxylin and imaged using a bright-field Leica DMLS2 microscope.
Differentiated adipocytes were fixed in 10% formalin solution for 2 h, rinsed with 60% isopropanol, and stained with 0.3% Oil Red O solution for 30 min. Cell were then washed with water (3×) and observed under a bright-field microscope. Lipid accumulation levels were determined by Oil Red O absorption at 500 nm, after adipocyte destaining with 100% isopropanol.
Transmission electron microscopy (EM)
For ultrastructural analysis of mitochondria, small tissue fragments of WAT (1–2 mm3) were fixed in 2% glutaraldehyde (23114; Serva) and 2% paraformaldehyde (158127; Merck) in 0.1 M phosphate buffer, pH 7.4, for 4 h at 4°C. After washing with 0.1 M phosphate buffer, the specimens were postfixed in 1% aqueous osmium tetroxide (0972A-20; Polysciences) for 1 h at 4°C. The specimens were then dehydrated in a graded series of ethyl alcohol (34852-M; Merck), followed by propylene oxide (33715; Serva), infiltrated gradually in a mixture of Epon/Araldite resins (Glycid ether 100 [32805; Serva], DDSA [13710; EMS], Araldite-CY212 [13824; Serva], dibutyl phthalate [32805; Serva], and DMP-30 [36975; Serva]) diluted in propylene oxide, and finally embedded in fresh epoxy resin mixture. Ultrathin epoxy sections (70–80-nm thickness) were cut on a Leica Ultracut R ultramicrotome equipped with a Diatome diamond knife, mounted on 200-mesh copper grid (7552C-1; Polysciences), stained with uranyl acetate (77870; Serva)/lead citrate (81753; Ferak Berlin), and observed with an FEI Morgagni 268 transmission electron microscope equipped with Olympus Morada digital camera. Electron photomicrographs were taken at 36,000× and 28,000× original magnification. The resulting 52 transmission EM images were used to measure mitochondrial number, area, and dimensions with ImageJ software. Mitochondrial number was obtained by counting mitochondria per square micrometer of cell surface. The shape of each mitochondrion was defined by the axis ratio of oval that best fitted the area of the organelle and presented as ratio of major/minor axis.
MitoTracker staining
For mitochondria labeling, MitoTracker Red FM probe (M22425; Invitrogen) was used following the manufacturers’ instructions. In brief, differentiated adipocytes were stained with prewarmed solution containing 250 nM probe for 30 min at 37°C. Cells were next washed (PBS) and fixed with 4% formaldehyde (A0877,0250; AppliChem) for 10 min at room temperature. After fixation, adipocytes were rinsed, and 0.1% Triton X-100 (T9284; Sigma-Aldrich) was added for permeabilization (10 min). DAPI (D1306; Invitrogen) was used for nucleus labeling. Images were captured on an inverted Leica DM IRE2 (Leica Biosystems) microscope, and ImageJ software was used to quantify the integrated staining intensity.
RNA-seq and pathway enrichment analysis
Total iWAT RNA was extracted using TRIzol (15596026; Invitrogen) and treated with DNase I (AM2222; Invitrogen) according to the manufacturers’ instructions. RNA-seq experiments were carried out in the Greek Genome Center of the BRFAA. RNA-seq libraries were prepared with the Illumina TruSeq RNA v2 kit using 500 ng of total RNA, checked with the Agilent bioanalyzer DNA1000 chip, quantitated with the qubit HS spectrophotometric method, and pooled in equimolar amounts for sequencing. Approximately 25 million 75-bp-long, single-end reads were generated for each sample with illumina NextSeq500 sequencer.
The bwa mem algorithm of Burrows-Wheeler Alignment tool v0.7.17 was used for the alignment of sequenced reads on the mouse reference genome NCBI Build GRCm38/mm10. The resultant files were processed using SAMtools v1.9 to perform bam transformation. The number of reads covering each transcript was calculated by the algorithm htseq-count of HTSeq package v0.11.1 using the UCSC RefSeq (refGene) mm10 gene annotations. The estimation of dispersions and fold-changes for the RNA-seq data were calculated by the DESeq2 (v1.24.0) in R for transcripts covered by reads of minimum mapping quality 20. We classified as DEGs those with a log2 fold-change value less than −0.8 or >0.8 and a Benjamini–Hochberg corrected P value of ≤0.05. To avoid any overestimation during pathway enrichment analysis, GO terms pathway analysis was supervised by two different R packages: the gage package (v2.34.0) and the clusterProfiler package (v3.12.0), using the gene pathways sets go.sets.mm and enrichGO function, respectively. Gene set enrichment analysis was conducted by the gseKEGG function of clusterProfiler package (v3.12.0), using as input all the RNA-seq analysis gene transcripts with a non–not applicable P-adjusted value (significant or not) sorted from highest to lowest fold-change value. ChEA3 method was applied for the transcription factor enrichment analysis using the default parameters (Keenan, 2019).
RNA isolation and gene expression analysis using qRT-PCR
Total RNA was extracted from tissue or cells and treated with DNase as described above. RNA (500 ng) was reverse-transcribed with the PrimeScript RT Reagent Kit (RR037A; Takara). qRT-PCR was performed using KAPA SYBR Fast Master Mix (KK4618; Kapa Biosystems) in a CFX96 Touch Real-Time PCR Detection System (Bio-Rad). Gene expression levels were calculated according to 2−ΔΔCT method using the genes β-actin and 18 s as internal controls and ultimately normalized to the control group for each respective experiment. Primer sequences are: β-actin forward, 5′-CCCAGGCATTGCTGACAGG-3′, β-Actin reverse: 5′-TGGAAGGTGGACAGTGAGGC-3′, 18s forward, 5′-GTAACCCGTTGAACCCCATT-3′, 18s R: 5′-CCATCCAATCGGTAGTAGCG-3′, Tomm6 forward, 5′-CGACTTCCGGAGGAACTTGAT-3′, Tomm6 reverse: 5′-CGGGGAAACACAGGAGAACT-3′, Tomm7 forward, 5′-ACCGTCGGTTTTAAGCCTACTT-3′, Tomm7 reverse: 5′-CCACTCTGCCACAGAATCGT-3′, Tomm40l forward, 5′-TTTCCAAGATGGCGCCTACG-3′, Tomm40l reverse: 5′-GCTAGACCATCTCAGACCATCC-3′, Timm17b forward, 5′-CAAAAGAGAAACGCTGGGCA-3′, Timm17b reverse: 5′-GTCGAATTCCAACAGGGGCA-3′, Timm50 forward, 5′-CTCGGCGGCTCTGTTCTC-3′, and Timm50 reverse: 5′-CCCACGGTTGGCAATTTCAG-3′.
mtDNA copy number
Total DNA was isolated from iWAT tissues using NucleoSpin Tissue, Mini kit for DNA from cells and tissue (740952; Macherey-Nagel) following the manufacturer’s protocol. Relative concentrations of mtDNA were determined by RT-PCR as described above. The amount of mtDNA was normalized to the amount of nuclear (Sirt1) DNA (nuDNA). Primer sets used were Cytb forward: 5′-ATGACCCCAATACGCAAAAT-3′ (mtDNA), Cytb reverse: 5′-CGAAGTTTCATCATGCGGAG-3′ (mtDNA), Sirt1 forward: 5′-F:CCCGCAGCCGAGCCGCGGGG-3′ (nuDNA), and Sirt1 5′-reverse: 5′-TCTTCCAACTGCCTCTCTGGCCCTCCG-3′ (nuDNA).
Protein isolation
To isolate total proteins, fat tissues or differentiated adipocytes were homogenized in lysis buffer (radioimmunoprecipitation assay [RIPA]): 150 mM NaCl (7760; Calbiochem), 1% NP-40 (74385; Sigma-Aldrich), 0.5% Na-deoxycholate (A1531,0025; AppliChem), 0.1% SDS (A2572; PanReac AppliChem), 50 mM Tris-HCl, pH 7.4 (T1503; Sigma-Aldrich), and 2 mM EDTA (4005; Merck) supplemented with a cocktail of protease (PI, 5892970001; Roche) and phosphatase inhibitors (PhoI, 4906837001; Roche). Lysates were centrifuged (13,000 rpm, 15 min, 4°C), and the protein concentration in the supernatants was quantified by measuring the absorbance at 280 nm (NanoDropTM 200/c; Thermo Fisher Scientific).
To isolate mitochondrial proteins, iWAT pads were dissected and homogenized in mitochondrial isolation buffer containing 1 mM EDTA, 0.32 M sucrose (573113; Sigma-Aldrich), and 10 mM Tris-HCl, pH 7.4, in water, supplemented with PI and PhoI, using a Dounce glass grinder. The samples were centrifuged (4,500 rpm, 5 min, 4°C), and the supernatants were collected and centrifuged again (13,000 rpm, 10 min, 4°C). The supernatants, containing the cytosolic proteins, were collected, and the pellets were washed (3×) with mitochondrial isolation buffer, dissolved in RIPA enriched with PI and PhoI, and centrifuged (13,000 rpm, 15 min, 4°C) to extract the mitochondrial proteins. Protein concentration in both cytosolic and mitochondrial proteins was quantified by measuring the absorbance at 280 nm.
For the isolation of nuclear proteins, fat tissues were dissected and homogenized in a nuclear isolation buffer: 50 mM Hepes, pH 7.9 (A3724,0250; AppliChem), 140 mM NaCl, 1 mM EDTA, 0.5% NP-40, and 0.25% Triton X-100 (T9284; Sigma-Aldrich) supplemented with PI and PhoI, using a Dounce glass grinder. The lysates were centrifuged (4,000 rpm, 10 min, 4°C) and the pellets were washed (3×) in wash buffer: 10 mM Tris-HCl, pH 8.1, 200 mM NaCl, 1 mM EDTA, pH 8, and 0.5 mM EGTA, pH 8 (A0878,0022; AppliChem). RIPA was then added to pellets to isolate the nuclear proteins. Samples were centrifuged (13,000 rpm, 10 min, 4°C), and the supernatants were collected. The protein concentration was determined by the absorbance at 280-nm measurement.
Protein persulfidation measurement (dimedone switch method)
The dimedone switch method was performed as previously described (Zivanovic et al., 2020). In brief, preweighed fat tissues were homogenized in Hens buffer that contained 50 mM Hepes, 1 mM EDTA, 2% SDS, and 0.1 mM neucoproine (208745; Cayman Chemical) supplemented with 1% PI and 20 mM 4-chloro-7-nitrobenzofurazan (10199-89-0; Merck). Lysates were centrifuged (13,000 rpm, 15 min, 4°C), and supernatants were incubated at 37°C for 1 h. Samples were then precipitated by methanol/chloroform precipitation; sample/MeOH/CHCl3, 4/4/1 (vol/vol/vol) was added and centrifuged (13,000 rpm, 15 min, 4°C). Organic and aqueous layers were aspirated, and H2O/MeOH/CHCl3, 4/4/1 (vol/vol/vol) was added to the protein pellets and centrifuged. Supernatants were aspirated again, and the pellets were washed with MeOH (3×). Pellets were resuspended in 50 mM Hepes containing 1% SDS and 1% PI, incubated with 50 μM cysteine sulfenic acid probe (DCP-Bio1, NS1266; Merck), for 1 h at 37°C, precipitated with methanol/chloroform as previously mentioned, and resuspended in 50 mM Hepes containing 1% SDS and 1% PI. Samples were used for Western blot analysis, and the detection of sulfhydrylated proteins was achieved using an HRP-conjugated anti-biotin specific antibody (5571; Cell Signaling).
Western blot analysis
Laemmli buffer containing 4% SDS, 10% β-mercaptoethanol (M6250; Sigma-Aldrich), 20% glycerol (GI345; Melford), 0.004% blue bromophenol (A2331,0025; AppliChem), and 0.125 M Tris-HCl was added to protein lysates, followed by boiling at 95°C for 10 min. Samples were separated on SDS-PAGE and transferred to a nitrocellulose (Macherey-Nagel) or a polyvinylidene difluoride (Merck) membrane. The membranes were blocked with 5% milk (A0830; PanReac AppliChem) and probed with the following antibodies: anti–β-Actin (ab8227; Abcam), anti–β-Tubulin (ab15568; Abcam), anti-CBS (14787-1-AP; Proteintech), anti-CSE (12217-1-AP; Proteintech), anti-MPST (HPA001240; Atlas Antibodies), anti-MTCO1 (ab14705; Abcam), anti-Citrate Synthase (ab96600; Abcam), anti-SOD2 (13141; Cell Signaling), anti-TOM40L (ab236421; Abcam), anti-TIM50 (ab109436; Abcam), anti-HIF1α (sc-13515; Santa Cruz Biotechnology), anti-H3 (ab176842; Abcam), anti-V5 (Merck), anti-HA (H6908; Sigma-Aldrich), and anti-Biotin (HRP conjugate; 5571; Cell Signaling). Immunoblots were next incubated with a secondary antibody (anti-rabbit [AP132P; Merck] or anti-mouse [7076; Cell Signaling]) and visualized using the Western HRP substrate (Merck). ImageJ software was used to quantify the expression levels of the proteins.
Metabolomic analysis
Liquid chromatography with tandem mass spectrometry experiments were performed on an Agilent 1290 Infinity UPLC system (Agilent) coupled to a QTrap5500 mass spectrometer (Sciex), equipped with an ESI TurboIonSpray source. The flow rate was 0.22 ml/min, autosampler temperature was set at 6 °C, and the column compartment was set to 35 °C. Separations were performed on an Asahipak NH2P-40 (250 × 2 mm, 4-μm particle size; Showa Denko). The mobile phase was composed of 20 mM ammonium carbonate (10361-29-2; Merck) in H2O/5% acetonitrile (ACN; HN40.2; Roth), pH 10, and ACN. After an initial 3.5-min isocratic elution of 99.9% ACN, the percentage of ACN was decreased to 85% at 3.6 min, to 75% at 8.1 min, to 0% at 14 min, and back to 99.9% at 34 min. The composition was maintained at 99.9% ACN until 42 min. The QTrap5500-MS system was operated in triple quadrupole mode with positive/negative ion switching. Ion spray voltages of 5,500/−4,500 V were applied, respectively. Curtain gas was set to 30 psi, collision gas to medium, source temperature to 500 °C, ion source gas 1 to 35 psi, and ion source gas 2 to 35 psi. Analyst 1.6.2 and MultiQuant 3.0 (both from Sciex) were used for data acquisition and analysis, respectively. Data were analyzed with Metaboanalyst 4.0.
ChIP-seq and analysis
Adipose tissues were dissected and then homogenized in PBS using a Dounce glass grinder. 1% formaldehyde (A0877,0250; AppliChem) was added to samples for 15 min, followed by quenching with 0.125 M glycine at room temperature (S0046; Sigma-Aldrich) for 7 min and centrifugation (4,000 rpm, 7 min, 4°C). Pellets were washed with PBS, resuspended in lysis buffer (50 mM Hepes, pH 7.9, 140 mM NaCl, 1 mM EDTA, 10% glycerol, 0.5% NP-40, and 0.25% Triton X-100) supplemented with PI and PhoI, and incubated for 15 min at 4°C. Lysates were centrifuged (4,000 rpm, 10 min, 4°C) and the pellets were washed (3×) with wash buffer (10 mM Tris-HCl, pH 8.1, 200 mM NaCl, 1 mM EDTA, pH 8, and 0.5 mM EGTA, pH 8). Sonication buffer containing 0.1% SDS, 1 mM EDTA, and 10 mM Tris, pH 8.1, supplemented with PI and PhoI, was then added, and chromatin shearing was carried out in the Covaris S2 sonicator (Covarism) using microtube AFA Fiber Pre-Slit Snap-Cap 130 μl tubes (PN520045) for 12 min (duty factor, 75; peak power, 25; cycles per burst, 200) allowing the shearing of chromatin within a range of 250–500-bp DNA fragments. Samples were centrifuged (13,000 rpm, 30 min, 4°C), and the supernatants were collected. Triton X-100 and NaCl were added in the sheared chromatin to final concentrations of 1% and 150 mM, respectively, and samples were then used for immunoprecipitation.
Immunoprecipitation was carried out by incubating 15 μg of chromatin with 10 μg of anti-HIF1α antibody (ab2185; Abcam) overnight at 4°C. Protein G-Dynabeads (10003D; Invitrogen) were equilibrated in immunoprecipitation buffer (0.1% SDS, 1 mM EDTA, 10 mM Tris, pH 8.1, 1% Triton X-100, and 150 mM NaCl), and then incubated with the chromatin-antibody solution in an orbital mixer at 4°C for 4 h. The recovered resin was washed (3×) with a buffer consisting of 50 mM Tris-HCl, pH 8, 150 mM NaCl, 2 mM EDTA, 1% NP-40, 0.5% Na-deoxycholate, and 0.1% SDS, and the captured chromatin fragments were eluted with the addition of the buffer containing 0.5% SDS, 20 mM Hepes, pH 7.9, and 1 mM EDTA and incubation at 65°C for 30 min (continuously mixing). Chromatin samples were subjected to incubation with 20 mg RNase A (R6513; Sigma-Aldrich) at 37°C for 30 min and 30 mg proteinase K (031158360; Roche) digestion at 50°C for 30 min, followed by the addition of 0.8 M NaCl and overnight incubation at 65°C. All DNA present in each sample was purified with Nucleomag beads (15889167; Macherey-Nagel) and eluted in Tris-EDTA buffer. The beads were incubated at 85°C for 10 min for the final elution step.
ChIP-seq library construction and sequencing were carried out in the Greek Genome Center of BRFAA. Libraries for anti-Hif1α ChIPseq were generated with NEBNext Ultra II DNA Library Prep Kit for Illumina (E7645L), as indicated by the manufacturer’s guidelines (NEB), using 10 ng of DNA (chromatin that was not incubated with the antibody was used as input DNA), checked with the Agilent bioanalyzer DNA1000 chip, quantitated with the qubit HS spectrophotometric method, and pooled in equimolar amounts for sequencing. Approximately 25 million 100-bp-long, single-end reads were generated for each sample with Illumina NovaSeq 6000 sequencer.
The quality of the generated fastq files was examined with FASTQC software. Fastq files were aligned against mm10 mouse genome with Bowtie2 aligner (Langmead and Salzberg, 2012). The output file was filtered for low-quality reads, duplicates, blacklist regions, and mitochondrial genome entries with custom-made pipeline from bedtools (Quinlan and Hall, 2010) and samtools (Li et al., 2009). Peak calling was performed with MACS2 with P value <0.01 (Zhang et al., 2008). Bedgraph files were generated with samtools and tornado plots with DeepTools (Ramírez et al., 2016). Correlation of ChIP-seq and RNA-seq data was performed with BETA algorithm (Wang et al., 2013). GO was performed with EnrichR (Chen et al., 2013; Kuleshov et al., 2016), and the dotplot was generated through R-studio ggplot2 package. HIF1α binding sites were identified with ConTra v3 web server (Kreft et al., 2017).
Measurement of mitochondrial respiration
Mitochondrial function of mouse WAT was assessed using both glucose (Mito Stress assay) and palmitate (fatty acid oxidation [FAO] assay) as energy substrates. Mito stress assay was performed using DMEM (102353-100; Agilent), supplemented with 1 mM sodium pyruvate, 2 mM GlutaMAX-1TM, 25 mM glucose, and 4 mg/ml of fatty acid–free BSA. FAO assay was performed in Krebs-Henseleit buffer (111 mM NaCl, 4.7 mM KCl, 2 mM MgSO4, 1.25 mM CaCl2, and 1.2 mM NaH2PO4), supplemented with 5 mM Hepes buffer, 0.5 mM carnitine, and 4 mg/ml of fatty acid free BSA. Assays were carried out using a Seahorse XFe-24 flux analyzer (Agilent Technologies) and XFe24 Islet Capture Microplates equipped with nylon mesh inserts (103518-100; Agilent).
After collection, WAT was kept in the assay medium at 37°C until processed. Tissues were cut into small pieces (10–20 mg) by mean of a McIlwain tissue chopper set at 0.05-mm thickness. Slices were centered onto nylon inserts and covered with 15 µl of a solution made of 1 part chicken plasma (P3266; Sigma-Aldrich) and 1 part 100-UN/ml thrombin (T7513; Sigma-Aldrich), premixed immediately before use. This solution allowed fixation of the slices on the nylon inserts within O2-permeable clots, thus overcoming the problem of free-floating tissue. The inserts were then loaded with a Seahorse Capture Screen Insert Tool (101135-100; Agilent) into XFe Islet Capture Microplates containing assay medium. Appropriate wells received 100 µM of Etomoxir (carnitine palmitoyl transferase-1 inhibitor; E1905; Sigma-Aldrich). The plate was then incubated in a CO2-free incubator at 37°C for 1 h to allow temperature and pH equilibration. Only in the case of FAO, just before starting the assay, wells received 87.5 µl of 1 mM XF Palmitate-BSA FAO substrate (102720-100; Agilent). In all cases, the final assay volume was 500 µl. The assay protocol consisted of 3-min mix, 3-min wait, and 2-min measurement cycles, with measurement of basal values of oxygen consumption rate (four cycles), followed by injection of 50 µM oligomycin (O4876; Sigma-Aldrich), used to evaluate ATP generation rate (seven cycles). Afterward, 25 µM carbonyl cyanide-4 (trifluoromethoxy) phenylhydrazone (C2920; Sigma-Aldrich) was used to evaluate the maximal mitochondrial respiratory capacity (seven cycles). Finally, 20 μM of rotenone (R8875; Sigma-Aldrich) and antimycin A (A8674; Sigma-Aldrich) were injected to inhibit electron transport through complex I and III, respectively, aiming to detect the extramitochondrial oxygen consumption rate (seven cycles). Data were analyzed with Wave (v2.6; Agilent Technologies) and graphed with Prism 8 (GraphPad Software).
Hydrogen peroxide levels measurement
Fat pads or adipocytes were homogenized in PBS, supplemented with PI and PhoI, and centrifuged at 4°C and 2,000 g for 10 min. Supernatants were collected, and the fluorescence was measured at 37°C after the addition of 100 μM NADPH (N5130; Sigma-Aldrich), 100 μM AmpliFlu Red (90101; Sigma-Aldrich), and 1 U/ml horseradish peroxidase (P8250; Sigma-Aldrich). The final relative fluorescence unit signal was normalized according to the protein concentration, which was determined by the absorbance at 280 nm. The fluorescence was measured under the following settings: excitation, 535 nm; emission, 595 nm; gain, 50.
Statistical analysis
Data are expressed as mean ± SEM. Student’s unpaired two-tailed t test was used for comparison between two groups, and one-way ANOVA was used to compare three or more groups followed by a post hoc test. Experiments were performed on at least two independent occasions, while key findings (for example, weight gain, iWAT mass determination) were reproduced in multiple independent experiments. For next-generation sequencing and metabolomics studies, data were collected using the indicated number of animals from two independent experiments and run simultaneously. Sample sizes are reported in all figure captions. P was considered significant when <0.05. GraphPad Prism or SPSS software (for the human samples) were used for statistical analysis.
Online supplemental material
Fig. S1 shows that there are no differences in several metabolic parameters between young WT and Mpst−/− mice fed a normal CD. Fig. S2 shows that Mpst ablation does not affect the food consumption and activity of mice; it also shows that in mice fed an HFD, Mpst ablation leads to downregulation of respiratory chain subunits. Fig. S3 shows the HIF1α binding profile in iWAT of Mpst−/− mice and the identified HIF1α binding sites on the regulatory regions of Tomm7, Tomm6, Cox14, Ndufv1, and Atp5g1. Fig. S4 shows that SG1002 treatment reverses the obesity-induced phenotypic and molecular changes of Mpst−/− mice fed an HFD. Fig. S5 shows that sodium trisulfide reduces obesity-related parameters. Table S1 shows transcription factor enrichment analysis of DEGs in iWAT from WT and Mpst−/− HFD mice. Table S2 shows the structures of the compounds used in the study.
Data availability
RNA-seq data are deposited at Gene Expression Omnibus database with the accession no. GSE201361.
Acknowledgments
The authors would like to thank Dr. Apostolos Klinakis (BRFAA, Athens, Greece) for the rederivation of Mpst−/− mice, Dr. David J. Fulton (Augusta University, Augusta, GA) for donating the HA-HIF1α P402A/P564A-pcDNA3 plasmid, Dr. Ileana Badi (University of Oxford, Oxford, UK) for technical support in the study with the human samples, and Dr. Paraskevi Koutsoudaki (National and Kapodistrian University of Athens, Athens, Greece) for tissue processing for EM.
This research has been cofinanced by the European Regional Development Fund of the European Union and Greek national funds through the Operational Program Competitiveness, Entrepreneurship and Innovation, under the call RESEARCH–CREATE—INNOVATE (project code: T2EΔK-00843; to A. Papapetropoulos), by the Hellenic Foundation for Research and Innovation (H.F.R.I.) under the “First Call for H.F.R.I. Research Projects to support Faculty members and Researchers and the procurement of high-cost research equipment grant” (project number: HFRI-FM17-886), by the Hellenic Institute for the Study of Sepsis (to A. Papapetropoulos), by the Hellenic State Scholarship Foundation IKY-Siemens Research Projects of Excellence (11/3056 to A. Papapetropoulos and A. Katsouda), by a scholarship to A. Katsouda by the Hellenic Foundation for Research and Innovation, by the Deutsche Forschungsgemeinschaft (CRC1366/1 B1 Project # 39404578 to I. Fleming and S.-I. Bibli, and the Cardio-Pulmonary Institute, EXC 2026, Project ID: 390649896), and by the Swiss National Research Foundation (SNSF 31003A_179434) to C. Szabo.
Author contributions: Conceptualization, A. Papapetropoulos and A. Katsouda; Methodology, A. Katsouda; Investigation, A. Katsouda, D. Valakos, S.-I. Bibli, I. Akoumianakis, S. Havaki, and K. Zuhra; Formal Analysis, A. Katsouda, D. Valakos, V.S. Dionellis, S.-I. Bibli, I. Akoumianakis, S. Karaliota, K. Zuhra, and A. Papapetropoulos; Resources, I. Fleming, N. Nagahara, V.G. Gorgoulis, D. Thanos, C. Antoniades, C. Szabo, and A. Papapetropoulos; Supervision, A. Papapetropoulos, I. Fleming, D. Thanos, C. Szabo, and C. Antoniades; Validation: A. Papapetropoulos and A. Katsouda; Project Administration, A. Papapetropoulos; Visualization, A. Katsouda, D. Valakos, V.S. Dionellis, and A. Papapetropoulos; Funding acquisition, A. Papapetropoulos, I. Fleming, S.-I. Bibli, C. Szabo, and A. Katsouda; Writing–Original Draft, A. Papapetropoulos and A. Katsouda; Writing–Review & Editing, all authors.

