


Intestinal epithelium regenerates rapidly through proliferation of intestinal stem cells (ISCs), orchestrated by potent mitogens secreted within the crypt niche. However, mechanisms regulating these mitogenic factors remain largely unknown. Here, we demonstrate that transit-amplifying (TA) cells, marked by unconventional prefoldin RPB5 interactor (URI), control R-spondin production to guide ISC proliferation. Genetic intestinal URI ablation in mice injures TA cells, reducing their survival capacity, leading to an inflamed tissue and subsequently decreasing R-spondin levels, thereby causing ISC quiescence and disruption of intestinal structure. R-spondin supplementation or restoration of R-spondin levels via cell death inhibition by c-MYC elimination or the suppression of inflammation reinstates ISC proliferation in URI-depleted mice. However, selective c-MYC and p53 suppression are required to fully restore TA cell survival and differentiation capacity and preserve complete intestinal architecture. Our data reveal an unexpected role of TA cells, which represent a signaling platform instrumental for controlling inflammatory cues and R-spondin production, essential for maintaining ISC proliferation and tissue regeneration.

Introduction
The intestinal epithelium has a high self-renewal capacity, allowing rapid regeneration during homeostasis. This regenerative process is achieved by mitotically active leucine-rich repeat-containing G-protein coupled receptor 5-high (Lgr5high) intestinal stem cells (ISCs), located in the basal part of the intestinal crypt (Barker et al., 2007; Gehart and Clevers, 2019; Metcalfe et al., 2014; Snippert et al., 2010; Tian et al., 2011). As Lgr5high ISCs divide, their progeny migrate toward the upper part of the crypts to become Lgr5low progenitors or transit-amplifying (TA) cells, committed to producing mature cell lineages (Gehart and Clevers, 2019).
The proliferative capacity of Lgr5high ISCs is maintained by an ample repertoire of mitogens secreted by surrounding Paneth cells, stromal cells, and subepithelial telocytes (Clevers and Bevins, 2013; Harnack et al., 2019; Kabiri et al., 2014; Sato et al., 2011; Shoshkes-Carmel et al., 2018). Among them, R-spondin proteins are reported to be one of the major mitogenic factors which, in cooperation with WNT ligands, are essential for maintaining intestinal regeneration and crypt integrity (Greicius et al., 2018; Harnack et al., 2019; Hilkens et al., 2017; Raslan and Yoon, 2019; Yan et al., 2017). R-spondin proteins (RSPO1-RSPO4) engage distinct LGR4-LGR6, RNF43, and ZNRF3 receptor classes and cooperate with the canonical WNT/β-catenin signaling to promote the proliferation of ISCs in vivo (de Lau et al., 2014; Ruffner et al., 2012; Yan et al., 2017). Complete R-spondin inhibition by bridging the receptors LGR5 and ZNRF3/RNF43 led to intestinal crypt death and intestinal failure highlighting the essential role of R-spondin proteins in the maintenance of ISC proliferation and crypt homeostasis (Yan et al., 2017). Yet, R-spondin 1 knockout mice are viable (Chadi et al., 2009), and R-spondin 3 ablation in adult mice neither alters crypt integrity nor intestinal function under homeostatic conditions (Harnack et al., 2019; Sigal et al., 2017), suggesting a redundant role of R-spondin proteins to sustain ISC proliferation and tissue regeneration during homeostasis.
Due to their role in maintaining ISC proliferation, R-spondin proteins have been proposed as adjuvant therapies to enhance intestinal regeneration in various pathologies. In this regard, R-spondin 1 administration protects mice from radiation-induced gastrointestinal syndrome (Bhanja et al., 2009). Moreover, R-spondin 1 injection induces a rapid onset of crypt cell proliferation involving β-catenin stabilization and displays healing efficacy in a model of chemotherapy-induced intestinal mucositis (Kim et al., 2005). Other findings suggest that intestinal regeneration requires stromal R-spondin 3, which is present at increased levels upon injury (Harnack et al., 2019). Thus, although R-spondin 1 and 3 have been clearly associated with intestinal regeneration, regulation of their levels within the crypt niche upon injury remains unknown.
Unconventional prefoldin RPB5 interactor (URI) is a molecular co-chaperone essential for maintaining intestinal homeostasis. URI is found to be exclusively expressed in TA and slow proliferating cells, preserving their survival and differentiation capacity via inhibition of β-catenin/c-MYC signaling pathway (Chaves-Perez et al., 2019). Complete genetic disruption of URI (URI lox mouse is crossed with villin-CreERT2 line to generate URI(+/+) Int and URI(Δ/Δ)Int mice) triggers DNA damage–induced cell death in TA cells but not in ISCs, leading to the crypt loss, organ failure, and death of mice after 8 d of tamoxifen treatment (Chaves-Perez et al., 2019). These results raise an intriguing question: why do surviving Lgr5high ISCs fail to repopulate the injured organ? This supposes that (1) TA cells control the intestinal regenerative capacity and (2) mitogenic factors are affected following URI depletion. Hence, we hypothesized that TA cells might disable a putative epithelial repair program involving the activation of Lgr5high ISCs essential to regenerate the intestine, potentially through the control of mitogenic factors.
Results
Phenotypic alterations in TA cells modulate Lgr5high ISC proliferation
To check whether phenotypic alterations in TA cells affected Lgr5high ISC fate, we concomitantly labeled Lgr5high ISCs and depleted URI in the intestinal epithelium by crossing URI lox mouse with villin-CreERT2 line generating URI(+/+)Int and URI(Δ/Δ)Int mice (Chaves-Perez et al., 2019) that were crossed with Lgr5-EGFP-IRES-creERT2 mice (Barker et al., 2007), generating upon tamoxifen treatment URI(+/+)Int-Lgr5-EGFP and URI(Δ/Δ)Int-Lgr5-EGFP offspring, respectively (Fig. 1 A). No phenotypic differences have been previously observed between URI(Δ/Δ)Int and URI(Δ/Δ)Int-Lgr5-EGFP mice (Chaves-Perez et al., 2019), and as expected, URI was specifically ablated in intestinal epithelial cells, but not in mesenchymal cells (Fig. S1 A). In agreement with previous observations (Chaves-Perez et al., 2019), decreased differentiation (Fig. S1 B) and increased cell death program, including markers of apoptosis (Apaf1, Noxa, Bax, and Puma) and pyroptosis (IL-1β) were detected in Lgr5low cells (TA cells) sorted from URI(+/+)Int-Lgr5-EGFP and URI(Δ/Δ)Int-Lgr5-EGFP mice following 6 d of tamoxifen treatment (Fig. S1, C and D). Moreover, Lgr5− cells had increased apoptosis; however, no cell death was observed in Lgr5high ISCs after URI ablation (Fig. S1, D and E). Consistently, the percentage of Lgr5high ISCs did not change (Fig. S1, F and G), and the number of Lgr5+ ISCs was not affected in different regions of the intestine (Fig. S1 H) in URI(Δ/Δ)Int-Lgr5-EGFP mice when compared to URI(+/+)Int-Lgr5-EGFP mice. Moreover, GFP median fluorescence intensity (MFI) did not vary among Lgr5-GFPhigh or Lgr5-GFPlow cells between URI(+/+)Int-Lgr5-EGFP and URI(Δ/Δ)Int-Lgr5-EGFP mice (Fig. S1, I–L), suggesting that TA cells do not influence the proportion of Lgr5high ISCs in the gut.

Phenotypic alterations in TA cells modulate Lgr5 high ISC proliferation. (A) Scheme describing the generation of URI(+/+)Int-Lgr5-EGFP and URI(Δ/Δ)Int-Lgr5-EGFP mice by crossing URI lox mouse with Villin-creERT2 and Lgr5-EGFP-IRES-creERT2 mice. (B) Experimental design for BrdU labeling in vivo in URI(+/+)Int-Lgr5-EGFP and URI(Δ/Δ)Int-Lgr5-EGFP mice at indicated time points. (C–E) Co-IF for EGFP and BrdU in intestinal sections from URI(+/+)Int-Lgr5-EGFP and URI(Δ/Δ)Int-Lgr5-EGFP mice following 6 d of tamoxifen treatment, representative pictures (C), quantification of total BrdU positive cells (D) and quantification of total Lgr5+, Lgr5−/BrdU+, and Lgr5+/BrdU+ cells per crypt(E). (F) qRT-PCR of Mki67 and Aurkb mRNA levels in intestinal Lgr5high sorted cells from URI(+/+)Int-Lgr5-EGFP and URI(Δ/Δ) Int-Lgr5-EGFP mice following 6 d of tamoxifen treatment. Results are expressed as fold change (n = 10, 7). (G) qRT-PCR of Ddit4, Nfe2l2, Kdm5b, Jarid2, Cdkn1b, and Mex3a mRNA levels in sorted Lgr5high cells from URI(+/+)Int-Lgr5-GFP and URI(Δ/Δ)Int-Lgr5-GFP mice (n = 6, 6). (H) Representative IF for Mex3a in intestinal tissue from URI(+/+)Int-Lgr5-EGFP and URI(Δ/Δ)Int-Lgr5-EGFP mice. (I) Mex3a positive cell number per crypt from H. (J) Representative plot from flow cytometry for quiescent cells (Pyronin Y) in URI(+/+)Int-Lgr5-EGFP and URI(Δ/Δ)Int-Lgr5-EGFP mice following 6 d of tamoxifen treatment. (K) Quantification of quiescent cells (Lgr5high and Pyronin Ylow) in URI(+/+)Int-Lgr5-EGFP and URI(Δ/Δ)Int-Lgr5-EGFP mice following 6 d of tamoxifen treatment. (L) Quantification of intensity in FSC-A channel from gated-Lgr5high cells from URI(+/+)Int-Lgr5-EGFP and URI(Δ/Δ)Int-Lgr5-EGFP mice following 6 d of tamoxifen treatment (n = 3). Data represent mean ± SEM; L depicts geometric mean (GeoMean) ± 95% confident interval (CI); *, P < 0.05; **, P < 0.01; ***, P < 0.001; Student’s t test. Scale bars are 20 µm in C; and 100 µm in H. IF is representative of at least three independent mice.
Phenotypic alterations in TA cells modulate Lgr5 high ISC proliferation. (A) Scheme describing the generation of URI(+/+)Int-Lgr5-EGFP and URI(Δ/Δ)Int-Lgr5-EGFP mice by crossing URI lox mouse with Villin-creERT2 and Lgr5-EGFP-IRES-creERT2 mice. (B) Experimental design for BrdU labeling in vivo in URI(+/+)Int-Lgr5-EGFP and URI(Δ/Δ)Int-Lgr5-EGFP mice at indicated time points. (C–E) Co-IF for EGFP and BrdU in intestinal sections from URI(+/+)Int-Lgr5-EGFP and URI(Δ/Δ)Int-Lgr5-EGFP mice following 6 d of tamoxifen treatment, representative pictures (C), quantification of total BrdU positive cells (D) and quantification of total Lgr5+, Lgr5−/BrdU+, and Lgr5+/BrdU+ cells per crypt(E). (F) qRT-PCR of Mki67 and Aurkb mRNA levels in intestinal Lgr5high sorted cells from URI(+/+)Int-Lgr5-EGFP and URI(Δ/Δ) Int-Lgr5-EGFP mice following 6 d of tamoxifen treatment. Results are expressed as fold change (n = 10, 7). (G) qRT-PCR of Ddit4, Nfe2l2, Kdm5b, Jarid2, Cdkn1b, and Mex3a mRNA levels in sorted Lgr5high cells from URI(+/+)Int-Lgr5-GFP and URI(Δ/Δ)Int-Lgr5-GFP mice (n = 6, 6). (H) Representative IF for Mex3a in intestinal tissue from URI(+/+)Int-Lgr5-EGFP and URI(Δ/Δ)Int-Lgr5-EGFP mice. (I) Mex3a positive cell number per crypt from H. (J) Representative plot from flow cytometry for quiescent cells (Pyronin Y) in URI(+/+)Int-Lgr5-EGFP and URI(Δ/Δ)Int-Lgr5-EGFP mice following 6 d of tamoxifen treatment. (K) Quantification of quiescent cells (Lgr5high and Pyronin Ylow) in URI(+/+)Int-Lgr5-EGFP and URI(Δ/Δ)Int-Lgr5-EGFP mice following 6 d of tamoxifen treatment. (L) Quantification of intensity in FSC-A channel from gated-Lgr5high cells from URI(+/+)Int-Lgr5-EGFP and URI(Δ/Δ)Int-Lgr5-EGFP mice following 6 d of tamoxifen treatment (n = 3). Data represent mean ± SEM; L depicts geometric mean (GeoMean) ± 95% confident interval (CI); *, P < 0.05; **, P < 0.01; ***, P < 0.001; Student’s t test. Scale bars are 20 µm in C; and 100 µm in H. IF is representative of at least three independent mice.

Phenotypic alterations in TA cells modulate Lgr5 high ISC proliferation. (A) Representative pictures of co-IF staining for Vimentin and URI in intestinal tissue from URI(+/+)Int-Lgr5-EGFP and URI(Δ/Δ)Int-Lgr5-EGFP mice after 6 d of tamoxifen treatment. (B) Time course qRT-PCR of Gfi1 and Hes-1 mRNA levels in sorted Lgr5low cells from URI(+/+)Int-Lgr5-EGFP and URI(Δ/Δ)Int-Lgr5-EGFP mice after 0, 2, 4, and 6 d of tamoxifen treatment (n = 3). (C) qRT-PCR of apoptotic (Apaf, Noxa, Bax, and Puma) and pyroptosis (Il1β) markers in sorted Lgr5low cells from URI(+/+)Int-Lgr5-EGFP and URI(Δ/Δ)Int-Lgr5-EGFP mice. (D) Representative pictures of co-IF for EGFP and cleaved caspase 3 in intestinal sections from URI(+/+)Int-Lgr5-EGFP and URI(Δ/Δ)Int-Lgr5-EGFP mice following 6 d of tamoxifen treatment. (E) Quantifications of Lgr5−/cleaved caspase 3+ cell number per crypt in URI(+/+)Int-Lgr5-EGFP and URI(Δ/Δ)Int-Lgr5-EGFP mice after tamoxifen treatment. (F) Representative scatter plot from flow cytometry experiments of Lgr5high ISCs in isolated crypts from URI(+/+)Int-Lgr5-EGFP and URI(Δ/Δ)Int-Lgr5-EGFP mice. (G) Percentage of Lgr5high ISCs in intestines from URI(+/+)nt-Lgr5-EGFP and URI(Δ/Δ)Int-Lgr5-EGFP mice after 6 d on tamoxifen treatment (n = 4). (H) Quantification of Lgr5+ cell number per crypt in the different part of the intestinal tract (duodenum, jejunum, and ileum) of URI(+/+)Int-Lgr5-EGFP and URI(Δ/Δ)Int-Lgr5-EGFP mice (n = 3). (I) Quantification of GFP fluorescence intensity of Lgr5-GFPhigh cells in URI(+/+)Int-Lgr5-EGFP and URI(Δ/Δ)Int-Lgr5-EGFP mice (n = 3). (J) Quantification of GFP fluorescence intensity of Lgr5-GFPlow cells (n = 4, 3). (K) Representative pictures of IF for EGFP in intestinal sections from URI(+/+)Int-Lgr5-EGFP and URI(Δ/Δ)Int-Lgr5-EGFP mice following 6 d of tamoxifen treatment. (L) Quantification of Lgr5-GFP fluorescence intensity in bottom crypts of the intestine from K (n = 3). (M) Quantification of Lgr5+/BrdU positive cells per crypt in the different part of the intestinal tract (duodenum, jejunum, and ileum) from URI(+/+)Int-Lgr5-EGFP and URI(Δ/Δ)Int-Lgr5-EGFP mice (n = 3). (N) β-galactosidase (SA-β-Gal) staining in intestinal sections from URI(+/+)Int and URI(Δ/Δ)Int mice following 6 d of tamoxifen treatment. PanIN lesions were used as positive control. (O) qRT-PCR of Tnfrsf19 and Sox17 mRNA levels in Lgr5high sorted cells in intestines from URI(+/+)Int-Lgr5-EGFP and URI(Δ/Δ)Int-Lgr5-EGFP mice following 6 d of tamoxifen treatment (n = 5, 3, 5, 3). (P) Representative IHC of p19 ARF in intestinal sections from URI(+/+)Int and URI(Δ/Δ)Int mice following 6 d of tamoxifen treatment. Testis were used as positive control. (Q) Kaplan–Meier curve of URI(Δ/Δ)Int mice (red solid line; n = 4) and URI(Δ/Δ)Int; p16/p19(Δ/Δ) (dashed red line; n = 4) mice. (R) H&E staining in intestinal sections from URI(Δ/Δ)Int; p16/p19(Δ/Δ) mice at time of death. (S) Kaplan-Meier curve of URI(+/+)Int; p21(Δ/Δ) (black solid line; n = 5), URI(Δ/Δ)Int; p21(Δ/Δ) (green solid line; n = 8) and URI(Δ/Δ)Int; p21(+/+) (red solid line; n = 7) mice. (T) Representative pictures of H&E staining in intestinal sections from URI(+/+)Int; p21(Δ/Δ) and URI(Δ/Δ)Int; p21(Δ/Δ) mice at the time of death (8–12 d). Data represent mean ± SEM; *, P < 0.05; **, P < 0.01; Student’s t test and Mantel–Cox. Scale bars represent 10 μm in D and P; 50 μm in K; and 100 μm in A, R, and T. IF, H&E, and IHC are representative of at least three independent mice.

Phenotypic alterations in TA cells modulate Lgr5 high ISC proliferation. (A) Representative pictures of co-IF staining for Vimentin and URI in intestinal tissue from URI(+/+)Int-Lgr5-EGFP and URI(Δ/Δ)Int-Lgr5-EGFP mice after 6 d of tamoxifen treatment. (B) Time course qRT-PCR of Gfi1 and Hes-1 mRNA levels in sorted Lgr5low cells from URI(+/+)Int-Lgr5-EGFP and URI(Δ/Δ)Int-Lgr5-EGFP mice after 0, 2, 4, and 6 d of tamoxifen treatment (n = 3). (C) qRT-PCR of apoptotic (Apaf, Noxa, Bax, and Puma) and pyroptosis (Il1β) markers in sorted Lgr5low cells from URI(+/+)Int-Lgr5-EGFP and URI(Δ/Δ)Int-Lgr5-EGFP mice. (D) Representative pictures of co-IF for EGFP and cleaved caspase 3 in intestinal sections from URI(+/+)Int-Lgr5-EGFP and URI(Δ/Δ)Int-Lgr5-EGFP mice following 6 d of tamoxifen treatment. (E) Quantifications of Lgr5−/cleaved caspase 3+ cell number per crypt in URI(+/+)Int-Lgr5-EGFP and URI(Δ/Δ)Int-Lgr5-EGFP mice after tamoxifen treatment. (F) Representative scatter plot from flow cytometry experiments of Lgr5high ISCs in isolated crypts from URI(+/+)Int-Lgr5-EGFP and URI(Δ/Δ)Int-Lgr5-EGFP mice. (G) Percentage of Lgr5high ISCs in intestines from URI(+/+)nt-Lgr5-EGFP and URI(Δ/Δ)Int-Lgr5-EGFP mice after 6 d on tamoxifen treatment (n = 4). (H) Quantification of Lgr5+ cell number per crypt in the different part of the intestinal tract (duodenum, jejunum, and ileum) of URI(+/+)Int-Lgr5-EGFP and URI(Δ/Δ)Int-Lgr5-EGFP mice (n = 3). (I) Quantification of GFP fluorescence intensity of Lgr5-GFPhigh cells in URI(+/+)Int-Lgr5-EGFP and URI(Δ/Δ)Int-Lgr5-EGFP mice (n = 3). (J) Quantification of GFP fluorescence intensity of Lgr5-GFPlow cells (n = 4, 3). (K) Representative pictures of IF for EGFP in intestinal sections from URI(+/+)Int-Lgr5-EGFP and URI(Δ/Δ)Int-Lgr5-EGFP mice following 6 d of tamoxifen treatment. (L) Quantification of Lgr5-GFP fluorescence intensity in bottom crypts of the intestine from K (n = 3). (M) Quantification of Lgr5+/BrdU positive cells per crypt in the different part of the intestinal tract (duodenum, jejunum, and ileum) from URI(+/+)Int-Lgr5-EGFP and URI(Δ/Δ)Int-Lgr5-EGFP mice (n = 3). (N) β-galactosidase (SA-β-Gal) staining in intestinal sections from URI(+/+)Int and URI(Δ/Δ)Int mice following 6 d of tamoxifen treatment. PanIN lesions were used as positive control. (O) qRT-PCR of Tnfrsf19 and Sox17 mRNA levels in Lgr5high sorted cells in intestines from URI(+/+)Int-Lgr5-EGFP and URI(Δ/Δ)Int-Lgr5-EGFP mice following 6 d of tamoxifen treatment (n = 5, 3, 5, 3). (P) Representative IHC of p19 ARF in intestinal sections from URI(+/+)Int and URI(Δ/Δ)Int mice following 6 d of tamoxifen treatment. Testis were used as positive control. (Q) Kaplan–Meier curve of URI(Δ/Δ)Int mice (red solid line; n = 4) and URI(Δ/Δ)Int; p16/p19(Δ/Δ) (dashed red line; n = 4) mice. (R) H&E staining in intestinal sections from URI(Δ/Δ)Int; p16/p19(Δ/Δ) mice at time of death. (S) Kaplan-Meier curve of URI(+/+)Int; p21(Δ/Δ) (black solid line; n = 5), URI(Δ/Δ)Int; p21(Δ/Δ) (green solid line; n = 8) and URI(Δ/Δ)Int; p21(+/+) (red solid line; n = 7) mice. (T) Representative pictures of H&E staining in intestinal sections from URI(+/+)Int; p21(Δ/Δ) and URI(Δ/Δ)Int; p21(Δ/Δ) mice at the time of death (8–12 d). Data represent mean ± SEM; *, P < 0.05; **, P < 0.01; Student’s t test and Mantel–Cox. Scale bars represent 10 μm in D and P; 50 μm in K; and 100 μm in A, R, and T. IF, H&E, and IHC are representative of at least three independent mice.
To check ISC proliferative capacity, tamoxifen-treated URI(+/+)Int-Lgr5-EGFP and URI(Δ/Δ)Int-Lgr5-EGFP mice were pulsed with BrdU (Fig. 1 B). Although the total number of BrdU+ cells was increased in the URI(Δ/Δ)Int-Lgr5-EGFP mice crypts (Fig. 1, C and D), stratification of BrdU+ cells according to GFP levels revealed elevated proliferation of Lgr5− cells (TA cells), but reduced proliferative capacity of Lgr5+ ISCs in different regions of the intestine from URI(Δ/Δ)Int-Lgr5-EGFP mice (Fig. 1 E and Fig. S1 M). qRT-PCR analysis in sorted Lgr5high cells confirmed reduced proliferation (Fig. 1 F).
We, therefore, analyzed which type of cell cycle arrest was activated in Lgr5high ISCs from URI(Δ/Δ)Int mice. First, we checked for senescence. No β galactosidase+ cells were detected in the ISC niche from URI(Δ/Δ)Int mice (Fig. S1 N). Additionally, no differences in levels of senescence-related genes as well as in p19 ARF staining were detected in URI(Δ/Δ)Int mice (Fig. S1, O and P). Moreover, URI(Δ/Δ)Int mice with constitutive ablation of the Ink4 locus (URI(Δ/Δ)Int; p16/p19(Δ/Δ) mice) or p21 deletion (Cdkn1a; URI(Δ/Δ)Int; p21(Δ/Δ) mice) had similar survival rates and tissue architecture to URI(Δ/Δ)Int mice (Fig. S1, Q–T; Brugarolas et al., 1995; Serrano et al., 1996), confirming that cell cycle arrest observed in ISCs from URI(Δ/Δ)Int mice is not due to senescence.
Hence, we checked whether Lgr5high ISCs in URI(Δ/Δ)Int-Lgr5-EGFP mice entered quiescence. qRT-PCR demonstrated elevated levels of quiescence markers in sorted Lgr5high ISCs from URI(Δ/Δ)Int-Lgr5-EGFP mice (Fig. 1 G). Additionally, p27 (Cdkn1b), which promotes CDK inhibition, and Mex3a, which marks a slowly dividing subpopulation of Lgr5high ISCs (Barriga et al., 2017), were enhanced in URI(Δ/Δ)Int-Lgr5-EGFP mice, as shown by qRT-PCR and immunofluorescence (IF; Fig. 1, G–I). Importantly, double staining with Hoechst 33342 and Pyronin Y to respectively measure DNA and RNA content in ISCs by flow cytometry (Eddaoudi et al., 2018) revealed that Lgr5high ISCs with low RNA content (low pyronin incorporation) were increased in URI(Δ/Δ)Int-Lgr5-EGFP mice (Fig. 1, J and K), indicating an arrest in G0 phase. Furthermore, Lgr5high ISC size was reduced in URI(Δ/Δ)Int-Lgr5-EGFP mice (Fig. 1 L), suggesting reduced metabolic activity, typical of quiescent cells (Rodgers et al., 2014). Thus, URI depletion induces phenotypic alterations in TA cells that control the proliferative status of Lgr5high ISCs.
TA cells control R-spondin production in the crypt niche
ISC proliferation is controlled by potent mitogenic factors secreted by different cell types within the crypt niche (Clevers and Bevins, 2013; de Lau et al., 2014; Harnack et al., 2019; Kabiri et al., 2014; Kim et al., 2005; Sato et al., 2011; Shoshkes-Carmel et al., 2018). Therefore, we hypothesized that decreased mitogen levels may impair mitotic activation of Lgr5high ISCs and promote quiescence. qRT-PCR, Western blot (WB), in situ hybridization (RNAscope), and IF experiments showed that levels of R-spondin 1 and 3, important mitogenic factors in the intestine were decreased in intestines of URI(Δ/Δ)Int-Lgr5-EGFP mice after 6 d of tamoxifen treatment, but other essential factors reported for maintenance of ISC self-renewal were not affected (Fig. 2, A–D; and Fig. S2 A). Surprisingly, decreased R-spondin expression in URI(Δ/Δ)Int mice was accompanied by increases in other WNT ligands such as Wnt3 (Farin et al., 2016; Gregorieff et al., 2005; Sato et al., 2011) and Wnt3a (Farin et al., 2012; Flanagan et al., 2018; Qi et al., 2014; Zou et al., 2018; Fig. S2, B–E). Consistently, downregulation of URI in colon carcinoma-derived HCT-116 cells increased Wnt3a protein levels, independently of R-spondin 1 supplementation (Fig. S2, F and G).

TA cells control R-spondin production in the crypt niche. (A) qRT-PCR of Rspo1, Rspo2, and Rspo3 mRNA levels in whole intestinal tissue from URI(+/+)Int and URI(Δ/Δ)Int mice following 6 d of tamoxifen treatment (n = 6, 4). (B) WB in intestinal tissue from URI(+/+)Int and URI(Δ/Δ) Int mice following 6 d of tamoxifen treatment. Membranes are blotted with the indicated antibodies. (C) Representative in situ hybridization (ISH) pictures for R-spondin 1 in intestinal tissue from URI(+/+)Int-Lgr5-EGFP and URI(Δ/Δ)Int-Lgr5-EGFP mice following 6 d of tamoxifen treatment. Black dashed lines are for crypts; green dashed lines highlight stromal cells. 1 = upper part of the crypt; 2 = bottom part of the crypt; 3 = stromal cells. (D) Representative co-IF for lysozyme and R-spondin 3 in URI(+/+)Int and URI(Δ/Δ)Int mice following 6 d of tamoxifen treatment. (E) Gating strategy for flow cytometry to sort Lgr5− high side-scattering/forward scattering (high size/high granularity), Lgr5low (TA), and Lgr5high (ISC) cells. (F) qRT-PCR of Uri mRNA levels in sorted Lgr5− high side-scattering/forward scattering (high size/high granularity) and Lgr5low (TA) cells from isolated crypts from URI(+/+)Int-Lgr5-EGFP mice (n = 4, 4, 3, 3). (G) qRT-PCR of Defa4 mRNA levels in sorted Lgr5− high side-scattering/forward scattering (high size/high granularity) and Lgr5high (ISCs) from isolated crypts from URI(+/+)Int-Lgr5-EGFP (n = 3). (H) qRT-PCR of Rspo1, Rspo2, and Rspo3 mRNA levels in sorted Lgr5− high side-scattering/forward scattering cells (high size/high granularity) from URI(+/+)Int-Lgr5-EGFP mice. (I) qRT-PCR of Rspo1, Rspo2, and Rspo3 mRNA levels in sorted Lgr5− high side-scattering/forward scattering cells (high size/high granularity) from URI(+/+)Int-Lgr5-EGFP and from URI(Δ/Δ)Int-Lgr5-EGFP. (J) qRT-PCR of ISC regulator genes (Dll4, BMP2, BMP4, EGF, and TGFβ) expressed by Paneth cells isolated from URI(+/+)Int-Lgr5-EGFP and URI(Δ/Δ)Int-Lgr5-EGFP mice (n = 4, 3). (K) Representative co-IF for lysozyme and R-spondin 1 in URI(+/+)Int-Lgr5-EGFP and URI(Δ/Δ)Int-Lgr5-EGFP mice following 6 d of tamoxifen treatment. (L) Quantification of R-spondin 1 intensity in K. (M) Scheme of organoid differentiation protocol. Isolated crypts were culture in ENR-CV for 4–6 d to enrich for ISCs. Stemmed organoids were then harvested, washed, and embedded in fresh Matrigel and culture in ENR-CD for 4–6 d to induce Paneth cell differentiation. (N) Morphology of organoids culture in ENR-CV (control) or ENR-CD (Paneth cell differentiation) for 4–6 d. (O) qRT-PCR depicting stem cell markers (Lgr5) and Paneth cell markers (Cryptdin, Defa4) in organoids cultured in ENR-CV or ENR-CD conditions. (P) qRT-PCR showing R-spondins mRNA levels in organoids cultured in ENR-CV or ENR-CD conditions. Data represent mean ± SEM; *, P < 0.05; **, P < 0.01; ***, P < 0.001; ****, P < 0.0001; Student’s t test and one-way ANOVA. Scale bars represent 10 µm in C; 20 µm in K; 100 µm in D; and 150 µm in N. WB are representative of at least three independent experiments. ISH, IF, and IHC are representative of at least three independent mice. Source data are available for this figure: SourceData F2.
TA cells control R-spondin production in the crypt niche. (A) qRT-PCR of Rspo1, Rspo2, and Rspo3 mRNA levels in whole intestinal tissue from URI(+/+)Int and URI(Δ/Δ)Int mice following 6 d of tamoxifen treatment (n = 6, 4). (B) WB in intestinal tissue from URI(+/+)Int and URI(Δ/Δ) Int mice following 6 d of tamoxifen treatment. Membranes are blotted with the indicated antibodies. (C) Representative in situ hybridization (ISH) pictures for R-spondin 1 in intestinal tissue from URI(+/+)Int-Lgr5-EGFP and URI(Δ/Δ)Int-Lgr5-EGFP mice following 6 d of tamoxifen treatment. Black dashed lines are for crypts; green dashed lines highlight stromal cells. 1 = upper part of the crypt; 2 = bottom part of the crypt; 3 = stromal cells. (D) Representative co-IF for lysozyme and R-spondin 3 in URI(+/+)Int and URI(Δ/Δ)Int mice following 6 d of tamoxifen treatment. (E) Gating strategy for flow cytometry to sort Lgr5− high side-scattering/forward scattering (high size/high granularity), Lgr5low (TA), and Lgr5high (ISC) cells. (F) qRT-PCR of Uri mRNA levels in sorted Lgr5− high side-scattering/forward scattering (high size/high granularity) and Lgr5low (TA) cells from isolated crypts from URI(+/+)Int-Lgr5-EGFP mice (n = 4, 4, 3, 3). (G) qRT-PCR of Defa4 mRNA levels in sorted Lgr5− high side-scattering/forward scattering (high size/high granularity) and Lgr5high (ISCs) from isolated crypts from URI(+/+)Int-Lgr5-EGFP (n = 3). (H) qRT-PCR of Rspo1, Rspo2, and Rspo3 mRNA levels in sorted Lgr5− high side-scattering/forward scattering cells (high size/high granularity) from URI(+/+)Int-Lgr5-EGFP mice. (I) qRT-PCR of Rspo1, Rspo2, and Rspo3 mRNA levels in sorted Lgr5− high side-scattering/forward scattering cells (high size/high granularity) from URI(+/+)Int-Lgr5-EGFP and from URI(Δ/Δ)Int-Lgr5-EGFP. (J) qRT-PCR of ISC regulator genes (Dll4, BMP2, BMP4, EGF, and TGFβ) expressed by Paneth cells isolated from URI(+/+)Int-Lgr5-EGFP and URI(Δ/Δ)Int-Lgr5-EGFP mice (n = 4, 3). (K) Representative co-IF for lysozyme and R-spondin 1 in URI(+/+)Int-Lgr5-EGFP and URI(Δ/Δ)Int-Lgr5-EGFP mice following 6 d of tamoxifen treatment. (L) Quantification of R-spondin 1 intensity in K. (M) Scheme of organoid differentiation protocol. Isolated crypts were culture in ENR-CV for 4–6 d to enrich for ISCs. Stemmed organoids were then harvested, washed, and embedded in fresh Matrigel and culture in ENR-CD for 4–6 d to induce Paneth cell differentiation. (N) Morphology of organoids culture in ENR-CV (control) or ENR-CD (Paneth cell differentiation) for 4–6 d. (O) qRT-PCR depicting stem cell markers (Lgr5) and Paneth cell markers (Cryptdin, Defa4) in organoids cultured in ENR-CV or ENR-CD conditions. (P) qRT-PCR showing R-spondins mRNA levels in organoids cultured in ENR-CV or ENR-CD conditions. Data represent mean ± SEM; *, P < 0.05; **, P < 0.01; ***, P < 0.001; ****, P < 0.0001; Student’s t test and one-way ANOVA. Scale bars represent 10 µm in C; 20 µm in K; 100 µm in D; and 150 µm in N. WB are representative of at least three independent experiments. ISH, IF, and IHC are representative of at least three independent mice. Source data are available for this figure: SourceData F2.
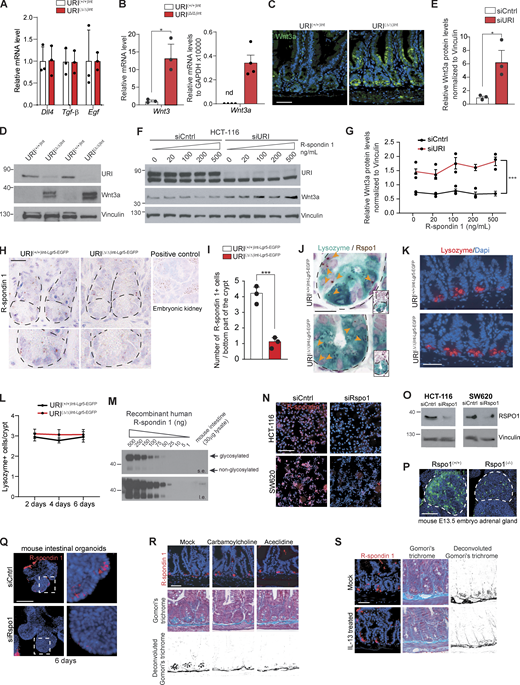
TA cells control R-spondin production in the crypt niche. (A) qRT-PCR of Dll4, Tgf-β, and Egf in the whole intestinal tissue from URI(+/+)Int and URI(Δ/Δ)Int mice following 6 d after tamoxifen treatment. (B) qRT-PCR of Wnt3 and Wnt3a mRNA levels in whole intestinal tissue from URI(+/+)Int and URI(Δ/Δ)Int mice following 6 d of tamoxifen treatment (n = 3). (C) Representative pictures of IF of Wnt3a in intestinal samples from URI(+/+)Int and URI(Δ/Δ)Int mice following 6 d after tamoxifen treatment. (D) WB from of samples from whole intestine from URI(+/+)Int and URI(Δ/Δ)Int mice following 6 d after tamoxifen treatment. Membranes are blotted with indicated antibodies. (E) WB quantification from D. (F) WB from HCT-116 cells following URI knockdown by silencing RNA. Additionally, cells were treated with increasing concentrations of human R-spondin 1. Membranes are blotted with indicated antibodies. (G) WB quantification from F. (H) Representative pictures of in situ hybridization (ISH) for R-spondin 1 in intestinal tissue from URI(+/+)Int-Lgr5-EGFP and URI(Δ/Δ)Int-Lgr5-EGFP mice following 6 d of tamoxifen treatment (n = 3). Embryonic mouse kidney was used as positive control. (I) Quantification for H in number of R-spondin 1 positive cells per bottom part of the crypt (n = 3). (J) Representative pictures of IHC for lysozyme and ISH for R-spondin 1 in intestinal sections from URI(+/+)Int and URI(Δ/Δ)Int mice following 6 d of tamoxifen treatment (n = 3). Orange arrows point to positive cells. (K) Representative pictures of IF for lysozyme in intestinal sections from URI(+/+)Int-Lgr5-EGFP and URI(Δ/Δ)Int-Lgr5-EGFP mice following 6 d of tamoxifen treatment. (L) Quantification of lysozyme-positive cells per crypt in K after 2, 4, and 6 d of tamoxifen treatment (n = 3). (M) WB analysis of different concentrations of purified recombinant human R-spondin 1 and whole intestinal lysates from C57BL/6 mice (s.e., short exposure; l.e., long exposure) (N) Representative pictures of IF of R-spondin 1 in HCT-116 (irradiated with 40 Gy) and SW620 (nonirradiated) colorectal cell lines treated or not with siRNA against human R-spondin 1. (O) WB from HCT-116 (irradiated with 40 Gy) and SW620 (nonirradiated) cells following R-spondin 1 knockdown by using silencing RNA. Membranes are blotted with indicated antibodies. (P) IF of R-spondin 1 in R-spondin 1(+/+) and R-spondin 1(−/−) mouse embryo. (Q) IF of R-spondin 1 of whole mounted organoids transfected with siRNA control (siCtrl) or siRNA against human R-spondin 1 (siRspo1), 48 h after transfection. (R) Representative pictures of IF for R-spondin 1 and Gomori’s trichrome staining in carbamylcholine and aceclidine-treated mice. (S) Representative pictures of IF for endogenous R-spondin 1 and Gomori’s trichrome staining in IL-13–treated mice. Data represent mean ± SEM; *, P < 0.05; **, P < 0.01; ***, P < 0.001; Student’s t test. Scale bars represent 5 µm in J; 10 µm in H; 20 µm in C, K, N, R, and S; and 50 µm in P and Q. WB are representative of at least three independent experiments and IF and IHC are representative of at least three independent mice. Source data are available for this figure: SourceData FS2.

TA cells control R-spondin production in the crypt niche. (A) qRT-PCR of Dll4, Tgf-β, and Egf in the whole intestinal tissue from URI(+/+)Int and URI(Δ/Δ)Int mice following 6 d after tamoxifen treatment. (B) qRT-PCR of Wnt3 and Wnt3a mRNA levels in whole intestinal tissue from URI(+/+)Int and URI(Δ/Δ)Int mice following 6 d of tamoxifen treatment (n = 3). (C) Representative pictures of IF of Wnt3a in intestinal samples from URI(+/+)Int and URI(Δ/Δ)Int mice following 6 d after tamoxifen treatment. (D) WB from of samples from whole intestine from URI(+/+)Int and URI(Δ/Δ)Int mice following 6 d after tamoxifen treatment. Membranes are blotted with indicated antibodies. (E) WB quantification from D. (F) WB from HCT-116 cells following URI knockdown by silencing RNA. Additionally, cells were treated with increasing concentrations of human R-spondin 1. Membranes are blotted with indicated antibodies. (G) WB quantification from F. (H) Representative pictures of in situ hybridization (ISH) for R-spondin 1 in intestinal tissue from URI(+/+)Int-Lgr5-EGFP and URI(Δ/Δ)Int-Lgr5-EGFP mice following 6 d of tamoxifen treatment (n = 3). Embryonic mouse kidney was used as positive control. (I) Quantification for H in number of R-spondin 1 positive cells per bottom part of the crypt (n = 3). (J) Representative pictures of IHC for lysozyme and ISH for R-spondin 1 in intestinal sections from URI(+/+)Int and URI(Δ/Δ)Int mice following 6 d of tamoxifen treatment (n = 3). Orange arrows point to positive cells. (K) Representative pictures of IF for lysozyme in intestinal sections from URI(+/+)Int-Lgr5-EGFP and URI(Δ/Δ)Int-Lgr5-EGFP mice following 6 d of tamoxifen treatment. (L) Quantification of lysozyme-positive cells per crypt in K after 2, 4, and 6 d of tamoxifen treatment (n = 3). (M) WB analysis of different concentrations of purified recombinant human R-spondin 1 and whole intestinal lysates from C57BL/6 mice (s.e., short exposure; l.e., long exposure) (N) Representative pictures of IF of R-spondin 1 in HCT-116 (irradiated with 40 Gy) and SW620 (nonirradiated) colorectal cell lines treated or not with siRNA against human R-spondin 1. (O) WB from HCT-116 (irradiated with 40 Gy) and SW620 (nonirradiated) cells following R-spondin 1 knockdown by using silencing RNA. Membranes are blotted with indicated antibodies. (P) IF of R-spondin 1 in R-spondin 1(+/+) and R-spondin 1(−/−) mouse embryo. (Q) IF of R-spondin 1 of whole mounted organoids transfected with siRNA control (siCtrl) or siRNA against human R-spondin 1 (siRspo1), 48 h after transfection. (R) Representative pictures of IF for R-spondin 1 and Gomori’s trichrome staining in carbamylcholine and aceclidine-treated mice. (S) Representative pictures of IF for endogenous R-spondin 1 and Gomori’s trichrome staining in IL-13–treated mice. Data represent mean ± SEM; *, P < 0.05; **, P < 0.01; ***, P < 0.001; Student’s t test. Scale bars represent 5 µm in J; 10 µm in H; 20 µm in C, K, N, R, and S; and 50 µm in P and Q. WB are representative of at least three independent experiments and IF and IHC are representative of at least three independent mice. Source data are available for this figure: SourceData FS2.
Interestingly, Rspo1 was enriched in the bottom part of the crypts, where Paneth cells are located (Fig. 2 C and Fig. S2, H and I; Buczacki et al., 2013; Sato et al., 2011). RNAscope for Rspo1 in combination with IHC for lysozyme further confirmed the presence of Rspo1 in lysozyme+ cells (Fig. S2 J). To validate our findings, we sorted Paneth cells by focusing on Lgr5− high side-scattering/high forward-scattering cells (Lgr5− SSChigh FSChigh cells) from URI(+/+)Int-Lgr5-EGFP and URI(Δ/Δ)Int-Lgr5-EGFP mice (Fig. 2 E). Paneth cells isolated from URI(+/+)Int-Lgr5-EGFP mice exhibited no detectable Uri levels (Fig. 2 F) but confirmed their secretory phenotype (shown by increased Defa4 mRNA levels) and high expression of Rspo1, but no expression of Rspo2 and Rspo3 (Fig. 2, G and H); R-spondin 3 was produced by stromal cells (Harnack et al., 2019; Kabiri et al., 2014; Shoshkes-Carmel et al., 2018). In contrast, Paneth cells isolated from tamoxifen-treated URI(Δ/Δ)Int-Lgr5-EGFP mice exhibited reduced Rspo1 levels (Fig. 2 I), but the expression of other mitogenic factors was not altered (Fig. 2 J), suggesting that secretory capabilities of Paneth cells are not affected in URI-depleted mice. Notably, no differences in Paneth cell number were observed between URI(+/+)Int-Lgr5-EGFP and URI(Δ/Δ)Int-Lgr5-EGFP mice (Fig. S2, K and L). However, reduced R-spondin 1 expression was confirmed in crypt cells as shown by IF experiments in URI(Δ/Δ)Int-Lgr5-EGFP mice (Fig. 2, K and L).
R-spondin 1 antibody specificity was validated by using recombinant R-spondin 1 and WB analysis (Fig. S2 M). Additionally, IF and WB revealed that R-spondin 1 antibody specifically bound to endogenous R-spondin 1 in colorectal cancer cell lines, as verified by siRNA against R-spondin 1 (Fig. S2, N and O). Moreover, the validity of the R-spondin 1 antibody was confirmed in embryos from R-spondin 1 knockout mice (Chassot et al., 2008; Fig. S2 P) and further validated in mouse organoids transfected with R-spondin 1 siRNA (Fig. S2 Q). Importantly, degranulation of Paneth cells by treating mice either with cholinergic agents (carbamylcholine and aceclidine; Satoh et al., 1989) or with IL-13 (Stockinger et al., 2014) indicated that R-spondin 1 antibody did not bind to the granules of secretory cells (Fig. S2, R and S).
To further validate the production of R-spondin 1 by Paneth cells, we differentiated intestinal organoids into Paneth cells using previously established protocols (Yin et al., 2014; Fig. 2 M). Organoids grown in ENR-CD media (Paneth cell–enriched organoids) had higher levels of Rspo1 than the ones grown in ENR-CV media (ISC-enriched organoids; Fig. 2, N–P). Altogether, these data indicate that (1) intestinal Paneth cells express R-spondin 1 and (2) URI depletion in the intestinal epithelium reduces R-spondin levels within the crypt niche.
Decreased R-spondin levels reduce ISC proliferative capacity
Next, to determine whether reductions in R-spondin levels preceded cell cycle arrest of ISCs, expression patterns of proliferation, quiescence, and factors secreted by Paneth cells (Rspo1, Dlf4, and TGFβ) were analyzed, respectively, in sorted Lgr5high and Paneth cells as well as in the intestine (Rspo3) upon URI deletion in a time-dependent manner. qRT-PCR revealed that although ISC proliferation and mitogenic factors were increased in the early stages of URI deletion (day 2), Rspo1 and Rspo3 levels dropped at later time points (day 4) before reductions in proliferation and increases in quiescence markers in Lgr5high ISCs (day 6; Fig. 3, A and B). These data suggest that decreases in R-spondin levels precede cell cycle arrest of ISCs.

Decreased R-spondin levels reduce ISC proliferative capacity. (A) qRT-PCR for Ki67 and Mex3a in sorted ISC Rspo, Dll4, and TGFβ in sorted Paneth cells and Rspo3 in whole intestinal tissue from URI(Δ/Δ)Int-Lgr5-EGFP mice. (B) Scheme of time course curves for Ki67, Mex3a, Rspo1, Dll4, TGFβ, and Rspo3 from A. (C) Schematic representation for Tet-regulated miR-E shRspo1 expression vector in a lentiviral backbone (REVIR-shRspo1). PGK promoter drives the constitute expression of mVenus-IRES-rtTA3 cassette, and Tet-responsive element promoter (T3G) induces the expression of dsRFP fluorescent protein-coupled miR-E shRspo1 or miR-E shRenilla upon doxycycline treatment. (D) Endogenous fluorescence showing the induction of dsRFP after doxycycline treatment (24 h). (E) Sorting strategy for mouse stable cell lines expressing REVIR-shRspo1 construct. (F) qRT-PCR showing Rspo1 levels in sorted cells following doxycycline treatment (48 h). (G) R-spondin 1 titration (0, 100, 200, 300, 400, and 500 nM) in mouse organoids. (H) Scheme of organoid transduction with REVIR-shRspo1 lentiviral particles and differentiation/co-culture experiments. (I) Morphology and GFP expression of organoids transduced with REVIR-shRspo1 lentiviral particles and culture in ENR-CV for 72 h. (J) Morphology of organoids derived from co-culture experiments between lentiviral transduced Paneth cells (with REVIR-shRenilla or REVIR-shRspo1) and untraduced ISCs. (K) qRT-PCR depicting stem cell markers (Egfp, RFP), Rspo1, and mKi67 in shRenilla and shRspo1-transduced organoids. Data represent mean ± SEM; *, P < 0.05; **, P < 0.01; ***, P < 0.001; Student’s t test. Scale bars represent 10 µm in D; 150 µm in I and J; and 200 µm in G. IF and bright-field photos are representative of at least three independent experiments.
Decreased R-spondin levels reduce ISC proliferative capacity. (A) qRT-PCR for Ki67 and Mex3a in sorted ISC Rspo, Dll4, and TGFβ in sorted Paneth cells and Rspo3 in whole intestinal tissue from URI(Δ/Δ)Int-Lgr5-EGFP mice. (B) Scheme of time course curves for Ki67, Mex3a, Rspo1, Dll4, TGFβ, and Rspo3 from A. (C) Schematic representation for Tet-regulated miR-E shRspo1 expression vector in a lentiviral backbone (REVIR-shRspo1). PGK promoter drives the constitute expression of mVenus-IRES-rtTA3 cassette, and Tet-responsive element promoter (T3G) induces the expression of dsRFP fluorescent protein-coupled miR-E shRspo1 or miR-E shRenilla upon doxycycline treatment. (D) Endogenous fluorescence showing the induction of dsRFP after doxycycline treatment (24 h). (E) Sorting strategy for mouse stable cell lines expressing REVIR-shRspo1 construct. (F) qRT-PCR showing Rspo1 levels in sorted cells following doxycycline treatment (48 h). (G) R-spondin 1 titration (0, 100, 200, 300, 400, and 500 nM) in mouse organoids. (H) Scheme of organoid transduction with REVIR-shRspo1 lentiviral particles and differentiation/co-culture experiments. (I) Morphology and GFP expression of organoids transduced with REVIR-shRspo1 lentiviral particles and culture in ENR-CV for 72 h. (J) Morphology of organoids derived from co-culture experiments between lentiviral transduced Paneth cells (with REVIR-shRenilla or REVIR-shRspo1) and untraduced ISCs. (K) qRT-PCR depicting stem cell markers (Egfp, RFP), Rspo1, and mKi67 in shRenilla and shRspo1-transduced organoids. Data represent mean ± SEM; *, P < 0.05; **, P < 0.01; ***, P < 0.001; Student’s t test. Scale bars represent 10 µm in D; 150 µm in I and J; and 200 µm in G. IF and bright-field photos are representative of at least three independent experiments.
To functionally characterize the role of R-spondin 1 in ISC proliferation, we downregulated Rspo1 specifically in Paneth cells ex vivo. To this end, we generated a Tet-regulated dsRFP-miR-E shRspo1 lentiviral expression vector (REVIR-shRspo1; Fellmann et al., 2013; Fig. 3 C). Expression of dsRFP was observed in doxycycline-treated cells but not in untreated controls, indicating that the system is tightly regulated by a T3G promoter (Fig. 3 D). Additionally, Rspo1 downregulation is induced upon doxycycline treatment in cells containing REVIR-shRspo1 construct but not in the ones carrying REVIR-shRenilla (Fig. 3, E and F). The minimal concentration of R-spondin 1 (100 nM) required for organoid growth was determined (Fig. 3 G). Next, ISC-enriched organoids (ENR-CV media) were transduced with REVIR-shRspo1 or REVIR-shRenilla lentivirus and subsequently differentiated into Paneth cells by transferring them to ENR-CD media (Fig. 3 H). GFP-positive Paneth cells were sorted and co-cultured with non-transduced ISCs in ENR media for 5 d to allow organoid formation. Afterward they were transferred to minimal ENR media (100 nM R-spondin 1; Fig. 3 G), and organoids growth was assessed (Fig. 3, I and J). Depletion of R-spondin 1 impaired organoid growth as shown by a reduction in the diameter of REVIR-shRspo1 organoids when compared with REVIR-shRenilla controls under minimal ENR media (Fig. 3, I and J). Also, organoid proliferation was decreased after the expression of Rspo1 hairpin in Paneth cells (Fig. 3 K). Overall, these data indicate that Paneth cells might act as a reservoir for R-spondin 1 production, and reductions in R-spondin levels precede ISC quiescence.
R-spondin supplementation restores Lgr5high ISC proliferation
Next, to check whether exogenous R-spondin supplementation could reinstate ISC proliferation, we isolated crypts from URI(+/+)Int and URI(Δ/Δ)Int mice after 6 d of tamoxifen treatment and monitored organoid growth ex vivo. When cultured in regular ENR media (500 nM of R-spondin 1), organoids derived from URI(Δ/Δ)Int mice were viable but grew slower than organoids from URI(+/+)Int mice (Fig. 4, A–C). As an orthogonal approach, we generated organoids from doxycycline-inducible hURI-overexpressing mice (designated hURI(+/KI)Int mice; Chaves-Perez et al., 2019; Roth et al., 2009). Organoids derived from hURI(+/KI)Int mice had higher intestinal R-spondin 1 levels than those from hURI(+/+)Int mice (Fig. 4, D and E) and developed faster when cultured with reduced ENR media (250 nM of R-spondin 1; Fig. 4, F–H).

R-spondin supplementation restores Lgr5highISC proliferation. (A) Representative organoids derived from URI(+/+)Int and URI(Δ/Δ)Int mice following 4 and 10 d in culture. Bright-field images are shown. The red arrow represents “crypt-like structures.” (B) Quantification of organoid growth in percentage at indicated time points in culture (n = 3; D, day). (C) Representative co-IF of URI and Sox9 in organoids from URI(+/+)Int and URI(Δ/Δ)Int mice following 10 d of culture. (D) qRT-PCR of Rspo1 mRNA levels in intestines from hURI(+/+)Int and hURI(+/KI)Int mice following 4 wk of doxycycline treatment (n = 6). (E) WB of isolated crypts from hURI(+/+)Int and hURI(+/KI)Int mice following 4 wk of doxycycline treatment. Membranes are blotted with the indicated antibodies. (F) Representative H&E staining and IHC of URI and Ki67 in organoids from hURI(+/+)Int and hURI(+/KI)Int mice under low (250 nM) R-spondin 1 concentration. (G) Representative co-IF of URI and R-spondin 1 in organoids from hURI(+/+)Int and hURI(+/KI)Int mice under low (250 nM) R-spondin 1 concentration. (H) Quantification of organoid growth from hURI(+/+)Int and hURI(+/KI)Int mice at indicated time points under low (250 nM) or normal (500 nM) R-spondin 1 concentration. Results are depicted as percentage of growth related to initial size (n = 3). (I) Experimental design for R-spondin 1 treatment in URI(+/+)Int-Lgr5-EGFP and URI(Δ/Δ)Int-Lgr5-EGFP mice. (J) Representative co-IF for Lgr5-EGFP and BrdU in untreated URI(Δ/Δ)Int-Lgr5-EGFP and R-spondin 1–treated URI(Δ/Δ)Int-Lgr5-EGFP mice following 6 d of tamoxifen treatment. (K) Quantification of Lgr5/BrdU double positive cells per crypt in percentage from J. (L) Representative scatter plot from flow cytometry experiments of quiescent cells in untreated URI(Δ/Δ)Int-Lgr5-EGFP and R-spondin 1–treated URI(Δ/Δ)Int-Lgr5-EGFP mice following 6 d of tamoxifen treatment. (M) Quantification of quiescent cells (Lgr5high and Pyronin Ylow) in untreated URI(+/+)Int-Lgr5-EGFP and URI(Δ/Δ)Int-Lgr5-EGFP and R-spondin 1–treated URI(Δ/Δ)Int-Lgr5-EGFP mice following 6 d of tamoxifen treatment (n = 5, 6, 5) from L. (N–P) qRT-PCR of Mki67 and Aurkb (N), Axin2 and c-Myc (O), and Ascl2 and Olfm4 (P) in sorted Lgr5high cells from URI(+/+)Int-Lgr5-EGFP, untreated URI(Δ/Δ)Int-Lgr5-EGFP, and R-spondin 1–treated URI(Δ/Δ)Int-Lgr5-EGFP mice (n = 4, 3, 3). (Q) qRT-PCR of Mex3a mRNA levels in sorted Lgr5high cells from URI(+/+)Int-Lgr5-EGFP, untreated URI(Δ/Δ)Int-Lgr5-EGFP, and R-spondin 1–treated URI(Δ/Δ)Int-Lgr5-EGFP mice (n = 4, 4, 3). (R) Representative IF for Mex3a in intestinal tissue from URI(+/+)Int-Lgr5-EGFP, untreated URI(Δ/Δ)Int-Lgr5-EGFP, and R-spondin 1–treated URI(Δ/Δ)Int-Lgr5-EGFP mice. (S) Mex3a-positive cell number per crypt from R. (T) Representative H&E staining of URI from untreated URI(Δ/Δ)Int-Lgr5-EGFP and R-spondin 1–treated URI(Δ/Δ)Int-Lgr5-EGFP mice following 8 d of tamoxifen treatment. (U) Kaplan–Meier curve of non-treated URI(Δ/Δ)Int-Lgr5-EGFP (red solid line; n > 3) and R-spondin 1–treated URI(Δ/Δ)Int-Lgr5-EGFP (black solid line; n > 3) mice. Data represent mean ± SEM; *, P < 0.05; **, P < 0.01; ***, P < 0.001, Student’s t test, one-way ANOVA and Mantel–Cox. Scale bars represent 20 µm in J; 50 µm in A, C, and G; and 100 µm in R and T. H&E, IF, and IHC are representative of at least three independent mice. Source data are available for this figure: SourceData F4.
R-spondin supplementation restores Lgr5highISC proliferation. (A) Representative organoids derived from URI(+/+)Int and URI(Δ/Δ)Int mice following 4 and 10 d in culture. Bright-field images are shown. The red arrow represents “crypt-like structures.” (B) Quantification of organoid growth in percentage at indicated time points in culture (n = 3; D, day). (C) Representative co-IF of URI and Sox9 in organoids from URI(+/+)Int and URI(Δ/Δ)Int mice following 10 d of culture. (D) qRT-PCR of Rspo1 mRNA levels in intestines from hURI(+/+)Int and hURI(+/KI)Int mice following 4 wk of doxycycline treatment (n = 6). (E) WB of isolated crypts from hURI(+/+)Int and hURI(+/KI)Int mice following 4 wk of doxycycline treatment. Membranes are blotted with the indicated antibodies. (F) Representative H&E staining and IHC of URI and Ki67 in organoids from hURI(+/+)Int and hURI(+/KI)Int mice under low (250 nM) R-spondin 1 concentration. (G) Representative co-IF of URI and R-spondin 1 in organoids from hURI(+/+)Int and hURI(+/KI)Int mice under low (250 nM) R-spondin 1 concentration. (H) Quantification of organoid growth from hURI(+/+)Int and hURI(+/KI)Int mice at indicated time points under low (250 nM) or normal (500 nM) R-spondin 1 concentration. Results are depicted as percentage of growth related to initial size (n = 3). (I) Experimental design for R-spondin 1 treatment in URI(+/+)Int-Lgr5-EGFP and URI(Δ/Δ)Int-Lgr5-EGFP mice. (J) Representative co-IF for Lgr5-EGFP and BrdU in untreated URI(Δ/Δ)Int-Lgr5-EGFP and R-spondin 1–treated URI(Δ/Δ)Int-Lgr5-EGFP mice following 6 d of tamoxifen treatment. (K) Quantification of Lgr5/BrdU double positive cells per crypt in percentage from J. (L) Representative scatter plot from flow cytometry experiments of quiescent cells in untreated URI(Δ/Δ)Int-Lgr5-EGFP and R-spondin 1–treated URI(Δ/Δ)Int-Lgr5-EGFP mice following 6 d of tamoxifen treatment. (M) Quantification of quiescent cells (Lgr5high and Pyronin Ylow) in untreated URI(+/+)Int-Lgr5-EGFP and URI(Δ/Δ)Int-Lgr5-EGFP and R-spondin 1–treated URI(Δ/Δ)Int-Lgr5-EGFP mice following 6 d of tamoxifen treatment (n = 5, 6, 5) from L. (N–P) qRT-PCR of Mki67 and Aurkb (N), Axin2 and c-Myc (O), and Ascl2 and Olfm4 (P) in sorted Lgr5high cells from URI(+/+)Int-Lgr5-EGFP, untreated URI(Δ/Δ)Int-Lgr5-EGFP, and R-spondin 1–treated URI(Δ/Δ)Int-Lgr5-EGFP mice (n = 4, 3, 3). (Q) qRT-PCR of Mex3a mRNA levels in sorted Lgr5high cells from URI(+/+)Int-Lgr5-EGFP, untreated URI(Δ/Δ)Int-Lgr5-EGFP, and R-spondin 1–treated URI(Δ/Δ)Int-Lgr5-EGFP mice (n = 4, 4, 3). (R) Representative IF for Mex3a in intestinal tissue from URI(+/+)Int-Lgr5-EGFP, untreated URI(Δ/Δ)Int-Lgr5-EGFP, and R-spondin 1–treated URI(Δ/Δ)Int-Lgr5-EGFP mice. (S) Mex3a-positive cell number per crypt from R. (T) Representative H&E staining of URI from untreated URI(Δ/Δ)Int-Lgr5-EGFP and R-spondin 1–treated URI(Δ/Δ)Int-Lgr5-EGFP mice following 8 d of tamoxifen treatment. (U) Kaplan–Meier curve of non-treated URI(Δ/Δ)Int-Lgr5-EGFP (red solid line; n > 3) and R-spondin 1–treated URI(Δ/Δ)Int-Lgr5-EGFP (black solid line; n > 3) mice. Data represent mean ± SEM; *, P < 0.05; **, P < 0.01; ***, P < 0.001, Student’s t test, one-way ANOVA and Mantel–Cox. Scale bars represent 20 µm in J; 50 µm in A, C, and G; and 100 µm in R and T. H&E, IF, and IHC are representative of at least three independent mice. Source data are available for this figure: SourceData F4.
To confirm these findings in vivo, R-spondin 1 was intravenously injected on day 3 of tamoxifen treatment for 5 consecutive days (Fig. 4 I) into a subset of URI(Δ/Δ)Int-Lgr5-EGFP mice. BrdU and GFP co-IF indicated restoration of Lgr5high ISC proliferation (Fig. 4, J and K), which was corroborated by decreased pyronin Y staining (Fig. 4, L and M) and increased proliferation markers (Fig. 4 N) in Lgr5high ISCs from URI(Δ/Δ)Int-Lgr5-EGFP mice treated with R-spondin 1. Additionally, WNT/β-catenin signaling pathway was restored (Fig. 4, O and P) and Mex3a expression was normalized to basal levels (Fig. 4, Q–S) in sorted Lgr5high cells from R-spondin 1–injected URI(Δ/Δ)Int-Lgr5-EGFP mice, as shown by qRT-PCR and IF analysis. Importantly, crypt structure was maintained in URI(Δ/Δ)Int-Lgr5-EGFP mice treated with R-spondin 1, but not in those receiving tamoxifen alone (Fig. 4 T).
Notably, increased proliferation, DNA damage–induced cell death as well as decreased differentiation markers were still detected in sorted Lgr5low cells from R-spondin 1–injected URI(Δ/Δ)Int-Lgr5-EGFP mice, as shown by qRT-PCR and crypts’ immunohistochemistry (Fig. S3 A–F), indicating that R-spondin 1 supplementation reinstates Lgr5high ISC proliferation but does not restore phenotypic alterations in TA cells. Notably, no differences were observed in Paneth cell numbers between treated and untreated mice with R-spondin 1 (Fig. S3 F). Expectedly, mice died within 4–5 d after stopping R-spondin 1 treatment and presented phenotype and symptoms of the non-injected URI(Δ/Δ)Int-Lgr5-EGFP mice (Fig. 4 U).

R-spondin supplementation restores Lgr5 high ISC proliferation. (A–C) qRT-PCR of Axin 2 and c-Myc (A), Ascl2 and Olfm4 (B), and Mki67 and Aurkb (C) in sorted Lgr5low cells from untreated URI(+/+)Int-Lgr5-EGFP and URI(Δ/Δ)Int-Lgr5-EGFP mice, and R-spondin 1–treated URI(Δ/Δ)Int-Lgr5-EGFP mice (n = 4, 3, 3). (D) Representative pictures of IHC of γH2AX, p53, p21, cleaved caspase 3, and caspase 1 in intestinal sections from untreated URI(Δ/Δ)Int-Lgr5-EGFP and R-spondin 1–treated URI(Δ/Δ)Int-Lgr5-EGFP mice following 8 d of tamoxifen treatment. (E) qRT-PCR of Atoh1, Hes1, and Gfi1 in sorted- Lgr5low cells from untreated URI(+/+)Int-Lgr5-EGFP and URI(Δ/Δ)Int-Lgr5-EGFP mice and R-spondin 1–treated URI(Δ/Δ)Int-Lgr5-EGFP mice (n = 4, 3, 3). (F) Representative pictures of IF of lysozyme, IHC of chromogranin A, alkaline phosphatase staining, and Alcian Blue/PAS staining in intestinal sections from untreated URI(+/+)Int-Lgr5-EGFP and URI(Δ/Δ)Int-Lgr5-EGFP mice and R-spondin 1–treated URI(Δ/Δ)Int-Lgr5-EGFP mice; and corresponding quantifications (n = 3). (G) Experimental design for in vivo tracing of URI expressing cells in URI-CreERT2-EGFP; LSL-Katushka mice at indicated time points. (H) Representative picture of co-IF of Sox9 and Katushka and quantification of Sox9−/Katushka+ cells in URI-CreERT2-EGFP;LSL-Katushka mice. (I) Experimental design for in vivo tracing of URI expressing cells in URI(+/lox)Int; URI-CreERT2-EGFP; LSL-Katushka mice at indicated time points. (J) Representative picture of co-IF of Sox9 and Katushka and quantification of Sox9−/Katushka+ cells in URI(+/lox)Int; URI_CreERT2-EGFP; LSL_Katushka mice after 6 d of tamoxifen treatment. (K) Representative images of stemness assay of sorted Lgr5high and Lgr5low cells from URI(+/+)Int-Lgr5-EGFP and URI(Δ/Δ)Int-Lgr5-EGFP after 7 d. (L) Quantification of sphere number in percentage from cultured Lgr5high and Lgr5low cells from URI(+/+)Int-Lgr5-EGFP and URI(Δ/Δ)Int-Lgr5-EGFP after 7 d from K. (M) Quantification of sphere diameter (µM) from Lgr5high cells from J (n = 3). Data represent mean ± SEM; *, P < 0.05; **, P < 0.01; ***, P < 0.001; ****, P < 0.0001; one-way ANOVA. Scale bars represent 20 μm in D, H, and J; 75 μm in K; and 100 μm in F. IF and IHC are representative of at least three independent mice.

R-spondin supplementation restores Lgr5 high ISC proliferation. (A–C) qRT-PCR of Axin 2 and c-Myc (A), Ascl2 and Olfm4 (B), and Mki67 and Aurkb (C) in sorted Lgr5low cells from untreated URI(+/+)Int-Lgr5-EGFP and URI(Δ/Δ)Int-Lgr5-EGFP mice, and R-spondin 1–treated URI(Δ/Δ)Int-Lgr5-EGFP mice (n = 4, 3, 3). (D) Representative pictures of IHC of γH2AX, p53, p21, cleaved caspase 3, and caspase 1 in intestinal sections from untreated URI(Δ/Δ)Int-Lgr5-EGFP and R-spondin 1–treated URI(Δ/Δ)Int-Lgr5-EGFP mice following 8 d of tamoxifen treatment. (E) qRT-PCR of Atoh1, Hes1, and Gfi1 in sorted- Lgr5low cells from untreated URI(+/+)Int-Lgr5-EGFP and URI(Δ/Δ)Int-Lgr5-EGFP mice and R-spondin 1–treated URI(Δ/Δ)Int-Lgr5-EGFP mice (n = 4, 3, 3). (F) Representative pictures of IF of lysozyme, IHC of chromogranin A, alkaline phosphatase staining, and Alcian Blue/PAS staining in intestinal sections from untreated URI(+/+)Int-Lgr5-EGFP and URI(Δ/Δ)Int-Lgr5-EGFP mice and R-spondin 1–treated URI(Δ/Δ)Int-Lgr5-EGFP mice; and corresponding quantifications (n = 3). (G) Experimental design for in vivo tracing of URI expressing cells in URI-CreERT2-EGFP; LSL-Katushka mice at indicated time points. (H) Representative picture of co-IF of Sox9 and Katushka and quantification of Sox9−/Katushka+ cells in URI-CreERT2-EGFP;LSL-Katushka mice. (I) Experimental design for in vivo tracing of URI expressing cells in URI(+/lox)Int; URI-CreERT2-EGFP; LSL-Katushka mice at indicated time points. (J) Representative picture of co-IF of Sox9 and Katushka and quantification of Sox9−/Katushka+ cells in URI(+/lox)Int; URI_CreERT2-EGFP; LSL_Katushka mice after 6 d of tamoxifen treatment. (K) Representative images of stemness assay of sorted Lgr5high and Lgr5low cells from URI(+/+)Int-Lgr5-EGFP and URI(Δ/Δ)Int-Lgr5-EGFP after 7 d. (L) Quantification of sphere number in percentage from cultured Lgr5high and Lgr5low cells from URI(+/+)Int-Lgr5-EGFP and URI(Δ/Δ)Int-Lgr5-EGFP after 7 d from K. (M) Quantification of sphere diameter (µM) from Lgr5high cells from J (n = 3). Data represent mean ± SEM; *, P < 0.05; **, P < 0.01; ***, P < 0.001; ****, P < 0.0001; one-way ANOVA. Scale bars represent 20 μm in D, H, and J; 75 μm in K; and 100 μm in F. IF and IHC are representative of at least three independent mice.
To check if TA cells give rise to ISCs under homeostatic conditions, we labeled and tracked URI+ cells. To this end, we crossed the URI-creERT2-IRES-EGFP mouse with the transgenic reporter CAG-LSL-Katushka mouse, which expresses the far-red fluorescent protein Katushka, driven by the hybrid CAG promoter upon cre-mediated recombination (Chaves-Perez et al., 2019). URI-creERT2-IRES-EGFP, CAG-LSL-Katushka mice were injected with 4′-hydroxytamoxifen (4-OHT) for 5 consecutive days and then tamoxifen treatment was stopped for 1 wk (Fig. S3 G). Analysis indicated that Katushka+ cells were solely detected in the upper part of the crypts (Fig. S3 H) and no colocalization was observed between Sox9 and Katushka in the bottom part of the crypts, corroborating previous data published by our group (Chaves-Perez et al., 2019) and discarding that TA cells give rise to ISCs in homeostasis.
To rule out the possibility of TA-to-stem cell conversion in URI(Δ/Δ)Int mice (Liu and Chen, 2020; Tetteh et al., 2016), we crossed URI(+/Δ)Int mice with the URI-creERT2-IRES-EGFP mouse and the transgenic reporter CAG-LSL-Katushka mouse (Fig. S3 I). Since URI-creERT2-IRES-EGFP is a knock-in mouse model, the two Uri alleles were non-functional in the descendent progeny, mimicking a complete URI knockout model. Data demonstrated that there was no colocalization between Sox9 and Katushka in the bottom part of the crypts, indicating that TA-to-stem cell conversion is unlikely to happen in URI-depleted mice despite aberrant WNT/β-catenin signaling activation in TA cells (Fig. S3 J; Chaves-Perez et al., 2019). To further confirm these results, spheroid formation capacity was assessed in sorted Lgr5low TA cells and Lgr5high ISCs from URI(+/+)Int-Lgr5-EGFP and URI(Δ/Δ)Int-Lgr5-EGFP mice. The assay demonstrated that Lgr5low cells isolated from URI(Δ/Δ)Int-Lgr5-EGFP mice were not capable of forming spheres (Fig. S3, K–M).
URI and R-spondin levels correlate with crypt regeneration
Next, we crossed URI floxed mouse with Lgr5-EGFP-creERT2 line, generating URI(+/+)Lgr5 and URI(lox/lox)Lgr5 mice. EGFP-IRES-creERT2 expression in Lgr5-EGFP-IRES-creERT2 line is mosaic (Barker et al., 2007), meaning that EGFP and creERT2 proteins are expressed in some intestinal crypts but not in all of them. Therefore, URI deletion would only occur in crypts that express creERT2 after tamoxifen treatment (mosaic URI deletion). Interestingly, although villi shortening and apoptosis were detected in the upper parts of the crypts from URI(Δ/Δ)Lgr5 mice, resembling the crypt morphology observed in R-spondin 1–injected URI(Δ/Δ)Int mice, URI(Δ/Δ)Lgr5 mice survived tamoxifen treatment, whereas URI(Δ/Δ)Int-Lgr5-EGFP mice died within 10 d (Fig. 5, A and B). URI(Δ/Δ)Lgr5 mice presented normal intestinal structure 3 mo after tamoxifen treatment, indicating that the intestinal structure has undergone complete reconstruction (Fig. 5 B). Thus, remaining URI+ crypts might repopulate the intestine and restore the tissue over time, most likely through crypt fission and fusion (Baker et al., 2019; Bruens et al., 2017; Fig. 5 C). To corroborate this, we performed co-IF of URI and EGFP in URI(Δ/Δ)Lgr5 mosaic mice, at different time points of URI depletion. URI+ and Lgr5− crypts multiplied in the intestine overtime to repopulate the whole crypts of the surviving URI(Δ/Δ)Lgr5 mice, whereas Lgr5+ crypts were significantly decreasing in URI(Δ/Δ)Lgr5 mice (Fig. 5, D–G), indicating that URI+ crypts repopulate the intestine in URI(Δ/Δ)Lgr5 mice. Additionally, R-spondin 1 levels were significantly decreased in URI-depleted crypts, as shown by co-IF of URI and R-spondin 1, but R-spondin 1 was detectable in non-depleted crypts (URI+ Lgr5-), demonstrating a positive correlation between URI and R-spondin 1 levels in URI(Δ/Δ)Lgr5 mosaic mice (Fig. 5, H and I).

URI and R-spondin levels correlate with crypt regeneration. (A) Kaplan–Meier curve for survival of URI(+/+)Int (purple solid line; n = 3), URI(Δ/Δ)Int (yellow solid line; n = 3), URI(+/+)Int-Lgr5-EGFP (black solid line; n = 5), URI(+/+)Lgr5 (green solid line; n = 3), URI(Δ/Δ)Int-Lgr5-EGFP (red solid line; n = 8), and URI(Δ/Δ)Lgr5 (blue solid line; n = 3) mice treated with tamoxifen diet. (B) Representative picture of H&E staining from URI(+/+)Lgr5 and URI(Δ/Δ)Lgr5 mice at indicated time points after tamoxifen treatment. Black arrow represents apoptotic bodies. (C) Scheme describing mosaic URI deletion in the intestinal epithelium by crossing URI lox mouse with Lgr5-EGFP-CreERT2 mouse. (D) Representative pictures of co-IF for URI and GFP in URI(+/+)Lgr5, URI(Δ/Δ)Int-Lgr5-EGFP, and URI(Δ/Δ)Lgr5 mice at indicated time points of tamoxifen treatment. (E) Representative pictures of IF of GFP in URI(+/+)Lgr5 and URI URI(Δ/Δ)Lgr5 mice at survival time point after tamoxifen treatment. (F) Quantification of D. Graph representing the percentage of Lgr5+ crypts in URI(Δ/Δ)Lgr5 mice over time (n = 3 per group). (G) Quantification of D. Graph representing the percentage of Lgr5−/URI+ crypts in URI(Δ/Δ)Lgr5 mice over time (n = 3 per group). (H) Representative pictures of co-IF for URI, lysozyme, and R-spondin 1 in URI(+/+)Lgr5, URI(Δ/Δ)Int-Lgr5-EGFP, and URI(Δ/Δ)Lgr5 mice at indicated time points following tamoxifen treatment. (I) Correlation between R-spondin 1 and URI levels (A.U., intensity measured) in URI(Δ/Δ)Int after 6 d of tamoxifen treatment. Data represent mean ± SEM; ***, P < 0.001; Student’s t test. Pearson correlation was used in I. Scale bars represent 50 µm in D and H; and 100 µm in B and E. IF and H&E are representative of at least three independent mice.
URI and R-spondin levels correlate with crypt regeneration. (A) Kaplan–Meier curve for survival of URI(+/+)Int (purple solid line; n = 3), URI(Δ/Δ)Int (yellow solid line; n = 3), URI(+/+)Int-Lgr5-EGFP (black solid line; n = 5), URI(+/+)Lgr5 (green solid line; n = 3), URI(Δ/Δ)Int-Lgr5-EGFP (red solid line; n = 8), and URI(Δ/Δ)Lgr5 (blue solid line; n = 3) mice treated with tamoxifen diet. (B) Representative picture of H&E staining from URI(+/+)Lgr5 and URI(Δ/Δ)Lgr5 mice at indicated time points after tamoxifen treatment. Black arrow represents apoptotic bodies. (C) Scheme describing mosaic URI deletion in the intestinal epithelium by crossing URI lox mouse with Lgr5-EGFP-CreERT2 mouse. (D) Representative pictures of co-IF for URI and GFP in URI(+/+)Lgr5, URI(Δ/Δ)Int-Lgr5-EGFP, and URI(Δ/Δ)Lgr5 mice at indicated time points of tamoxifen treatment. (E) Representative pictures of IF of GFP in URI(+/+)Lgr5 and URI URI(Δ/Δ)Lgr5 mice at survival time point after tamoxifen treatment. (F) Quantification of D. Graph representing the percentage of Lgr5+ crypts in URI(Δ/Δ)Lgr5 mice over time (n = 3 per group). (G) Quantification of D. Graph representing the percentage of Lgr5−/URI+ crypts in URI(Δ/Δ)Lgr5 mice over time (n = 3 per group). (H) Representative pictures of co-IF for URI, lysozyme, and R-spondin 1 in URI(+/+)Lgr5, URI(Δ/Δ)Int-Lgr5-EGFP, and URI(Δ/Δ)Lgr5 mice at indicated time points following tamoxifen treatment. (I) Correlation between R-spondin 1 and URI levels (A.U., intensity measured) in URI(Δ/Δ)Int after 6 d of tamoxifen treatment. Data represent mean ± SEM; ***, P < 0.001; Student’s t test. Pearson correlation was used in I. Scale bars represent 50 µm in D and H; and 100 µm in B and E. IF and H&E are representative of at least three independent mice.
TA cell death decreases R-spondin production in the crypt niche
Published data from our lab suggests that URI loss activates two parallel axes in TA and label-retaining cells (Chaves-Perez et al., 2019). On the one hand, URI depletion causes β-catenin translocation to the nucleus, increasing c-MYC expression, leading to reduced differentiation capacity and enhanced proliferation that could induce DNA damage and cell death. On the other hand, URI loss directly leads to double-strand breaks by reducing non-homologous end-joining (NHEJ) repair, increasing p53-dependent apoptosis (Fig. 6 A), suggesting that URI is part of the DNA damage response (DDR). In line with these findings, URI expression reportedly increases at early time points following abdominal irradiation, possibly to repair the DNA damage associated with this intestinal injury (Chaves-Perez et al., 2019). To further understand the association between DNA damage, URI, and R-spondin levels, we abdominally irradiated URI(+/+)Int-Lgr5-EGFP and URI(+/Δ)Int-Lgr5-EGFP mice with 14 Gy, and URI and R-spondin levels were measured 24 h after irradiation. As previously shown (Chaves-Perez et al., 2019), radiation-induced DNA damage elevated URI levels in intestines from URI(+/+)Int-Lgr5-EGFP mice, and these levels correlated with high R-spondin expression. However, decreased URI expressions in irradiated URI(+/Δ)Int-Lgr5-EGFP mice reduced R-spondin levels (Fig. 6, B and C).

URI deletion-mediated cell death decreases R-spondin production and tissue regeneration. (A) Scheme summarizing the mechanisms and processes occurring in TA cells in URI-depleted mice and possible R-spondin level regulation. (B) Representative pictures of co-IF for GFP and cleaved caspase 3 in non-irradiated and irradiated URI(+/+)Int-Lgr5-EGFP. (C) qRT-PCR of Uri, Rspo1, and Rspo3 mRNA levels in samples from intestines of non-irradiated URI(+/+)Int-Lgr5-EGFP and URI(+/Δ)Int-Lgr5-EGFP, and irradiated URI(+/+)Int-Lgr5-EGFP, URI(+/Δ)Int-Lgr5-EGFP mice (n = 3, 3, 3, 4). (D) Experimental design for chronic irradiation experiments in URI(+/+)Int and URI(+/Δ)Int mice. (E) Mice body weight depicted in percentage related to initial body weight from non-irradiated URI(+/+)Int and URI(+/Δ)Int mice and from 5 Gy chronically irradiated URI(+/+)Int and URI(+/Δ)Int mice (n = 5 per group). (F) Intestinal permeability checked by FITC/Dextran assay in non-irradiated URI(+/+)Int and URI(+/Δ)Int mice and in 5 Gy chronically irradiated URI(+/+)Int and URI(+/Δ)Int mice, after 6 wk of treatment (n = 5). (G) Representative pictures of H&E staining, IHC of URI, γH2AX, p53 and cleaved caspase 3 and Sirius red staining. (H) URI protein level quantification from non-irradiated URI(+/+)Int and URI(+/Δ)Int mice, and from 5 Gy chronically irradiated URI(+/+)Int and URI(+/Δ)Int mice after 6 wk of treatment (n = 5). (I) Quantification of γH2AX positive cells from non-irradiated URI(+/+)Int and URI(+/Δ)Int mice, and from 5 Gy chronically irradiated URI(+/+)Int and URI(+/Δ)Int mice after 6 wk of treatment (n = 5). (J) Quantification of p53 positive cells from nonirradiated URI(+/+)Int and URI(+/Δ)Int mice, and from 5 Gy chronically irradiated URI(+/+)Int and URI(+/Δ)Int mice after 6 wk of treatment (n = 5). (K) Villi length in micrometers from nonirradiated URI(+/+)Int and URI(+/Δ)Int mice and 5 Gy chronically irradiated URI(+/+)Int and URI(+/Δ)Int mice after 6 wk of treatment (n = 5). Data represent mean ± SEM; *, P < 0.05; **, P < 0.01; ***, P < 0.001; ****, P < 0.0001; one-way ANOVA. Scale bars represent 20 µm in B; 50 µm in G; and 100 µm in G (H&E panels). IF and IHC are representative of at least three independent mice.
URI deletion-mediated cell death decreases R-spondin production and tissue regeneration. (A) Scheme summarizing the mechanisms and processes occurring in TA cells in URI-depleted mice and possible R-spondin level regulation. (B) Representative pictures of co-IF for GFP and cleaved caspase 3 in non-irradiated and irradiated URI(+/+)Int-Lgr5-EGFP. (C) qRT-PCR of Uri, Rspo1, and Rspo3 mRNA levels in samples from intestines of non-irradiated URI(+/+)Int-Lgr5-EGFP and URI(+/Δ)Int-Lgr5-EGFP, and irradiated URI(+/+)Int-Lgr5-EGFP, URI(+/Δ)Int-Lgr5-EGFP mice (n = 3, 3, 3, 4). (D) Experimental design for chronic irradiation experiments in URI(+/+)Int and URI(+/Δ)Int mice. (E) Mice body weight depicted in percentage related to initial body weight from non-irradiated URI(+/+)Int and URI(+/Δ)Int mice and from 5 Gy chronically irradiated URI(+/+)Int and URI(+/Δ)Int mice (n = 5 per group). (F) Intestinal permeability checked by FITC/Dextran assay in non-irradiated URI(+/+)Int and URI(+/Δ)Int mice and in 5 Gy chronically irradiated URI(+/+)Int and URI(+/Δ)Int mice, after 6 wk of treatment (n = 5). (G) Representative pictures of H&E staining, IHC of URI, γH2AX, p53 and cleaved caspase 3 and Sirius red staining. (H) URI protein level quantification from non-irradiated URI(+/+)Int and URI(+/Δ)Int mice, and from 5 Gy chronically irradiated URI(+/+)Int and URI(+/Δ)Int mice after 6 wk of treatment (n = 5). (I) Quantification of γH2AX positive cells from non-irradiated URI(+/+)Int and URI(+/Δ)Int mice, and from 5 Gy chronically irradiated URI(+/+)Int and URI(+/Δ)Int mice after 6 wk of treatment (n = 5). (J) Quantification of p53 positive cells from nonirradiated URI(+/+)Int and URI(+/Δ)Int mice, and from 5 Gy chronically irradiated URI(+/+)Int and URI(+/Δ)Int mice after 6 wk of treatment (n = 5). (K) Villi length in micrometers from nonirradiated URI(+/+)Int and URI(+/Δ)Int mice and 5 Gy chronically irradiated URI(+/+)Int and URI(+/Δ)Int mice after 6 wk of treatment (n = 5). Data represent mean ± SEM; *, P < 0.05; **, P < 0.01; ***, P < 0.001; ****, P < 0.0001; one-way ANOVA. Scale bars represent 20 µm in B; 50 µm in G; and 100 µm in G (H&E panels). IF and IHC are representative of at least three independent mice.
Next, since R-spondin 1 promotes intestinal radioprotection (Bhanja et al., 2009), we hypothesized that URI(+/Δ)Int mice with reduced R-spondin levels might be prone to develop radiation enteropathy, a frequent intestinal disorder that affects the intestinal epithelium integrity in cancer patients receiving abdominal radiotherapy (Hauer-Jensen et al., 2014). To this end, URI(+/Δ)Int mice were subjected to chronic doses of abdominal irradiation (5 Gy) for 12 wk (Fig. 6 D). Irradiated mice survived the treatment but showed significant body weight loss, increased barrier permeability, and signs of radiation enteropathy with high levels of DDR markers and reduced villi length (Fig. 6, E–K), indicating that heterozygous URI(+/Δ)Int mice regenerate less and are sensitized to radiation enteropathy. Therefore, decreased URI expression impairs R-spondin production in the crypt niche and halts ISC proliferation, reducing tissue regeneration.
Increased apoptosis and pyroptosis detected in sorted TA cells (see Fig. S1 C) from URI(Δ/Δ)Int-Lgr5-EGFP mice suggest that DNA damage–induced cell death mechanisms mediated by p53 and c-MYC expressions could contribute to the regulation of R-spondin levels. To assess the contribution of apoptosis, we genetically ablated p53 in URI(+/+)Int and URI(Δ/Δ)Int mice by crossing them with a p53 conditional knock-out mouse (Marino et al., 2000), generating URI(+/+)Int; p53(Δ/Δ)Int and URI(Δ/Δ)Int; p53(Δ/Δ)Int mice, respectively (Fig. 7 A). The intestinal epithelia of URI(Δ/Δ)Int; p53(Δ/Δ)Int mice exhibited reduced p53 expression and apoptosis when compared to URI(Δ/Δ)Int mice (Fig. S4, A–F), confirming the involvement of p53-dependent apoptosis mechanisms. Interestingly, URI(Δ/Δ)Int; p53(Δ/Δ)Int mice died and exhibited a phenotype similar to URI(Δ/Δ)Int mice (Fig. 7, B and C). Additionally, caspase 1 and IL-1β levels were increased in URI(Δ/Δ)Int crypts, but URI(Δ/Δ)Int; p53(Δ/Δ)Int crypts had significantly higher levels than URI(Δ/Δ)Int crypts (Fig. S4, G–J), suggesting the activation of pyroptosis as an alternative cell death mechanism. Moreover, like URI(Δ/Δ)Int mice, samples from URI(Δ/Δ)Int; p53(Δ/Δ)Int mice exhibited reduced differentiation capacity measured by decreased alkaline phosphatase, Alcian blue/PAS, and chromogranin A positive cells (Fig. S4, K–N). Importantly, although lysozyme staining was unchanged (Fig. S4, K and O), R-spondin levels remained reduced in URI(Δ/Δ)Int; p53(Δ/Δ)Int mice, as seen in URI(Δ/Δ)Int mice (Fig. 7, D and E). Since inhibition of p53-dependent apoptosis is insufficient to restore R-spondins expression and survival of URI(Δ/Δ)Int mice, pyroptosis and/or decreased epithelial cell differentiation might be alternative mechanisms or contribute to reduced R-spondin levels in the intestinal crypt niche.

TA cell death decreases R-spondin production in the crypt niche. (A) Scheme describing the generation of URI(+/+)Int; p53(Δ/Δ)Int and URI(Δ/Δ)Int; p53(Δ/Δ)Int mice by crossing URI lox mouse, p53 lox mouse, and Villin-creERT2 mouse. (B) Kaplan–Meier curve of URI(+/+)Int; p53(+/+)Int, URI(+/+)Int; p53(Δ/Δ)Int, URI(Δ/Δ)Int; p53(+/+)Int and URI(Δ/Δ)Int; p53(Δ/Δ)Int mice (n = 5, 8, 8, 8). (C) Representative pictures of H&E staining in intestines from URI(+/+)Int; p53(Δ/Δ)Int, URI(Δ/Δ)Int; p53(+/+)Int and URI(Δ/Δ)Int; p53(Δ/Δ)Int mice at indicated time points of tamoxifen treatment. (D) Representative co-IF of R-spondin 1 and lysozyme in intestinal sections from URI(+/+)Int; p53(+/+)Int, URI(Δ/Δ)Int; p53(+/+)Int, URI(+/+)Int; p53(Δ/Δ)Int, and URI(Δ/Δ)Int; p53(Δ/Δ)Int mice after 6 d of tamoxifen treatment. (E) qRT-PCR of Rspo1 and Rspo3 mRNA levels from intestinal tissue from URI(+/+)Int, URI(Δ/Δ)Int; p53(+/+)Int, and URI(Δ/Δ)Int; p53(Δ/Δ)Int mice (n = 3). (F) Scheme depicting chemical inhibition of apoptosis and/or pyroptosis in URI lox mice. (G) Kaplan–Meier curve of URI(Δ/Δ)Int mice treated with vehicle (PBS; red solid line; n = 3), URI(Δ/Δ)Int mice treated with caspase 3 inhibitor (iCasp. 3; dark blue solid line; n = 3), URI(Δ/Δ)Int mice treated with caspase 1 inhibitor (iCasp. 1; grey solid line; n = 3) and URI(Δ/Δ)Int mice treated with both inhibitors (light blue solid line; n = 3). (H) Representative pictures of H&E staining from treated mice from F at the time of death (8–10 d). (I) Number of regenerative areas per optical field (76 mm2) observed in H. (J) Scheme depicting chemical inhibition of pyroptosis in URI(Δ/Δ)Int; p53(Δ/Δ)Int mice. (K) Kaplan–Meier curve of URI(Δ/Δ)Int; p53(Δ/Δ)Int mice treated with vehicle (red solid line; n = 4) and URI(Δ/Δ)Int; p53(Δ/Δ)Int mice treated with caspase 1 inhibitor (green solid line; n = 4). (L) Representative pictures of H&E staining from URI(Δ/Δ)Int; p53(Δ/Δ)Int mice treated either with vehicle or caspase 1 inhibitor at the time of death (8–10 d). (M) Number of regenerative areas per optical field (76 mm2) observed in URI(Δ/Δ)Int; p53(Δ/Δ)Int mice treated with vehicle and URI(Δ/Δ)Int; p53(Δ/Δ)Int mice treated with caspase 1 inhibitor at time of death (8–10 d; n = 4 mice per group). (N) qRT-PCR of Rspo1 and Rspo3 mRNA levels from URI(Δ/Δ)Int; p53(Δ/Δ)Int mice treated either with vehicle or caspase 1 and 3 inhibitors and URI(Δ/Δ)Int; p53(Δ/Δ)Int mice treated with caspase 1 inhibitor (n = 3). Data represent mean ± SEM; *, P < 0.05; **, P < 0.01; ***, P < 0.001; ****, P < 0.0001; Mantel–Cox, one-way ANOVA and Student’s t test. Scale bars represent 20 μm in D; and 100 µm in C, H, and L. H&E and IF are representative of at least three independent mice.
TA cell death decreases R-spondin production in the crypt niche. (A) Scheme describing the generation of URI(+/+)Int; p53(Δ/Δ)Int and URI(Δ/Δ)Int; p53(Δ/Δ)Int mice by crossing URI lox mouse, p53 lox mouse, and Villin-creERT2 mouse. (B) Kaplan–Meier curve of URI(+/+)Int; p53(+/+)Int, URI(+/+)Int; p53(Δ/Δ)Int, URI(Δ/Δ)Int; p53(+/+)Int and URI(Δ/Δ)Int; p53(Δ/Δ)Int mice (n = 5, 8, 8, 8). (C) Representative pictures of H&E staining in intestines from URI(+/+)Int; p53(Δ/Δ)Int, URI(Δ/Δ)Int; p53(+/+)Int and URI(Δ/Δ)Int; p53(Δ/Δ)Int mice at indicated time points of tamoxifen treatment. (D) Representative co-IF of R-spondin 1 and lysozyme in intestinal sections from URI(+/+)Int; p53(+/+)Int, URI(Δ/Δ)Int; p53(+/+)Int, URI(+/+)Int; p53(Δ/Δ)Int, and URI(Δ/Δ)Int; p53(Δ/Δ)Int mice after 6 d of tamoxifen treatment. (E) qRT-PCR of Rspo1 and Rspo3 mRNA levels from intestinal tissue from URI(+/+)Int, URI(Δ/Δ)Int; p53(+/+)Int, and URI(Δ/Δ)Int; p53(Δ/Δ)Int mice (n = 3). (F) Scheme depicting chemical inhibition of apoptosis and/or pyroptosis in URI lox mice. (G) Kaplan–Meier curve of URI(Δ/Δ)Int mice treated with vehicle (PBS; red solid line; n = 3), URI(Δ/Δ)Int mice treated with caspase 3 inhibitor (iCasp. 3; dark blue solid line; n = 3), URI(Δ/Δ)Int mice treated with caspase 1 inhibitor (iCasp. 1; grey solid line; n = 3) and URI(Δ/Δ)Int mice treated with both inhibitors (light blue solid line; n = 3). (H) Representative pictures of H&E staining from treated mice from F at the time of death (8–10 d). (I) Number of regenerative areas per optical field (76 mm2) observed in H. (J) Scheme depicting chemical inhibition of pyroptosis in URI(Δ/Δ)Int; p53(Δ/Δ)Int mice. (K) Kaplan–Meier curve of URI(Δ/Δ)Int; p53(Δ/Δ)Int mice treated with vehicle (red solid line; n = 4) and URI(Δ/Δ)Int; p53(Δ/Δ)Int mice treated with caspase 1 inhibitor (green solid line; n = 4). (L) Representative pictures of H&E staining from URI(Δ/Δ)Int; p53(Δ/Δ)Int mice treated either with vehicle or caspase 1 inhibitor at the time of death (8–10 d). (M) Number of regenerative areas per optical field (76 mm2) observed in URI(Δ/Δ)Int; p53(Δ/Δ)Int mice treated with vehicle and URI(Δ/Δ)Int; p53(Δ/Δ)Int mice treated with caspase 1 inhibitor at time of death (8–10 d; n = 4 mice per group). (N) qRT-PCR of Rspo1 and Rspo3 mRNA levels from URI(Δ/Δ)Int; p53(Δ/Δ)Int mice treated either with vehicle or caspase 1 and 3 inhibitors and URI(Δ/Δ)Int; p53(Δ/Δ)Int mice treated with caspase 1 inhibitor (n = 3). Data represent mean ± SEM; *, P < 0.05; **, P < 0.01; ***, P < 0.001; ****, P < 0.0001; Mantel–Cox, one-way ANOVA and Student’s t test. Scale bars represent 20 μm in D; and 100 µm in C, H, and L. H&E and IF are representative of at least three independent mice.
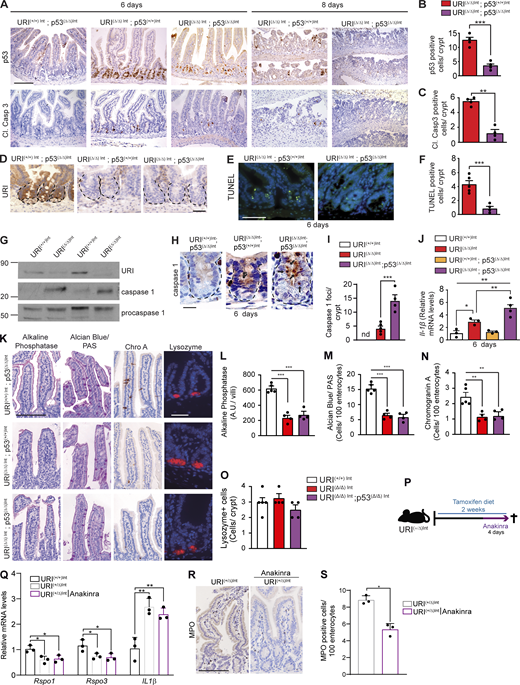
Apoptosis and pyroptosis alone are not mediating reduction in R-spondin levels in the crypt niche. (A) Representative pictures of IHC of p53 and cleaved caspase 3 in intestines from URI(+/+)Int; p53(Δ/Δ)Int, URI(Δ/Δ)Int; p53(+/+)Int, and URI(Δ/Δ)Int; p53(Δ/Δ)Int mice at indicated time points of tamoxifen treatment. (B and C) Number of p53 (B) and cleaved caspase 3 (C) positive cells per crypt (n = 4) from A. (D) Representative pictures of IHC of URI in intestinal sections from URI(+/+)Int; p53(Δ/Δ)Int, URI(Δ/Δ)Int; p53(+/+)Int, and URI(Δ/Δ)Int; p53(Δ/Δ)Int mice after 6 d of tamoxifen treatment. (E) Representative pictures of TUNEL staining of intestinal sections from URI(Δ/Δ)Int; p53(+/+)Int and URI(Δ/Δ)Int; p53(Δ/Δ)Int mice, following 6 d of tamoxifen treatment. (F) Number of TUNEL positive cells per crypt from E (n = 4). (G) WB of intestinal samples from URI(+/+)Int and URI(Δ/Δ)Int mice after 6 d of tamoxifen treatment. Membranes are blotted with indicated antibodies. (H) Representative pictures of IHC of caspase 1 in intestinal sections from URI(+/+)Int; p53(Δ/Δ)Int, URI(Δ/Δ)Int; p53(+/+)Int, and URI(Δ/Δ)Int; p53(Δ/Δ)Int mice, following 6 d of tamoxifen treatment. Black arrows depict caspase 1 foci in the crypt. (I) Quantification from H. (J) qRT-PCR of Il-1β mRNA levels from URI(+/+)Int, URI(Δ/Δ)Int, URI(+/+)Int; p53(Δ/Δ)Int, and URI(Δ/Δ)Int; p53(Δ/Δ)Int mice, following 6 d of tamoxifen treatment (n = 3, 3, 3, 4 per group). (K) Alkaline phosphatase staining, Alcian blue/PAS staining, IHC of chromogranin A (Chro A), and IF of lysozyme in intestinal sections from URI(+/+)Int; p53(Δ/Δ)Int, URI(Δ/Δ)Int; p53(+/+)Int, and URI(Δ/Δ)Int; p53(Δ/Δ)Int mice, following 6 d of tamoxifen treatment. (J and L–O) Quantification from L of alkaline phosphatase (arbitrary units per villi, A.U./villi) in M, Alcian blue/PAS (number of cells per 100 enterocytes; N), chromogranin A (number of cells per 100 enterocytes; J) and lysozyme (number of positive cells per crypt; O) stainings (n = 4) per group. (P) Scheme depicting Anakinra treatment in URI(+/Δ)Int mice. (Q) qRT-PCR of Rspo1, Rspo2, and Rspo3 mRNA levels of non-treated URI(+/+)Int and URI(+/Δ)Int mice and Anakinra-treated URI(+/Δ)Int mice (n = 3). (R) Representative picture of IHC of MPO positive cells in intestinal tissue from non-treated URI(+/Δ)Int mice and Anakinra-treated URI(+/Δ)Int mice. (S) Quantification of MPO postitive cells from R. Data represent mean ± SEM; *, P < 0.05; **, P < 0.01; ***, P < 0.001; Student’s t test and one-way ANOVA. Scale bars represent 10 μm in H; 20 μm in D (K, lysozyme panel); 50 μm in E; and 100 μm in A, K, and R. At least 50 crypts and 100 villi were quantified per mouse. IHC and IF are representative of at least three independent mice. WB are representative of at least three independent experiments. Source data are available for this figure: SourceData FS4.

Apoptosis and pyroptosis alone are not mediating reduction in R-spondin levels in the crypt niche. (A) Representative pictures of IHC of p53 and cleaved caspase 3 in intestines from URI(+/+)Int; p53(Δ/Δ)Int, URI(Δ/Δ)Int; p53(+/+)Int, and URI(Δ/Δ)Int; p53(Δ/Δ)Int mice at indicated time points of tamoxifen treatment. (B and C) Number of p53 (B) and cleaved caspase 3 (C) positive cells per crypt (n = 4) from A. (D) Representative pictures of IHC of URI in intestinal sections from URI(+/+)Int; p53(Δ/Δ)Int, URI(Δ/Δ)Int; p53(+/+)Int, and URI(Δ/Δ)Int; p53(Δ/Δ)Int mice after 6 d of tamoxifen treatment. (E) Representative pictures of TUNEL staining of intestinal sections from URI(Δ/Δ)Int; p53(+/+)Int and URI(Δ/Δ)Int; p53(Δ/Δ)Int mice, following 6 d of tamoxifen treatment. (F) Number of TUNEL positive cells per crypt from E (n = 4). (G) WB of intestinal samples from URI(+/+)Int and URI(Δ/Δ)Int mice after 6 d of tamoxifen treatment. Membranes are blotted with indicated antibodies. (H) Representative pictures of IHC of caspase 1 in intestinal sections from URI(+/+)Int; p53(Δ/Δ)Int, URI(Δ/Δ)Int; p53(+/+)Int, and URI(Δ/Δ)Int; p53(Δ/Δ)Int mice, following 6 d of tamoxifen treatment. Black arrows depict caspase 1 foci in the crypt. (I) Quantification from H. (J) qRT-PCR of Il-1β mRNA levels from URI(+/+)Int, URI(Δ/Δ)Int, URI(+/+)Int; p53(Δ/Δ)Int, and URI(Δ/Δ)Int; p53(Δ/Δ)Int mice, following 6 d of tamoxifen treatment (n = 3, 3, 3, 4 per group). (K) Alkaline phosphatase staining, Alcian blue/PAS staining, IHC of chromogranin A (Chro A), and IF of lysozyme in intestinal sections from URI(+/+)Int; p53(Δ/Δ)Int, URI(Δ/Δ)Int; p53(+/+)Int, and URI(Δ/Δ)Int; p53(Δ/Δ)Int mice, following 6 d of tamoxifen treatment. (J and L–O) Quantification from L of alkaline phosphatase (arbitrary units per villi, A.U./villi) in M, Alcian blue/PAS (number of cells per 100 enterocytes; N), chromogranin A (number of cells per 100 enterocytes; J) and lysozyme (number of positive cells per crypt; O) stainings (n = 4) per group. (P) Scheme depicting Anakinra treatment in URI(+/Δ)Int mice. (Q) qRT-PCR of Rspo1, Rspo2, and Rspo3 mRNA levels of non-treated URI(+/+)Int and URI(+/Δ)Int mice and Anakinra-treated URI(+/Δ)Int mice (n = 3). (R) Representative picture of IHC of MPO positive cells in intestinal tissue from non-treated URI(+/Δ)Int mice and Anakinra-treated URI(+/Δ)Int mice. (S) Quantification of MPO postitive cells from R. Data represent mean ± SEM; *, P < 0.05; **, P < 0.01; ***, P < 0.001; Student’s t test and one-way ANOVA. Scale bars represent 10 μm in H; 20 μm in D (K, lysozyme panel); 50 μm in E; and 100 μm in A, K, and R. At least 50 crypts and 100 villi were quantified per mouse. IHC and IF are representative of at least three independent mice. WB are representative of at least three independent experiments. Source data are available for this figure: SourceData FS4.
Thus, we assessed the role of pyroptosis-induced Il-1β in the regulation of R-spondin levels. Heterozygous URI(+/Δ)Int mice treated with the IL-1R inhibitor anakinra for 4 d had similar levels of R-spondins compared with non-treated URI(+/Δ)Int mice (Fig. S4, P and Q). The efficiency of anakinra treatment was confirmed by reduced levels of neutrophils (Fig. S4, R and S). These data suggest that reduction in R-spondins is not solely mediated by pyroptosis-induced Il-1β axis.
To test whether apoptosis and pyroptosis synergistically contribute to URI(Δ/Δ)Int mouse phenotype, mice were injected daily with caspase 3 (Z-DEVD-FMK) and/or caspase 1 (Ac-YVAD-cmk) inhibitors (Fig. 7 F). Mice treated with both inhibitors survived longer and exhibited partially restored intestinal architecture and regenerative areas after 8 d of treatment (Fig. 7, G–I). Similar results were detected in caspase 1 inhibitor-injected URI(Δ/Δ)Int; p53(Δ/Δ)Int mice (Fig. 7, J–M). Importantly, R-spondin levels were reinstated when both pyroptosis and apoptosis were inhibited in URI(Δ/Δ)Int mice (Fig. 7 N). Thus, TA cell death influences R-spondin levels in URI(Δ/Δ)Int mouse phenotype, but cell death inhibition and R-spondin restoration are not sufficient to rescue mouse lethality, probably due to remaining defects in TA cell differentiation through c-MYC activation.
c-MYC inhibition restores R-spondin levels
Next, we downregulated c-MYC by treating URI(+/+)Int and URI(Δ/Δ)Int mice with JQ1, a BET bromodomain inhibitor (Fig. S5 A; Buren et al., 2016; Delmore et al., 2011). Crypt and intestinal structures were partially restored in JQ1-treated URI(Δ/Δ)Int mice (Fig. S5 B), which survived longer than non-treated mice (Fig. S5 C). Crypt insights from JQ1-treated URI(Δ/Δ)Int mice indicated residual apoptotic bodies (Fig. S5 B), resembling crypt architecture at 5–6 d of URI depletion in non-treated mice (Chaves-Perez et al., 2019). Furthermore, histopathological analysis at the time of death showed that JQ1-injected URI(Δ/Δ)Int mice had crypt loss and epithelial erosions (Fig. S5 B). Successful c-MYC downregulation was accompanied by reduced DNA damage, replicative stress, and cell death program (apoptosis and pyroptosis), and increased differentiation capacity in JQ1-treated URI(Δ/Δ)Int mice (Fig. S5 D). Importantly, R-spondin levels were increased in JQ1-treated URI(Δ/Δ)Int mice (Fig. S5 E). Interestingly, abolishing differentiation in URI(+/+)Int mice by crossing them with APC lox mice revealed no significant effects on R-spondin 1 levels (Fig. S5 F). Since inhibition of pyroptosis and apoptosis was sufficient to restore R-spondin levels, these findings suggest that c-MYC controls R-spondin levels, most likely via cell death mechanisms, independently of cell differentiation capacity.

c-MYC inhibition restores R-spondin levels. (A) Scheme depicting chemical inhibition of c-MYC by JQ1 in URI lox mice. (B) Representative pictures of H&E staining and IHC of URI in intestinal sections from JQ1-treated URI(+/+)Int, vehicle-treated URI(Δ/Δ)Int and JQ1-treated URI(Δ/Δ)Int mice at indicated time points of tamoxifen treatment. (C) Kaplan–Meier curve of JQ1-treated URI(+/+)Int (black solid line; n = 4), vehicle (5% DMSO and 5% glucose in water)-treated URI(Δ/Δ)Int (red solid line; n = 6) and JQ1-treated URI(Δ/Δ)Int mice (yellow solid line; n = 7). (D) Representative pictures of IHC of c-MYC, γH2AX, phospho-RPA, p53, cleaved caspase 3, caspase 1, and chromogranin A and Alcian blue/PAS staining from vehicle-treated URI(Δ/Δ)Int and JQ1-treated URI(Δ/Δ)Int mice following 6 and 9 d of tamoxifen treatment, respectively. Graph represents number of c-MYC positive cells per crypt. Black arrows represent caspase 1 positive foci. Graphs represent number of positive cells per crypt (n = 3, 4, 5, 6). (E) qRT-PCR of Rspo1 and Rspo3 mRNA levels of vehicle-treated URI(Δ/Δ)Int and JQ1-treated URI(Δ/Δ)Int mice (n = 3). (F) qRT-PCR of Rspo1 mRNA levels of URI(+/+)Int, URI(Δ/Δ)Int, and URI(Δ/Δ)Int; APC(Δ/Δ) mice (n = 4, 4, 5). (G) Scheme depicting c-MYC genetic ablation in URI lox mice. (H) Representative IHC of cMYC in intestinal sections from URI(Δ/Δ)Int; c-MYC(+/+)Int and URI(Δ/Δ)Int; c-MYC(Δ/Δ)Int mice after 6 d of tamoxifen treatment. (I) Representative pictures of IHC of URI in intestinal sections from URI(+/+)Int; c-MYC(Δ/Δ)Int, URI(Δ/Δ)Int; c-MYC(+/+)Int, and URI(Δ/Δ)Int; c-MYC(Δ/Δ)Int mice at indicated time points of tamoxifen treatment. Data represent mean ± SEM; *, P < 0.05; **, P < 0.01; ***, P < 0.001; Mantel–Cox, Student’s t test and one-way ANOVA. Scale bars represent 20 μm in D and H; 50 μm in D (Alcian Blue/PAS and chromogranin A panels); and 100 μm in B and I. At least 50 crypts and 100 villi were quantified per mouse. H&E and IHC are representative of at least three independent mice.

c-MYC inhibition restores R-spondin levels. (A) Scheme depicting chemical inhibition of c-MYC by JQ1 in URI lox mice. (B) Representative pictures of H&E staining and IHC of URI in intestinal sections from JQ1-treated URI(+/+)Int, vehicle-treated URI(Δ/Δ)Int and JQ1-treated URI(Δ/Δ)Int mice at indicated time points of tamoxifen treatment. (C) Kaplan–Meier curve of JQ1-treated URI(+/+)Int (black solid line; n = 4), vehicle (5% DMSO and 5% glucose in water)-treated URI(Δ/Δ)Int (red solid line; n = 6) and JQ1-treated URI(Δ/Δ)Int mice (yellow solid line; n = 7). (D) Representative pictures of IHC of c-MYC, γH2AX, phospho-RPA, p53, cleaved caspase 3, caspase 1, and chromogranin A and Alcian blue/PAS staining from vehicle-treated URI(Δ/Δ)Int and JQ1-treated URI(Δ/Δ)Int mice following 6 and 9 d of tamoxifen treatment, respectively. Graph represents number of c-MYC positive cells per crypt. Black arrows represent caspase 1 positive foci. Graphs represent number of positive cells per crypt (n = 3, 4, 5, 6). (E) qRT-PCR of Rspo1 and Rspo3 mRNA levels of vehicle-treated URI(Δ/Δ)Int and JQ1-treated URI(Δ/Δ)Int mice (n = 3). (F) qRT-PCR of Rspo1 mRNA levels of URI(+/+)Int, URI(Δ/Δ)Int, and URI(Δ/Δ)Int; APC(Δ/Δ) mice (n = 4, 4, 5). (G) Scheme depicting c-MYC genetic ablation in URI lox mice. (H) Representative IHC of cMYC in intestinal sections from URI(Δ/Δ)Int; c-MYC(+/+)Int and URI(Δ/Δ)Int; c-MYC(Δ/Δ)Int mice after 6 d of tamoxifen treatment. (I) Representative pictures of IHC of URI in intestinal sections from URI(+/+)Int; c-MYC(Δ/Δ)Int, URI(Δ/Δ)Int; c-MYC(+/+)Int, and URI(Δ/Δ)Int; c-MYC(Δ/Δ)Int mice at indicated time points of tamoxifen treatment. Data represent mean ± SEM; *, P < 0.05; **, P < 0.01; ***, P < 0.001; Mantel–Cox, Student’s t test and one-way ANOVA. Scale bars represent 20 μm in D and H; 50 μm in D (Alcian Blue/PAS and chromogranin A panels); and 100 μm in B and I. At least 50 crypts and 100 villi were quantified per mouse. H&E and IHC are representative of at least three independent mice.
To confirm these findings, we crossed URI lox mice with a conditional c-MYC knockout mouse, generating URI(+/+)Int; c-MYC(Δ/Δ)Int and URI(Δ/Δ)Int; c-MYC(Δ/Δ)Int mice (Fig. 8 A and Fig. S5, G–I; Chaves-Perez et al., 2019; de Alboran et al., 2001). Genetic c-MYC ablation in URI(Δ/Δ)Int mice had similar effects to its downregulation in JQ1-treated mice, showing a partial increase in mouse survival, but an altered intestinal architecture (Fig. 8, B and C). Importantly, DNA damage–induced cell death was decreased (Fig. 8 D), differentiation was restored (Fig. 8, E and F), and R-spondin levels were increased (Fig. 8, G and H) in URI(Δ/Δ)Int; c-MYC(Δ/Δ)Int mice when compared to URI(Δ/Δ)Int; c-MYC(+/+)Int mice. Notably, no differences in Paneth cell number were detected (Fig. 8, E and F). Hence, c-MYC inactivation reduces cell death and restores R-spondin levels.

c-MYC inhibition and sulindac treatment restores R-spondin levels. (A) Scheme describing the generation of URI(+/+)Int; c-MYC(Δ/Δ)Int, and URI(Δ/Δ)Int; c-MYC(Δ/Δ)Int mice by crossing URI lox mouse, c-MYC lox mouse and Villin-creERT2 mouse. (B) Kaplan-Meier curve of URI(Δ/Δ)Int; c-MYC(+/+)Int (n = 7), URI(+/+)Int; c-MYC(Δ/Δ)Int (n = 8) and URI(Δ/Δ)Int; c-MYC(Δ/Δ)Int (n = 7) mice. (C) Representative pictures of H&E staining in intestinal sections from URI(+/+)Int; c-MYC(Δ/Δ)Int, URI(Δ/Δ)Int; c-MYC(+/+)Int and URI(Δ/Δ)Int; c-MYC(Δ/Δ)Int mice following 8 d of tamoxifen treatment. (D) Representative pictures of IHC of cleaved caspase 3 and γH2AX in URI(Δ/Δ)Int; c-MYC(+/+)Int and URI(Δ/Δ)Int; c-MYC(Δ/Δ)Int mice after tamoxifen treatment. (E) Representative pictures of IF of lysozyme, IHC of chromogranin A, alkaline phosphatase staining and Alcian Blue/PAS staining in intestinal sections from URI(Δ/Δ)Int; c-MYC(+/+)Int and URI(Δ/Δ)Int; c-MYC(Δ/Δ)Int mice. (F) Quantifications of E. (G) Representative pictures of co-IF for R-spondin 1 and lysozyme in intestinal sections from URI(+/+)Int; c-MYC(+/+)Int, URI(Δ/Δ)Int; c-MYC(+/+)Int and URI(Δ/Δ)Int; c-MYC(Δ/Δ)Int mice. (H) qRT-PCR of Rspo1 and Rspo3 mRNA levels from URI(+/+)Int; c-MYC(+/+)Int, URI(Δ/Δ)Int; c-MYC(+/+)Int and URI(Δ/Δ)Int; c-MYC(Δ/Δ)Int mice. (I) Representative pictures of IHC for MPO, F4/80, and CD3 from URI(+/+)Int and URI(Δ/Δ)Int mice after 6 d of tamoxifen treatment and their quantifications. (J) Representative IHC of CD3 and MPO-positive cells and their quantifications in non-treated and Sulindac treated URI(Δ/Δ)Int mice. (K) qRT-PCR for TNFα mRNA levels in non-treated URI(+/+)Int and URI(Δ/Δ)Int and Sulindac treated URI(+/+)Int and URI(Δ/Δ)Int mice. (L) qRT-PCR for Rspo1 in non-treated URI(+/+)Int and URI(Δ/Δ)Int and Sulindac treated URI(+/+)Int and URI(Δ/Δ)Int mice. (M) qRT-PCR of Mki67 and AurkB of non-treated URI(+/+)Int and URI(Δ/Δ)Int and Sulindac treated URI(+/+)Int and URI(Δ/Δ)Int mice. (N) Representative pictures of IF for Mex3a in intestinal tissue from non-treated URI(+/+)Int and URI(Δ/Δ)Int and Sulindac treated URI(Δ/Δ)Int mice. (O) Mex3a positive cell number per crypt from N. (P) qRT-PCR for Wnt3a mRNA levels in non-treated URI(+/+)Int and URI(Δ/Δ)Int and Sulindac treated URI(Δ/Δ)Int mice. Data represent mean ± SEM; *, P < 0.05; **, P < 0.01; ***, P < 0.001; Mantel–Cox, Student’s t test and one-way ANOVA. Scale bars represent 20 μm in D and G; 50 µm in I and J; and 100 µm in C, E, and N. H&E, IHC, and IF are representative of at least three independent mice.
c-MYC inhibition and sulindac treatment restores R-spondin levels. (A) Scheme describing the generation of URI(+/+)Int; c-MYC(Δ/Δ)Int, and URI(Δ/Δ)Int; c-MYC(Δ/Δ)Int mice by crossing URI lox mouse, c-MYC lox mouse and Villin-creERT2 mouse. (B) Kaplan-Meier curve of URI(Δ/Δ)Int; c-MYC(+/+)Int (n = 7), URI(+/+)Int; c-MYC(Δ/Δ)Int (n = 8) and URI(Δ/Δ)Int; c-MYC(Δ/Δ)Int (n = 7) mice. (C) Representative pictures of H&E staining in intestinal sections from URI(+/+)Int; c-MYC(Δ/Δ)Int, URI(Δ/Δ)Int; c-MYC(+/+)Int and URI(Δ/Δ)Int; c-MYC(Δ/Δ)Int mice following 8 d of tamoxifen treatment. (D) Representative pictures of IHC of cleaved caspase 3 and γH2AX in URI(Δ/Δ)Int; c-MYC(+/+)Int and URI(Δ/Δ)Int; c-MYC(Δ/Δ)Int mice after tamoxifen treatment. (E) Representative pictures of IF of lysozyme, IHC of chromogranin A, alkaline phosphatase staining and Alcian Blue/PAS staining in intestinal sections from URI(Δ/Δ)Int; c-MYC(+/+)Int and URI(Δ/Δ)Int; c-MYC(Δ/Δ)Int mice. (F) Quantifications of E. (G) Representative pictures of co-IF for R-spondin 1 and lysozyme in intestinal sections from URI(+/+)Int; c-MYC(+/+)Int, URI(Δ/Δ)Int; c-MYC(+/+)Int and URI(Δ/Δ)Int; c-MYC(Δ/Δ)Int mice. (H) qRT-PCR of Rspo1 and Rspo3 mRNA levels from URI(+/+)Int; c-MYC(+/+)Int, URI(Δ/Δ)Int; c-MYC(+/+)Int and URI(Δ/Δ)Int; c-MYC(Δ/Δ)Int mice. (I) Representative pictures of IHC for MPO, F4/80, and CD3 from URI(+/+)Int and URI(Δ/Δ)Int mice after 6 d of tamoxifen treatment and their quantifications. (J) Representative IHC of CD3 and MPO-positive cells and their quantifications in non-treated and Sulindac treated URI(Δ/Δ)Int mice. (K) qRT-PCR for TNFα mRNA levels in non-treated URI(+/+)Int and URI(Δ/Δ)Int and Sulindac treated URI(+/+)Int and URI(Δ/Δ)Int mice. (L) qRT-PCR for Rspo1 in non-treated URI(+/+)Int and URI(Δ/Δ)Int and Sulindac treated URI(+/+)Int and URI(Δ/Δ)Int mice. (M) qRT-PCR of Mki67 and AurkB of non-treated URI(+/+)Int and URI(Δ/Δ)Int and Sulindac treated URI(+/+)Int and URI(Δ/Δ)Int mice. (N) Representative pictures of IF for Mex3a in intestinal tissue from non-treated URI(+/+)Int and URI(Δ/Δ)Int and Sulindac treated URI(Δ/Δ)Int mice. (O) Mex3a positive cell number per crypt from N. (P) qRT-PCR for Wnt3a mRNA levels in non-treated URI(+/+)Int and URI(Δ/Δ)Int and Sulindac treated URI(Δ/Δ)Int mice. Data represent mean ± SEM; *, P < 0.05; **, P < 0.01; ***, P < 0.001; Mantel–Cox, Student’s t test and one-way ANOVA. Scale bars represent 20 μm in D and G; 50 µm in I and J; and 100 µm in C, E, and N. H&E, IHC, and IF are representative of at least three independent mice.
Inflammatory cues regulate R-spondin levels in the crypt niche
The cell death program is a well-known process that triggers inflammatory responses in the tissue. Notably, URI(Δ/Δ)Int mice had increased inflammation in their intestines (Chaves-Perez et al., 2019; Fig. 8 I). Therefore, we checked whether cell death program-induced inflammatory cues could modulate R-spondin production. Interestingly, supplying sulindac (a broad anti-inflammatory reagent) in drinking water significantly reduced inflammatory marks of URI(Δ/Δ)Int mice (relative to controls receiving reagent-free water; Fig. 8, J and K) and interestingly increased R-spondin levels (Fig. 8 L). Moreover, sulindac treatment restored ISC proliferation (Fig. 8, M–O) and normalized levels of Wnt3a (Fig. 8 P) in URI(Δ/Δ)Int mice.
c-MYC and p53 suppression restores Lgr5high ISC proliferation
The experiments above indicate that decreased URI expression alters TA cell survival, which reduces R-spondin levels in the crypt niche via recruitment of inflammatory cells, thereby impairing ISC proliferation. However, maintenance of tissue architecture and complete rescue of survival of URI(Δ/Δ)Int mice may require full restoration of the two-axis controlled by URI loss: inhibition of c-MYC to restore TA cell survival and differentiation capacity, and the suppression of p53-induced apoptosis activated by URI depletion (Fig. 9 A). p53 and c-MYC were therefore genetically ablated in the intestinal epithelium of URI lox mice, generating URI(+/+)Int; c-MYC(Δ/Δ)Int; p53(Δ/Δ)Int and URI(Δ/Δ)Int; c-MYC(Δ/Δ)Int; p53(Δ/Δ)Int mice. Genetic ablation of p53 and c-MYC completely restored the structures of intestinal crypts in URI(Δ/Δ)Int mice (Fig. 9, B and C). Importantly, about 60% of URI(Δ/Δ)Int; c-MYC(Δ/Δ)Int; p53(Δ/Δ)Int mice survived with no symptoms (Fig. 9 D) and DDR, including apoptosis and pyroptosis, was reduced, and differentiation was restored in their intestines (Fig. 9 E). Importantly, normal R-spondin and Wnt3a levels were re-established in the crypt niche of URI(Δ/Δ)Int; c-MYC(Δ/Δ)Int; p53(Δ/Δ)Int mice (Fig. 10, A and B). Moreover, laser microdissection of crypt upper part indicated that proliferation (Mki67 and AurkB), stemness (Ascl2 and Olmf4), and differentiation (Gfi1 and Hes1) were normalized in TA cells from URI(Δ/Δ)Int; c-MYC(Δ/Δ)Int; p53(Δ/Δ)Int mice when compared to URI(Δ/Δ)Int mice (Fig. 10, C–G and Video 1). Importantly, proliferative capacity and WNT/β-catenin signaling pathway were restored in Lgr5high ISCs from URI(Δ/Δ)Int; c-MYC(Δ/Δ)Int; p53(Δ/Δ)Int mice when compared to URI(Δ/Δ)Int mice (Fig. 10, H and I). Thus, dual suppression of c-MYC and p53 is required to restore organ architecture in URI(Δ/Δ)Int mice, most likely by reinstating complete TA cell survival, differentiation, and R-spondin levels. Hence, TA cells represent a signaling platform essential for ISC proliferation and maintenance of organ homeostasis and architecture.

c-MYC and p53 suppression restore intestinal architecture in URI (Δ/Δ)Int mice. (A) Scheme summarizing the mechanisms and processes occurring in TA cells in URI-depleted mice. (B) Representative pictures of H&E and IHC of URI staining in intestinal sections from URI(Δ/Δ)Int and URI(Δ/Δ)Int; c-MYC(Δ/Δ)Int; p53(Δ/Δ)Int mice at indicated time points of tamoxifen treatment. (C) Villi length and crypt depth from URI(Δ/Δ)Int and URI(Δ/Δ)Int; c-MYC(Δ/Δ)Int; p53(Δ/Δ)Int mice following 8 and 30 d of tamoxifen treatment, respectively (n = 5 per group). (D) Kaplan–Meier curve of male mice as indicated on the graph (n = 6, 8, 9, 5, 7, 6, 7, 5). (E) Representative pictures of IHC of c-MYC, γH2AX, phospho-RPA, p53, cleaved caspase 3, caspase 1, as well as alkaline phosphatase, Alcian blue/PAS and Chromogranin A stainings in intestinal sections from URI(Δ/Δ)Int; c-MYC(+/+)Int; p53(+/+)Int and URI(Δ/Δ)Int; c-MYC(Δ/Δ)Int; p53(Δ/Δ)Int mice at indicated time points of tamoxifen treatment. Graphs represent number of corresponding positive cells per crypt (c-MYC, γH2AX, phospho-RPA, p53, cleaved caspase 3), positive foci per crypt (caspase 1), arbitrary units (A.U.) per villi (alkaline phosphatase) and number of positive cells per 100 enterocytes (Alcian blue/PAS and chromogranin A) after 10 d of tamoxifen treatment (n = 3, 3). Data represent mean ± SEM; *, P < 0.05; **, P < 0.01; and ***, P < 0.001; Mantel–Cox, one-way ANOVA and Student’s t test. Quantification is performed over 50 crypts and 100 villi per mouse in three independent mice in C. Scale bars represent 50 μm in E (c-MYC and caspase 1 panels); and 100 μm in B and E. H&E and IHC are representative of at least three independent mice.
c-MYC and p53 suppression restore intestinal architecture in URI (Δ/Δ)Int mice. (A) Scheme summarizing the mechanisms and processes occurring in TA cells in URI-depleted mice. (B) Representative pictures of H&E and IHC of URI staining in intestinal sections from URI(Δ/Δ)Int and URI(Δ/Δ)Int; c-MYC(Δ/Δ)Int; p53(Δ/Δ)Int mice at indicated time points of tamoxifen treatment. (C) Villi length and crypt depth from URI(Δ/Δ)Int and URI(Δ/Δ)Int; c-MYC(Δ/Δ)Int; p53(Δ/Δ)Int mice following 8 and 30 d of tamoxifen treatment, respectively (n = 5 per group). (D) Kaplan–Meier curve of male mice as indicated on the graph (n = 6, 8, 9, 5, 7, 6, 7, 5). (E) Representative pictures of IHC of c-MYC, γH2AX, phospho-RPA, p53, cleaved caspase 3, caspase 1, as well as alkaline phosphatase, Alcian blue/PAS and Chromogranin A stainings in intestinal sections from URI(Δ/Δ)Int; c-MYC(+/+)Int; p53(+/+)Int and URI(Δ/Δ)Int; c-MYC(Δ/Δ)Int; p53(Δ/Δ)Int mice at indicated time points of tamoxifen treatment. Graphs represent number of corresponding positive cells per crypt (c-MYC, γH2AX, phospho-RPA, p53, cleaved caspase 3), positive foci per crypt (caspase 1), arbitrary units (A.U.) per villi (alkaline phosphatase) and number of positive cells per 100 enterocytes (Alcian blue/PAS and chromogranin A) after 10 d of tamoxifen treatment (n = 3, 3). Data represent mean ± SEM; *, P < 0.05; **, P < 0.01; and ***, P < 0.001; Mantel–Cox, one-way ANOVA and Student’s t test. Quantification is performed over 50 crypts and 100 villi per mouse in three independent mice in C. Scale bars represent 50 μm in E (c-MYC and caspase 1 panels); and 100 μm in B and E. H&E and IHC are representative of at least three independent mice.

c-MYC and p53 suppression restore Lgr5 high ISC proliferation in URI (Δ/Δ)Int mice. (A) qRT-PCR of Rspo1 and Rspo3 mRNA levels of URI(+/+)Int; c-MYC(+/+)Int; p53(+/+)Int, URI(Δ/Δ)Int; c-MYC(+/+)Int; p53(+/+)Int and URI(Δ/Δ)Int; c-MYC(Δ/Δ)Int; p53(Δ/Δ)Int mice (n = 3). (B) qRT-PCR of Wnt3a mRNA levels of URI(+/+)Int; c-MYC(+/+)Int; p53(+/+)Int, URI(Δ/Δ)Int; c-MYC(+/+)Int; p53(+/+)Int, URI(Δ/Δ)Int; c-MYC(Δ/Δ)Int; p53(Δ/Δ)Int, URI(Δ/Δ)Int; c-MYC(Δ/Δ)Int; p53(+/+)Int, and URI(Δ/Δ)Int; c-MYC(+/+)Int; p53(Δ/Δ)Int mice (n = 3). (C) Pictures represent crypt images before (with dots) and after (white/empty space) laser microdissection. Blue dots represent the exact point in which the laser impacts during tissue microdissection. The green line delineates the bottom part of the crypt. The red line delineates the upper part of the crypt. (D) qRT-PCR of Lgr5 mRNA levels in laser microdissected upper and basal parts of the crypt from URI(+/+)Int mice. (E–G) qRT-PCR of Mki67 and AurkB (E), of Ascl2 and Olfm4 (F), and of Gfi1 and Hes1 (G) of laser microdissected upper parts of the crypts (Lgr5low cells) from URI(+/+)Int, URI(Δ/Δ)Int, and URI(Δ/Δ)Int; c-MYC(Δ/Δ)Int; p53(Δ/Δ)Int mice (n = 4). (H and I) qRT-PCR of Mki67 and AurkB (H) and Axin2 and Ascl2 (I) of laser microdissected basal part of the crypts (Lgr5high cells) from URI(+/+)Int, URI(Δ/Δ)Int, and URI(Δ/Δ)Int; c-MYC(Δ/Δ)Int; p53(Δ/Δ)Int mice (n = 4). Data represent mean ± SEM; *, P < 0.05; **, P < 0.01; and ***, P < 0.001; Student’s t test and one-way ANOVA. Scale bar represents 10 μm in C.
c-MYC and p53 suppression restore Lgr5 high ISC proliferation in URI (Δ/Δ)Int mice. (A) qRT-PCR of Rspo1 and Rspo3 mRNA levels of URI(+/+)Int; c-MYC(+/+)Int; p53(+/+)Int, URI(Δ/Δ)Int; c-MYC(+/+)Int; p53(+/+)Int and URI(Δ/Δ)Int; c-MYC(Δ/Δ)Int; p53(Δ/Δ)Int mice (n = 3). (B) qRT-PCR of Wnt3a mRNA levels of URI(+/+)Int; c-MYC(+/+)Int; p53(+/+)Int, URI(Δ/Δ)Int; c-MYC(+/+)Int; p53(+/+)Int, URI(Δ/Δ)Int; c-MYC(Δ/Δ)Int; p53(Δ/Δ)Int, URI(Δ/Δ)Int; c-MYC(Δ/Δ)Int; p53(+/+)Int, and URI(Δ/Δ)Int; c-MYC(+/+)Int; p53(Δ/Δ)Int mice (n = 3). (C) Pictures represent crypt images before (with dots) and after (white/empty space) laser microdissection. Blue dots represent the exact point in which the laser impacts during tissue microdissection. The green line delineates the bottom part of the crypt. The red line delineates the upper part of the crypt. (D) qRT-PCR of Lgr5 mRNA levels in laser microdissected upper and basal parts of the crypt from URI(+/+)Int mice. (E–G) qRT-PCR of Mki67 and AurkB (E), of Ascl2 and Olfm4 (F), and of Gfi1 and Hes1 (G) of laser microdissected upper parts of the crypts (Lgr5low cells) from URI(+/+)Int, URI(Δ/Δ)Int, and URI(Δ/Δ)Int; c-MYC(Δ/Δ)Int; p53(Δ/Δ)Int mice (n = 4). (H and I) qRT-PCR of Mki67 and AurkB (H) and Axin2 and Ascl2 (I) of laser microdissected basal part of the crypts (Lgr5high cells) from URI(+/+)Int, URI(Δ/Δ)Int, and URI(Δ/Δ)Int; c-MYC(Δ/Δ)Int; p53(Δ/Δ)Int mice (n = 4). Data represent mean ± SEM; *, P < 0.05; **, P < 0.01; and ***, P < 0.001; Student’s t test and one-way ANOVA. Scale bar represents 10 μm in C.
Imaging video of intestinal crypt microdissection. PALM MicroLaser Systems was used to dissect areas of interest. Playback speed is 1×.
Imaging video of intestinal crypt microdissection. PALM MicroLaser Systems was used to dissect areas of interest. Playback speed is 1×.
Discussion
Here, we demonstrate that injured TA cells disable the production of R-spondin 1 and 3 in the intestine, thereby abolishing the proliferation of the mitotically active Lgr5high ISCs in URI(Δ/Δ)Int mice. Interestingly, other mitogenic factors were not affected, indicating that intestinal regeneration might likely depend on the combinatorial action of R-spondin 1 and 3. This is supported by previous findings showing that R-spondin 1 enhances intestinal regeneration after chemo-radiotherapy (Bhanja et al., 2009; Kim et al., 2005; Zhou et al., 2013). Moreover, R-spondin 3 has been associated with intestinal repair upon injury (Harnack et al., 2019).
Importantly, we demonstrate that lysozyme+ Paneth cells represent an unreported source for R-spondin 1 production and may cooperate with stromal cells or telocytes that produce R-spondin 3 to maintain the ISC niche (Harnack et al., 2019; Kabiri et al., 2014; Shoshkes-Carmel et al., 2018). In line with these findings, Sato et al. demonstrate that genetic removal of Paneth cells in vivo results in the concomitant loss of Lgr5high ISCs (Sato et al., 2011), demonstrating that Paneth cells provide essential mitogenic factors to support the ISC niche. However, inducible deletion of the transcription factor Math1, an essential driver of secretory cell differentiation, demonstrates that Paneth cells are dispensable for intestinal regeneration under homeostasis and following injury (Durand et al., 2012; Garabedian et al., 1997). This argues for an alternative source of signals capable of sustaining stem cell proliferation after Math1 depletion, suggesting that mesenchymal cells act as a potential source of niche factors. This is in agreement with the fact that R-spondin 1 knockout mice are viable (Chadi et al., 2009), and R-spondin 3 ablation in adult mice neither alters crypt integrity nor intestinal function under homeostatic conditions (Harnack et al., 2019; Sigal et al., 2017). Notably, R-spondin 3 reductions in stromal cells upon URI depletion suggest that TA cells not only influence the secretion of R-spondin 1 in Paneth cells but may also regulate the production of R-spondins from other cellular sources.
It has been also reported that R-spondin family proteins synergize with various WNT ligands to activate WNT/β-catenin signaling pathway (Kazanskaya et al., 2004). However, experiments provided in this manuscript suggest that Wnt3a is upregulated by URI depletion and independently of R-spondin additions. Since Wnt3a is upregulated in the intestinal epithelium following damage (Cosin-Roger et al., 2013; Zou et al., 2018) and has been reportedly implicated in the intestinal regenerative response (Zou et al., 2018), we could speculate that URI depletion leads to an increase of Wnt3a levels, most likely as compensatory mechanisms of R-spondin reductions. Importantly, and according to our findings, Wnt3a expression was previously reported to be increased in injured and inflamed tissues and released by macrophages (Malsin et al., 2019; Neumann et al., 2010). An alternative explanation could be that Wnt3a is increased to counteract the elevated levels of TNFα since many studies reportedly describe the anti-inflammatory functions of Wnt3a in macrophages, particularly to reduce TNFα production (Neumann et al., 2010).
In agreement with previous findings showing that TA cells orchestrate stem cell activity and tissue regeneration in the skin (Hsu et al., 2014), URI depletion in TA cells activates several parallel pathways involving DNA damage–induced cell death and decreased differentiation capacity to regulate ISC proliferation. On one hand, URI binds and retains β-catenin in TA cells within the APC destruction complex (Chaves-Perez et al., 2019). When URI is lost, the complex falls apart and β-catenin is released and translocated to the nucleus independently of exogenous ligands (Chaves-Perez et al., 2019). β-Catenin activation leads to c-MYC overexpression in TA cells causing replicative stress and DNA damage–mediated cell death, reducing their differentiation capacity (Chaves-Perez et al., 2019). On the other hand, URI depletion directly leads to double-strand DNA breaks by reducing NHEJ repair, inducing p53-dependent apoptosis (Chaves-Perez et al., 2019; Fig. 9 A). Interestingly, restoration of TA cell survival in URI(Δ/Δ)Int mice via inhibition of cell death program (pyroptosis and apoptosis) by either suppression of c-MYC or inhibition of pyroptosis in p53-depleted mice rehabilitates R-spondin 1 production and resets ISC proliferation without restoring completely mouse survival. Selective c-MYC and p53 suppression to completely rehabilitate TA cell survival and differentiation capacity is essential to preserve the intestinal architecture of URI-depleted mice and protect them from death, indicating that preserving both the complete TA cell survival and differentiation capacity is indispensable for proper organ regeneration in URI(Δ/Δ)Int mice. Moreover, the fact that proliferative Lgr5high ISCs will continuously give rise to URI− TA cells which undergo cell death may explain why dual p53 and c-MYC suppression is needed to rescue mouse death and why R-spondin supplementation alone is not sufficient to promote survival in URI(Δ/Δ)Int mice.
The cell death program (apoptosis and pyroptosis) is a well-known process to trigger inflammatory responses (Chauhan et al., 2020). Dead cells release a variety of factors, namely cell death- or damage-associated molecular-pattern molecules, and alarmins (Chauhan et al., 2020) that might be implicated in the recruitment of inflammatory cells that modulate the production of R-spondins. Our data demonstrate that inhibition of inflammatory responses increases R-spondin and restores Wnt3a levels, indicating that TA cell death controls inflammatory cues to modulate the levels of mitogenic factors, and hence ISC proliferation. Notably, suppressing basal levels of inflammation (most likely triggered by dead cells on the top of the villi) in control mice also increases R-spondin levels. Therefore, inflammatory cues are central in the regulation of R-spondins, and hence might contribute to controlling intestinal regeneration. Although inflammatory mediators involved in the regulation of these mitogenic factors remain still to be elucidated, TNFα was dramatically increased in URI(Δ/Δ)Int mice but suppressed in c-MYC-depleted (not shown) and sulindac-treated URI(Δ/Δ)Int mice. Since TNFα reportedly regulates several mitogenic factors (Wnt3a being increased in our model; Malsin et al., 2019; Neumann et al., 2010), it is tempting to speculate that reduced R-spondin levels could be modulated by enhanced TNFα.
In conclusion, our data indicate that URI+ TA cells represent a cell signaling platform essential to preserve the ISC niche by controlling inflammatory responses and R-spondin production, thereby regulating Lgr5high ISCs proliferation. The tightly regulated balance of the crypt environment is essential to sustain intestinal homeostasis and architecture upon various damages and pathologies.
Materials and methods
Antibodies
Rabbit polyclonal anti-Wnt3a (NBP1-74183, 1:100 [IF], 1:1,000 [WB]) was purchased from Novus Bio. Rabbit polyclonal anti-Sox9 (AB5535, 1:300 [IF]) was purchased from Merck Millipore. Alexa Fluor 488 Goat anti-chicken IgY (A-11039, 1:500), Alexa Fluor 488 Goat anti-mouse IgG (A-11001, 1:500), Alexa Fluor 555 Goat anti-mouse IgG (A-21422, 1:500), Alexa Fluor 555 Goat anti-rabbit IgG (A-21429, 1:500), Alexa Fluor 647 Goat anti-rabbit IgG (A-21245, 1:500), Streptavidin, and Alexa Fluor 488 conjugate (S11223, 1:500 [IF]) were purchased from Life Technologies/Thermo Fisher Scientific. Chicken polyclonal anti-GFP (GFP-1020, [IF]1:250) was from AvesLab. Mouse monoclonal anti-caspase-1 (14F468; sc-56036, 1:100 [IHC], 1:1,000 [WB]), rat monoclonal anti-p19ARF (5-C3-1; sc-32748, 1:100 [IHC]), and rabbit monoclonal anti-CD3 (sc-20047, 1:100 [IHC]) were purchased from Santa Cruz Biotechnology. Goat polyclonal anti-mouse HRP conjugated (P0447, 1:1,000), goat polyclonal anti-rabbit HRP conjugated (P0448, 1:1,000), rabbit polyclonal anti-myeloperoxidase (MPO; A0398, 1:250 [IHC]), and rabbit polyclonal anti-lysozyme (A0099, 1:250 [IHC/IF]) were from Dako. Mouse monoclonal anti-Vinculin (V9131, 1:2,000) was from Sigma-Aldrich. Mouse monoclonal anti-BrdU (RPN202, 1:100) was from GE Healthcare. Rabbit monoclonal anti-c-MYC (Y69, ab32072, 1:100 [IHC] for mouse), rabbit polyclonal anti-GPCR GPR49 (ab75732, 1:200), rabbit polyclonal anti-Chromogranin A (ab15160, 1:100 [IHC]) were purchased from Abcam. Rabbit polyclonal anti-Mex3a (ab79046, 1:50 [IF]) was provided by Abcam. Mouse monoclonal anti-p53 (2,524, 1:500), rabbit monoclonal anti-cleaved caspase 3 (05-636, 1:300 [IHC], 1:500 [WB]), and rabbit monoclonal anti-vimentin (5,741, 1:250 [IF]) were purchased from Cell Signaling Technology. Mouse monoclonal anti-γH2AX (Ser139; 05-636, 1:500 [IHC]) and rabbit polyclonal anti-Sox9 (ab5535, 1:300 [IF]) were purchased from Millipore. Rabbit polyclonal anti-Katushka (ab233, 1:250 [IF] was purchased from Evrogen. Rat monoclonal anti-F4/80 (MCA497, 1:50 [IHC]) was purchased from ABD Serotec. Rabbit polyclonal anti-R-spondin 1 (25348-1-AP, 1:100 [IF], 1:250 [WB]) was provided by ProteinTech. Rabbit monoclonal anti-Ki67 (SP6; MAD-000310QD, undiluted [IHC/IF]) was provided by Master Diagnostica. Rabbit polyclonal anti-p53 (NCL-L-p53-CM5p; VP-P956, 1:250 [IHC/IF]) was from Vector Laboratories. Rabbit polyclonal anti-phospho RPA32 (S4/S8; A300-245A, 1:100 [IHC]) was purchased from Bethyl. Rat monoclonal anti-p21 (crude sera) were produced and provided by the CNIO Monoclonal Antibodies Unit. Antibodies against URI were previously reported (Buren et al., 2016; Djouder et al., 2007; Tummala et al., 2014).
Mouse models
To specifically express human URI (hURI) in the intestinal epithelium, ColhURI mouse previously described (Tummala et al., 2014) was crossed with a line containing the tetracycline-dependent transactivator (rtTA2-M2) under the control of the Villin promoter (Roth et al., 2009) to generate Villin-rtTA2-M2/hURItetON mouse, named hURI(+/KI)Int mouse. Intestinal-specific ectopic hURI expression was switched on by the administration of doxycycline in the diet. hURI is expressed in the intestine since weaning, and mice were on doxycycline, unless otherwise stated, until they were sacrificed.
To specifically delete mouse URI in the intestinal epithelium, conditional Uri knockout (URI lox) mouse was generated by the deletion of exon 4 of the Uri gene as previously described (Chaves-Perez et al., 2019). To induce URI deletion specifically in the intestine, URI lox mouse was crossed with Villin-creERT2 mice (el Marjou et al., 2004) generating URI(+/+)Int, URI(+/Δ)Int, and URI(Δ/Δ)Int. Intestinal-specific URI deletion was achieved by administration of tamoxifen in the diet at indicated time points.
To study the role of apoptosis in URI(Δ/Δ)Int mice, URI lox; Villin-creERT2 mouse was crossed with conditional p53 lox mouse (Marino et al., 2000), generating URI(Δ/Δ)Int; p53(Δ/Δ)Int after tamoxifen diet.
To study the role of c-MYC, URI lox and Villin-creERT2 mice were crossed with conditional c-MYC lox mouse (de Alboran et al., 2001) alone or in combination with conditional p53 lox mouse, generating URI(Δ/Δ)Int; c-MYC(Δ/Δ)Int, or URI(Δ/Δ)Int; c-MYC(Δ/Δ)Int:p53(Δ/Δ)Int, respectively.
To study the role of APC in R-spondin levels, URI lox; Vilin-creERT2 mouse was crossed with conditional APC lox mouse, generating URI(+/+)Int; APC(+/Δ) mice after tamoxifen diet.
To study the role of senescence, URI lox mouse and Villin-creERT2 mice were crossed with p16/p19 (INK4a/ARF) constitutive knockout mouse (Serrano et al., 1996) to generate URI(Δ/Δ)Int; p16/p19 (INK4a/ARF; Δ/Δ) mouse, after 2 wk of tamoxifen treatment in 8 wk-old mice.
Constitutive p21Cip knockout mouse (Brugarolas et al., 1995) was crossed with URI lox; Villin-creERT2 mouse to generate URI(Δ/Δ)Int; p21(Δ/Δ).
To label and track URI-expressing cells, on one hand,URI-creERT2-IRES-EGFP mouse was crossed with the transgenic reporter CAG-LSL-Katushka mouse, generating URI-creERT2-IRES-EGFP; CAG-LSL-Katushka mice. On the other hand, URI(+/Δ)Int mouse was crossed with the URI-creERT2-IRES-EGFP mouse and the transgenic reporter CAG-LSL-Katushka mouse, generating URI(+/Δ)Int;URI-creERT2-IRES-EGFP; CAG-LSL-Katushka mice.
To study the role of Lgr5+ cells in URI(Δ/Δ)Int mice, URI lox and Villin-creERT2 mice were crossed with Lgr5-EGFP-IRES-creERT2 mice (Barker et al., 2007) to generate URI(Δ/Δ)Int-Lgr5-EGFP mice.
“Time of death” specified in the figure legends does not correspond specifically to the time of spontaneous mouse death, but rather to the time when mice were either sacrificed to harvest the samples/tissues, or when mice died.
Mice were housed in a specific pathogen–free animal house of Spanish National Cancer Research Centre (CNIO), Madrid. No inclusion criteria were used. The mice were housed with a 12 h light/dark cycle between 8:00 and 20:00 in a temperature-controlled room (22 ± 1°C) with free access to water and food. All experiments were approved by the CNIO-ISCIII Ethics Committee and Community of Madrid and performed in accordance with the guidelines for ethical conduct in the care and use of animals as stated in the international guiding principles for biomedical research involving animals, developed by the Council for International Organizations of Medical Sciences. Littermates were always used as controls. Further details are included in Table S1.
Mouse diets and treatments
For Villin-creERT2 mouse, cre-mediated recombinase was activated by feeding 8-wk-old mice with a tamoxifen diet (TAM400/CreER, TD.55125, ENVIGO) for 2 wk, or earlier when specified.
Villin-rtTA2-M2 mediating hURI expression was activated by feeding mice continuously since weaning with doxycycline hyclate diet (200 mg/kg; TD.04104, ENVIGO) at a concentration of a 50 mg/kg.
For c-MYC inhibition, mice were daily injected (intraperitoneally) with 50 mg/kg of (+)−JQ1 (M2167; Abmole) dissolved in 5% DMSO and 5% glucose diluted in water. Vehicle mice were injected with 5% DMSO and 5% glucose diluted in water. Treatment started at the same time as the tamoxifen diet in 8-wk-old mice.
To inhibit apoptosis and pyroptosis, mice were injected daily with inhibitors of caspase 3 (Z-DEVD-FMK, 8 mg/kg) and/or caspase 1 (Ac-YVAD-cmk, 8 mg/kg) until mice were sacrificed. Vehicle mice were injected with PBS.
Murine R-spondin 1 (120-38, Peprotech) treatment was performed by tail intravenous (i.v.) injections (100 mg/day/mouse) for 5 consecutive days. The treatment started on day 3 of tamoxifen diet.
For Paneth cell degranulation, mice were administrated with a single dose of either 1 mg/kg of carbamylcholine (C4382; Sigma-Aldrich) diluted in PBS by subcutaneous injection or 10 mg/kg of aceclidine (SML0180; Sigma-Aldrich) diluted in PBS by intraperitoneal injection. Mice were euthanized 15 min after injection.
Mice were abdominally irradiated with 14 Gy as previously described (Chaves-Perez et al., 2019). For chronic abdominal irradiation, 5 Gy were applied in each session, and two sessions per week were given to mice. Before abdominal irradiation, mice were anesthetized by using ketamine (Imalgene 1,000, 100 mg/kg) and xylazine (10 mg/kg). Non-irradiated mice were treated with the same dose and compound to anesthetize, similar to irradiated mice.
To check IL-1β inhibition, mice were intraperitoneally injected with IL-1R inhibitor Anakinra (Swedish Orphan Biovitrum) for 4 d (10 mg/kg).
Sulindac (99% purity, Shanghai Moda Chemicals Co., Ltd) was dissolved in drinking water (0.18 g/liter) and given to mice for 6 d. Sulindac was changed every second day, freshly prepared.
For intestinal permeability assay, mice were first starved for 12 h and then given by oral gavage 60 mg/100 g of body weight of FITC/Dextran (46945; Sigma-Aldrich) dissolved in water. 4 h later, serum was collected and analyzed by Sinergy HTX Multi-Mode Microplate Reader (BioTek) at 485 nm of excitation wavelength and 528 nm of emission wavelength by using Gen5 software (BioTek).
Genotyping
For genotyping, finger DNA was extracted by overnight incubation of fingers with 500 μl of the cell lysis buffer (1% SDS, 0.1 M NaCl, 0.1 M EDTA, and 0.05 M Tris, pH 8), and 400 μg/ml of proteinase K (0706–100 mg; VWR International Eurolab). DNA obtained after saturated salt precipitation (5 M NaCl) was further precipitated using ice-cold isopropanol. DNA pellet was washed with 70% ethanol. Purified DNA was dried and resuspended in 500 μl of distilled water. 1 μl of DNA was used for genotyping as previously reported (Brandt et al., 2018; Chaves-Perez et al., 2019). Primers used for genotyping are listed in Table S1.
Vectors, backbone, and shRNA cloning
LT3REVIR was a gift from Johannes Zuber (plasmid #111176; Addgene). For de novo generation of miR-E shRNAs, 97-mer oligonucleotides (IDT Ultramers) coding for shRenilla (5′-TGCTGTTGACAGTGAGCGCAGGAATTATAATGCTTATCTATAGTGAAGCCACAGATGTATAGATAAGCATTATAATTCCTATGCCTACTGCCTCGGA-3′) or shRspo1 (5′-TGCTGTTG ACAGTGAGCGCTAAAGGTTTATTTCAAATTAATAGTGAAGCCACAGATGTATTAATTTGAAATAAACCTTTAATGCCTACTGCCTCGGA-3′) were PCR amplified using the primers miRE-Xho-fw (5′-TGAACTCGAGAAGGTATATTGCTGTTG ACAGTGAGCG-3′) and miRE-Eco-rev (5′-TCTCGAATTCTAGCCCCTTGAAGTCCGAGGCAGTAGGC-3′) and cloned into miRE recipient vector (LT3REVIR) as previously described (Fellmann et al., 2013).
Crypt isolation
Freshly isolated small intestines of URI(+/+)Int, URI(Δ/Δ)Int, hURI(+/+)Int, and hURI(+/KI)Int mice were opened longitudinally and washed three times in ice-cold PBS (w/o). Then, intestines were chopped into 2–5 mm pieces, placed in 8 mM PBS/EDTA at room temperature, and vortex for 30 s. The supernatant contains the villi. Intestinal tissue was subsequently incubated in 8 mM PBS/EDTA for 15 min at 4°C. Vigorous shaking yielded free crypts that were filtered through a 100 μm mesh. To recover the crypts, the supernatant was spun at 800 rpm for 3 min, and then the pellet was washed twice in ice-cold PBS.
Culture of intestinal organoids
Around 100 freshly isolated crypts were counted and embedded in 50 μl of undiluted Matrigel (356231; Cultek) and culture DMEM/F12 media (D8437; Sigma-Aldrich) supplemented with Pen/Strept, 1× (2 mM) Glutamax (35050038; Gibco or Life Technologies/Thermo Fisher Scientific), 10 mM Hepes (15630049; Gibco or Life Technologies/Thermo Fisher Scientific), 2 mM N-acetyl cysteine (A8199-10G; Sigma-Aldrich), 1× B27 supplement (17504-044; Life Technologies), 10 mM Nicotinamide (N0636-100G; Sigma-Aldrich), 50 ng/ml of recombinant mEGF (PMG8044; Gibco), 100 ng/ml of recombinant Nogging (250-38; PeproTech), 3.5 μM CHIR99021 (GSK3 inhibitor; 2520691; PeproTech), 1 μg/ml murine R-spondin 1 (120-38; Peprotech), 10 μM Y-27632 inhibitor (1293823; PeproTech), and 1% Normocyn (ant-nr-1; InvivoGen; Barriga et al., 2017). Notably, CHIR99021 (GSK3 inhibitor; 2520691; PeproTech) was kept in culture for 12 h to establish the culture, and the medium was replaced without this inhibitor. The media was changed every 3 d. Depending on the experiment, the crypt culture media was supplemented with 1.5 μg/ml doxycycline (D9891; Sigma-Aldrich) or 1 μM of 4-OHT (H6278; Sigma-Aldrich). Organoids were paraffin-embedded and processed for IF and IHC following the protocols described below.
Organoid differentiation and R-spondin 1 titration
Organoid differentiation assays were performed as previously described (Yin et al., 2014). Briefly, crypts or single cells were entrapped in Matrigel and plated at the center of wells in a 24-well plate. Following polymerization of Matrigel, 500 μl of complete Advanced DMEM/F12 was added. For ENR-CV media, we used EGF (50 ng/ml; Life Technologies), Noggin (100 ng/ml; PeproTech), R-spondin 1 (500 ng/ml; R&D), and small molecules including CHIR99021 (3 μM; Stemgent) and valproic acid (1 mM; Sigma-Aldrich). ENR-CD media contains EGF (50 ng/ml; Life Technologies), Noggin (100 ng/ml; PeproTech), R-spondin 1 (500 ng/ml; R&D), and small molecules including CHIR99021 (3 μM; Stemgent) and DAPT (10 µM; Sigma-Aldrich). Differentiation assays were carried out for 4–6 d.
For R-spondin 1 titration, crypts were isolated and cultured for 4–6 d in ENR media. After that, crypts were split, washed, transferred to fresh Matrigel, and cultured for 4–6 d in EN media supplemented with indicated R-spondin 1 concentrations (0, 100, 200, 300, 400, and 500 nM).
Cell culture
HCT-116 and SW620 cells (ATCC CCL-247 and CCL-227, respectively) were maintained in high-glucose DMEM supplemented with glutamine, 10% FBS, and 100 U/ml penicillin and 0.1 mg/ml streptomycin. Cells were subcultured when they reached 80–90% confluence. HCT-116 cells received 40 Gy irradiation to induce R-spondin 1 expression as previously described (Zhou et al., 2013).
Co-culture assays
For organoid single-cell suspension, the cell culture medium was removed and Accutase (Life Technologies) was added. After incubation at 37°C for 10–20 min, cell colonies were dissociated into single cells by pipetting. Cells were then washed, resuspended in FACS buffer, and sorted. For co-culture assays, we used 1:1 ratio between Paneth and ISCs. Cells were co-cultured in ENR media for 5 d to allow organoid formation and then transferred to minimal ENR media (100 nM R-spondin) with doxycycline for 4 d.
Spheroid formation assay
Sorted cells were collected at low temperatures, pelleted, and embedded in Growth Factor Reduced Matrigel (354230; Corning), followed by seeding on a prewarmed 96-well plate. Prewarmed Intesticult organoid growth media (06005; Stemcell Technologies) was added after polymerization of the Matrigel. Media was supplemented with CHIR99021 (HY-10182; MedChem Express) and Y-27632 (Axon 1683; Axon MedChem) for the first days. Media was changed every 4 d by removing 50% and adding 50% fresh media.
Intestine preparation
Small intestine and colon were removed from mice, flushed with 10% formalin, and incubated in 10% formalin for 5 min. Subsequently, intestines were opened longitudinally, “swiss-rolled,” incubated overnight in 10% formalin at room temperature, and processed for paraffin embedding.
Production of lentiviral particles
To produce lentiviral particles, we used HEK293T cultured in DMEM supplemented with 10% FCS and 1% penicillin/streptomycin. DNA transfection was performed using PEI (1 mg/ml), 10 μg of lentiviral plasmid encoding Rspo1 or Renilla, 5 µg of pVSVg, and 2.5 µg of pPAX packaging vectors. Media was replaced the day after, and the supernatant was collected 72 h later and filtered through a 0.45-µm filter. The supernatant was centrifuged at 50,000 g in an ultracentrifuge for 90 min to concentrate the virus. For organoid transduction, the lentiviral pellet was resuspended in 500 μl of organoid culture medium supplemented with 10 mM nicotinamide, 10 µM CHIR99021, 10 µM Y-27632, and 8 µg/ml polybrene.
Lentiviral transduction of organoids
Freshly isolated crypts were cultured in ENR-CV for 4–6 d. The day before the transduction, organoids were split and cultured in organoid media supplemented with 10 µM CHIR99021 and 10 mM nicotinamide. Hyperproliferative crypts were extracted from matrigel and dissociated using TriplE (Gibco). To enhance transduction efficacy, lentiviral spinoculation was performed by putting organoids in a prewarmed centrifuge at 32°C and rotated at 600 g for 1 h. Transduced organoids were incubated for 4 h at 37°C. After that, organoids were washed using organoid culture media and embedded in fresh matrigel.
siRNA transfection in cells
Knockdown experiments in HCT-116 or SW620 cells were performed using either ON-TARGET plus SMART pool siRNA targeting human URI (L-017399-00; Dharmacon) or ON-TARGET plus SMART pool siRNA targeting human R-spondin 1 (L-018179-01-0005; Dharmacon) as well as control siRNA (D-001810-10; Dharmacon). Cells were grown and subcultured. siRNAs were transfected using Lipofectamine-RNAiMAX (13778100; Thermo Fisher Scientific) according to the manufacturer’s instructions.
siRNA transfection in adult intestinal organoids
For transient siRNA transfection, organoids were extracted from Matrigel by using Cell Recovery Solution (354253; Corning). Afterward, the crypts were washed twice with cold PBS and transfected with control siRNA or Rspo-1 siRNA by using RNAiMAX transfection reagent (13778; Invitrogen) following manufacturer’s guidelines. Afterward, the crypts were plated on top of Matrigel-coated plates. R-spondin 1 expression was assessed by IF as described above by using the R-spondin 1 antibody (25348-1-AP), 48 h after transfection.
Immunoblotting
Immunoblotting was performed from intestine lysates. Briefly, the small intestine was removed from mice and the proximal ileum was flushed with cold PBS, opened longitudinally, and directly frozen in liquid nitrogen. Tissue or cells were lysed using RIPA lysis buffer containing 10 mM Tris, pH 7.5, 100 mM NaCl, 1 mM EDTA, 1 mM EGTA, 1 mM NaF, 20 mM Na4P2O7, 2 mM Na3VO4, 0.1% SDS, 0.5% sodium deoxycholate, 1% Triton-X 100, and 10% glycerol; supplemented with 10 mg/ml proteases inhibitor aprotinin and 1 mM PMSF followed by homogenization using Precellys 24 Bead Mill homogenizer (WQ03119-200-RD000.0; Bertin Technologies; 15 × 2 s, power set to 5,500 w); and then clarified by centrifugation at 4°C and 10,000 g for 10 min. Protein concentration was measured by using Bio-Rad Bradford reagent (5000001; BioRad) and bovine serum albumin (BSA; A7906; Sigma-Aldrich) as the standard protein. 1 mg/ml concentrated lysates were made by boiling the appropriate amount of protein lysates with 2× laemmli buffer (4% SDS, 20% glycerol, 10% 2-mercaptoethanol, 0.004% bromophenol blue in 0.2 M Tris-HCL of pH 7) at 70°C for 10 min. 10–30 μg of protein lysates were subjected to SDS-PAGE gels and transferred to 0.2 μm nitrocellulose membranes (10600001; GE Healthcare). The membranes were blocked with 5% Blotting-Grade Blocker (non-fat dry milk, 170-6404; BioRad) in Tris-buffer saline containing 1% Tween 20 for 1 h at room temperature. WB was performed using the indicated antibodies and processed by ECL according to the manufacturer’s instructions.
Tissue immunohistochemistry
Intestines were prepared and embedded in paraffin as described (Brandt et al., 2018; Chaves-Perez et al., 2019). Sections of 3 μm were deparaffinized, rehydrated, and antigen-retrieved by using 1 M sodium citrate buffer (pH 6.5). After blocking endogenous peroxidase using 3% H2O2 (in water) for 10 min, sections were then blocked with 1:200 goat/rabbit/horse serum in PBS/0.2% Triton for 1 h at room temperature. Then, sections were incubated with primary antibodies diluted in PBS/0.2% Triton overnight at 4°C. Slides were washed twice in PBS, and goat/mouse/rabbit/rat Vectastain ABC kit (PK-4005/PK-4002/PK-4001/PK-4004, respectively from Vector Laboratories) was used as the secondary antibody. Sections were washed twice in PBS and incubated with 3,3-diaminobenzidinetetracloride chromogen (K3468; Dako). Stainings were counterstained with hematoxylin, dehydrated through increasing grades of ethanol (75, 95, and 100%), and mounted on xylol.
Tissue immunofluorescence
Intestines were prepared and embedded in paraffin as described (Brandt et al., 2018; Chaves-Perez et al., 2019). Sections of 3 μm were deparaffinized, rehydrated, and antigen-retrieved by using 1 M sodium citrate buffer (pH 6.5). To detect endogenous mouse URI by immunofluorescence, endogenous peroxidase was blocked by using 3% H2O2 (in water) for 10 min. Then, sections were blocked with 1:200 goat serum in PBS/0.2% Triton for 1 h at room temperature and then incubated with Avidin/Biotin Blocking Kit (SP-2001; Vector Laboratories). Slides were rinsed three times in PBS and further incubated with Mouse-on-Mouse Basic Kit (BMK-2202; Vector Laboratories) to avoid unspecific signals coming from mouse tissue. Then, sections were incubated with URI monoclonal antibody (1:200) diluted in PBS/0.2% Triton overnight at 4°C. Slides were washed three times in PBS and incubated with anti-mouse HRP (1:500) for 1 h at room temperature. Sections were washed twice in PBS and the signal was amplified by using TSA Plus Biotin Kit (NEL749A001KT; PerkinElmer) following the manufacturer’s instructions. Slides were washed three times in PBS and incubated with Streptavidin, Alexa Fluor 488 conjugate secondary antibodies for 1 h at room temperature, followed by staining with DAPI (1 µg/ml; D9542; Sigma-Aldrich). Slides were mounted using Prolong Gold Antifade Reagent (P36930; Life Technologies/Thermo Fisher Scientific).
For other antibodies, sections were blocked, after antigen retrieval, with 1:200 either goat, rabbit, or horse serum in PBS/0.2% Triton for 1 h at room temperature. Sections were then incubated with primary antibodies diluted in PBS/0.2% Triton overnight at 4°C. Slides were washed twice in PBS and incubated with either FITC, TRITC, or Cy5-conjugated secondary antibodies for 1 h at room temperature, followed by staining with DAPI (1 µg/ml; D9542; Sigma-Aldrich). Slides were mounted using Prolong Gold Antifade Reagent (P36930; Life Technologies/Thermo Fisher Scientific).
Crypt immunohistochemistry and immunofluorescence
Organoids were recovered using Cell Recovery Solution (354253; Corning BD) and fixed with 4% paraformaldehyde for 1 h at room temperature (18–21°C). Next, the samples were passed through an ethanol series (70, 96, and 100%) and embedded in paraffin. Immunohistochemistry and immunofluorescence were performed using standard techniques as previously described.
Alcian blue/PAS staining
Intestinal sections were deparaffinized and rehydrated. Staining was performed using Alcian Blue/PAS/Hematoxylin Stain Kit (AR17811-2; Agilent Technologies) according to the manufacturer’s instructions.
Alkaline phosphatase assay in intestinal tissue
Intestinal sections were deparaffinized and rehydrated. Staining was performed using Leukocyte Alkaline Phosphatase Kit (86R-1KT; Sigma-Aldrich) following the manufacturer’s instructions. Slides were mounted in aqueous mounting media (S302380-2; Dako).
TUNEL staining
Paraffin-embedded slides were deparaffinized and rehydrated. In situ detection of cells with DNA-strand breaks was performed using In Situ Cell Death Detection Kit (11684795910; Roche) according to the manufacturer's instructions. Afterward, sections were stained with DAPI (1 µg/ml), mounted in Prolong Gold Antifade Reagent, and analyzed under a fluorescence microscope.
Gomori’s trichrome staining
Paraffin-embedded intestinal sections were subjected to deparaffination and rehydration. Slides were incubated in Bouin’s fixative solution (1.5% Picrid acid, 10% formaldehyde, and 5% glacial acetic acid) at 56°C for 1 h and washed in deionized water trice. Then, a nuclear staining with hematoxylin was performed. After washing, slides were submerged in trichrome solution (0.6% chromotrope 2R, 0.3% light green SF, 0.8% dodecatungstophosphoric acid, and 1% glacial acetic acid) for 15 min at RT. Post-incubated samples were rinsed in 0.5% acetic acid, dehydrated in 90% and absolute isopropanol, and then mounted in xylene.
Sirius red staining
Intestinal sections were deparaffinized and hydrated through decreasing grades of ethanol. These sections were fixed with prewarmed Bouin’s solution (HT10132; Sigma-Aldrich) at 55°C for 1 h. They were washed in water until the yellowish color of Bouin’s solution disappeared and incubated in 0.1% Fast Green FCF (F99-10; Thermo Fisher Scientific) for 10 min. Next, they were placed in 1% acetic acid (100063.1000; Fisher Scientific) for 2 min and rinsed in water. Slides were incubated for 1 h in 0.1% Sirius red (0-0303; Sigma-Aldrich), washed, dehydrated, and mounted in xylene.
In situ hybridization (RNAscope) and lysozyme staining
Tissue samples were fixed in 10% neutral buffered formalin (4% formaldehyde in solution), paraffin-embedded and cut at 4 μm, mounted in Superfrost plus slides, and dried overnight. Lysozyme immunohistochemistry and RNAScope staining method were performed in an automated immunostaining platform (Ventana Discovery ULTRA; Roche), including deparaffination and rehydration as a part of the platform protocol. Antigen retrieval was first performed with the appropriate buffer and protease (Sample Prep Kit; ACD), and endogenous peroxidase was blocked (peroxide hydrogen at 3%). Then, slides were incubated first with the appropriate primary antibody: rabbit polyclonal anti-lysozyme (1/750, A0099; Dako). After the primary antibody, slides were incubated with the corresponding secondary antibody and visualization systems when needed (OmniMap anti- Rabbit, Ventana; Roche) and then conjugated with horseradish peroxidase. An immunohistochemical reaction was developed using blue chromogen (Discovery Teal Kit, Ventana; Roche). Consecutively, slides were incubated with the appropriate probe: musculus R- spondin 1 (Rspo1) mRNA (479599; ACD). After the probe, slides were incubated with the corresponding Probe Amplification kit (conjugated with horseradish peroxidase), and the reaction was developed using 3,3-diaminobenzidine tetrahydrochloride (DAB Detection Kit, Ventana; Roche); nuclei were counterstained with hematoxylin. Finally, the slides were dehydrated, cleared, and mounted with a permanent mounting medium for microscopic evaluation. Positive control sections were included for each staining run using Mm-PPIB probeto confirm RNA sample quality and positive control sections known to be primary antibody positive.
Senescence-associated β-galactosidase assay
The intestine was removed from mice, washed with cold PBS, opened longitudinally, and directly embedded and frozen in optimum cutting temperature (4583; TissueTek). Then 10 μm sections of frozen tissue were fixed in 0.5% glutaraldehyde/PBS for 10 min and washed for 3 min in buffer containing PBS, pH 5.5, 1 mM MgCl2, 50 mM imidazole (56750; Sigma-Aldrich), and 20 mM N-acetyloglucosamine. Afterward, slides were incubated overnight in 37°C in staining solution containing: 1 mg/ml 5-bromo-4-chloro-3-indolyl-β-D-galactopyranoside in dimethylformamide, 40 mM citric acid/sodium phosphate, pH 6.0, 5 mM potassium ferricyanide, 150 mM NaCl, 2 mM MgCl2, 50 mM imidazole, and 20 mM N-acetylglucosamine. Next, slides were washed three times with PBS, counterstained with eosin, and mounted in 70% glycerol.
Cell sorting
Crypts were isolated as described above. After spinning, crypts were incubated in DMEM/F12 medium (D8437; Sigma-Aldrich) supplemented with 0.8 U/ml dispase (17105041; Life Technologies/Thermo Fisher Scientific) and 0.8 mg/ml DNase (04716728001; Roche) for 30 min at 37°C. Subsequently, cells were filtered through a 70-μM mesh, spin down at 1,200 rpm for 5 min, and resuspended in MACS buffer (0.5% BSA and 2 mM EDTA in Ca2+/Mg2+-free PBS). GFPhigh (ISCs), GFPlow (TA cells), and GFP− high side scattering/forward scattering (high size/high granularity) were isolated from Lgr5-EGFP-IRES-creERT2 mice crossed with URI lox mice by flow cytometry using BD FACSAria II cell sorter (BD Biosciences).
Pyronin Y assay
Freshly isolated crypts were obtained from Lgr5-EGFP-IRES-creERT2 mice crossed with URI lox mouse and dissociated through enzymatic digestion as described above. Cells were incubated in DMEM/F12 (D8437; Sigma-Aldrich) with the DNA marker Hoechst 33342 (Ho; 5 mg/ml) for 45 min at 37°C. They were washed twice and resuspended in the RNA marker Pyronin Y (PY; 4 mg/ml) in DMEM/F12, 20 min at 37°C G0 phase (HolowPYlow) was analyzed among Lgr5 high population.
Characterization of Lgr5high ISC size
The size of Lgr5-EGFP cells from URI lox mice crossed with Lgr5-EGFP-IRES-creERT2 mice was characterized by FACS analysis (Rodgers et al., 2014). After gating GFP+ cells, cells were discriminated into GFPlow and GFPhigh populations. Calculations were done with a geometric mean (GeoMean) and confident intervals (95%) in FSC-A channel from GFPhigh cells.
Intestinal crypt microdissection and RNA extraction from paraffin-embedded tissue
Intestinal samples were deparaffinized and stained for 30 s with eosin and airdried overnight. PALM RoboSoftware was used to manually select the areas of interest as depicted in Fig. 10 C. Areas of interest were dissected by PALM MicroLaser Systems (Video 1). Around 1,000 crypts (basal and upper parts) were microdissected per mouse. RNA was isolated following the protocol described previously (Brandt et al., 2018; Chaves-Perez et al., 2019).
qRT-PCR
For qRT-PCR, total RNA was extracted from frozen small intestines, isolated crypts, or sorted cells as described previously (Chaves-Perez et al., 2019), and qRT-PCR was performed with primers described in Table S2. For low RNA yields, SuperScript VILO cDNA Synthesis Kit and Master Mix (11754050; Life Technologies/Thermo Fisher Scientific) were used.
Image analysis
5–10 images per slide were obtained. Quantification was performed either by counting the number of positive cells per crypt or villi (at least 50 crypts and 100 villi were quantified) or the percentage of the positive area using Color Deconvolution plug-in in ImageJ v1.7 software. Different macros were also developed by the authors to quantify immunofluorescence images.
Regenerative areas assessment
Regenerative areas (regenerative crypts) analysis was performed in H&E sections of indicated mice following previously described guidelines (Booth et al., 2012a; Booth et al., 2012b). Briefly, surviving and regenerative areas were defined as the ones that had 10 or more tightly packed strongly H&E-stained cells (excluding Paneth cells). Moreover, the regenerative areas were examined by a pathologist and corroborated using Ki67 immunohistochemistry to identify viable and proliferative crypts as previously shown (Brandt et al., 2018; Chaves-Perez et al., 2019; Metcalfe et al., 2014).
Statistical analysis
Statistical analyses were performed using GraphPad Prism V5.0 software. Statistical significance (*, P ≤ 0.05; **, P ≤ 0.01; ***, P ≤ 0.001; and ****, P ≤ 0.0001) between the means of a minimum of three samples was determined using unpaired two-tailed Student’s t test, linear regression analysis, or one-way ANOVA (Tukey’s multiple comparison test). Mantel–Cox test was used to analyze Kaplan–Meier survival of mice. Pearson correlation was used to analyze the correlation between URI and R-spondin 1 levels. Results are expressed as the mean value ± SEM. WB is representative of at least three independent experiments. IF, H&E, stainings, and IHC are representative of at least three independent mice. Quantification of IF, H&E, stainings. and IHC is performed for over 50 crypts or 100 villi per mouse in at least three independent mice. In the case of experiments in vitro, at least three independent experiments are performed and quantified. For the in vivo experiments, at least three mice per group are used.
Online supplemental material
Fig. S1 describes the phenotypic alteration of TA cells as well as the number of Lgr5high ISCs in URI(Δ/Δ)Int-Lgr5-EGFP mice. Fig. S2 depicts Wnt3a levels upon URI depletion, R-spondin 1 expression in the bottom part of the crypt as well as the validation of the R-spondin 1 antibody specificity. Fig S3 shows the proliferative and differentiation status of Lgr5low TA cells as well as their labeling and tracking upon homeostasis and URI deletion. Fig. S4 reveals the levels of apoptosis and pyroptosis in TA cells from URI(Δ/Δ)Int mice. Fig. S5 determines the levels of DNA damage, R-spondins, and intestinal damage upon c-MYC inhibition. Table S1 lists the primers used for genotyping. Table S2 lists the primers used for qRT-PCR. Video 1 shows the imaging of intestinal crypt microdissection.
Data availability
Further information and requests for resources and reagents should be directed to and will be fulfilled by the lead contact, Nabil Djouder ([email protected]).
Acknowledgments
We are very thankful to Dr. Mathias W. Hornef (Institute of Medical Microbiology, Medical School, RWTH Aachen University, Aachen, Germany) for sending us IL-13–treated mouse samples. We are grateful to all the mouse providers as described in Materials and methods. We also thank the CNIO Mouse Genome Editing Core Unit and Animal Facility for some technical support.
This work was funded by grants to N. Djouder supported by the State Research Agency (10.13039/501100011033) from the Spanish Ministry of Science and Innovation (projects SAF2016-76598-R, SAF2017-92733-EXP, RTI2018-094834-B-I00, and RED2018-102723-T), co-funded by European Regional Development Fund and by the Asociación Española Contra el Cáncer (projects PRYGN211184DJOU and PRDMA21370SANT). K. Santos-de-Frutos and S. de la Rosa are respectively supported by fellowships from the Asociación Española Contra el Cáncer (Madrid) and Comunidad de Madrid. This work was developed at the CNIO funded by the Health Institute Carlos III (ISCIII) and the Spanish Ministry of Science and Innovation.
Author contributions: A. Chaves-Pérez designed and performed most of the experiments. K. Santos-de-Frutos designed and executed experiments, and also revised the manuscript. S. de la Rosa analyzed and characterized the status of Lgr5high ISCs. I. Herranz-Montoya maintained some mouse lines. C. Perna performed all histopathological analyses of murine tissues. All authors analyzed the data. N. Djouder conceived the project, designed experiments, and wrote the manuscript together with A. Chaves-Pérez and K. Santos-de-Frutos N. Djouder secured all funding.

