Skip to article sections

Aberrant activation of dendritic cells (DCs) is intricately associated with inflammatory diseases, rendering DCs an appealing therapeutic target. Metabolites are emerging as crucial regulators of DCs, yet therapeutic strategies targeting DC metabolism for inflammatory diseases remain underexplored. Our study identifies the Vanin-pantethine-cholesterol axis as a key metabolic pathway that governs DC activation—a classical APC function. We found that Vanin is upregulated in activated DCs from autoimmune patients and mice; DC-specific Vanin deficiency significantly alleviates psoriasiform inflammation in mice. Mechanistically, Vanin hydrolyzes pantethine, leading to cholesterol and lipid raft accumulation on the cell membrane and promoting DC hyperactivation. Pantethine supplementation or pharmacologically induced Vanin inhibition reduces cholesterol overload, impedes DC activation, and mitigates psoriasiform inflammation. Notably, pantethine or RR6 treatment impairs activation of patient-derived DCs, and our investigator-initiated trial shows that pantethine combination therapy relieves clinical symptoms in psoriasis patients. Collectively, these findings establish the Vanin-pantethine-cholesterol axis as a key modulator of APC function, offering a promising metabolic approach for inflammatory diseases.

By serving as the professional APCs, dendritic cells (DCs) play vital roles in bridging innate and adaptive immunity to enhance host immune defenses and sustain immune tolerance (Liu et al., 2021). Upon antigen stimulation or exposure to danger signals (such as TLR signaling), DCs undergo maturation and activation by upregulating costimulatory factors (such as CD80, CD86, and MHC molecules), leading to antigen presentation and cytokine secretion. Activated DCs then initiate T cell priming and activate other immune cells (Reis e Sousa, 2006). Aberrant activation of DCs disrupts immune homeostasis, which contributes to the development of various autoimmune disorders (Ganguly et al., 2013). Thus, DCs are promising therapeutic targets for management of human autoimmune diseases (AIDs). However, the precise regulatory mechanisms governing DC activation have not been fully defined.

Evidence suggests that DC function in autoimmune disorders can be regulated by specific molecules in distinct contexts. For instance, depletion of Optn in mice by Cd11cCre impairs DC maturation and prevents the development of autoimmunity in mice (Wang et al., 2021). BAT3 has also been reported as an adaptor protein regulating DC-mediated tolerance in AIDs and cancer (Tang et al., 2022). Recently, endogenous metabolites produced by host cells have drawn increasing attention due to their crucial roles in immune regulation. Several metabolic pathways, including glycolysis, amino acid metabolism, and fatty acid metabolism, have been shown to orchestrate DC activation (Kelly and O’Neill, 2015; Lou et al., 2020; Pearce and Everts, 2015). Glutamine acquisition and signaling in cDC1s (conventional dendritic cell 1) are limiting events for DC activation and putative targets for cancer treatment (Guo et al., 2023). Despite the emerging roles of intracellular metabolites in modulating DC activation, metabolic pathways involved in DC regulation and the feasibility of utilizing these metabolic factors to develop novel therapeutic strategies for DC-related autoimmune disorders are still elusive.

The Vanin enzyme family comprises a series of proteins encoded by the VNN genes, catalyzing the hydrolysis of pantetheine into pantothenate (vitamin B5) and cysteamine (Schalkwijk and Jansen, 2014). In the murine model, two main Vanin isoforms, namely Vanin-1 (Vnn1) and Vnn3, have been identified. In the human context, three isoforms (VNN1, VNN2, and VNN3) have been recognized (van Diepen et al., 2016). Previous investigations have proposed that the dysregulation of Vanin enzymes may be linked to a spectrum of pathological conditions, including cancer (Huang et al., 2010), inflammation (Min-Oo et al., 2007), and immunodeficiency diseases (Kaskow et al., 2012). Until now, immunological research on Vanin enzymes predominantly focuses on the VNN1 isoform, which has emerged as a promising diagnostic biomarker for sepsis and plays a pivotal role in characterizing immune infiltration and prognostic prediction across diverse tumor types (Guan et al., 2023). In colitis models, VNN1 exacerbates epithelial inflammation by antagonizing PPARγ signaling (Berruyer et al., 2006). Currently, the exact regulatory mechanisms of Vanin enzymes in specific immune cells, along with the correlation between Vanin function and its associated metabolites in autoimmune regulation, remain largely unclear.

Pantethine is a naturally generated low-molecular-weight thiol, which is considered a major precursor for Coenzyme A (CoA) (Yu et al., 2022). Intracellular pantethine can either be non-enzymatically converted to pantetheine or hydrolyzed by Vanin to generate pantothenate (Kaskow et al., 2012; Yu et al., 2022). Both pantetheine and pantothenate are eventually catalyzed into CoA via a cascade of reactions. By serving as a precursor of CoA, pantethine has been shown to impede the onset of the neurodegeneration phenotype and protect mice from malaria-associated cerebral syndrome (Brunetti et al., 2014; Penet et al., 2008; Rana et al., 2010; Siudeja et al., 2011; Zizioli et al., 2016). Moreover, pantethine was reported to exhibit antitumor effects in the cases of sarcoma and ovarian cancer (Millet et al., 2023; Penet et al., 2016). Beyond its role as a metabolic derivative, pantethine itself serves as an excellent hypolipidemic agent with minimal side effects. It has been commercially available as a health product for years, with claims of improving blood lipid profiles and lowering cholesterol levels (Donati et al., 1986). The primary mechanism by which pantethine reduces cholesterol concentration is mainly attributed to its inhibition of the activity of 3-hydroxy-3-methylglutaryl CoA (HMG-CoA) reductase, the rate-limiting enzyme for cholesterol synthesis (Cighetti et al., 1988). Studies have demonstrated that oral intake of pantethine exerts beneficial effects on lipid risk factors in individuals with hypercholesterolemia, arteriosclerosis, and diabetes (Arsenio et al., 1984). In addition, pantethine has also been investigated for its potential in controlling SARS-CoV-2 infection by reducing total cholesterol (TC) levels and inhibiting fatty acid synthesis (Abou-Hamdan et al., 2023). Animal research has shown that pantethine effectively alleviates allergic reactions. This is substantiated by a notable reduction in the infiltration of inflammatory cells, a decline in the levels of Th2 cytokines in the lungs, and a decrease in circulating LACK-specific IgE (Abou-Hamdan et al., 2017). These findings suggest that pantethine might assume a crucial role in the regulation of the immune system. However, the involvement of pantethine or its metabolic pathways in modulating DC function or in the context of DC-related AIDs remains poorly understood.

In the present study, we demonstrate that the Vanin-pantethine metabolic axis plays a crucial role in shaping DC function and influencing the progression of AIDs. We find that Vanin enzymes are implicated in facilitating excessive DC activation in autoimmune disorders, a process closely associated with the hydrolysis of the metabolite pantethine. Specific deletion of Vnn3 or pharmacological targeting of Vanin, which effectively promotes pantethine accumulation, markedly impairs DC activation and ameliorates psoriasis-like inflammation in the imiquimod (IMQ) mouse model. In DCs from patients with systemic lupus erythematosus (SLE) and psoriasis, treatment with pantethine or the Vanin inhibitor RR6 strongly reduced their activation. Importantly, our clinical trial revealed that pantethine combination therapy significantly decelerates the progression of psoriasis in patients. Thus, these findings unveil a previously unrecognized role of the Vanin-pantethine metabolic axis in modulating DC activation during autoimmunity and offer a potentially viable metabolic strategy for DC-centered intervention in AIDs.

Upregulation of Vanins is highly associated with DC activation in AIDs

To pinpoint the pivotal metabolic enzyme genes implicated in the regulation of AIDs, we conducted an in-depth analysis of the transcriptomic data (retrieved from the Interactive Analysis and Atlas for Autoimmune Diseases [IAAA] database) of peripheral blood mononuclear cells (PBMCs) from patients with diverse AIDs. Through the analysis of differentially expressed genes (DEGs), we discovered that members of the Vanin gene family (VNN1, VNN2, and VNN3) were significantly upregulated across multiple patient cohorts with various AIDs (Fig. 1 A). To further investigate the expression of metabolic enzyme genes in DCs obtained from AIDs patients, we scrutinized the myeloid DC (mDC) transcriptomic data from multiple AIDs using the National Bioscience Database Center (NBDC) Human Database (accession code: hum0214.v3, https://humandbs.dbcls.jp/en/research/hum0214/v3). The DEGs analysis identified 11 potential genes that were simultaneously upregulated in mDCs across all eight types of AIDs datasets (Fig. S1 A). Among these candidate genes, VNN1 and VNN2 showed consistent elevation across different disease cohorts (Fig. S1 B). Moreover, we analyzed publicly available transcriptomic data (GSE149050) from mDCs isolated from another cohort of patients with SLE and healthy controls. Among the 28 DEGs related to vitamin metabolism, VNN1 and VNN2 were among the most prominently upregulated genes in mDCs from SLE patients when compared with healthy individuals (Fig. 1 B). These observations prompted us to further explore the expression of Vanin genes in other types of DC-related AIDs. By leveraging the GSE54456 dataset, we carried out a transcriptomic analysis of skin biopsies from 92 psoriasis patients and 82 healthy donors. In line with our previous findings, VNN1 and VNN3 were identified as part of the most significantly upregulated metabolic enzyme genes in psoriasis skin samples (Fig. S1, C–E). To assess whether VNN1 and VNN3 are functionally associated with activated DCs in psoriasis, we employed well-established gene sets that serve as hallmarks of activated DCs and evaluated the expression of Vanin genes alongside these marker transcripts of activated DCs (Collin and Bigley, 2018; Joosten et al., 2016; Wculek et al., 2020). Intriguingly, we found that Vanin genes (VNN1 and VNN3) exhibited a strong positive correlation with the activated DC signature (Fig. 1 C and Fig. S1 F). Moreover, we investigated the relationship between the expression of VNN1 or VNN3 and immune cell infiltration in psoriatic skin. The data demonstrated a strong correlation between a higher proportion of activated DCs and increased levels of VNN1 or VNN3 in patient samples, as assessed by immune cell infiltration analysis using CIBERSORT (Fig. S1, G and H). In addition, CIBERSORT analysis revealed that samples with higher infiltration of activated DCs also exhibited significantly increased VNN3 expression (Fig. 1 D). These findings collectively suggest a potential role of Vanin enzymes in promoting DC hyperactivation in the context of AIDs.

To directly investigate whether Vanin family genes were upregulated during DC activation, we isolated primary bone marrow–derived DCs (BMDCs) from mice and stimulated them with TLR agonist LPS. Total RNA was extracted and subjected to transcriptomic sequencing (Fig. S1 I). We next performed Kyoto Encyclopedia of Genes and Genomes (KEGG) enrichment analysis, specifically focusing on vitamin and cofactor metabolic pathways. The results clearly indicated that the pantothenate and CoA metabolism pathway, a sub-pathway of vitamin metabolism involving the Vanin enzyme (Lu et al., 2021), was significantly enriched during BMDC activation (Fig. 1 E). Moreover, we comprehensively analyzed the expression profiles of all genes within the vitamin and cofactor metabolic pathways in activated BMDCs. Through visualization using volcano plots and heatmaps, we observed that Vnn3 was notably upregulated after LPS stimulation (Fig. 1 F and Fig. S1 J). In contrast, the expression of Vnn1 in BMDCs remained relatively low and did not exhibit any significant change upon LPS stimulation (Fig. S1 K). These findings strongly suggest that Vnn3 is the predominant isoform upregulated during BMDC activation. We further examined transcriptomic data (GSE2706) from human monocyte-derived dendritic cells (moDCs) stimulated with Resiquimod (R848), a potent TLR7/8 agonist known to trigger DC activation, and found that all Vanin family members (VNN1, VNN2, and VNN3) were significantly upregulated in activated moDCs (Fig. 1 G and Fig. S1 L). Taken together, these transcriptomic data clearly demonstrate the upregulation of Vanin family genes in activated DCs in vitro and in vivo, indicating the possible role of the Vanin metabolic enzyme and its associated metabolic pathways in driving DC activation and DC-related immune dysregulation.

Vanins contribute to DC activation and its associated T cell priming

Building on our findings that Vanin metabolic enzyme genes are significantly upregulated in DCs from AIDs patients and in vitro activated DCs, we first validated Vanin family expression during DC activation. qPCR analysis revealed that in R848-stimulated human moDCs, all three VNN family members (VNN1, VNN2, and VNN3) were markedly upregulated (Fig. 2 A), consistent with our RNA sequencing (RNA-seq) data. To determine whether these three VNN members play redundant, compensatory, or independent roles in regulating human DC activation, we performed siRNA-mediated knockdown of each VNN gene individually and in combination (Fig. S2 A). Upon R848 stimulation, individual knockdown of VNN1, VNN2, or VNN3 each resulted in partial but consistent attenuation of DC activation, as evidenced by reduced surface CD80 and HLA-A,B,C expression. Notably, simultaneous knockdown of all three VNN family members produced a stronger inhibitory effect than knockdown of any single gene (Fig. 2 B), suggesting that pan-VNN inhibition may represent a more effective strategy for modulating human DC activation.

We next examined these findings in a murine system. We observed that Vnn3 expression was markedly upregulated in LPS-stimulated mouse BMDCs (Fig. 2 C). Silencing Vnn3 in BMDCs (siVnn3) (Fig. S2 B) substantially reduced LPS-induced upregulation of CD80, CD86, MHC-I, and MHC-II (Fig. S2 C). We also adopted the Eα-GFP/YAe system, a well-established approach for evaluating in vitro antigen uptake and presentation by BMDCs (Benson et al., 2015; Hepworth et al., 2013), to explore the impact of Vnn3 on BMDCs’ antigen uptake and presentation. Flow cytometric analysis demonstrated that Vnn3-silenced BMDCs exhibited significantly decreased antigen uptake and presentation, as evidenced by a lower proportion of GFP+Eα: I-Ab+ cells (Fig. S2 D). Moreover, we used the in vitro T cell priming system (Good et al., 2019; Wang et al., 2021; Yuan et al., 2022) to comprehensively assess the functional consequences of Vnn3 knockdown. Specifically, OT-II CD4+T cells were co-cultured with BMDCs that had been pulsed with the peptide (OVA323–339). The capacity of BMDCs to activate T cells was evaluated by measuring T cell proliferation and the secretion of cytokines, including IFN-γ, IL-17, and IL-4. Our findings revealed that Vnn3 silencing significantly impaired T cell proliferation and cytokine secretion (Fig. S2 E), indicating that Vnn3 is required for optimal DC-mediated T cell activation.

To further confirm these findings, we generated Vnn3 KO mice (Fig. S2 F). The efficacy of gene KO was thoroughly verified by qPCR (Fig. S2 G). BMDCs isolated from Vnn3-deficient mice were subsequently subjected to functional characterization. Compared with WT BMDCs, Vnn3-deficient BMDCs exhibited markedly impaired antigen presentation (Fig. 2 D), reduced maturation and activation, as evidenced by decreased expression of co-stimulatory molecules (Fig. 2 E and Fig. S2 H), and diminished T cell priming capacity (Fig. 2, F–I; and Fig. S2 I). These findings demonstrate that Vnn3 is required for optimal DC activation.

Having established that Vnn3 deficiency impairs DC activation, we next asked whether this reflected a general suppression of DC function or a shift toward a tolerogenic phenotype. Our results showed that Vnn3-deficient BMDCs did not increase CD25+Foxp3+ regulatory T cell (Treg) induction in co-culture assays (Fig. S2 J). Cytokine profiling further revealed that Vnn3-deficient BMDCs produced significantly lower levels of pro-inflammatory cytokines (IL-6, IL-1β, TNF-α, and IL-12), while the anti-inflammatory cytokine IL-10 and the immunosuppressive molecule PD-L1 (CD274) were not elevated (Fig. S2 K). Collectively, these data indicate that Vnn3 deficiency broadly attenuates DC activation without promoting a tolerogenic program.

Loss of Vnn3 in DCs alleviates IMQ-induced psoriatic inflammation

Aberrant activation of DCs is a major event contributing to the development of various AIDs (Ganguly et al., 2013), such as psoriasis (Greb et al., 2016; Griffiths et al., 2021). To elucidate the role of Vanin in regulating DC activation and autoimmunity in vivo, we utilized an IMQ-induced psoriasis mouse model. In this experimental context, we employed an adoptive transfer approach in CD11c-diphtheria toxin (DT) receptor (DTR) transgenic mice, which express DTR under the control of the CD11c promoter. Specifically, DT was administered to selectively deplete CD11c+ cells 1 day before the initiation of IMQ treatment and on the second day after the start of IMQ treatment. Concurrently, at these same time points, BMDCs isolated from either Vnn3+/+ or Vnn3−/− mice were adoptively transferred into recipient mice via tail vein injection (Fig. 3 A). Phenotypic analysis revealed that compared with the control group, mice receiving Vnn3−/− BMDCs exhibited markedly alleviated skin psoriasis-like symptoms (Fig. 3 B), reduced skin thickness (Fig. S2 L), less weight loss (Fig. S2 M), and lower psoriasis area and severity index (PASI) scores (Fig. 3 C). Histological examination showed that epidermal hyperplasia and dermal/subcutaneous inflammatory cell infiltration were significantly attenuated in the group that received Vnn3−/− BMDC transfers (Fig. S2 N). Consistently, splenomegaly was also alleviated in these mice, as evidenced by reduced spleen size, weight, and spleen index (Fig. S2 O). Moreover, mice receiving Vnn3−/− BMDCs displayed markedly suppressed inflammatory status in the skin, as demonstrated by decreased mRNA levels of multiple pro-inflammatory cytokines closely associated with the pathogenesis of psoriasis, including Ifng, Tnf, Il23, Il22, Il17a, and Il17f (Fig. S2 P). Flow cytometry analyses revealed that the frequency of DC infiltration in both the skin tissues and draining LNs (DLNs) was significantly lower in mice that received Vnn3−/− BMDC transfer (Fig. 3 D and Fig. S2 Q). Additionally, expression levels of DC maturation markers (CD80, CD86, MHC I, and MHC II) in skin and DLNs were also notably decreased (Fig. 3 E). Concurrently, a corresponding decline in CD4+ T cell infiltration was detected in the skin tissue of mice that had been administered Vnn3−/− BMDC transfer (Fig. 3 F). Collectively, these findings indicate that the deficiency of Vnn3 in BMDCs curtails DC activation and T cell recruitment, thereby downregulating local inflammation and alleviating IMQ-induced psoriasis-like dermatitis.

To more directly evaluate the intrinsic role of Vnn3 in DC regulation in vivo, we generated a DC-specific Vnn3 KO mouse model (Vnn3fl/flCd11cCre) (Fig. S2 R). Conditional KO of Vnn3 was validated by qPCR, which confirmed its selective deletion in BMDCs (Fig. S2 S). Subsequently, Vnn3fl/fl mice and Vnn3fl/flCd11cCre mice were subjected to 6 consecutive days of IMQ treatment on the dorsal skin. In line with our previous findings, Vnn3fl/flCd11cCre mice displayed significantly attenuated psoriasis-like symptoms. These manifestations included a reduction in the severity of skin lesions (Fig. 3 G), a decrease in skin thickness (Fig. 3 H), less weight loss (Fig. S2 T), a lower PASI score (Fig. 3 I), and fewer histological signs of epidermal thickening and inflammatory infiltration (Fig. 3 J). Moreover, splenomegaly and spleen index were also significantly alleviated (Fig. S2 U). PCR analysis revealed that the levels of psoriasis-related inflammatory cytokines were significantly downregulated in Vnn3fl/flCd11cCre mice when compared with the control group (Fig. 3 K). In both DLNs and skin tissues from Vnn3fl/flCd11cCre mice, we observed decreased DC infiltration and activation (Fig. 3, L and M; and Fig. S2 V), as well as reduced CD4+ T cell infiltration (Fig. 3 N). Together, these results demonstrate that DC-specific deletion of Vnn3 exerts a profound impact on modulating systemic immune responses and effectively alleviates psoriatic inflammation in vivo.

To determine whether the reduced DC accumulation observed in Vnn3-deficient mice during IMQ-induced inflammation arises from intrinsic defects in DC development, survival, or homeostasis, we comprehensively characterized the steady-state DC compartment and assessed DC survival, migratory potential, and cellular fitness. In the spleen of untreated mice, the frequencies of total live DCs, apoptotic DCs, and major DC subsets—including plasmacytoid DCs (pDCs), cDC1, and cDC2—were comparable between Vnn3 cKO and control mice (Fig. S2 W). Similarly, in resting DLNs, no significant differences were observed in the frequencies of live DCs, apoptotic DCs, or the proportions of pDCs, resident cDCs, and migratory cDCs between genotypes (Fig. S2 X). In the skin, the frequencies of live DCs and apoptotic DCs were also comparable between the two groups (Fig. S2 Y). Moreover, the percentage of CCR7+ DCs in spleen, DLNs, and skin was indistinguishable between control and cKO mice (Fig. S2, W–Y). To complement these in vivo findings, we generated BMDCs in vitro. Consistently, Vnn3-deficient BMDCs showed no significant differences in apoptotic fractions or CCR7 expression compared with WT controls, and intracellular ROS levels, measured as an indicator of oxidative stress, were also comparable between genotypes (Fig. S2 Z). Collectively, these results demonstrate that DC-specific deletion of Vnn3 does not perturb steady-state DC development, homeostasis, survival, migratory capacity, or cellular fitness, indicating that the reduced DC accumulation observed during inflammation is unlikely to arise from pre-existing homeostatic defects.

Vanin-associated pantethine significantly suppresses DC activation and ameliorates IMQ-induced psoriasis in mice

Given that Vanin, a metabolic enzyme, hydrolyzes pantetheine to yield pantothenate and cysteamine (Fig. 4 A), we postulated that its upstream or downstream metabolites may be the crucial factors mediating Vanin’s regulatory effects on DC function. To validate this hypothesis, we first employed liquid chromatography–mass spectrometry (LC-MS) for targeted analysis of Vanin-associated metabolites. Previous studies have indicated that cysteamine levels do not exhibit significant alterations in the plasma of psoriasis patients or in the IMQ-induced mouse psoriasis model (Chen et al., 2021), we centered our analysis on pantethine and pantothenate. The results showed that LPS stimulation led to a significant reduction in pantethine levels, which was correlated with upregulation of Vanin gene expression. In contrast, pantothenate levels remained relatively stable (Fig. S3 A). Subsequently, we analyzed the metabolite levels in Vnn3−/− mice and found that Vnn3 deficiency led to a substantial accumulation of pantethine in both BMDCs and plasma, without affecting pantothenate levels (Fig. 4, B and C). A comparable phenomenon was also observed in BMDCs from Vnn3fl/flCd11cCre mice, where pantethine levels were significantly elevated (Fig. S3 B). The unaltered levels of pantothenate may be attributed to other metabolic regulation except for hydrolysis from pantetheine. These results imply that Vanin regulates DC function and its associated AID progression, probably through the regulation of pantethine levels.

To further verify whether pantethine deregulation is responsible for driving Vanin-mediated DC hyperactivation, we pre-treated BMDCs with pantethine in vitro. LC-MS analysis unequivocally confirmed a significant increase in pantethine levels within treated BMDCs (Fig. S3 C). We then employed the EαYAe antigen-presentation model to examine the impact of pantethine on DC function. The results demonstrated that pantethine treatment notably suppressed the antigen-presenting capacity of BMDCs (Fig. 4 D). In addition, the expression levels of DC co-stimulatory factors, including CD80, CD86, MHC I, and MHC II, were significantly decreased by pantethine supplementation (Fig. 4 E). In line with these findings, pantethine-treated BMDCs demonstrated a markedly reduced capacity to activate CD4+ T cells, as indicated by decreased T cell proliferation (Fig. 4 F) and lower cytokine production levels (Fig. 4 G and Fig. S3 D). Furthermore, we detected the effects of pantethine on human-derived DCs. MoDCs and mDCs were obtained from PBMCs of healthy donors. After pre-treating these cells with or without pantethine, flow cytometry analysis was conducted, and the results showed that pantethine administration significantly inhibited the expression of co-stimulatory markers (HLA-A,B,C, HLA-DR, CD80, and CD86) in both moDCs and mDCs (Fig. 4 H and Fig. S3 E).

We next explored the influence of pantethine on the IMQ-induced psoriasis mouse model (Fig. S3 F). Phenotypic assessment of the mice illustrated that pantethine treatment led to a remarkable alleviation of the psoriasis-like symptoms, including the attenuated severity of skin lesions (Fig. 4 I), reduced skin thickness (Fig. S3 G), less weight loss (Fig. S3 H), lower PASI scores (Fig. 4 J), and diminished epidermal hyperplasia and spongiotic changes as evident from HE-stained skin sections (Fig. S3 I). Additionally, pantethine treatment ameliorated spleen enlargement in the psoriasis-afflicted mice (Fig. S3 J), along with a decrease in spleen weight and index (Fig. S3 K). We also examined the psoriatic inflammation in the skin of psoriasis mice and found that pantethine significantly downregulated the expression levels of multiple inflammatory cytokines (Fig. S3 L). Flow cytometry analysis of the DLN and skin tissue of the mice showed that pantethine treatment reduced the infiltration of DCs (Fig. 4, K and L) and the expression of their co-stimulatory markers (Fig. 4 M). Moreover, pantethine administration strongly decreased the infiltration of CD4+ T cells in the skin tissue (Fig. 4 N). Indeed, we observed that pantethine treatment via i.p. injection led to a significant increase in pantethine levels in plasma (Fig. S3 M). Consistent with our previous findings, the expression of Vnn3 was significantly upregulated in the skin of mice with IMQ-induced psoriasis (Fig. S3 N). Concomitantly, the plasma levels of pantethine in the IMQ model mice were significantly lower compared with those in the control group, while the levels of pantothenate remained unaffected (Fig. S3 O). These results strongly indicate that pantethine administration can effectively alleviate the psoriasis-like phenotype in vivo, and the insufficient pantethine levels may be the crucial contributor to hyperactivation of DCs and the subsequent autoimmune inflammation induced by the upregulation of Vanin.

To determine whether the in vivo anti-inflammatory effects of pantethine are mediated through DC-intrinsic mechanisms or secondary to its systemic lipid-lowering activity, we performed DC depletion and adoptive transfer experiments. This approach allowed us to selectively evaluate the cell-autonomous function of pantethine-treated DCs, while excluding potential confounding effects arising from systemic metabolic alterations. We utilized CD11c-DTR mice for selective endogenous DC ablation via DT injection. After DC depletion, we adoptively transferred BMDCs pre-treated with either vehicle or pantethine before inducing IMQ-mediated psoriasiform inflammation (Fig. S3 P). Compared with recipients receiving vehicle-treated BMDCs, mice transferred with pantethine-pre-treated DCs displayed markedly attenuated psoriasiform pathology, accompanied by reduced DC infiltration and activation in both skin and DLNs (Fig. S3, Q–U). In addition, spleen weight and spleen index were significantly reduced in the pantethine-DC transfer group (Fig. S3, V and W). Collectively, these results demonstrate that pantethine, a key downstream metabolite of Vanin, directly suppresses DC activation and alleviates psoriasiform inflammation through DC-intrinsic mechanisms.

Pantethine inhibits DC activation by reducing cholesterol generation and lipid raft formation

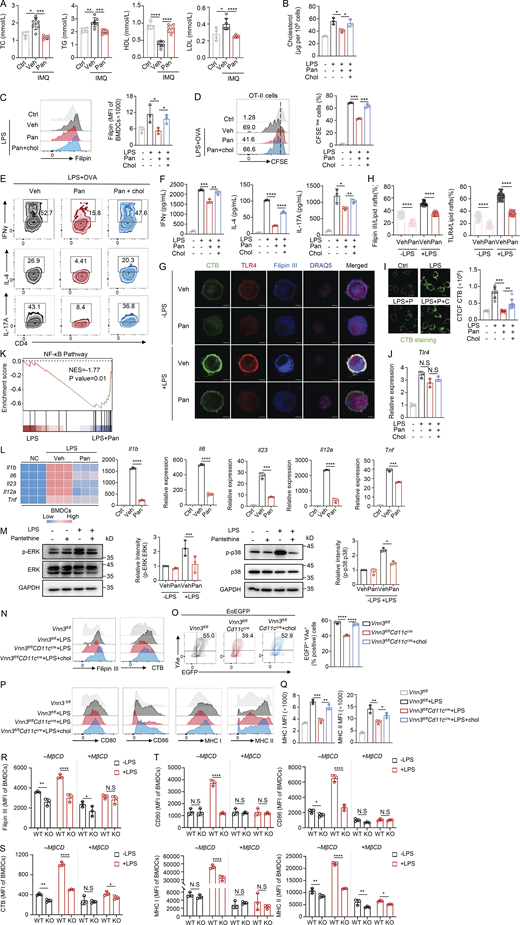
We next explored the mechanism by which pantethine suppresses DC activation. Pantethine is known to reduce cholesterol levels by inhibiting HMG-CoA reductase, a rate-limiting enzyme in the mevalonate (MVA) pathway (McCarty, 2001) (Fig. 5 A). Gene set enrichment analysis (GSEA) of a publicly available dataset showed that the cholesterol biosynthesis pathway was significantly upregulated in psoriatic skin samples with high VNN3 expression (Fig. 5 B). Given this property and the established link between cellular cholesterol levels and DC activation (Bonacina et al., 2018; Zhao et al., 2022), we hypothesized that pantethine might impede DC activation by reducing cholesterol concentration. To test this possibility, we first examined cholesterol levels in pantethine-treated BMDCs. Filipin III staining and biochemical measurements showed that pantethine significantly reduced free cholesterol levels (Fig. 5, C and D). Psoriasis has been reported to be intricately associated with abnormal lipid metabolism (Elmets et al., 2019). Specifically, patients with psoriasis exhibit elevated levels of low-density lipoprotein (LDL), triglycerides (TGs), and TC, along with lower levels of high-density lipoprotein (HDL) compared with healthy groups (Nemati et al., 2013). Consistently, similar alterations in plasma lipid parameters were observed in the IMQ mouse model. Notably, pantethine treatment strongly reduced TC, TG, and LDL but increased HDL levels in the plasma (Fig. 5 E and Fig. S4 A). To ascertain whether pantethine suppresses DC function by curbing intracellular cholesterol synthesis, we supplemented pantethine-treated BMDCs with exogenous cholesterol. The results showed that cholesterol supplementation effectively restored the intracellular cholesterol levels that had been reduced by pantethine treatment (Fig. S4, B and C). Importantly, exogenous cholesterol addition significantly counteracted the pantethine-mediated suppression of BMDC activation, including antigen presentation capacity, maturation, and T cell priming ability (Fig. 5, F–H; and Fig. S4, D–F). These findings strongly support our hypothesis that Vnn3 facilitates DC activation and exacerbates psoriasis by enhancing pantethine consumption and driving cholesterol accumulation.

Previous studies have shown that excessive cholesterol accumulation can lead to the overactivation of immune cells by causing lipid raft overload (Anderson et al., 2000; Bonacina et al., 2018). We therefore hypothesized that pantethine-mediated cholesterol reduction may impair lipid raft integrity, thereby disrupting the membrane localization of key signaling molecules and ultimately suppressing DC activation. To test this hypothesis, BMDCs were co-stained with Filipin III to visualize membrane cholesterol, cholera toxin subunit B (CTB) to label lipid rafts, and TLR4, a key receptor whose localization within lipid rafts is required for efficient signal transduction during DC activation (Płóciennikowska et al., 2015). We then performed quantitative co-localization analysis to determine the spatial relationship among membrane cholesterol, lipid rafts, and TLR4. Pantethine treatment markedly reduced the membrane abundance of both cholesterol and lipid rafts, as reflected by the significantly decreased Filipin III– and CTB-positive signals (Fig. S4 G). More importantly, co-localization analysis demonstrated that pantethine-induced cholesterol depletion disrupted lipid raft organization and markedly reduced the enrichment of TLR4 within lipid rafts (Fig. S4 H). These findings provide direct evidence that pantethine decreases membrane cholesterol availability, leading to disruption of lipid raft architecture and impaired membrane localization of TLR4. Importantly, the pantethine-induced reduction in CTB-positive lipid rafts and membrane-associated TLR4 was markedly restored following supplementation with exogenous cholesterol (Fig. 5, I and J; and Fig. S4 I), while TLR4 mRNA expression remained unchanged (Fig. S4 J), indicating that the inhibitory effect of pantethine on lipid raft integrity and TLR4 membrane localization is cholesterol-dependent.

To determine whether the reduced TLR4 membrane localization affects downstream signaling, we evaluated TLR4-dependent NF-κB and MAPK pathway activation. GSEA of LPS-stimulated BMDCs revealed significant negative enrichment of the NF-κB pathway in pantethine-treated cells (Fig. S4 K), which was validated by qPCR showing reduced expression of NF-κB target genes, including Il1b, Il6, Il23, Il12a, and Tnf (Fig. S4 L), confirming that pantethine suppresses NF-κB-dependent transcriptional activation. Additionally, pantethine attenuated LPS-induced phosphorylation of ERK and p38 (Fig. S4 M), indicating suppression of the MAPK cascade. Collectively, these data confirm that pantethine restrains both NF-κB and MAPK signaling downstream of TLR4, supporting our model that cholesterol reduction and lipid raft disruption impair TLR4 signal transduction and dampen pro-inflammatory DC activation.

We next investigated the physiological correlation between the Vanin-pantethine axis and cholesterol by detecting whether Vanin deletion would lead to a reduction in cholesterol and lipid raft content within BMDCs. As expected, BMDCs from Vnn3fl/flCd11cCre mice exhibited a significant decline in cholesterol and lipid raft levels, which were restored by exogenous cholesterol supplementation (Fig. 5, K and L; and Fig. S4 N). Consistently, Vnn3-deficient BMDCs showed impaired maturation and antigen presentation; cholesterol replenishment also reversed these effects (Fig. 5 M and Fig. S4, O–Q). Thus, both exogenous pantethine treatment and endogenous pantethine accumulation due to Vnn3 deficiency converge to reduce cholesterol and lipid rafts in DCs, thereby inhibiting their activation.

To directly test whether intact lipid raft formation is required for Vanin-dependent DC activation, we used methyl-β-cyclodextrin (MβCD) to deplete membrane cholesterol. Membrane cholesterol and lipid raft abundance, along with surface CD80, CD86, MHC-I, and MHC-II expression, were assessed as functional readouts. In control BMDCs, LPS stimulation markedly increased Filipin III and CTB signals in WT cells, whereas these responses were substantially reduced in Vnn3-KO BMDCs (Fig. S4, R–S). Concordantly, LPS-induced upregulation of CD80, CD86, MHC-I, and MHC-II was similarly suppressed in Vnn3-KO cells. Notably, MβCD pre-treatment largely abolished these differences between WT and Vnn3-KO cells (Fig. S4 T). These genetic and pharmacological data establish that Vanin facilitates DC activation through cholesterol-dependent lipid raft assembly and that intact lipid raft organization is required for this effect. Together, these data identify cholesterol-dependent lipid raft remodeling as the mechanistic link between the Vanin-pantethine axis and DC activation, whereby pantethine suppresses DC function by limiting membrane cholesterol availability and lipid raft formation.

Pharmacologically targeting Vanin impairs DC immune activation and attenuates psoriasis in a mouse model

To further corroborate the role of Vanin on DC-mediated immune activation, we utilized RR6, a well-established competitive inhibitor of mammalian Vanin (Jansen et al., 2013), for subsequent investigation (Fig. 6 A). LC-MS analysis revealed that RR6-treated BMDCs exhibited elevated pantethine levels (Fig. 6 B). Functionally, RR6 treatment impaired antigen presentation (Fig. 6 C) and T cell activation (Fig. 6, D and E). Similarly, treatment with RR6 reduced the LPS-induced expression of costimulatory factors in primary human moDCs (Fig. 6 F and Fig. S5 A). Consistently, RR6 decreased cholesterol and lipid raft content, effects that were reversed by exogenous cholesterol supplementation (Fig. 6 G and Fig. S5 B). Notably, cholesterol addition also reversed the impaired capacity of BMDCs and the subsequent reduction in T cell activation caused by RR6 treatment (Fig. 6 H and Fig. S5, C–E). These findings suggest Vanin inhibitor RR6 promotes intracellular pantethine accumulation, which in turn suppresses cholesterol synthesis and dampens DC activation.

We next evaluated the therapeutic potential of RR6 in alleviating AIDs in vivo using an IMQ-induced psoriasis mouse model (Fig. S5 F). RR6 administration increased serum pantethine levels (Fig. S5 G) and effectively protected mice from IMQ-induced psoriasis, as evidenced by reduced back skin thickness (Fig. S5 H), lower PASI score (Fig. 6, I and J), body weight loss (Fig. S5 I), attenuated epidermal hyperplasia (Fig. 6 K), and mitigated splenomegaly (Fig. S5 J). Consistently, mice treated with RR6 exhibited reduced mRNA levels of skin psoriasis-associated cytokines, including Ifng, Tnf, Il23, Il22, Il17a, and Il17f, in comparison with control mice (Fig. 6 L). Moreover, flow cytometry analysis indicated a significant reduction in the infiltration (Fig. 6, M and N; and Fig. S5 K) and maturation (Fig. 6 O) of DCs from the DLN and back skin samples from RR6-treated IMQ mice. Furthermore, CD4+ T cell infiltration in skin samples from RR6-treated mice was also decreased (Fig. S5 L). To determine whether RR6, as well as pantethine, could attenuate cholesterol generation, we measured cholesterol levels in IMQ mouse plasma. The results showed that RR6 treatment robustly decreased plasma TC, TG, and LDL-C, while increasing HDL-C levels (Fig. 6 P and Fig. S5 M). In conclusion, these data suggest that pharmacological inhibition of Vanin elevates intracellular pantethine, limits cholesterol accumulation, and thereby restrains DC activation and alleviates psoriasis inflammation in vivo.

Pantethine impedes activation of DCs from clinical patients with autoimmune disorders and alleviates disease progression

To further evaluate the translational relevance of our findings, we isolated mDCs and moDCs from 2 cohorts of autoimmune patients (psoriasis and SLE) who had not received biologic therapy and treated the cells with pantethine or RR6 prior to activation (Fig. S5 N). In both psoriasis and SLE patients, pantethine and RR6 markedly impaired the activation of moDCs and mDCs, as evidenced by the reduced expression of HLA-A,B,C, HLA-DR, CD80, and CD86 (Fig. 7, A–D; and Fig. S5, O–R). These data demonstrate that increasing pantethine levels can potently suppress abnormal DC activation in autoimmune patients, highlighting its potential as a therapeutic strategy for DC-mediated autoimmune disorders.

Clinical studies have shown that dyslipidemia and obesity are associated with increased psoriasis severity and reduced efficacy of topical, biologic, and systemic therapies (Ahlehoff et al., 2015; Bellinato et al., 2024; Pannu and Rosmarin, 2021; Puig, 2011), suggesting that improving lipid metabolic homeostasis may represent a complementary strategy for enhancing therapeutic outcomes. Given that pantethine is a clinically approved and commercially available lipid-lowering agent, and our preclinical studies demonstrated its potent therapeutic efficacy in experimental psoriasis through modulation of DC cholesterol metabolism, we next investigate the clinical relevance of these findings. Targeted metabolomic analysis revealed that serum pantethine concentrations were significantly reduced in psoriasis patients compared with age-matched healthy controls (Fig. S5 S and Table S1), consistent with our observations in the IMQ-induced mouse model and supporting the translational relevance of the Vanin-pantethine axis.

Encouraged by these findings, we further conducted a single-center, investigator-initiated proof-of-concept clinical trial (IIT). After applying the exclusion criteria, a total of 24 patients with plaque psoriasis were enrolled and randomly assigned to two treatment arms. Group A received topical Calcipotriol/Betamethasone dipropionate; group B received the same topical regimen plus oral pantethine (300 mg, take one capsule twice daily) (see Table S2 for details). Clinical assessments were performed by two board-certified dermatologists. Disease severity was assessed using the PASI and the Physician Global Assessment (PGA) scores (Fig. 7 E). Our results demonstrated that patients in group B showed a more substantial decline in both the PASI and PGA scores compared with group A (Fig. 7, F–K; Fig. S5, T–U; and Table S3). Among patients with concomitant dyslipidemia in group B, we observed substantial improvements in their lipid profiles (Table S4), and the therapeutic outcomes at week 12 for these patients were significantly better than those of individuals with dyslipidemia in group A (Fig. S5 V). In contrast, when comparing patients with normal lipid profiles, there were little differences in treatment efficacy between the two groups (Fig. S5 W). These findings support the notion that pantethine enhances therapeutic efficacy by modulating lipid metabolism. Moreover, safety effects were monitored by recording adverse events throughout the study, and no treatment-related side effects were observed (Table S3).

Prior research into the treatment of AIDs has predominantly focused on genetic manipulation, protein inhibitors, or cytokine-based therapies. However, emerging evidence highlights that metabolic pathways and their associated metabolites play vital roles in regulating immune cell function and autoimmune progression (Wu et al., 2023). Metabolic reprogramming, manifested by alterations in metabolic pathways and metabolite levels, is a defining characteristic of distinct DC subsets and functions (Guo and Chi, 2023), suggesting that metabolism serves as a key regulator of DC-mediated immune responses. Owing to their favorable safety profiles, endogenous metabolites are increasingly regarded as viable immune-modulators. In this study, we show that the Vanin-pantethine metabolic axis acts as a key metabolic regulator of DC activation, and demonstrate that targeting this pathway—either by Vanin inhibition or pantethine supplementation—represents a potential therapeutic strategy for DC-mediated AIDs (Fig. 8).

Studies have implicated Vanin family proteins in diverse inflammatory and immune settings (Ferreira et al., 2015; Liu et al., 2024; Miallot et al., 2023; Soler et al., 2022), whether the Vanin-pantethine metabolic axis directly regulates these inflammatory diseases through modulation of DC function has remained largely unexplored. Our study has shed light on a previously uncharted role of Vanin in DC-mediated autoimmune inflammation. The marked upregulation of Vanin family genes in both activated murine and human DCs, including those derived from clinical AID human patients, strongly suggests a potential association between Vanin and DC activation during autoimmune progression. Our comprehensive functional assays have confirmed that Vnn3 deficiency broadly attenuates DC activating capacity without promoting a tolerogenic phenotype, as evidenced by unaltered Treg induction. Based on our observation that VNN3 is markedly induced upon TLR stimulation and in the IMQ model, we speculate that TLR-dependent pathways may contribute to VNN3 upregulation during DC activation. However, the upstream transcriptional regulators of VNN3 remain to be identified. Given that Vanin is expressed in multiple immune and stromal cell populations, its immunomodulatory functions may extend beyond DCs. Future studies will be required to determine the full spectrum of Vanin’s immunomodulatory functions in other inflammatory disorders.

Beyond its well-established roles as a derivative of vitamin B5 and a precursor of CoA, pantethine has a long-standing history of clinical use in the management of hyperlipidemia, indicating its outstanding safety profile. In the present study, we identify a previously unrecognized function of pantethine in restraining DC activation and attenuating related psoriasis inflammation. Our DC depletion and adoptive transfer experiments established that pantethine can exert its anti-inflammatory effects through DC-intrinsic regulation, independent of systemic lipid normalization. Although the present study of pantethine focuses on DCs, the molecular events identified here—including membrane cholesterol accumulation, lipid raft remodeling, and enhanced receptor signaling—represent fundamental mechanisms regulating APC activation rather than processes uniquely restricted to DCs and their associated autoimmunity. Thus, the Vanin-pantethine axis may function more broadly as a metabolic checkpoint linking membrane cholesterol homeostasis to lipid raft-dependent immune and inflammatory signaling, with autoimmune disorder representing one important pathological consequence of its dysregulation.

Consistent with the preclinical findings, our investigator-initiated clinical trial demonstrated encouraging therapeutic efficacy of pantethine as an adjunctive therapy in psoriasis, particularly in patients with concomitant dyslipidemia. However, these clinical findings should be interpreted as proof-of-concept for clinical feasibility rather than direct mechanistic validation of the DC-intrinsic pathway. Clinical benefits may involve contributions from other cell types beyond DCs, and evidence for the Vanin-pantethine axis in AIDs outside psoriasis remains largely associative, awaiting validation in disease-specific models. Nevertheless, given the increased cardiovascular risk in AIDs (Evans et al., 2014; Frostegård, 2005; Huxley et al., 2002) and the established lipid-lowering properties of pantethine, targeting this axis may provide dual therapeutic benefits by simultaneously improving metabolic abnormalities and restraining pathogenic immune activation.

In this study, we demonstrate that pantethine restrains DC activation and alleviates psoriasiform inflammation by limiting membrane cholesterol availability and disrupting lipid raft integrity. Given that pantethine acts through cholesterol modulation, it is plausible that other cholesterol-lowering agents might exert similar immunomodulatory effects. Statins, the first-line lipid-lowering drugs (Adhyaru and Jacobson, 2018), have been reported to modulate DC function, although the reported outcomes have been variable-some studies suggest that statins enhance DC antigen presentation via the MVA pathway (Xia et al., 2018), while others indicate that they alleviate inflammatory damage in SLE models by restoring mitochondrial function in migratory DCs (Zhang et al., 2024). The reasons for these discrepancies remain unclear, but may reflect differences in experimental systems, DC subsets, or disease contexts. Nevertheless, the convergence of these observations on cholesterol metabolism raises the possibility that statins and pantethine may share overlapping mechanisms in modulating DC activation, at least under certain conditions. Future studies directly comparing different cholesterol-modulating agents in specific DC subsets and inflammatory settings will be valuable to further explore this possibility and to clarify the translational implications of targeting cholesterol metabolism for DC-mediated inflammatory diseases.

In conclusion, our study uncovers the Vanin-pantethine-cholesterol axis as a key metabolic pathway governing DC activation and provides a foundation for therapeutic strategies targeting DC-mediated AIDs. Future studies will be required to further define its broader disease relevance and cellular specificity.

Experimental model and study participant details

Clinical study on the efficacy and safety of pantethine in the treatment of plaque psoriasis

Individuals with plaque psoriasis were randomly recruited via the Department of Dermatology at the First Medical Center of Chinese PLA General Hospital of China. Exclusion criteria included individuals clinically diagnosed with special types of psoriasis (such as erythrodermic, psoriatic arthritis, or pustular psoriasis) or with a history of these subtypes; those with other AIDs such as SLE or scleroderma; those who had used any investigational drugs within 28 days prior to enrollment or within five half-lives of the investigational agent; pregnant or lactating women; individuals who had been hospitalized or received intravenous antimicrobial therapy for active infections within the past 4 wk; individuals with poorly controlled hypertension or hyperglycemia (defined as glycated hemoglobin A1c >8% or >64 mmol/mol). Clinical information was collected during routine clinical assessments, including patient sex, age, race, disease duration and location, and disease activity. Oral pantethine was obtained from Now Foods. In this study, individuals with mild plaque psoriasis were randomly assigned to two groups: control group A received calcipotriol/betamethasone ointment once daily, while experimental group B received pantethine (300 mg per capsule, take one capsule twice daily) in combination with calcipotriol/betamethasone ointment or gel, with therapeutic outcomes observed over 12 wk. The efficacy and safety of pantethine in the treatment of plaque psoriasis were evaluated by comparing PASI score improvement and the incidence of adverse events between the two groups. Clinical responses were recorded during follow-up visits. Physical examinations and skin assessments were performed by two dermatologists; PASI and PAG scores were evaluated using digital photography at baseline and at 8- and 12-wk intervals (Table S2). Safety was monitored by documenting adverse events throughout the study. All participants provided written informed consent before enrollment and agreed to the publication of their clinical photographs. This study was conducted in accordance with the ethical principles of the Declaration of Helsinki and was approved by the Ethics Committee of Chinese PLA General Hospital (approval no. S2024-591-02). Written informed consent was obtained from all participants prior to their inclusion in the study.

The study protocol, titled “Clinical study on the efficacy and safety of pantethine in the treatment of mild-to-moderate plaque psoriasis,” was reviewed and registered in the Chinese Clinical Trial Registry (ChiCTR; ChiCTR2500107769, https://www.chictr.org.cn). Recorded adverse events and clinical characteristics of participants are listed in Table S2.

Healthy human PBMC samples

PBMCs from healthy donors and patients with AIDs were obtained from Shanghai Schbio Biotechnology Co., Ltd. Individuals were excluded if they were pregnant or had received antibiotics or vaccines within the past 3 mo.

Mice

All animal experiments were conducted in strict accordance with relevant ethical guidelines and were approved by the Institutional Animal Care and Use Committee of the Laboratory Animal Center at NANHU Laboratory. C57BL/6 mice (stock no. 219) were obtained from Beijing Vital River Laboratory Animal Technology Co., Ltd. OT-II transgenic mice (stock no. 004194) were purchased from The Jackson Laboratory. C57BL/6-Itgax-tdTomato-DTR mice were generated by Shanghai Model Organisms Center. Cd11cCre, Vnn3fl/− mice, Vnn3+/+ and Vnn3−/− mice on a C57BL/6 background were obtained from Cyagen Biosciences. All animals were housed under specific pathogen–free (SPF) conditions with controlled temperature (21 ± 1°C), humidity (60 ± 5%), and a 12-h light/dark cycle. Experimental and control animals were housed separately. Mice were used between 6 and 10 wk of age. Euthanasia was performed using carbon dioxide inhalation in accordance with established humane protocols.

Method details

Generation of EαEGFP fusion protein

Eα-EGFP protein was purified as previously described (Stebegg et al., 2020). Briefly, two cDNA oligonucleotides encoding the sense and antisense strands of the I-Eα peptide (amino acids 56–73) from the I-Ed allele were synthesized by Tsingke Biotechnology Co., Ltd., and annealed to generate a double-stranded fragment. This fragment was inserted into the pEGFP-N1 vector; the EαEGFP sequence was amplified by PCR and subcloned into the pET28a expression vector. pET28a-EαEGFP plasmid was transformed into Escherichia coli BL21 (DE3) and induced with IPTG (1 mM). Cultures were incubated overnight at 16°C with shaking and harvested by centrifugation at 5,000 × g for 15 min. The pellet was suspended in lysis buffer (50 mM Tris-HCl and 400 mM NaCl, pH 8.0) and incubated on ice for 15 min. Cells were lysed by sonication on ice (30 W, 60 s per cycle, five cycles). The lysate was clarified by centrifugation at 10,000 × g for 30 min; the supernatant was sequentially filtered through 0.45- and 0.22-μm syringe filters. Subsequently, prokaryotic proteins were purified using Ni-NTA agarose resin (Cat# G106-01; Genstar). The purified proteins were buffer-exchanged and concentrated using Centriprep 10K centrifugal filters (Cat# UFC903096-1PK; Millipore). The concentrated protein was passed through a 0.22-μm syringe filter and stored at −80°C until use.

Cell isolation and culture

BMDCs were generated from C57BL/6 mice. Bone marrow cells flushed from the tibias and femurs were cultured in RPMI 1640 medium (Gibco) supplemented with 10% FBS (vol/vol), 1% penicillin-streptomycin (vol/vol), 50 μM β-mercaptoethanol, recombinant murine GM-CSF (10 ng/ml; PeproTech), and IL-4 (5 ng/ml; PeproTech). On day 3, half of the culture medium was replaced with fresh medium containing GM-CSF and IL-4. Cells were harvested on day 6 and used as immature DCs.

Spleens from OT-II transgenic mice were collected in cold PBS (Cat# 10010023; Gibco), and single-cell suspensions were prepared by mechanical dissociation through a 70-μm cell strainer. Naive CD4+ T cells were isolated using the Naive CD4+ T Cell Isolation Kit (Cat# 130-104-453; Miltenyi Biotec) following the manufacturer’s protocol.

For the generation of human moDCs, monocytes were enriched from human PBMCs using CD14 MicroBeads (Cat# 130-050-201; Miltenyi Biotec). Isolated monocytes were cultured in RPMI 1640 medium (Gibco) supplemented with 10% FBS (vol/vol), 1% penicillin-streptomycin (vol/vol), 50 μM β-mercaptoethanol, recombinant human GM-CSF (50 ng/ml; PeproTech), and IL-4 (10 ng/ml; PeproTech). On day 3, half of the medium was replaced with fresh medium containing GM-CSF and IL-4. Cells were collected on day 6 as immature DCs.

mDCs were enriched directly from human PBMCs using the Myeloid Dendritic Cell Isolation Kit (Cat# 130-094-487; Miltenyi Biotec), according to the manufacturer’s instructions.

DC stimulation

For LPS stimulation, immature BMDCs or human moDCs were treated with 1 μg/ml ultrapure LPS from E. coli O111:B4 (Cat# L2630; Sigma-Aldrich) for 18–24 h. For R848 stimulation, immature human moDCs were treated with 2.5 μg/ml Resiquimod (R848; Cat# HY-13740; MedChemExpress) for 18–24 h. In some experiments, BMDCs were pre-treated with 5 mM methyl-β-cyclodextrin (Cat# C4555; Sigma-Aldrich) overnight before LPS stimulation.

For in vitro EαEGFP uptake and presentation assays, immature BMDCs were incubated with EαEGFP protein at a final concentration of 50 μg/ml for 24 h at 37°C in a humidified incubator with 5% CO2. Antigen uptake and presentation were evaluated by flow cytometry.

In specific experiments, cells were pre-treated for 2 h with the following compounds prior to stimulation: pantethine (Cat# P2125; Sigma-Aldrich), RR6 (Cat# HY-18780-1; MedChemExpress), or cholesterol (Cat# C4951; Sigma-Aldrich). Detailed treatment conditions are provided in the figure legends.

In vitro T cell activation assay

Immature WT or Vnn3-deficient BMDCs were treated as indicated. Where applicable, WT BMDCs were pre-treated with pantethine, RR6, and/or cholesterol supplementation, followed by stimulation with LPS (1 μg/ml) for 12–18 h. BMDCs were then pulsed with OVA323–339 peptide (10 μg/ml; Cat# T510211; Sangon) or OVA protein (200 μg/ml; Cat# vac-pova; InvivoGen) for 2 h. After antigen loading, BMDCs were washed and co-cultured with CFSE-labeled naive OT-II CD4+ T cells (Cat# C34570; Thermo Fisher Scientific) at a DC:T cell ratio of 1:5 for 72 h. T cell proliferation and activation were assessed by flow cytometry.

Isolation of mouse skin and DLN cells

The isolation of mouse skin cells was performed as previously described (Yong et al., 2022). Briefly, dorsal skin was harvested from mice at the indicated time points, minced into small fragments, and incubated at 37°C for 90 min in RPMI 1640 medium supplemented with 1 mg/ml collagenase IV (Cat# C5138; Sigma-Aldrich), 50 μg/ml DNase I (Cat# A610099; Sangon Biotech), 10 mM HEPES (Cat# E607018; Sangon Biotech), and 10% FBS (Cat# 12657-029; Gibco). After digestion, the skin suspension was passed through a 70-μm nylon cell strainer to obtain single-cell suspensions. Enzymatic activity was neutralized by adding fresh RPMI 1640 medium. Cells were collected by centrifugation, resuspended in PBS, and counted using a hemocytometer.

For DLN cell isolation, DLNs were harvested, mechanically dissociated through a 70-μm nylon mesh, and centrifuged at 1,500 rpm for 5 min. Cell pellets were resuspended in PBS, and viable cells were enumerated prior to further analysis.

Flow cytometry

For surface marker staining, cells were first incubated with blocking buffer (MACS buffer; Cat# 130-091-221; Miltenyi Biotec) for 10 min at 4°C to minimize nonspecific binding. Subsequently, cells were stained with fluorochrome-conjugated monoclonal antibodies for 30 min on ice in the dark. Specifically, for biotinylated antibodies, cells were first incubated with the biotin-conjugated antibodies at 4°C for 30 min, followed by one to two washes with MACS buffer. Cells were then incubated with APC-conjugated streptavidin (Cat# 405207; BioLegend) at 4°C for 30 min in the dark to detect biotinylated antibody-bound cells.

For intracellular cytokine and factor detection, after surface marker staining, cells were fixed with 4% paraformaldehyde (PFA; Cat# P1110; Macgene) for 15 min at room temperature (RT). Then, cells were permeabilized using FOXP3 Fix/Perm Buffer Set (Cat# 412403; BioLegend) and stained with fluorochrome-conjugated monoclonal antibodies according to the manufacturer’s instructions.

For analysis of cholesterol content and lipid raft distribution, cells were fixed in 4% PFA (Cat# P1110; Macgene) for 15 min at RT. After washing with PBS, cells were blocked in PBS containing 5% BSA for 30 min. Cholesterol staining was performed using Filipin III (0.05 mg/ml; Cat# 70440-1; Cayman) at 37°C for 1 h. Lipid raft staining was performed using FITC-conjugated Cholera Toxin Subunit B (CTXb; 8 μg/ml; Cat# abs80003; Absin) at 4°C for 30 min in the dark. After staining, cells were washed and immediately analyzed by flow cytometry.

Apoptotic cell death was assessed by Annexin V staining. Cells were stained with APC/Fire 750 Annexin V (Cat# 640953; BioLegend) in Annexin V Binding Buffer (Cat# 422201; BioLegend) for 15 min at RT in the dark, followed by flow cytometric analysis.

Cellular oxidative stress was evaluated by measuring intracellular ROS levels using H2DCFDA (Cat# HY-D0940; MedChemExpress). Cells were incubated with H2DCFDA working solution for 5–30 min at RT in the dark, washed, and analyzed by flow cytometry.

The antibodies used in these protocols are listed in Table S6. All flow cytometry data were acquired using an LSRFortessa flow cytometer (BD Biosciences) equipped with BD FACS Diva software (version 8.0), and analyzed with FlowJo software (Tree Star, version 10.0). 7-Aminoactinomycin D (Cat# 559925; BD Pharmingen) and Fixable Viability Dye eFluor 506 (Cat# 65-0866-14; eBioscience) were used for live/dead cell discrimination.

Flow cytometry data were analyzed using the gating strategy previously described (Adams et al., 2026; Zhang et al., 2024).

ELISA

Culture supernatants from in vitro antigen presentation assays were collected, and cytokine concentrations were measured using ELISA kits. Levels of IFN-γ, IL-4, and IL-17A were quantified using commercial ELISA kits for mouse IFN-γ (Cat# 430804; BioLegend), IL-4 (Cat# 431104), and IL-17A (Cat# 432504), following the manufacturer’s instructions.

Animal models of psoriasis and treatment

For induction of the psoriasis-like skin inflammation model, female C57BL/6 mice (7–8 wk of age) were housed under SPF conditions. Mice were topically treated with 62.5 mg of commercially available 5% IMQ cream (Cat# 120503; Med-shine Pharma) on the shaved back skin once daily for 6 consecutive days (van der Fits et al., 2009).

Psoriasis severity was assessed daily based on three parameters—skin thickness, scaling, and erythema—according to a modified PASI scoring system. Skin thickness was measured using a vernier caliper, while scaling and erythema were each scored on a scale from 0 to 4: 0, none; 1, slight; 2, moderate; 3, marked; and 4, very marked.

On day 6, mice were euthanized, and skin or lymphoid tissues were collected for further analyses. For pharmacological interventions, mice received daily treatments during IMQ application via either i.p. injection or oral gavage. For i.p. administration, mice were injected with pantethine (50 mg/kg; Cat# P2125; Sigma-Aldrich) or RR6 (10 mg/kg; Cat# R883075; Macklin). Control mice were administered an equal volume of the respective vehicle through the corresponding route.

Adoptive transfer of BMDCs

For adoptive transfer experiments, male Itgax (CD11c)-tdTomato-DTR transgenic recipient mice (6–7 wk of age) were i.p. injected with 100 ng DT (Cat# 150; List Biologicals) to deplete endogenous CD11c+ DCs. On the same day, mice received intravenous transfer of BMDCs (1 × 10⁶ cells in 100 μl sterile PBS) via the tail vein. Two independent adoptive transfer experiments were performed: (1) BMDCs were pre-treated with vehicle or pantethine prior to transfer, and (2) BMDCs isolated from WT or Vnn3−/− mice were transferred into recipient mice.

DT injection and BMDC transfer were performed every 3 days; in total, two rounds of DT injection and BMDC transfer were conducted, as shown in Fig. 3 A and Fig. S3 P.

Biochemical measurement of TC levels

Total cellular cholesterol levels were quantified using the Amplex Red Cholesterol Assay Kit (Invitrogen) according to the manufacturer’s instructions. 2 × 10⁵ cells were resuspended in 0.1 ml of double-distilled water and mixed with 0.4 ml of extraction buffer (methanol:chloroform = 1:2, vol/vol). After centrifugation, the lower organic phase containing the extracted cholesterol was collected, dried under vacuum, and subsequently analyzed using the Amplex Red assay.

Immunofluorescence

The immunofluorescence procedure for assessing cholesterol and lipid raft content in BMDCs was performed as previously described (Bonacina et al., 2018). Briefly, cells were seeded onto poly-L-lysine–coated coverslips and fixed with 4% PFA (P1110; Macgene) for 15 min at RT. After washing with PBS, cells were blocked in PBS containing 5% BSA, followed by staining with filipin III (0.05 mg/ml; 70440-1; Cayman) at 37°C for 1 h then CTXb (8 μg/ml; abs80003; Absin) and PE anti-mouse TLR4 antibody (Cat# 12-9041-80; eBioscience) at 4°C for 30 min in the dark. Nuclear staining was performed after above all procedure, using the fluorescent nuclear dye DRAQ5 (Cat#62254; Thermo Fisher Scientific). Cells were washed and resuspended in PBS, followed by incubation with DRAQ5 at RT for 5–30 min in the dark. After staining, cells were washed and analyzed by fluorescence microscopy.

Stained cells were imaged using a Zeiss fluorescence microscope equipped with a 40× or 63× objective. Confocal images were acquired and analyzed using the ZEISS LSM 900 confocal microscopy system. Quantification of fluorescence intensity and colocalization was performed with ImageJ software (version 1.54).

LC/MS analysis for specific metabolites

For plasma or serum metabolite extraction, 50 μl of sample was mixed with 200 μl of pre-cooled (−20°C) methanol and acetonitrile mixture (1:1, vol/vol) and incubated at −20°C overnight. The following day, samples were centrifuged at 15,000 rpm for 30 min at 4°C, and the resulting supernatants were collected and freeze-dried by lyophilization.

For cellular metabolite extraction, cells were washed twice with PBS, harvested by centrifugation, and resuspended in 80% (vol/vol) methanol pre-cooled at −80°C. Samples were incubated overnight at −80°C. Subsequently, cell lysates were centrifuged at 15,000 rpm for 30 min at 4°C, and the supernatants were collected and freeze-dried.

Targeted LC-MS/MS analysis of pantothenic acid was performed by the Metabolome Platform of Tsinghua University, while pantethine quantification was conducted at the National Center of Biomedical Analysis.

RNA isolation and gene expression profiling

Total RNA was extracted from cells or skin tissues using TRIzol reagent (Cat# T3934; Sigma-Aldrich) according to the manufacturer’s protocol. cDNA was synthesized using PrimeScript RT Master Mix (Cat# RR036A; Takara). Quantitative real-time PCR (qRT-PCR) was performed with PowerUp SYBR Green Master Mix (Cat# A25742; Thermo Fisher Scientific) on a QuantStudio 3 real-time PCR system (Thermo Fisher Scientific Applied Biosystems).

Gene expression levels were normalized to the housekeeping gene Gapdh. Primer sequences used for qRT-PCR are listed in Table S5.

RNA-seq and DEG analysis

Total RNA was extracted from untreated and LPS-treated BMDCs. Following quality assessment for RNA quantity, purity, and integrity, 1 μg of total RNA was used to construct cDNA libraries with an average insert size of 300 ± 50 bp. Libraries were sequenced on an Illumina NovaSeq 6000 platform using 2 × 150 bp paired-end chemistry. All sequencing services were performed by Annoroad.

Principal component analysis (PCA) was conducted using the prcomp function from the base stats package in R (version 4.3.2) and visualized with the ggplot2 package (version 3.4.4) (Ginestet, 2011) to generate 2D PCA plots.

Differential gene expression analysis between conditions was performed using either the Bioconductor DESeq2 package (version 1.32.0) (Gentleman et al., 2004) or the limma package (version 3.40.6) (Huber et al., 2015). Genes exhibiting a fold change >2 or <0.5 with a P < 0.05 were considered differentially expressed.

Integration of metabolic related gene sets

Metabolic pathway information was retrieved from the KEGG database (Ogata et al., 1999) (https://www.genome.jp/kegg/). Pathways were categorized into 10 major groups according to the KEGG classification system. Genes involved in these metabolic pathways were compiled and integrated to generate a comprehensive gene set representing human and mouse metabolism-related genes.

KEGG pathway enrichment analysis

KEGG pathway enrichment analysis of DEGs was performed using the DAVID Bioinformatics Resources (Huang et al., 2009; Sherman et al., 2022) (https://davidbioinformatics.nih.gov/home.jsp). KEGG terms with a P < 0.05 were considered significantly enriched. Subsequent data processing and visualization were conducted using the Bioinformatics Tools platform (https://www.bioinformatics.com.cn) (Tang et al., 2023).

GSEA

GSEA was performed using GSEA software (version 4.3.2) (Subramanian et al., 2005), employing the Reactome Pathway subset from the Molecular Signatures Database (MSigDB) (https://www.gsea-msigdb.org/gsea/index.jsp) (Liberzon et al., 2011). A total of 1,000 permutations were conducted for statistical assessment. Pathways with a nominal P < 0.05 and an absolute normalized enrichment score (|NES|) > 1.5 were considered significantly enriched.

Evaluation of immune cell infiltration

The normalized gene expression matrix was uploaded to CIBERSORTx (Newman et al., 2019) (https://cibersortx.stanford.edu/jobs.php) to estimate the relative abundance of immune cell populations in each sample. The LM22 gene signature matrix was used to quantify the proportions of 22 distinct immune cell types. A total of 1,000 permutations were performed to assess statistical significance.

Consensus clustering

Gene sets were curated from multiple published sources, including signatures of human DC subsets (Nutt and Chopin, 2020), transcriptional networks governing DC subset development and function (Zhang et al., 2023), classic human DC subset signatures (de Winde et al., 2020), and the GOBP_MYLOID_DENDRITIC_CELL_ ACTIVATION pathway from the MSigDB. Overlapping genes among these sets were compiled to define the DC functional gene signature.

Prior to consensus clustering, correlation analysis was performed between the expression of genes within the DC functional gene set and VNN1 or VNN3. Genes with a correlation coefficient >0.25 and P < 0.05 were retained for downstream analysis.

The expression matrix comprising psoriasis patient and healthy donor samples was standardized to z-scores and subjected to hierarchical clustering using Morpheus (https://software.broadinstitute.org/morpheus). Clustering was based on the DC functional gene set and utilized one minus Spearman correlation as the distance metric.

Statistical analysis

For in vitro experiments involving human or mouse primary cells, each data point represents one replicate from a single donor (mean of triplicate wells). The experiment was independently repeated at least three times with different donors, and representative results from one experiment are shown. For in vivo datasets presented in our manuscript, each data point represents an individual mouse or human subject.

Statistical analyses were performed using GraphPad Prism software version 9 by two-tailed paired Student’s t test, two-tailed unpaired Student’s t test, or one-way ANOVA followed by Bonferroni’s correction. Results were presented as mean ± SD or mean ± SEM. A value of P < 0.05 was considered to indicate statistical significance.

Online supplemental material

Fig. S1 shows supporting data for Fig. 1. Fig. S2 shows supporting data for Figs. 2 and 3. Fig. S3 shows supporting data for Fig. 4 and pan-treated BMDCs adoptive transfer experiment data. Fig. S4 shows supporting data for Fig. 5 and MβCD experiment data. Fig. S5 shows supporting data for Figs. 6 and 7. Table S1 shows clinical characteristics and serum lipid parameters of healthy controls and patients with psoriasis. Table S2 shows demographic and clinical characteristics of the patients at baseline. Table S3 shows primary endpoints and ranked secondary endpoints. Table S4 shows serum lipid parameters of patients. Table S5 shows primers used in this study. Table S6 shows antibodies used in this study.

RNA-seq data of mouse BMDCs have been deposited in the Genome Sequence Archive database of the National Genomics Data Center under accession number CRA049670 and are publicly accessible at https://ngdc.cncb.ac.cn/gsa. Expression matrices for psoriasis patients and healthy donors were obtained from the NCBI Gene Expression Omnibus (GEO) database under accession number GSE54456. Expression data for human dendritic cells stimulated with R848 were downloaded from GEO under accession number GSE2706. Expression profiles of mDCs from SLE patients and healthy controls are available under GEO accession number GSE149050. Additionally, expression matrices of mDCs from multiple AIDs were obtained from the NBDC Human Database (accession: hum0214.v3, https://humandbs.dbcls.jp/en/research/hum0214/v3). Further expression data encompassing various autoimmune diseases were accessed via the IAAA database (Shen et al., 2022).

This work was supported by the National Natural Science Foundation of China (82273024 and 82022030) and the Research Foundation of the Nanhu Laboratory (NSS2024CI05004).

Author contributions: Ai-Ping Cao: conceptualization, formal analysis, investigation, methodology, project administration, validation, visualization, and writing—original draft, review, and editing. Jun-Cheng Li: formal analysis, investigation, validation, visualization, and writing—original draft, review, and editing. Rui Wang: investigation and resources. Yun-Ying Wang: formal analysis and visualization. Nan Wu: investigation. Yan-Hong Liu: investigation. Zhi Jin: investigation. Jia-Yu Liu: investigation. Yan-Yan Shen: investigation. Yue Guo: investigation. Qi Qi: investigation. Yao Wang: investigation. Rui-Bo Wang: investigation. Bo-Yang Xie: investigation. Chun-Yan Yan: investigation. Qiu-Ying Han: investigation. Shao-Yi Huang: investigation. Sheng-Ming Wu: investigation. Na Wang: supervision. Xin Pan: supervision. Cheng-Xin Li: resources and supervision. Tao Zhou: supervision. Ai-Ling Li: supervision. Qing Xia: conceptualization, data curation, funding acquisition, methodology, project administration, resources, supervision, validation, visualization, and writing—original draft, review, and editing. Wei-Na Zhang: conceptualization, funding acquisition, project administration, supervision, and writing—original draft, review, and editing.

Abou-Hamdan
,
M.
,
R.
Saleh
,
S.
Mani
,
P.
Dournaud
,
M.
Metifiot
,
M.L.
Blondot
,
M.L.
Andreola
,
F.
Abdel-Sater
,
M.
De Reggi
,
P.
Gressens
, and
M.
Laforge
.
2023
.
Potential antiviral effects of pantethine against SARS-CoV-2
.
Sci. Rep.
13
:
2237
.
Abou-Hamdan
,
M.
,
B.
Gharib
,
M.
Bajenoff
,
V.
Julia
, and
M.
de Reggi
.
2017
.
Pantethine down-regulates leukocyte recruitment and inflammatory parameters in a mouse model of allergic airway inflammation
.
Med. Sci. Monit. Basic Res.
23
:
368
–
372
.
Adams
,
N.M.
,
D.
Martinez-Krams
,
E.
Esteva
,
A.C.
Ra
,
A.I.
Alexiou
,
H.
Jin
,
T.J.
Yun
,
R.S.
Tellaoui
,
T.
Mudianto
,
E.
Vollmer
, et al
.
2026
.
Transcription factor Etv3 controls the tolerogenic function of dendritic cells
.
Science
.
391
:eads1246.
Adhyaru
,
B.B.
, and
T.A.
Jacobson
.
2018
.
Safety and efficacy of statin therapy
.
Nat. Rev. Cardiol.
15
:
757
–
769
.
Ahlehoff
,
O.
,
L.
Skov
,
G.
Gislason
,
R.
Gniadecki
,
L.
Iversen
,
L.E.
Bryld
,
S.
Lasthein
,
J.
Lindhardsen
,
S.L.
Kristensen
,
C.
Torp-Pedersen
, and
P.R.
Hansen
.
2015
.
Cardiovascular outcomes and systemic anti-inflammatory drugs in patients with severe psoriasis: 5-year follow-up of a Danish nationwide cohort
.
J. Eur. Acad. Dermatol. Venereol.
29
:
1128
–
1134
.
Anderson
,
H.A.
,
E.M.
Hiltbold
, and
P.A.
Roche
.
2000
.
Concentration of MHC class II molecules in lipid rafts facilitates antigen presentation
.
Nat. Immunol.
1
:
156
–
162
.
Arsenio
,
L.
,
S.
Caronna
,
M.
Lateana
,
G.
Magnati
,
A.
Strata
, and
G.
Zammarchi
.
1984
.
[Hyperlipidemia, diabetes and atherosclerosis: Efficacy of treatment with pantethine]
.
Acta Biomed. Ateneo Parmense
.
55
:
25
–
42
.
Bellinato
,
F.
,
M.
Maurelli
,
D.
Geat
,
G.
Girolomoni
, and
P.
Gisondi
.
2024
.
Managing the patient with psoriasis and metabolic comorbidities
.
Am. J. Clin. Dermatol.
25
:
527
–
540
.
Benson
,
R.A.
,
M.K.L.
MacLeod
,
B.G.
Hale
,
A.
Patakas
,
P.
Garside
, and
J.M.
Brewer
.
2015
.
Antigen presentation kinetics control T cell/dendritic cell interactions and follicular helper T cell generation in vivo
.
Elife
.
4
:e06994.
Berruyer
,
C.
,
L.
Pouyet
,
V.
Millet
,
F.M.
Martin
,
A.
LeGoffic
,
A.
Canonici
,
S.
Garcia
,
C.
Bagnis
,
P.
Naquet
, and
F.
Galland
.
2006
.
Vanin-1 licenses inflammatory mediator production by gut epithelial cells and controls colitis by antagonizing peroxisome proliferator-activated receptor γ activity
.
J. Exp. Med.
203
:
2817
–
2827
.
Bonacina
,
F.
,
D.
Coe
,
G.
Wang
,
M.P.
Longhi
,
A.
Baragetti
,
A.
Moregola
,
K.
Garlaschelli
,
P.
Uboldi
,
F.
Pellegatta
,
L.
Grigore
, et al
.
2018
.
Myeloid apolipoprotein E controls dendritic cell antigen presentation and T cell activation
.
Nat. Commun.
9
:
3083
.
Brunetti
,
D.
,
S.
Dusi
,
C.
Giordano
,
C.
Lamperti
,
M.
Morbin
,
V.
Fugnanesi
,
S.
Marchet
,
G.
Fagiolari
,
O.
Sibon
,
M.
Moggio
, et al
.
2014
.
Pantethine treatment is effective in recovering the disease phenotype induced by ketogenic diet in a pantothenate kinase-associated neurodegeneration mouse model
.
Brain
.
137
:
57
–
68
.
Chen
,
C.
,
G.
Hou
,
C.
Zeng
,
Y.
Ren
,
X.
Chen
, and
C.
Peng
.
2021
.
Metabolomic profiling reveals amino acid and carnitine alterations as metabolic signatures in psoriasis
.
Theranostics
.
11
:
754
–
767
.
Cighetti
,
G.
,
M.D.
Puppo
,
R.
Paroni
, and
M.G.
Kienle
.
1988
.
Modulation of HMG-CoA reductase activity by pantetheine/pantethine
.
Biochim. Biophys. Acta
.
963
:
389
–
393
.
Collin
,
M.
, and
V.
Bigley
.
2018
.
Human dendritic cell subsets: An update
.
Immunology
.
154
:
3
–
20
.
de Winde
,
C.M.
,
C.
Munday
, and
S.E.
Acton
.
2020
.
Molecular mechanisms of dendritic cell migration in immunity and cancer
.
Med. Microbiol. Immunol. (Berl.)
.
209
:
515
–
529
.
Donati
,
C.
,
G.
Barbi
,
G.
Cairo
,
G.F.
Prati
, and
E.
Degli Esposti
.
1986
.
Pantethine improves the lipid abnormalities of chronic hemodialysis patients: Results of a multicenter clinical trial
.
Clin. Nephrol.
25
:
70
–
74
.
Elmets
,
C.A.
,
C.L.
Leonardi
,
D.M.R.
Davis
,
J.M.
Gelfand
,
J.
Lichten
,
N.N.
Mehta
,
A.W.
Armstrong
,
C.
Connor
,
K.M.
Cordoro
,
B.E.
Elewski
, et al
.
2019
.
Joint AAD-NPF guidelines of care for the management and treatment of psoriasis with awareness and attention to comorbidities
.
J. Am. Acad. Dermatol.
80
:
1073
–
1113
.
Evans
,
M.
,
J.A.
Rumberger
,
I.
Azumano
,
J.J.
Napolitano
,
D.
Citrolo
, and
T.
Kamiya
.
2014
.
Pantethine, a derivative of vitamin B5, favorably alters total, LDL and non-HDL cholesterol in low to moderate cardiovascular risk subjects eligible for statin therapy: A triple-blinded placebo and diet-controlled investigation
.
Vasc. Health Risk Manag.
10
:
89
–
100
.
Ferreira
,
D.W.
,
P.
Naquet
, and
J.E.
Manautou
.
2015
.
Influence of vanin-1 and Catalytic products in liver during normal and oxidative stress conditions
.
Curr. Med. Chem.
22
:
2407
–
2416
.
Frostegård
,
J.
2005
.
Atherosclerosis in patients with autoimmune disorders
.
Arterioscler. Thromb. Vasc. Biol.
25
:
1776
–
1785
.
Ganguly
,
D.
,
S.
Haak
,
V.
Sisirak
, and
B.
Reizis
.
2013
.
The role of dendritic cells in autoimmunity
.
Nat. Rev. Immunol.
13
:
566
–
577
.
Gentleman
,
R.C.
,
V.J.
Carey
,
D.M.
Bates
,
B.
Bolstad
,
M.
Dettling
,
S.
Dudoit
,
B.
Ellis
,
L.
Gautier
,
Y.
Ge
,
J.
Gentry
, et al
.
2004
.
Bioconductor: Open software development for computational biology and bioinformatics
.
Genome Biol.
5
:
R80
.
Ginestet
,
C.
2011
.
ggplot2: Elegant graphics for data analysis
.
J. R. Stat. Soc. Ser. A Stat. Soc.
174
:
245
–
246
.
Good
,
Z.
,
L.
Borges
,
N.
Vivanco Gonzalez
,
B.
Sahaf
,
N.
Samusik
,
R.
Tibshirani
,
G.P.
Nolan
, and
S.C.
Bendall
.
2019
.
Proliferation tracing with single-cell mass cytometry optimizes generation of stem cell memory-like T cells
.
Nat. Biotechnol.
37
:
259
–
266
.
Greb
,
J.E.
,
A.M.
Goldminz
,
J.T.
Elder
,
M.G.
Lebwohl
,
D.D.
Gladman
,
J.J.
Wu
,
N.N.
Mehta
,
A.Y.
Finlay
, and
A.B.
Gottlieb
.
2016
.
Psoriasis
.
Nat. Rev. Dis. Primer
.
2
:
16082
.
Griffiths
,
C.E.M.
,
A.W.
Armstrong
,
J.E.
Gudjonsson
, and
J.N.W.N.
Barker
.
2021
.
Psoriasis
.
Lancet
.
397
:
1301
–
1315
.
Guan
,
W.
,
J.
Xu
,
Y.
Shi
,
X.
Wang
,
S.
Gu
, and
L.
Xie
.
2023
.
VNN1 as a potential biomarker for sepsis diagnosis and its implications in immune infiltration and tumor prognosis
.
Front. Med.
10
:
1236484
.
Guo
,
C.
, and
H.
Chi
.
2023
.
Immunometabolism of dendritic cells in health and disease
.
Adv. Immunol.
160
:
83
–
116
.
Guo
,
C.
,
Z.
You
,
H.
Shi
,
Y.
Sun
,
X.
Du
,
G.
Palacios
,
C.
Guy
,
S.
Yuan
,
N.M.
Chapman
,
S.A.
Lim
, et al
.
2023
.
SLC38A2 and glutamine signalling in cDC1s dictate anti-tumour immunity
.
Nature
.
620
:
200
–
208
.
Hepworth
,
M.R.
,
L.A.
Monticelli
,
T.C.
Fung
,
C.G.K.
Ziegler
,
S.
Grunberg
,
R.
Sinha
,
A.R.
Mantegazza
,
H.-L.
Ma
,
A.
Crawford
,
J.M.
Angelosanto
, et al
.
2013
.
Innate lymphoid cells regulate CD4+ T-cell responses to intestinal commensal bacteria
.
Nature
.
498
:
113
–
117
.
Huang
,
D.W.
,
B.T.
Sherman
, and
R.A.
Lempicki
.
2009
.
Systematic and integrative analysis of large gene lists using DAVID bioinformatics resources
.
Nat. Protoc.
4
:
44
–
57
.
Huang
,
H.
,
X.
Dong
,
M.X.
Kang
,
B.
Xu
,
Y.
Chen
,
B.
Zhang
,
J.
Chen
,
Q.P.
Xie
, and
Y.L.
Wu
.
2010
.
Novel blood biomarkers of pancreatic cancer–associated diabetes mellitus identified by peripheral blood–based gene expression profiles
.
Am. J. Gastroenterol.
105
:
1661
–
1669
.
Huber
,
W.
,
V.J.
Carey
,
R.
Gentleman
,
S.
Anders
,
M.
Carlson
,
B.S.
Carvalho
,
H.C.
Bravo
,
S.
Davis
,
L.
Gatto
,
T.
Girke
, et al
.
2015
.
Orchestrating high-throughput genomic analysis with Bioconductor
.
Nat. Methods
.
12
:
115
–
121
.
Huxley
,
R.
,
S.
Lewington
, and
R.
Clarke
.
2002
.
Cholesterol, coronary heart disease and stroke: A review of published evidence from observational studies and randomized controlled trials
.
Semin. Vasc. Med.
2
:
315
–
323
.
Jansen
,
P.A.M.
,
J.A.
van Diepen
,
B.
Ritzen
,
P.L.J.M.
Zeeuwen
,
I.
Cacciatore
,
C.
Cornacchia
,
I.M.J.J.
van Vlijmen-Willems
,
E.
de Heuvel
,
P.N.M.
Botman
,
R.H.
Blaauw
, et al
.
2013
.
Discovery of small molecule vanin inhibitors: New tools to study metabolism and disease
.
ACS Chem. Biol.
8
:
530
–
534
.
Joosten
,
S.A.
,
L.C.
Sullivan
, and
T.H.M.
Ottenhoff
.
2016
.
Characteristics of HLA-E restricted T-cell responses and their role in infectious diseases
.
J. Immunol. Res.
2016
:
2695396
.
Kaskow
,
B.J.
,
J.
Michael Proffit
,
J.
Blangero
,
E.K.
Moses
, and
L.J.
Abraham
.
2012
.
Diverse biological activities of the vascular non-inflammatory molecules – the Vanin pantetheinases
.
Biochem. Biophys. Res. Commun.
417
:
653
–
658
.
Kelly
,
B.
, and
L.A.J.
O’Neill
.
2015
.
Metabolic reprogramming in macrophages and dendritic cells in innate immunity
.
Cell Res.
25
:
771
–
784
.
Liberzon
,
A.
,
A.
Subramanian
,
R.
Pinchback
,
H.
Thorvaldsdóttir
,
P.
Tamayo
, and
J.P.
Mesirov
.
2011
.
Molecular signatures database (MSigDB) 3.0
.
Bioinformatics
.
27
:
1739
–
1740
.
Liu
,
C.
,
X.
Alimu
,
X.
Zeng
,
A.
Bahabayi
,
Y.
Gao
,
Y.
Hu
,
Y.
Chen
,
J.
Zhao
,
X.
Lian
,
M.
Zheng
, et al
.
2024
.
Vanin-2 is expressed in peripheral blood T cells and upregulated in patients with systemic lupus erythematosus
.
J. Leukoc. Biol.
116
:
1469
–
1478
.
Liu
,
J.
,
X.
Zhang
,
Y.
Cheng
, and
X.
Cao
.
2021
.
Dendritic cell migration in inflammation and immunity
.
Cell. Mol. Immunol.
18
:
2461
–
2471
.
Lou
,
F.
,
Y.
Sun
,
Z.
Xu
,
L.
Niu
,
Z.
Wang
,
S.
Deng
,
Z.
Liu
,
H.
Zhou
,
J.
Bai
,
Q.
Yin
, et al
.
2020
.
Excessive polyamine generation in keratinocytes promotes self-RNA sensing by dendritic cells in psoriasis
.
Immunity
.
53
:
204
–
216.e10
.
Lu
,
P.
,
C.
Zhang
,
L.
Fu
,
Y.
Wei
,
Y.
Huang
,
X.
Wang
,
C.
Lv
, and
L.
Chen
.
2021
.
Near-infrared fluorescent Probe for imaging and evaluating the role of vanin-1 in chemotherapy
.
Anal. Chem.
93
:
10378
–
10387
.
McCarty
,
M.F.
2001
.
Inhibition of acetyl-CoA carboxylase by cystamine may mediate the hypotriglyceridemic activity of pantethine
.
Med. Hypotheses
.
56
:
314
–
317
.
Miallot
,
R.
,
V.
Millet
,
A.
Roger
,
R.
Fenouil
,
C.
Tardivel
,
J.-C.
Martin
,
F.
Tranchida
,
L.
Shintu
,
P.
Berchard
,
J.S.
Lanza
, et al
.
2023
.
The coenzyme A precursor pantethine enhances antitumor immunity in sarcoma
.
Life Sci. Alliance
.
6
:e202302200.
Millet
,
V.
,
T.
Gensollen
,
M.
Maltese
,
M.
Serrero
,
N.
Lesavre
,
C.
Bourges
,
C.
Pitaval
,
S.
Cadra
,
L.
Chasson
,
T.P.V.
Vu Man
, et al
.
2023
.
Harnessing the Vnn1 pantetheinase pathway boosts short chain fatty acids production and mucosal protection in colitis
.
Gut
.
72
:
1115
–
1128
.
Min-Oo
,
G.
,
A.
Fortin
,
G.
Pitari
,
M.
Tam
,
M.M.
Stevenson
, and
P.
Gros
.
2007
.
Complex genetic control of susceptibility to malaria: Positional cloning of the Char9 locus
.
J. Exp. Med.
204
:
511
–
524
.
Nemati
,
H.
,
R.
Khodarahmi
,
A.
Rahmani
,
A.
Ebrahimi
,
M.
Amani
, and
K.
Eftekhari
.
2013
.
Serum lipid profile in psoriatic patients: Correlation between vascular adhesion protein 1 and lipoprotein (a)
.
Cell Biochem. Funct.
31
:
36
–
40
.
Newman
,
A.M.
,
C.B.
Steen
,
C.L.
Liu
,
A.J.
Gentles
,
A.A.
Chaudhuri
,
F.
Scherer
,
M.S.
Khodadoust
,
M.S.
Esfahani
,
B.A.
Luca
,
D.
Steiner
, et al
.
2019
.
Determining cell type abundance and expression from bulk tissues with digital cytometry
.
Nat. Biotechnol.
37
:
773
–
782
.
Nutt
,
S.L.
, and
M.
Chopin
.
2020
.
Transcriptional networks driving dendritic cell differentiation and function
.
Immunity
.
52
:
942
–
956
.
Ogata
,
H.
,
S.
Goto
,
K.
Sato
,
W.
Fujibuchi
,
H.
Bono
, and
M.
Kanehisa
.
1999
.
KEGG: Kyoto encyclopedia of genes and genomes
.
Nucleic Acids Res.
27
:
29
–
34
.
Pannu
,
S.
, and
D.
Rosmarin
.
2021
.
Psoriasis in patients with metabolic syndrome or type 2 diabetes mellitus: Treatment challenges
.
Am. J. Clin. Dermatol.
22
:
293
–
300
.
Pearce
,
E.J.
, and
B.
Everts
.
2015
.
Dendritic cell metabolism
.
Nat. Rev. Immunol.
15
:
18
–
29
.
Penet
,
M.-F.
,
M.
Abou-Hamdan
,
N.
Coltel
,
E.
Cornille
,
G.E.
Grau
,
M.
de Reggi
, and
B.
Gharib
.
2008
.
Protection against cerebral malaria by the low-molecular-weight thiol pantethine
.
Proc. Natl. Acad. Sci. USA
.
105
:
1321
–
1326
.
Penet
,
M.-F.
,
B.
Krishnamachary
,
F.
Wildes
,
Y.
Mironchik
,
D.
Mezzanzanica
,
F.
Podo
,
M.
de Reggi
,
B.
Gharib
, and
Z.M.
Bhujwalla
.
2016
.
Effect of pantethine on ovarian tumor progression and choline metabolism
.
Front. Oncol.
6
:
244
.
Płóciennikowska
,
A.
,
A.
Hromada-Judycka
,
K.
Borzęcka
, and
K.
Kwiatkowska
.
2015
.
Co-operation of TLR4 and raft proteins in LPS-induced pro-inflammatory signaling
.
Cell. Mol. Life Sci.
72
:
557
–
581
.
Puig
,
L.
2011
.
Obesity and psoriasis: Body weight and body mass index influence the response to biological treatment
.
J. Eur. Acad. Dermatol. Venereol.
25
:
1007
–
1011
.
Rana
,
A.
,
E.
Seinen
,
K.
Siudeja
,
R.
Muntendam
,
B.
Srinivasan
,
J.J.
van der Want
,
S.
Hayflick
,
D.-J.
Reijngoud
,
O.
Kayser
, and
O.C.M.
Sibon
.
2010
.
Pantethine rescues a Drosophila model for pantothenate kinase–associated neurodegeneration
.
Proc. Natl. Acad. Sci. USA
.
107
:
6988
–
6993
.
Reis e Sousa
,
C.
2006
.
Dendritic cells in a mature age
.
Nat. Rev. Immunol.
6
:
476
–
483
.
Schalkwijk
,
J.
, and
P.
Jansen
.
2014
.
Chemical biology tools to study pantetheinases of the vanin family
.
Biochem. Soc. Trans.
42
:
1052
–
1055
.
Shen
,
Z.
,
M.
Fang
,
W.
Sun
,
M.
Tang
,
N.
Liu
,
L.
Zhu
,
Q.
Liu
,
B.
Li
,
R.
Sun
,
Y.
Shi
, et al
.
2022
.
A transcriptome atlas and interactive analysis platform for autoimmune disease
.
Database
.
2022
:
baac050
.
Sherman
,
B.T.
,
M.
Hao
,
J.
Qiu
,
X.
Jiao
,
M.W.
Baseler
,
H.C.
Lane
,
T.
Imamichi
, and
W.
Chang
.
2022
.
DAVID: A web server for functional enrichment analysis and functional annotation of gene lists (2021 update)
.
Nucleic Acids Res.
50
:
W216
–
W221
.
Siudeja
,
K.
,
B.
Srinivasan
,
L.
Xu
,
A.
Rana
,
J.
de Jong
,
E.A.A.
Nollen
,
S.
Jackowski
,
L.
Sanford
,
S.
Hayflick
, and
O.C.M.
Sibon
.
2011
.
Impaired Coenzyme A metabolism affects histone and tubulin acetylation in Drosophila and human cell models of pantothenate kinase associated neurodegeneration
.
EMBO Mol. Med.
3
:
755
–
766
.
Soler
,
D.C.
,
A.
Kerstetter-Fogle
,
A.B.
Young
,
P.
Rayman
,
J.H.
Finke
,
S.M.
Debanne
,
K.D.
Cooper
,
J.
Barnholtz-Sloan
,
A.E.
Sloan
, and
T.S.
McCormick
.
2022
.
Healthy myeloid-derived suppressor cells express the surface ectoenzyme Vanin-2 (VNN2)
.
Mol. Immunol.
142
:
1
–
10
.
Stebegg
,
M.
,
A.
Bignon
,
D.L.
Hill
,
A.
Silva-Cayetano
,
C.
Krueger
,
I.
Vanderleyden
,
S.
Innocentin
,
L.
Boon
,
J.
Wang
,
M.S.
Zand
, et al
.
2020
.
Rejuvenating conventional dendritic cells and T follicular helper cell formation after vaccination
.
Elife
.
9
:e52473.
Subramanian
,
A.
,
P.
Tamayo
,
V.K.
Mootha
,
S.
Mukherjee
,
B.L.
Ebert
,
M.A.
Gillette
,
A.
Paulovich
,
S.L.
Pomeroy
,
T.R.
Golub
,
E.S.
Lander
, and
J.P.
Mesirov
.
2005
.
Gene set enrichment analysis: A knowledge-based approach for interpreting genome-wide expression profiles
.
Proc. Natl. Acad. Sci. USA
.
102
:
15545
–
15550
.
Tang
,
D.
,
M.
Chen
,
X.
Huang
,
G.
Zhang
,
L.
Zeng
,
G.
Zhang
,
S.
Wu
, and
Y.
Wang
.
2023
.
SRplot: A free online platform for data visualization and graphing
.
PLoS One
.
18
:e0294236.
Tang
,
R.
,
N.
Acharya
,
A.
Subramanian
,
V.
Purohit
,
M.
Tabaka
,
Y.
Hou
,
D.
He
,
K.O.
Dixon
,
C.
Lambden
,
J.
Xia
, et al
.
2022
.
Tim-3 adapter protein Bat3 acts as an endogenous regulator of tolerogenic dendritic cell function
.
Sci. Immunol.
7
:eabm0631.
van der Fits
,
L.
,
S.
Mourits
,
J.S.A.
Voerman
,
M.
Kant
,
L.
Boon
,
J.D.
Laman
,
F.
Cornelissen
,
A.-M.
Mus
,
E.
Florencia
,
E.P.
Prens
, and
E.
Lubberts
.
2009
.
Imiquimod-induced psoriasis-like skin inflammation in mice is mediated via the IL-23/IL-17 Axis
.
J. Immunol.
182
:
5836
–
5845
.
van Diepen
,
J.A.
,
P.A.
Jansen
,
D.B.
Ballak
,
A.
Hijmans
,
F.P.J.T.
Rutjes
,
C.J.
Tack
,
M.G.
Netea
,
J.
Schalkwijk
, and
R.
Stienstra
.
2016
.
Genetic and pharmacological inhibition of vanin-1 activity in animal models of type 2 diabetes
.
Sci. Rep.
6
:
21906
.
Wang
,
J.
,
J.
Wang
,
W.
Hong
,
L.
Zhang
,
L.
Song
,
Q.
Shi
,
Y.
Shao
,
G.
Hao
,
C.
Fang
,
Y.
Qiu
, et al
.
2021
.
Optineurin modulates the maturation of dendritic cells to regulate autoimmunity through JAK2-STAT3 signaling
.
Nat. Commun.
12
:
6198
.
Wculek
,
S.K.
,
F.J.
Cueto
,
A.M.
Mujal
,
I.
Melero
,
M.F.
Krummel
, and
D.
Sancho
.
2020
.
Dendritic cells in cancer immunology and immunotherapy
.
Nat. Rev. Immunol.
20
:
7
–
24
.
Wu
,
L.
,
Z.
Yan
,
Y.
Jiang
,
Y.
Chen
,
J.
Du
,
L.
Guo
,
J.
Xu
,
Z.
Luo
, and
Y.
Liu
.
2023
.
Metabolic regulation of dendritic cell activation and immune function during inflammation
.
Front. Immunol.
14
:
1140749
.
Xia
,
Y.
,
Y.
Xie
,
Z.
Yu
,
H.
Xiao
,
G.
Jiang
,
X.
Zhou
,
Y.
Yang
,
X.
Li
,
M.
Zhao
,
L.
Li
, et al
.
2018
.
The mevalonate pathway is a druggable target for vaccine adjuvant discovery
.
Cell
.
175
:
1059
–
1073.e21
.
Yong
,
L.
,
Y.
Yu
,
B.
Li
,
H.
Ge
,
Q.
Zhen
,
Y.
Mao
,
Y.
Yu
,
L.
Cao
,
R.
Zhang
,
Z.
Li
, et al
.
2022
.
Calcium/calmodulin-dependent protein kinase IV promotes imiquimod-induced psoriatic inflammation via macrophages and keratinocytes in mice
.
Nat. Commun.
13
:
4255
.
Yu
,
Y.
,
M.
van der Zwaag
,
J.J.
Wedman
,
H.
Permentier
,
N.
Plomp
,
X.
Jia
,
B.
Kanon
,
E.
Eggens-Meijer
,
G.
Buist
,
H.
Harmsen
, et al
.
2022
.
Coenzyme A precursors flow from mother to zygote and from microbiome to host
.
Mol. Cell
.
82
:
2650
–
2665.e12
.
Yuan
,
X.
,
Y.
Duan
,
Y.
Xiao
,
K.
Sun
,
Y.
Qi
,
Y.
Zhang
,
Z.
Ahmed
,
D.
Moiani
,
J.
Yao
,
H.
Li
, et al
.
2022
.
Vitamin E enhances cancer immunotherapy by reinvigorating dendritic cells via targeting checkpoint SHP1
.
Cancer Discov.
12
:
1742
–
1759
.
Zhang
,
S.
,
C.
Audiger
,
M.
Chopin
, and
S.L.
Nutt
.
2023
.
Transcriptional regulation of dendritic cell development and function
.
Front. Immunol.
14
:
1182553
.
Zhang
,
X.
,
Y.
Chen
,
G.
Sun
,
Y.
Fei
,
H.
Zhu
,
Y.
Liu
,
J.
Dan
,
C.
Li
,
X.
Cao
, and
J.
Liu
.
2024
.
Farnesyl pyrophosphate potentiates dendritic cell migration in autoimmunity through mitochondrial remodelling
.
Nat. Metab.
6
:
2118
–
2137
.
Zhao
,
H.
,
Y.
Yu
,
Y.
Wang
,
L.
Zhao
,
A.
Yang
,
Y.
Hu
,
Z.
Pan
,
Z.
Wang
,
J.
Yang
,
Q.
Han
, et al
.
2022
.
Cholesterol accumulation on dendritic cells reverses chronic hepatitis B virus infection-induced dysfunction
.
Cell. Mol. Immunol.
19
:
1347
–
1360
.
Zizioli
,
D.
,
N.
Tiso
,
A.
Guglielmi
,
C.
Saraceno
,
G.
Busolin
,
R.
Giuliani
,
D.
Khatri
,
E.
Monti
,
G.
Borsani
,
F.
Argenton
, and
D.
Finazzi
.
2016
.
Knock-down of pantothenate kinase 2 severely affects the development of the nervous and vascular system in zebrafish, providing new insights into PKAN disease
.
Neurobiol. Dis.
85
:
35
–
48
.

Author notes

*

A.-P. Cao, J.-C. Li, and R. Wang contributed equally to this paper.

Disclosures: The authors declare that no competing interests exist.

This article is distributed under the terms as described at https://rupress.org/pages/terms102024/.

Data & Figures

Figure 1.
A multi-panel image depicts the upregulation of Vanin genes and their association with dendritic cell activation in autoimmune diseases. Panel A shows a dot plot of VNN1, VNN2, and VNN3 expression levels in peripheral blood mononuclear cells from patients with various autoimmune diseases compared with healthy donors. The x-axis lists the diseases, and the y-axis lists the Vanin genes. Dot size indicates the log2 fold change, and color represents the p-value. Panel B shows a heatmap of differentially expressed genes involved in vitamin and cofactor metabolism in myeloid dendritic cells from systemic lupus erythematosus patients and healthy donors. The x-axis shows the sample groups, and the y-axis lists the genes. Colors represent z-scores. Panel C shows a heatmap of coordinated expression patterns of VNN3 and dendritic cell functional gene sets in normal and psoriatic skin samples. The x-axis shows the sample groups, and the y-axis lists the genes. Colors represent z-scores. Panel D shows a dot plot of the correlation between infiltrating immune cell abundance and VNN3 expression levels in psoriasis patients. The x-axis shows the correlation coefficient, and the y-axis lists the immune cell types. Dot size indicates the absolute correlation coefficient, and color represents the p-value. Panel E shows a flow diagram and bubble plot depicting pathway enrichment analysis of vitamin and cofactor metabolism using the Kyoto Encyclopedia of Genes and Genomes database. The flow diagram shows the experimental setup, and the bubble plot shows the enriched pathways. The x-axis shows the gene ratio, and the y-axis lists the pathways. Bubble size indicates the gene count, and color represents the minus log10 false discovery rate. Panel F shows a heatmap of selected genes involved in vitamin and cofactor metabolism in bone marrow derived dendritic cells with or without lipopolysaccharide stimulation. The x-axis shows the sample groups, and the y-axis lists the genes. Colors represent z-scores. Panel G shows a heatmap of selected genes involved in vitamin and cofactor metabolism in human monocyte derived dendritic cells with or without R848 stimulation. The x-axis shows the sample groups, and the y-axis lists the genes. Colors represent z-scores.

Vanins are strongly upregulated in activated DCs across various AIDs. (A) The expression levels of the Vanin family in PBMCs of patients with AIDs from the IAAA database. (B) Heatmap showing the expression levels of DEGs involved in vitamin and cofactor metabolism in mDCs from SLE patients and healthy donors (GEO: GSE149050). (C) Heatmap showing coordinated expression patterns of VNN3 and DC functional gene sets in normal and psoriatic skin samples (GEO: GSE54456). (D) The correlation between the abundance of infiltrating immune cells estimated by CIBERSORTx and VNN3 expression levels in psoriasis patients (GEO: GSE54456). (E) Pathway enrichment analysis of vitamin and cofactor metabolism using the KEGG database. (F) Heatmap depicting the expression levels of selected genes involved in vitamin and cofactor metabolism (upregulated and downregulated: top 10) in BMDCs with or without LPS stimulation for 18 h. (G) Heatmap depicting the expression levels of selected genes involved in vitamin and cofactor metabolism (upregulated and downregulated: top 10) in human moDCs with or without R848 stimulation for 8 h (GEO: GSE2706).

Close Figure 1.
+ Expand view − Collapse view
Figure S1.
Figure S1. Refer to the image caption for details. Panel A shows an UpSet plot with multiple intersecting sets, each representing a different disease. Panel B shows a dot plot of Vanin family gene expression levels in myeloid dendritic cells from patients with various autoimmune diseases. Dot size indicates the log2 fold change, and color represents the p-value. Panel C shows a principal component analysis scatter plot of gene expression profiles from RNA sequencing data of skin samples from psoriasis patients and healthy donors, with distinct clusters for normal skin and psoriasis skin. Panel D shows a heatmap of differentially expressed genes involved in vitamin and cofactor metabolism in skin samples from psoriasis patients and healthy donors, with colors representing z-scores. Panel E shows a volcano plot of differentially expressed genes involved in vitamin and cofactor metabolism from RNA sequencing analysis of skin samples from psoriasis patients and healthy donors, with significant genes labeled. Panel F shows a heatmap of coordinated expression patterns of VNN1 and dendritic cell functional gene sets in normal and psoriatic skin samples, with colors representing z-scores. Panel G shows a box plot of changes in immune cell type proportions between VNN1 low and VNN1 high psoriasis patient samples, estimated using CIBERSORTx. Panel H shows a box plot of changes in immune cell type proportions between VNN3 low and VNN3 high psoriasis patient samples, estimated using CIBERSORTx. Panel I shows a principal component analysis scatter plot of gene expression profiles from RNA sequencing data of bone marrow derived dendritic cells with or without lipopolysaccharide stimulation. Panel J shows a volcano plot of differentially expressed genes related to vitamin and cofactor metabolism in bone marrow derived dendritic cells with or without lipopolysaccharide stimulation. Panel K shows a violin plot of relative Vnn3 and Vnn1 gene expression levels in bone marrow derived dendritic cells with or without lipopolysaccharide stimulation. Panel L shows a volcano plot of differentially expressed genes related to vitamin and cofactor metabolism in human monocyte derived dendritic cells with or without R848 stimulation.

Vanins are obviously upregulated in activated DCs across various AIDs. (A)The upset plot displays the numbers of unique and shared upregulated genes involved in metabolic pathways in mDCs across eight AIDs from the NBDC Human Database (hum0214.v3). (B) Expression levels of the Vanin family in mDCs from patients with AIDs, retrieved from the NBDC Human Database (hum0214.v3). (C) PCA of gene expression profiles from RNA-seq data of skin samples from psoriasis patients and healthy donors (GEO: GSE54456). (D) Heatmap showing the expression levels of DEGs involved in vitamin and cofactor metabolism (upregulated and downregulated: top 20) in skin samples from psoriasis patients and healthy donors (GEO: GSE54456). (E) Volcano plot of DEGs involved in vitamin and cofactor metabolism from RNA-seq analysis of skin samples in psoriasis patients and healthy donors (GEO: GSE54456). (F) Heatmap showing coordinated expression patterns of VNN1 and DC functional gene sets in normal and psoriatic skin samples (GEO: GSE54456). (G) Changes in immune cell type proportions between VNN1-low and VNN1-high psoriasis patient samples, estimated by CIBERSORTx (GEO: GSE54456). (H) Changes in immune cell type proportions between VNN3-low and VNN3-high psoriasis patient samples, estimated by CIBERSORTx (GEO: GSE54456). (I) PCA of gene expression profiles from RNA-seq data of BMDCs with or without LPS stimulation for 18 h (n = 3). (J) Volcano plot of DEGs related to vitamin and cofactor metabolism from BMDCs with or without LPS stimulation for 18 h (n = 3). (K) Relative expression levels of Vnn3 and Vnn1 genes in BMDCs with or without LPS stimulation. (L) Volcano plot of DEGs related to vitamin and cofactor metabolism from human moDCs with or without R848 stimulation for 8 h (GEO: GSE2706). Data are presented as mean ± SD. ****P < 0.0001; NS, not significant. Unpaired two-tailed Student’s t test.

Figure S1.
A multi-panel image depicts data on Vanin gene expression in autoimmune diseases. Panel A shows an UpSet plot with multiple intersecting sets, each representing a different disease. Panel B shows a dot plot of Vanin family gene expression levels in myeloid dendritic cells from patients with various autoimmune diseases. Dot size indicates the log2 fold change, and color represents the p-value. Panel C shows a principal component analysis scatter plot of gene expression profiles from RNA sequencing data of skin samples from psoriasis patients and healthy donors, with distinct clusters for normal skin and psoriasis skin. Panel D shows a heatmap of differentially expressed genes involved in vitamin and cofactor metabolism in skin samples from psoriasis patients and healthy donors, with colors representing z-scores. Panel E shows a volcano plot of differentially expressed genes involved in vitamin and cofactor metabolism from RNA sequencing analysis of skin samples from psoriasis patients and healthy donors, with significant genes labeled. Panel F shows a heatmap of coordinated expression patterns of VNN1 and dendritic cell functional gene sets in normal and psoriatic skin samples, with colors representing z-scores. Panel G shows a box plot of changes in immune cell type proportions between VNN1 low and VNN1 high psoriasis patient samples, estimated using CIBERSORTx. Panel H shows a box plot of changes in immune cell type proportions between VNN3 low and VNN3 high psoriasis patient samples, estimated using CIBERSORTx. Panel I shows a principal component analysis scatter plot of gene expression profiles from RNA sequencing data of bone marrow derived dendritic cells with or without lipopolysaccharide stimulation. Panel J shows a volcano plot of differentially expressed genes related to vitamin and cofactor metabolism in bone marrow derived dendritic cells with or without lipopolysaccharide stimulation. Panel K shows a violin plot of relative Vnn3 and Vnn1 gene expression levels in bone marrow derived dendritic cells with or without lipopolysaccharide stimulation. Panel L shows a volcano plot of differentially expressed genes related to vitamin and cofactor metabolism in human monocyte derived dendritic cells with or without R848 stimulation.

Vanins are obviously upregulated in activated DCs across various AIDs. (A)The upset plot displays the numbers of unique and shared upregulated genes involved in metabolic pathways in mDCs across eight AIDs from the NBDC Human Database (hum0214.v3). (B) Expression levels of the Vanin family in mDCs from patients with AIDs, retrieved from the NBDC Human Database (hum0214.v3). (C) PCA of gene expression profiles from RNA-seq data of skin samples from psoriasis patients and healthy donors (GEO: GSE54456). (D) Heatmap showing the expression levels of DEGs involved in vitamin and cofactor metabolism (upregulated and downregulated: top 20) in skin samples from psoriasis patients and healthy donors (GEO: GSE54456). (E) Volcano plot of DEGs involved in vitamin and cofactor metabolism from RNA-seq analysis of skin samples in psoriasis patients and healthy donors (GEO: GSE54456). (F) Heatmap showing coordinated expression patterns of VNN1 and DC functional gene sets in normal and psoriatic skin samples (GEO: GSE54456). (G) Changes in immune cell type proportions between VNN1-low and VNN1-high psoriasis patient samples, estimated by CIBERSORTx (GEO: GSE54456). (H) Changes in immune cell type proportions between VNN3-low and VNN3-high psoriasis patient samples, estimated by CIBERSORTx (GEO: GSE54456). (I) PCA of gene expression profiles from RNA-seq data of BMDCs with or without LPS stimulation for 18 h (n = 3). (J) Volcano plot of DEGs related to vitamin and cofactor metabolism from BMDCs with or without LPS stimulation for 18 h (n = 3). (K) Relative expression levels of Vnn3 and Vnn1 genes in BMDCs with or without LPS stimulation. (L) Volcano plot of DEGs related to vitamin and cofactor metabolism from human moDCs with or without R848 stimulation for 8 h (GEO: GSE2706). Data are presented as mean ± SD. ****P < 0.0001; NS, not significant. Unpaired two-tailed Student’s t test.

Close Figure S1.
Figure 2.
A multi-panel image depicts the expression and effects of Vanin family genes in dendritic cell activation and T cell priming. Panel A shows bar graphs of quantitative reverse transcription polymerase chain reaction analysis for VNN1, VNN2, and VNN3 messenger RNA expression in R848 stimulated human monocyte derived dendritic cells from three different donors. The x-axis represents different conditions, including negative control and R848, and the y-axis represents relative expression levels. Panel B shows bar graphs of flow cytometry analysis of membrane CD80 and human leukocyte antigen A, B, and C expression in human monocyte derived dendritic cells transfected with small interfering RNA targeting VNN1, VNN2, VNN3, alone or together, and treated with or without R848. The x-axis shows different small interfering RNA treatments and conditions, and the y-axis shows mean fluorescence intensity. Panel C shows a bar graph of quantitative reverse transcription polymerase chain reaction analysis for Vnn3 messenger RNA expression in lipopolysaccharide stimulated bone marrow derived dendritic cells. The x-axis represents different conditions, including negative control and lipopolysaccharide, and the y-axis shows relative expression levels. Panel D shows flow cytometry plots and a bar graph of the percentage of enhanced green fluorescent protein positive and YAe positive cells in Vnn3 positive positive and Vnn3 negative negative bone marrow derived dendritic cells following an in vitro antigen uptake and presentation assay with enhanced green fluorescent protein protein. The x-axis of the bar graph represents different genotypes, and the y-axis shows the percentage of enhanced green fluorescent protein positive and YAe positive cells. Panel E shows bar graphs of flow cytometry analysis for major histocompatibility complex class 1, major histocompatibility complex class 2, CD80, and CD86 expression in Vnn3 positive positive and Vnn3 negative negative bone marrow derived dendritic cells. The x-axis represents different genotypes and conditions, and the y-axis shows mean fluorescence intensity. Panel F shows a histogram and a bar graph of the proliferation rate of carboxyfluorescein succinimidyl ester labeled OT-2 CD4 positive T cells incubated with Vnn3 positive positive or Vnn3 negative negative bone marrow derived dendritic cells pulsed with ovalbumin 323 to 339. The histogram x-axis shows carboxyfluorescein succinimidyl ester intensity, and the y-axis shows cell count. The bar graph x-axis represents different genotypes and conditions, and the y-axis shows the percentage of carboxyfluorescein succinimidyl ester low cells. Panel G shows flow cytometry plots and a bar graph of interferon gamma expression in OT-2 CD4 positive T cells incubated with Vnn3 positive positive or Vnn3 negative negative bone marrow derived dendritic cells pulsed with ovalbumin 323 to 339. The x-axis of the bar graph represents different genotypes and conditions, and the y-axis shows the percentage of cytokine expressing CD4 positive T cells. Panel H shows flow cytometry plots and a bar graph of interleukin 17A expression in OT-2 CD4 positive T cells incubated with Vnn3 positive positive or Vnn3 negative negative bone marrow derived dendritic cells pulsed with ovalbumin 323 to 339. The x-axis represents different genotypes and conditions, and the y-axis shows the percentage of cytokine expressing CD4 positive T cells. Panel I shows flow cytometry plots and a bar graph of interleukin 4 expression in OT-2 CD4 positive T cells incubated with Vnn3 positive positive or Vnn3 negative negative bone marrow derived dendritic cells pulsed with ovalbumin 323 to 339. The x-axis represents different genotypes and conditions, and the y-axis shows the percentage of cytokine expressing CD4 positive T cells.

Vanins contribute to DC activation and its associated T cell priming. (A) qRT-PCR analysis of VNN1, VNN2, and VNN3 mRNA expression in R848-stimulated human moDCs. (B) Expression levels of membrane CD80 and HLA-A,B,C in human moDCs transfected with siVNN1, siVNN2, siVNN3 alone or transfected with siVNN1-3 together, treated with or without R848. (C) qRT-PCR analysis of Vnn3 mRNA expression in LPS-stimulated BMDCs. (D) Representative flow cytometry plots (left) and statistical analysis (right) showing the percentage of EGFP+YAe+ cells in Vnn3+/+ and Vnn3−/− BMDCs following an in vitro antigen uptake and presentation assay with EαEGFP protein. (E) Flow cytometry analysis showing the expression levels of MHC-I, MHC-II, CD80, and CD86 in Vnn3+/+ and Vnn3−/− BMDCs. (F) Proliferation rate of CFSE-labeled OT-II CD4+ T cells incubated with Vnn3+/+ or Vnn3−/− BMDCs pulsed with OVA323–339. (G–I) Flow cytometry analysis (left) and quantification (right) of IFN-γ (G), IL-17A (H), and IL-4 (I) expression in OT-II CD4+ T cells incubated with Vnn3+/+ or Vnn3−/− BMDCs pulsed with OVA323–339. Data are representative of three individual human donors (B) or three experiments (C–I). Each dot represents a biological replicate. Data are presented as mean ± SD. *P < 0.05, **P < 0.01, ***P < 0.001, and ****P < 0.0001. Unpaired two-tailed Student’s t test.

Close Figure 2.
+ Expand view − Collapse view
Figure S2.
Figure S2. Refer to the image caption for details. Panel A shows vertical bar graphs of relative VNN1, VNN2, and VNN3 messenger RNA expression levels in human monocyte derived dendritic cells after transfection with small interfering RNA targeting VNN1, VNN2, VNN3, or VNN1 through VNN3. Panel B shows a vertical bar graph of quantitative reverse transcription polymerase chain reaction analysis of Vnn3 expression following transfection with two small interfering RNAs targeting Vnn3. Panel C shows vertical bar graphs of flow cytometry analysis of major histocompatibility complex class 1, major histocompatibility complex class 2, CD80, and CD86 expression in bone marrow derived dendritic cells following Vnn3 knockdown or negative control after lipopolysaccharide stimulation. Panel D shows a vertical bar graph of flow cytometry analysis of the percentage of enhanced green fluorescent protein positive and YAe positive cells in control and Vnn3 knockdown bone marrow derived dendritic cells. Panel E shows vertical bar graphs of flow cytometry analysis of the proliferation rate of carboxyfluorescein succinimidyl ester labeled OT-2 CD4 positive T cells and quantification of interferon gamma, interleukin 4, and interleukin 17A in OT-2 CD4 positive T cells incubated with ovalbumin 323 to 339 pulsed bone marrow derived dendritic cells transfected with small interfering RNA targeting Vnn3 or negative control small interfering RNA. Panel F shows a schematic diagram of the knockout strategy for generating Vnn3 knockout mice. Panel G shows vertical bar graphs of Vnn3 messenger RNA expression in Vnn3 positive positive and Vnn3 negative negative bone marrow derived dendritic cells, bone marrow, and spleen. Panel H shows flow cytometry overlay histograms of major histocompatibility complex class 1, major histocompatibility complex class 2, CD80, and CD86 expression in Vnn3 positive positive and Vnn3 negative negative bone marrow derived dendritic cells. Panel I shows vertical bar graphs of flow cytometry analysis of the proliferation rate of carboxyfluorescein succinimidyl ester labeled OT-2 CD4 positive T cells and quantification of interferon gamma, interleukin 4, and interleukin 17A in OT-2 CD4 positive T cells incubated with Vnn3 positive positive or Vnn3 negative negative bone marrow derived dendritic cells pulsed with ovalbumin protein. Panel J shows a vertical bar graph of the frequency of CD25 positive Foxp3 positive cells in OT-2 CD4 positive T cells incubated with Vnn3 positive positive or Vnn3 negative negative bone marrow derived dendritic cells pulsed with ovalbumin 323 to 339. Panel K shows vertical bar graphs of relative messenger RNA expression levels of Il6, Il1b, Tnf, Il12, Il10, and Cd274 in Vnn3 positive positive or Vnn3 negative negative bone marrow derived dendritic cells treated with or without lipopolysaccharide. Panel L shows a line graph of back thickness over time in DT treated Itgax DTR tdTomato mice transferred with Vnn3 positive positive or Vnn3 negative negative bone marrow derived dendritic cells and treated with imiquimod cream. Panel M shows a line graph of body weight changes over time in the same mice. Panel N shows hematoxylin and eosin staining images of skin sections from the mice. Panel O shows representative spleen images, spleen weight, and spleen index after bone marrow derived dendritic cell transfer. Panel P shows vertical bar graphs of relative messenger RNA expression of Ifng, Tnf, Il23, Il22, Il17a, and Il17f in skin. Panel Q shows a vertical bar graph of the percentage of CD11c positive cells in draining lymph nodes. Panel R shows a schematic diagram illustrating the strategy for generating Vnn3 conditional knockout mice. Panel S shows a vertical bar graph of Vnn3 messenger RNA expression in different cell types isolated from Vnn3 floxed or Vnn3 floxed Cd11c Cre mice. Panel T shows a line graph of body weight changes over time in Vnn3 floxed or Vnn3 floxed Cd11c Cre mice treated with imiquimod cream. Panel U shows representative spleen images, spleen weights, and spleen index. Panel V shows vertical bar graphs of flow cytometry analysis of dendritic cell maturation in draining lymph nodes and psoriatic skin. Panel W shows vertical bar graphs of flow cytometry quantification of viable CD11c positive cells, Annexin V positive apoptotic CD11c positive cells, dendritic cell subsets, and CCR7 positive CD11c positive cells in the spleen. Panel X shows vertical bar graphs of the same flow cytometry quantification in draining lymph nodes. Panel Y shows vertical bar graphs of the same flow cytometry quantification in skin. Panel Z shows vertical bar graphs of apoptotic CD11c positive cell proportion, CD11c positive CCR7 positive cell proportion, and reactive oxygen species levels in bone marrow derived dendritic cells isolated from Vnn3 floxed or Vnn3 floxed Cd11c Cre mice.

Loss of Vnn3 suppresses DC activation and its associated T cell priming and alleviates IMQ-induced psoriatic inflammation. (A) Human moDC VNN1, VNN2, and VNN3 mRNA expression after transfection with siVNN1, siVNN2, and siVNN3 alone or transfection with siVNN1-3 together. (B) qRT-PCR analysis of Vnn3 expression following transfection with two siRNAs targeting Vnn3 (siVnn3). (C) Statistical analysis of flow cytometry for expression levels of MHC-I, MHC-II, CD80, and CD86 in BMDCs following Vnn3 knockdown (siVnn3) or negative control (siNC) after LPS stimulation. (D) Statistical analysis of flow cytometry for the percentage of EGFP+YAe+ cells in control and Vnn3 knockdown BMDCs following an in vitro antigen uptake and presentation assay with EαEGFP protein. (E) Statistical analysis of flow cytometry for proliferation rate of CFSE-labeled OT-II CD4+ T cells and quantification of IFN-γ, IL-4, and IL-17A in OT-II CD4+ T cells incubated with OVA323–339-pulsed BMDCs transfected with siVnn3 or siNC. (F) Schematic diagram of the KO strategy for Vnn3−/− mice generation. (G)Vnn3 mRNA expression in Vnn3+/+ or Vnn3−/− BMDCs, bone marrow, and spleen. (H) Representative flow cytometry overlay histograms showing the expression levels of MHC-I, MHC-II, CD80, and CD86 in Vnn3+/+ and Vnn3−/− BMDCs. (I) Statistical analysis of flow cytometry for proliferation rate of CFSE-labeled OT-II CD4+ T cells and quantification of IFN-γ, IL-4, and IL-17A in OT-II CD4+ T cells incubated with Vnn3+/+ or Vnn3−/− BMDCs pulsed with OVA protein. (J) Frequencies of CD25+Foxp3+ cells in OT-II CD4+ T cells incubated with Vnn3+/+ or Vnn3−/− BMDCs pulsed with OVA323–339. (K) Relative mRNA expression levels of Il6, Il1b, Tnf, Il12, Il10, and Cd274 in Vnn3+/+ or Vnn3–/–BMDCs treated with or without LPS. (L–Q) DT-treated Itgax(CD11c)-DTR/tdTomato mice were transferred with Vnn3+/+ or Vnn3−/− BMDCs and treated daily with 62.5 mg IMQ cream on the shaved back for 6 consecutive days. Back thickness (L) and body weight changes (M) of IMQ-induced Itgax-DTR mice following adoptive transfer of Vnn3+/+ or Vnn3−/− BMDCs. H&E staining of skin sections (N; scale bar = 500 μm). Representative spleen images, spleen weight, and spleen index (O) after BMDC transfer. Relative mRNA expression of Ifng, Tnf, Il23, Il22, Il17a, and Il17f in skin (P). Percentage of CD11c+ cells in DLNs (Q). (R) Schematic diagram illustrating the strategy for generating Vnn3 conditional KO (Vnn3fl/flCd11ccre) mice. (S)Vnn3 mRNA expression in different cell types isolated from Vnn3fl/fl or Vnn3fl/flCd11ccre mice. (T–V)Vnn3fl/fl or Vnn3fl/flCd11ccre mice were treated daily with 62.5 mg IMQ cream on the shaved back for 6 consecutive days. Body weight changes (T), representative spleen images (U), weight of spleens (U), and spleen index (U). Statistical analysis of flow cytometry for DC maturation in DLNs (V, left) and psoriatic skin (V, right). (W–Y) Flow cytometric quantification of the frequency of viable CD11c+ cells, Annexin V+ apoptotic CD11c+ cells, DC subsets (pDC, cDC1, resident cDC, and migratory cDC), and CCR7+ CD11c+ proportions in the spleen (W), DLNs (X), and skin (Y) from Vnn3fl/fl or Vnn3fl/flCD11ccre mice under steady-state conditions. (Z) Apoptotic CD11c+ cells proportion, CD11c+CCR7+ cells proportion, and ROS levels in BMDCs isolated from Vnn3fl/fl or Vnn3fl/flCd11ccre mice. Data are representative of three individual human donors (A) or three experiments. Each dot represents a biological replicate (A–E and H–K) or an individual mouse (G and L–Z, n = 3–6 mice/group). Data are presented as mean ± SD. *P < 0.05, **P < 0.01, ***P < 0.001, and ****P < 0.0001; NS, not significant. Unpaired two-tailed Student’s t test.

Figure S2.
A multi-panel image depicts data on Vnn3 expression and its effects on DC activation and T cell priming. Panel A shows vertical bar graphs of relative VNN1, VNN2, and VNN3 messenger RNA expression levels in human monocyte derived dendritic cells after transfection with small interfering RNA targeting VNN1, VNN2, VNN3, or VNN1 through VNN3. Panel B shows a vertical bar graph of quantitative reverse transcription polymerase chain reaction analysis of Vnn3 expression following transfection with two small interfering RNAs targeting Vnn3. Panel C shows vertical bar graphs of flow cytometry analysis of major histocompatibility complex class 1, major histocompatibility complex class 2, CD80, and CD86 expression in bone marrow derived dendritic cells following Vnn3 knockdown or negative control after lipopolysaccharide stimulation. Panel D shows a vertical bar graph of flow cytometry analysis of the percentage of enhanced green fluorescent protein positive and YAe positive cells in control and Vnn3 knockdown bone marrow derived dendritic cells. Panel E shows vertical bar graphs of flow cytometry analysis of the proliferation rate of carboxyfluorescein succinimidyl ester labeled OT-2 CD4 positive T cells and quantification of interferon gamma, interleukin 4, and interleukin 17A in OT-2 CD4 positive T cells incubated with ovalbumin 323 to 339 pulsed bone marrow derived dendritic cells transfected with small interfering RNA targeting Vnn3 or negative control small interfering RNA. Panel F shows a schematic diagram of the knockout strategy for generating Vnn3 knockout mice. Panel G shows vertical bar graphs of Vnn3 messenger RNA expression in Vnn3 positive positive and Vnn3 negative negative bone marrow derived dendritic cells, bone marrow, and spleen. Panel H shows flow cytometry overlay histograms of major histocompatibility complex class 1, major histocompatibility complex class 2, CD80, and CD86 expression in Vnn3 positive positive and Vnn3 negative negative bone marrow derived dendritic cells. Panel I shows vertical bar graphs of flow cytometry analysis of the proliferation rate of carboxyfluorescein succinimidyl ester labeled OT-2 CD4 positive T cells and quantification of interferon gamma, interleukin 4, and interleukin 17A in OT-2 CD4 positive T cells incubated with Vnn3 positive positive or Vnn3 negative negative bone marrow derived dendritic cells pulsed with ovalbumin protein. Panel J shows a vertical bar graph of the frequency of CD25 positive Foxp3 positive cells in OT-2 CD4 positive T cells incubated with Vnn3 positive positive or Vnn3 negative negative bone marrow derived dendritic cells pulsed with ovalbumin 323 to 339. Panel K shows vertical bar graphs of relative messenger RNA expression levels of Il6, Il1b, Tnf, Il12, Il10, and Cd274 in Vnn3 positive positive or Vnn3 negative negative bone marrow derived dendritic cells treated with or without lipopolysaccharide. Panel L shows a line graph of back thickness over time in DT treated Itgax DTR tdTomato mice transferred with Vnn3 positive positive or Vnn3 negative negative bone marrow derived dendritic cells and treated with imiquimod cream. Panel M shows a line graph of body weight changes over time in the same mice. Panel N shows hematoxylin and eosin staining images of skin sections from the mice. Panel O shows representative spleen images, spleen weight, and spleen index after bone marrow derived dendritic cell transfer. Panel P shows vertical bar graphs of relative messenger RNA expression of Ifng, Tnf, Il23, Il22, Il17a, and Il17f in skin. Panel Q shows a vertical bar graph of the percentage of CD11c positive cells in draining lymph nodes. Panel R shows a schematic diagram illustrating the strategy for generating Vnn3 conditional knockout mice. Panel S shows a vertical bar graph of Vnn3 messenger RNA expression in different cell types isolated from Vnn3 floxed or Vnn3 floxed Cd11c Cre mice. Panel T shows a line graph of body weight changes over time in Vnn3 floxed or Vnn3 floxed Cd11c Cre mice treated with imiquimod cream. Panel U shows representative spleen images, spleen weights, and spleen index. Panel V shows vertical bar graphs of flow cytometry analysis of dendritic cell maturation in draining lymph nodes and psoriatic skin. Panel W shows vertical bar graphs of flow cytometry quantification of viable CD11c positive cells, Annexin V positive apoptotic CD11c positive cells, dendritic cell subsets, and CCR7 positive CD11c positive cells in the spleen. Panel X shows vertical bar graphs of the same flow cytometry quantification in draining lymph nodes. Panel Y shows vertical bar graphs of the same flow cytometry quantification in skin. Panel Z shows vertical bar graphs of apoptotic CD11c positive cell proportion, CD11c positive CCR7 positive cell proportion, and reactive oxygen species levels in bone marrow derived dendritic cells isolated from Vnn3 floxed or Vnn3 floxed Cd11c Cre mice.

Loss of Vnn3 suppresses DC activation and its associated T cell priming and alleviates IMQ-induced psoriatic inflammation. (A) Human moDC VNN1, VNN2, and VNN3 mRNA expression after transfection with siVNN1, siVNN2, and siVNN3 alone or transfection with siVNN1-3 together. (B) qRT-PCR analysis of Vnn3 expression following transfection with two siRNAs targeting Vnn3 (siVnn3). (C) Statistical analysis of flow cytometry for expression levels of MHC-I, MHC-II, CD80, and CD86 in BMDCs following Vnn3 knockdown (siVnn3) or negative control (siNC) after LPS stimulation. (D) Statistical analysis of flow cytometry for the percentage of EGFP+YAe+ cells in control and Vnn3 knockdown BMDCs following an in vitro antigen uptake and presentation assay with EαEGFP protein. (E) Statistical analysis of flow cytometry for proliferation rate of CFSE-labeled OT-II CD4+ T cells and quantification of IFN-γ, IL-4, and IL-17A in OT-II CD4+ T cells incubated with OVA323–339-pulsed BMDCs transfected with siVnn3 or siNC. (F) Schematic diagram of the KO strategy for Vnn3−/− mice generation. (G)Vnn3 mRNA expression in Vnn3+/+ or Vnn3−/− BMDCs, bone marrow, and spleen. (H) Representative flow cytometry overlay histograms showing the expression levels of MHC-I, MHC-II, CD80, and CD86 in Vnn3+/+ and Vnn3−/− BMDCs. (I) Statistical analysis of flow cytometry for proliferation rate of CFSE-labeled OT-II CD4+ T cells and quantification of IFN-γ, IL-4, and IL-17A in OT-II CD4+ T cells incubated with Vnn3+/+ or Vnn3−/− BMDCs pulsed with OVA protein. (J) Frequencies of CD25+Foxp3+ cells in OT-II CD4+ T cells incubated with Vnn3+/+ or Vnn3−/− BMDCs pulsed with OVA323–339. (K) Relative mRNA expression levels of Il6, Il1b, Tnf, Il12, Il10, and Cd274 in Vnn3+/+ or Vnn3–/–BMDCs treated with or without LPS. (L–Q) DT-treated Itgax(CD11c)-DTR/tdTomato mice were transferred with Vnn3+/+ or Vnn3−/− BMDCs and treated daily with 62.5 mg IMQ cream on the shaved back for 6 consecutive days. Back thickness (L) and body weight changes (M) of IMQ-induced Itgax-DTR mice following adoptive transfer of Vnn3+/+ or Vnn3−/− BMDCs. H&E staining of skin sections (N; scale bar = 500 μm). Representative spleen images, spleen weight, and spleen index (O) after BMDC transfer. Relative mRNA expression of Ifng, Tnf, Il23, Il22, Il17a, and Il17f in skin (P). Percentage of CD11c+ cells in DLNs (Q). (R) Schematic diagram illustrating the strategy for generating Vnn3 conditional KO (Vnn3fl/flCd11ccre) mice. (S)Vnn3 mRNA expression in different cell types isolated from Vnn3fl/fl or Vnn3fl/flCd11ccre mice. (T–V)Vnn3fl/fl or Vnn3fl/flCd11ccre mice were treated daily with 62.5 mg IMQ cream on the shaved back for 6 consecutive days. Body weight changes (T), representative spleen images (U), weight of spleens (U), and spleen index (U). Statistical analysis of flow cytometry for DC maturation in DLNs (V, left) and psoriatic skin (V, right). (W–Y) Flow cytometric quantification of the frequency of viable CD11c+ cells, Annexin V+ apoptotic CD11c+ cells, DC subsets (pDC, cDC1, resident cDC, and migratory cDC), and CCR7+ CD11c+ proportions in the spleen (W), DLNs (X), and skin (Y) from Vnn3fl/fl or Vnn3fl/flCD11ccre mice under steady-state conditions. (Z) Apoptotic CD11c+ cells proportion, CD11c+CCR7+ cells proportion, and ROS levels in BMDCs isolated from Vnn3fl/fl or Vnn3fl/flCd11ccre mice. Data are representative of three individual human donors (A) or three experiments. Each dot represents a biological replicate (A–E and H–K) or an individual mouse (G and L–Z, n = 3–6 mice/group). Data are presented as mean ± SD. *P < 0.05, **P < 0.01, ***P < 0.001, and ****P < 0.0001; NS, not significant. Unpaired two-tailed Student’s t test.

Close Figure S2.
Figure 3.
A multi-panel image depicts the effects of Vnn3 loss in dendritic cells on IMQ-induced psoriatic inflammation in mice. Panel A shows a diagram of the experimental procedure for bone marrow derived dendritic cell adoptive transfer into diphtheria toxin treated Itgax (CD11c)-DTR/tdTomato mice. Panel B shows images of mice with skin lesions. Panel C shows a line graph of PASI scores over time, with days on the x-axis and PASI scores on the y-axis. Panel D shows a bar graph of the percentage of CD11c positive cells in the skin. Panel E shows violin plots of the percentages of CD80, CD86, major histocompatibility complex class 1, and major histocompatibility complex class 2 in CD45 positive CD11c positive cells in the skin and draining lymph nodes. Panel F shows a bar graph of the percentage of CD3 positive CD4 positive cells in the skin. Panel G shows images of dorsal skin from Vnn3 floxed and Vnn3 floxed Cd11c Cre mice. Panel H shows a line graph of back skin thickness over time, with days on the x-axis and thickness in centimeters on the y-axis. Panel I shows a line graph of PASI scores over time, with days on the x-axis and PASI scores on the y-axis. Panel J shows hematoxylin and eosin staining of skin sections. Panel K shows a bar graph of relative messenger RNA expression levels of various genes in the skin. Panel L shows a bar graph of the percentage of CD11c positive cells in the draining lymph node. Panel M shows a bar graph of the percentage of CD11c positive cells in the skin. Panel N shows flow cytometry plots and a bar graph of CD3 positive CD4 positive cells in the skin.

Loss of Vnn3 in DCs alleviates IMQ-induced psoriatic inflammation. (A–F) DT-treated Itgax (CD11c)-DTR/tdTomato mice were transferred with Vnn3+/+ or Vnn3−/− BMDCs and treated daily with 62.5 mg IMQ cream or Vaseline on the shaved back for 6 consecutive days. A diagram describing the experimental procedure of BMDC adoptive transfer into DT-treated Itgax (CD11c)-DTR/tdTomato mice is shown (A). Representative phenotypic presentation of skin lesions (B) and PASI scores (C) indicating psoriasis severity. Statistical analysis of CD11c+ cells (D), DC maturation in psoriatic skin (E, left) and DLN (E, right), as well as CD3+CD4+ cells in psoriatic skin (F), was performed by flow cytometry. (G–N)Vnn3fl/fl or Vnn3fl/flCD11ccre mice were treated daily with 62.5 mg IMQ cream or Vaseline on the shaved back for 6 consecutive days. Representative images of dorsal skin (G), back thickness changes (H), PASI scores (I), and H&E staining of skin sections (J; scale bar = 500 μm). Relative mRNA expression levels of Ifng, Tnf, Il23, Il22, Il17a, and Il17f in skin (K). The percentage of CD11c+ cells in DLNs (L) and skin (M) and CD3+CD4+ cells in psoriatic skin (N) were analyzed by FACS. Each dot represents an individual mouse, n = 4–6 mice/group. Data are presented as mean ± SD. **P < 0.01, ***P < 0.001, and ****P < 0.0001. Unpaired two-tailed Student’s t test.

Close Figure 3.
Figure 4.
A multi-panel image depicts the effects of pantethine on dendritic cell activation and psoriasis in mice. Panel A shows a schematic diagram of the experimental procedure involving Pan, PA, and Cys treatment. Panel B shows vertical bar graphs of relative expression levels on a log 2 scale in bone marrow derived dendritic cells treated with Pan or PA and in plasma treated with Pan or PA, comparing Vnn3 wild type and Vnn3 knockout samples. Panel C shows vertical bar graphs of relative expression levels in bone marrow derived dendritic cells and plasma, comparing Vnn3 wild type and Vnn3 knockout samples. Panel D shows flow cytometry plots of enhanced green fluorescent protein and YAe, with a bar graph showing the percentage of enhanced green fluorescent protein positive and YAe positive cells in vehicle and Pan conditions. Panel E shows vertical bar graphs of mean fluorescence intensity for CD80, CD86, major histocompatibility complex class 1, and major histocompatibility complex class 2 in vehicle and Pan conditions. Panel F shows flow cytometry histograms of carboxyfluorescein succinimidyl ester labeled OT-2 cells and a bar graph of the percentage of carboxyfluorescein succinimidyl ester low cells under control, vehicle, and Pan conditions after lipopolysaccharide and ovalbumin stimulation. Panel G shows vertical bar graphs of the percentages of interferon gamma positive CD4 positive T cells, interleukin 17 positive CD4 positive T cells, and interleukin 4 positive CD4 positive T cells under control, vehicle, and Pan conditions. Panel H shows vertical bar graphs of mean fluorescence intensity for human leukocyte antigen A, B, C, human leukocyte antigen DR, CD80, and CD86 in human monocyte derived dendritic cells treated with vehicle or Pan. Panel I shows representative images of mice and dorsal skin under control, vehicle, and Pan conditions after imiquimod treatment. Panel J shows a line graph of PASI scores over time from day 0 to day 5, with time in days on the x-axis and PASI score on the y-axis, comparing control, vehicle, and Pan conditions after imiquimod treatment. Panel K shows flow cytometry plots of CD11c and CD45 expression and a bar graph of the percentage of CD11c positive cells in draining lymph nodes after imiquimod treatment. Panel L shows a vertical bar graph of the percentage of CD11c positive cells in the skin after imiquimod treatment. Panel M shows violin plots of CD80, CD86, major histocompatibility complex class 1, and major histocompatibility complex class 2 percentages in cells gated on CD45 positive CD11c positive cells from draining lymph nodes and skin. Panel N shows a vertical bar graph of the percentage of CD3 positive CD4 positive cells in the skin after imiquimod treatment.

Vanin-associated pantethine significantly suppresses DC activation and ameliorates IMQ-induced psoriasis in mice. (A) Schematic diagram of pantethine hydrolysis by Vanin enzymes, producing pantothenate and cysteamine. (B) Relative pantethine (left) and pantothenate (right) levels in Vnn3+/+ and Vnn3−/− BMDCs, measured by LC/MS. (C) Relative plasma pantethine (left) and pantothenate (right) levels of Vnn3+/+ or Vnn3−/− mice, measured by LC/MS. (D) Representative flow cytometry plots (left) and statistical analysis (right) showing the percentage of EGFP+YAe+ cells in vehicle- or pantethine-treated BMDCs after an in vitro antigen uptake and presentation assay with EαEGFP protein. (E) Statistical analysis of flow cytometry for expression levels of CD80, CD86, MHC-I, and MHC-II in BMDCs treated with vehicle or pantethine and stimulated with LPS. (F) Proliferation rate of CFSE-labeled OT-II CD4+ T cells incubated with vehicle- or pantethine-treated BMDCs pulsed with OVA323–339. (G) Flow cytometry analysis and quantification of IFN-γ, IL-17A, and IL-4 in OT-II CD4+ T cells incubated with vehicle- or pantethine-treated BMDCs pulsed with OVA323–339. (H) Statistical analysis of flow cytometry for expression levels of HLA-A,B,C, HLA-DR, CD80, and CD86 in human mDCs treated with vehicle or pantethine. (I–N) Mice were i.p. injected with either vehicle or pantethine during IMQ application. Representative images of back skin (I), PASI scores indicating disease severity (J), statistical analysis of CD11c+ cells in DLNs (K) and psoriatic skin (L), DC maturation in DLNs (M, left) and skin (M, right), and statistical analysis of CD3+CD4+ cells in skin (N) were analyzed by flow cytometry. Data are representative of three individual experiments (D–H). Each dot represents a biological replicate (D–H) or an individual mouse (B and C; I–N, n = 3–7 mice/group). Data are presented as mean ± SD. *P < 0.05, **P < 0.01, ***P < 0.001, and ****P < 0.0001; NS, not significant. Unpaired two-tailed Student’s t test.

Close Figure 4.
+ Expand view − Collapse view
Figure S3.
Figure S3. Refer to the image caption for details. Panel A shows vertical bar graphs of relative messenger RNA expression in bone marrow derived dendritic cells treated with vehicle or lipopolysaccharide, comparing Vnn3 wild type and Vnn3 knockout conditions. Panel B shows vertical bar graphs of relative Vnn3 messenger RNA expression on a log 2 scale in Vnn3 floxed and Vnn3 floxed Cd11c Cre bone marrow derived dendritic cells. Panel C shows a vertical bar graph of relative messenger RNA expression on a log 2 scale in vehicle and Pan treated conditions. Panel D shows vertical bar graphs of interferon gamma, interleukin 17A, and interleukin 4 concentrations in control, vehicle, and Pan treated conditions. Panel E shows vertical bar graphs of mean fluorescence intensity for human leukocyte antigen A, B, and C; human leukocyte antigen DR; CD80; and CD86 in human monocyte-derived dendritic cells treated with vehicle or Pan. Panel F shows a schematic diagram of Pan intraperitoneal administration and imiquimod treatment over days 0 to 4, followed by sample harvesting on day 5. Panel G shows a line graph of back skin thickness over time, with time in days on the x-axis and back skin thickness in millimeters on the y-axis, comparing control, vehicle, and Pan conditions after imiquimod treatment. Panel H shows a line graph of body weight over time, with time in days on the x-axis and body weight in grams on the y-axis, comparing control, vehicle, and Pan conditions after imiquimod treatment. Panel I shows hematoxylin and eosin stained skin sections from control, vehicle, and Pan conditions after imiquimod treatment. Panel J shows representative spleen images from control, vehicle, and Pan conditions after imiquimod treatment. Panel K shows vertical bar graphs of spleen weight and spleen index in control, vehicle, and Pan conditions after imiquimod treatment. Panel L shows vertical bar graphs of relative messenger RNA expression of Ifng, Tnf, Il23, Il17a, Il17f, and Il22 in vehicle and Pan treated skin after imiquimod treatment. Panel M shows a vertical bar graph of relative messenger RNA expression on a log 2 scale in plasma from vehicle and Pan conditions. Panel N shows a vertical bar graph of Vnn3 messenger RNA expression in control and imiquimod treated conditions. Panel O shows vertical bar graphs of relative expression levels in plasma treated with Pan or PA under control and imiquimod conditions. Panel P shows a schematic diagram of bone marrow derived dendritic cell transfer into CD11c-DTR mice, followed by diphtheria toxin injection, imiquimod treatment, and sacrifice. Panel Q shows representative images of mice receiving phosphate buffered saline bone marrow derived dendritic cells or Pan treated bone marrow derived dendritic cells under imiquimod and non-imiquimod conditions. Panel R shows line graphs of PASI scores and back skin thickness over time, with time in days on the x-axis, comparing phosphate buffered saline bone marrow derived dendritic cells and Pan treated bone marrow derived dendritic cells under imiquimod and non-imiquimod conditions. Panel S shows vertical bar graphs of the percentage of CD11c positive cells in the skin and draining lymph nodes under imiquimod and non-imiquimod conditions after transfer of phosphate buffered saline or Pan treated bone marrow derived dendritic cells. Panel T shows a vertical bar graph of the percentage of CD3 positive CD4 positive cells in the skin under imiquimod and non-imiquimod conditions after transfer of phosphate buffered saline or Pan treated bone marrow derived dendritic cells. Panel U shows violin plots of CD80, CD86, major histocompatibility complex class 1, and major histocompatibility complex class 2 percentages in cells gated on CD45 positive CD11c positive cells from the skin and draining lymph nodes. Panel V shows representative spleen images from mice receiving phosphate buffered saline bone marrow derived dendritic cells or Pan treated bone marrow derived dendritic cells under imiquimod and non-imiquimod conditions. Panel W shows vertical bar graphs of spleen weight and spleen index under imiquimod and non-iminquimod conditions after transfer of phosphate buffered saline or Pan treated bone marrow derived dendritic cells.

Vanin-associated pantethine significantly suppresses DC activation and ameliorates IMQ-induced psoriasis in mice. (A) Relative quantification of pantethine (left) and pantothenate (right) levels in untreated or LPS-stimulated BMDCs, measured by LC/MS. (B) Relative quantification of pantethine levels in BMDCs of Vnn3fl/fl or Vnn3fl/flCd11ccre mice, measured by LC/MS. (C) Relative quantification of pantethine levels in vehicle- or pantethine-treated BMDCs, measured by LC/MS. (D) Statistical analysis of ELISA for expression levels of IFN-γ, IL-17A, and IL-4 in OT-II CD4+ T cells co-cultured with vehicle- or pantethine-treated BMDCs pulsed with OVA323–339. (E) Statistical analysis of flow cytometry for expression levels of HLA-A,B,C, HLA-DR, CD80, and CD86 in human moDCs, either untreated or treated with pantethine, following LPS stimulation. (F–O) Schematic illustration of the psoriasis-like mouse model (F). Mice were topically treated with 62.5 mg IMQ on shaved back skin daily for 6 consecutive days. Pantethine (50 mg/kg per mouse) or vehicle was administered i.p. 1 h before each IMQ application. Samples were collected on day 6 for analysis. Back thickness changes (G), body weight changes (H), H&E staining of skin sections (I; scale bar = 500 μm), representative spleen images (J), spleen weight (K, left), and spleen index (K, right). (L) mRNA expression of Ifng, Tnf, Il23, Il17a, Il17f, and Il22 in the skin of IMQ-induced mice treated with vehicle or pantethine. (M) Relative quantification of plasma pantethine levels in IMQ-induced mice treated with vehicle or pantethine, measured by LC/MS. (N)Vnn3 mRNA expression in the skin of mice with or without IMQ treatment. (O) Relative quantification of plasma pantethine (left) and pantothenate (right) levels in mice with or without IMQ treatment, measured by LC/MS. (P–W) DT-treated Itgax (CD11c)-DTR/tdTomato mice were transferred with vehicle- or pantethine-treated BMDCs and treated daily with 62.5 mg IMQ cream or Vaseline on the shaved back for 6 consecutive days. A diagram describing the experimental procedure of BMDC adoptive transfer into DT-treated Itgax (CD11c)-DTR/tdTomato mice is shown (P). Representative phenotypic presentation of skin lesions (Q) and PASI scores and back skin thickness (R) indicating psoriasis severity. Proportion of CD11c+ cells in skin and DLNs (S), CD3+CD4+ cells in psoriatic skin (T), as well as DC maturation in psoriatic skin (U, left) and DLNs (U, right) were analyzed by flow cytometry. (V) Representative spleen images. (W) Spleen weight and spleen index. Data are representative of three individual experiments (A–E). Each dot represents a biological replicate (A–E) or an individual mouse (G–W, n = 3–7 mice/group). Data are presented as mean ± SD. *P < 0.05, **P < 0.01, ***P < 0.001, and ****P < 0.0001; NS, not significant. Unpaired two-tailed Student’s t test.

Figure S3.
A multi-panel image depicts the effects of pantethine on dendritic cell activation and psoriasis in mice. Panel A shows vertical bar graphs of relative messenger RNA expression in bone marrow derived dendritic cells treated with vehicle or lipopolysaccharide, comparing Vnn3 wild type and Vnn3 knockout conditions. Panel B shows vertical bar graphs of relative Vnn3 messenger RNA expression on a log 2 scale in Vnn3 floxed and Vnn3 floxed Cd11c Cre bone marrow derived dendritic cells. Panel C shows a vertical bar graph of relative messenger RNA expression on a log 2 scale in vehicle and Pan treated conditions. Panel D shows vertical bar graphs of interferon gamma, interleukin 17A, and interleukin 4 concentrations in control, vehicle, and Pan treated conditions. Panel E shows vertical bar graphs of mean fluorescence intensity for human leukocyte antigen A, B, and C; human leukocyte antigen DR; CD80; and CD86 in human monocyte-derived dendritic cells treated with vehicle or Pan. Panel F shows a schematic diagram of Pan intraperitoneal administration and imiquimod treatment over days 0 to 4, followed by sample harvesting on day 5. Panel G shows a line graph of back skin thickness over time, with time in days on the x-axis and back skin thickness in millimeters on the y-axis, comparing control, vehicle, and Pan conditions after imiquimod treatment. Panel H shows a line graph of body weight over time, with time in days on the x-axis and body weight in grams on the y-axis, comparing control, vehicle, and Pan conditions after imiquimod treatment. Panel I shows hematoxylin and eosin stained skin sections from control, vehicle, and Pan conditions after imiquimod treatment. Panel J shows representative spleen images from control, vehicle, and Pan conditions after imiquimod treatment. Panel K shows vertical bar graphs of spleen weight and spleen index in control, vehicle, and Pan conditions after imiquimod treatment. Panel L shows vertical bar graphs of relative messenger RNA expression of Ifng, Tnf, Il23, Il17a, Il17f, and Il22 in vehicle and Pan treated skin after imiquimod treatment. Panel M shows a vertical bar graph of relative messenger RNA expression on a log 2 scale in plasma from vehicle and Pan conditions. Panel N shows a vertical bar graph of Vnn3 messenger RNA expression in control and imiquimod treated conditions. Panel O shows vertical bar graphs of relative expression levels in plasma treated with Pan or PA under control and imiquimod conditions. Panel P shows a schematic diagram of bone marrow derived dendritic cell transfer into CD11c-DTR mice, followed by diphtheria toxin injection, imiquimod treatment, and sacrifice. Panel Q shows representative images of mice receiving phosphate buffered saline bone marrow derived dendritic cells or Pan treated bone marrow derived dendritic cells under imiquimod and non-imiquimod conditions. Panel R shows line graphs of PASI scores and back skin thickness over time, with time in days on the x-axis, comparing phosphate buffered saline bone marrow derived dendritic cells and Pan treated bone marrow derived dendritic cells under imiquimod and non-imiquimod conditions. Panel S shows vertical bar graphs of the percentage of CD11c positive cells in the skin and draining lymph nodes under imiquimod and non-imiquimod conditions after transfer of phosphate buffered saline or Pan treated bone marrow derived dendritic cells. Panel T shows a vertical bar graph of the percentage of CD3 positive CD4 positive cells in the skin under imiquimod and non-imiquimod conditions after transfer of phosphate buffered saline or Pan treated bone marrow derived dendritic cells. Panel U shows violin plots of CD80, CD86, major histocompatibility complex class 1, and major histocompatibility complex class 2 percentages in cells gated on CD45 positive CD11c positive cells from the skin and draining lymph nodes. Panel V shows representative spleen images from mice receiving phosphate buffered saline bone marrow derived dendritic cells or Pan treated bone marrow derived dendritic cells under imiquimod and non-imiquimod conditions. Panel W shows vertical bar graphs of spleen weight and spleen index under imiquimod and non-iminquimod conditions after transfer of phosphate buffered saline or Pan treated bone marrow derived dendritic cells.

Vanin-associated pantethine significantly suppresses DC activation and ameliorates IMQ-induced psoriasis in mice. (A) Relative quantification of pantethine (left) and pantothenate (right) levels in untreated or LPS-stimulated BMDCs, measured by LC/MS. (B) Relative quantification of pantethine levels in BMDCs of Vnn3fl/fl or Vnn3fl/flCd11ccre mice, measured by LC/MS. (C) Relative quantification of pantethine levels in vehicle- or pantethine-treated BMDCs, measured by LC/MS. (D) Statistical analysis of ELISA for expression levels of IFN-γ, IL-17A, and IL-4 in OT-II CD4+ T cells co-cultured with vehicle- or pantethine-treated BMDCs pulsed with OVA323–339. (E) Statistical analysis of flow cytometry for expression levels of HLA-A,B,C, HLA-DR, CD80, and CD86 in human moDCs, either untreated or treated with pantethine, following LPS stimulation. (F–O) Schematic illustration of the psoriasis-like mouse model (F). Mice were topically treated with 62.5 mg IMQ on shaved back skin daily for 6 consecutive days. Pantethine (50 mg/kg per mouse) or vehicle was administered i.p. 1 h before each IMQ application. Samples were collected on day 6 for analysis. Back thickness changes (G), body weight changes (H), H&E staining of skin sections (I; scale bar = 500 μm), representative spleen images (J), spleen weight (K, left), and spleen index (K, right). (L) mRNA expression of Ifng, Tnf, Il23, Il17a, Il17f, and Il22 in the skin of IMQ-induced mice treated with vehicle or pantethine. (M) Relative quantification of plasma pantethine levels in IMQ-induced mice treated with vehicle or pantethine, measured by LC/MS. (N)Vnn3 mRNA expression in the skin of mice with or without IMQ treatment. (O) Relative quantification of plasma pantethine (left) and pantothenate (right) levels in mice with or without IMQ treatment, measured by LC/MS. (P–W) DT-treated Itgax (CD11c)-DTR/tdTomato mice were transferred with vehicle- or pantethine-treated BMDCs and treated daily with 62.5 mg IMQ cream or Vaseline on the shaved back for 6 consecutive days. A diagram describing the experimental procedure of BMDC adoptive transfer into DT-treated Itgax (CD11c)-DTR/tdTomato mice is shown (P). Representative phenotypic presentation of skin lesions (Q) and PASI scores and back skin thickness (R) indicating psoriasis severity. Proportion of CD11c+ cells in skin and DLNs (S), CD3+CD4+ cells in psoriatic skin (T), as well as DC maturation in psoriatic skin (U, left) and DLNs (U, right) were analyzed by flow cytometry. (V) Representative spleen images. (W) Spleen weight and spleen index. Data are representative of three individual experiments (A–E). Each dot represents a biological replicate (A–E) or an individual mouse (G–W, n = 3–7 mice/group). Data are presented as mean ± SD. *P < 0.05, **P < 0.01, ***P < 0.001, and ****P < 0.0001; NS, not significant. Unpaired two-tailed Student’s t test.

Close Figure S3.
Figure 5.
A multi-panel image depicts the effects of pantethine on cholesterol and immune cell activation. Panel A shows a schematic diagram of the cholesterol biosynthesis pathway from acetyl coenzyme A through 3-hydroxy-3-methylglutaryl coenzyme A, mevalonate, and cholesterol, with 3-hydroxy-3-methylglutaryl coenzyme A reductase inhibited by pantethine. Panel B shows a gene set enrichment analysis plot for cholesterol biosynthesis comparing normal skin with psoriasis skin, with VNN3 high-level and low-level groups, normalized enrichment score of 1.73, and P value less than 0.05. Panel C shows filipin staining images under negative and positive lipopolysaccharide conditions with vehicle or Pan treatment, alongside a violin plot of mean fluorescence intensity of filipin. Panel D shows a vertical bar graph of cholesterol levels in micrograms per 10 to the sixth cells under negative and positive lipopolysaccharide conditions with or without Pan. Panel E shows a heatmap of total cholesterol, triglycerides, high-density lipoprotein, and low-density lipoprotein levels under control, vehicle, and Pan conditions after imiquimod treatment. Panel F shows flow cytometry plots of enhanced green fluorescent protein and YAe expression under control, E alpha enhanced green fluorescent protein, E alpha enhanced green fluorescent protein plus Pan, and E alpha enhanced green fluorescent protein plus Pan and cholesterol conditions, with a bar graph showing the percentage of enhanced green fluorescent protein positive and YAe positive cells. Panel G shows vertical bar graphs of CD80 and CD86 mean fluorescence intensity under negative and positive lipopolysaccharide conditions with or without Pan and cholesterol. Panel H shows vertical bar graphs of the percentages of interferon gamma positive CD4 positive T cells, interleukin 4 positive CD4 positive T cells, and interleukin 17A positive CD4 positive T cells, along with major histocompatibility complex class 1 and major histocompatibility complex class 2 mean fluorescence intensity under lipopolysaccharide, Pan, and cholesterol conditions. Panel I shows flow cytometry histograms of cholera toxin B fluorescence and a bar graph of cholera toxin B mean fluorescence intensity under control, vehicle, Pan, and Pan plus cholesterol conditions after lipopolysaccharide treatment. Panel J shows flow cytometry histograms of toll-like receptor 4 fluorescence and a bar graph of toll-like receptor 4 mean fluorescence intensity under control, vehicle, Pan, and Pan plus cholesterol conditions after lipopolysaccharide treatment. Panels K and L show a vertical bar graph of filipin mean fluorescence intensity and a vertical bar graph of cholera toxin B mean fluorescence intensity under Vnn3 floxed, Vnn3 floxed plus lipopolysaccharide, Vnn3 floxed Cd11c Cre plus lipopolysaccharide, and Vnn3 floxed Cd11c Cre plus lipopolysaccharide and cholesterol conditions. Panel M shows vertical bar graphs of CD80 and CD86 mean fluorescence intensity under the same Vnn3 floxed and Vnn3 floxed Cd11c Cre conditions with lipopolysaccharide and cholesterol treatment.

Pantethine inhibits DC activation by reducing cholesterol and lipid raft content. (A) Schematic illustration of the MVA pathway and the cholesterol-lowering mechanism of pantethine. (B) GSEA analysis of cholesterol biosynthesis between the VNN3 high and VNN3 low expression groups in psoriasis patients (GEO: GSE54456). (C) Representative images and statistical analysis of mean fluorescence intensity of cholesterol (Filipin III) in BMDCs with or without LPS stimulation, pre-treated with vehicle or pantethine (scale bar = 10 μm). Each dot in the quantification data represents an individual cell. (D) Total free cholesterol levels in BMDCs with or without LPS stimulation, pre-treated with vehicle or pantethine, were quantified using the Amplex Red kit. (E) Heatmap representation of plasma TC, TG, LDL, and HDL levels in IMQ-induced C57BL/6 mice treated with vehicle or pantethine. (F) Percentage of EGFP+YAe+ BMDCs analyzed by flow cytometry after in vitro pulsing with EαEGFP protein, treated with vehicle or pantethine and with or without cholesterol supplementation. (G) Expression levels of CD80, CD86, MHC I, and MHC II in BMDCs treated as indicated, analyzed by flow cytometry. (H) Flow cytometry analysis of IFN-γ, IL-4, and IL-17A production in OT-II CD4+ T cells incubated with BMDCs treated as indicated. (I) Representative flow overlay histograms (left) and statistical analysis (right) of lipid raft (CTB) levels in BMDCs treated as indicated. (J) Representative flow overlay histograms (left) and statistical analysis (right) of membrane-TLR4 expression in BMDCs treated as indicated. (K–M) Flow cytometry for expression levels of cholesterol (K), lipid raft (L), and CD80 and CD86 (M) in BMDCs isolated from Vnn3fl/fl or Vnn3fl/flCd11ccre mice and treated as indicated. Data are representative of three individual experiments (except E). Each dot represents a biological replicate (D and F–M) or an individual mouse (E, n = 4–7 mice/group). Data are presented as mean ± SD. *P < 0.05, **P < 0.01, ***P < 0.001, and ****P < 0.0001. Unpaired two-tailed Student’s t test.

Close Figure 5.
+ Expand view− Collapse view
Figure S4.
Figure S4. Refer to the image caption for details.Panel A shows bar graphs of plasma lipid levels in mice treated with vehicle or pantethine, with axes labeled as TC, TG, HDL, and LDL in mmol per liter. Panel B presents a bar graph of total free cholesterol levels in LPS-stimulated BMDCs treated with vehicle or pantethine, with cholesterol supplementation. Panel C displays a histogram and bar graph of flow cytometry data for cholesterol expression levels in BMDCs. Panel D shows a histogram and bar graph of flow cytometry data for the proliferation rate of CFSE-labeled OT-2 CD4 positive T cells. Panel E contains representative flow cytometry plots of cytokine expression in OT-2 CD4 positive T cells. Panel F presents bar graphs of cytokine production quantified using ELISA kits. Panel G shows representative images of BMDCs with or without LPS stimulation, pre-treated with vehicle or pantethine. Panel H displays colocalization analysis of TLR4-lipid rafts and cholesterol-lipid rafts in BMDCs. Panel I contains representative images and statistical analysis of total cellular fluorescence of lipid rafts in BMDCs. Panel J shows a bar graph of mRNA expression levels of TLR4 in LPS-stimulated BMDCs. Panel K presents a GSEA plot of NF-kB pathway associated genes in LPS simulated BMDCs. Panel L contains a heatmap and bar plots of mRNA expression levels of various cytokines in BMDCs. Panel M shows representative images and intensity quantification of the activation of p-ERK and p-p38 in BMDCs. Panel N displays representative flow overlay histograms of cholesterol and lipid raft levels in BMDCs from different mouse models. Panel O contains representative flow cytometry plots and statistical analysis for the percentage of EGFP positive YAe positive BMDCs. Panel P and Q show representative flow overlay histograms and statistical analysis of CD80, CD86, MHC class 1, and MHC class 2 expression levels in BMDCs. Panel R-T presents bar graphs of membrane cholesterol, lipid raft levels, and expression levels of CD80, CD86, MHC class 1 and MHC class 2 in vehicle-or MCD-treated BMDCs from wild-type and Vnn3 KO mice.

Pantethine inhibits DC activation by reducing cholesterol and lipid raft content. (A) Plasma TC, TG, HDL, and LDL levels in IMQ-induced C57BL/6 mice treated with vehicle or pantethine. (B) Total free cholesterol levels in LPS-stimulated BMDCs treated with vehicle or pantethine, with cholesterol supplementation at the indicated concentrations to rescue the cholesterol defect, quantified using the Amplex Red kit. (C) Statistical analysis of flow cytometry for expression levels of cholesterol (Filipin III) in LPS-stimulated BMDCs treated with vehicle or pantethine and with or without cholesterol supplementation. (D) Statistical analysis of flow cytometry for proliferation rate of CFSE-labeled OT-II CD4+ T cells incubated with BMDCs treated as indicated. (E) Representative flow cytometry plots of IFN-γ, IL-4, and IL-17A in OT-II CD4+ T cells incubated with BMDCs treated as indicated. (F) Production of IFN-γ, IL-4, and IL-17A in OT-II CD4+ T cells incubated with BMDCs treated as indicated, quantified using ELISA kits. (G) Representative images of BMDCs with or without LPS stimulation, pre-treated with vehicle or pantethine (scale bar = 10 μm). (H) Colocalization analysis of TLR4-lipid rafts and cholesterol-lipid rafts of BMDCs with or without LPS stimulation, pre-treated with vehicle or pantethine. (I) Representative images (up) and statistical analysis (down) of total cellular fluorescence (CTCF) of lipid rafts (CTB) in BMDCs treated as indicated, calculated using ImageJ software (scale bar = 10 μm). (J) Expression mRNA levels of TLR4 in LPS-stimulated BMDCs treated as indicated. (K) GSEA of NF-κB pathway-associated genes in LPS-simulated BMDCs pre-treated with or without pantethine. (L) Heatmap and bar plots showing mRNA expression levels of Il1b, Il6, Il12a, Il23, and Tnf in BMDCs pre-treated with either vehicle or pantethine followed by LPS stimulation. (M) Representative image and intensity quantification of the activation of p-ERK and p-p38 in BMDCs treated with or without LPS stimulation, pre-treated with vehicle or pantethine from three independent experiments. (N) Representative flow overlay histograms of cholesterol (left) and lipid raft (right) levels in BMDCs from Vnn3fl/fl or Vnn3fl/flCd11ccre mice and treated as indicated. (O) Representative flow cytometry plots and statistical analysis for the percentage of EGFP+YAe+ BMDCs treated as indicated, analyzed by flow cytometry after in vitro pulsing with EαEGFP protein. (P and Q) Representative flow overlay histograms of CD80, CD86, MHC-I, and MHC-II expression (P) and statistical analysis of MHC-I and MHC-II (Q) levels in BMDCs isolated from Vnn3fl/fl or Vnn3fl/flCd11ccre mice, and treated as indicated. (R–T) Membrane cholesterol (R) and lipid rafts (S) levels and expression levels of CD80, CD86, MHC I, and MHC II (T) in vehicle- or MβCD-treated BMDCs from WT and Vnn3 KO mice, and stimulated with or without LPS. Data are representative of three individual experiments (B–J, L, and N–T) or pooled from three individual experiments (M). Each dot represents an individual mouse (A, n = 4–7 mice/group) or a biological replicate (B–F, I, J, and L–T) or a single cell (G and H). Data are presented as mean ± SD. *P < 0.05, **P < 0.01, ***P < 0.001, and ****P < 0.0001; NS, not significant. Unpaired two-tailed Student’s t test. Source data are available for this figure: SourceData FS4.

Figure S4.
A multi-panel image depicts the effects of pantethine on cholesterol levels and immune cell activation.Panel A shows bar graphs of plasma lipid levels in mice treated with vehicle or pantethine, with axes labeled as TC, TG, HDL, and LDL in mmol per liter. Panel B presents a bar graph of total free cholesterol levels in LPS-stimulated BMDCs treated with vehicle or pantethine, with cholesterol supplementation. Panel C displays a histogram and bar graph of flow cytometry data for cholesterol expression levels in BMDCs. Panel D shows a histogram and bar graph of flow cytometry data for the proliferation rate of CFSE-labeled OT-2 CD4 positive T cells. Panel E contains representative flow cytometry plots of cytokine expression in OT-2 CD4 positive T cells. Panel F presents bar graphs of cytokine production quantified using ELISA kits. Panel G shows representative images of BMDCs with or without LPS stimulation, pre-treated with vehicle or pantethine. Panel H displays colocalization analysis of TLR4-lipid rafts and cholesterol-lipid rafts in BMDCs. Panel I contains representative images and statistical analysis of total cellular fluorescence of lipid rafts in BMDCs. Panel J shows a bar graph of mRNA expression levels of TLR4 in LPS-stimulated BMDCs. Panel K presents a GSEA plot of NF-kB pathway associated genes in LPS simulated BMDCs. Panel L contains a heatmap and bar plots of mRNA expression levels of various cytokines in BMDCs. Panel M shows representative images and intensity quantification of the activation of p-ERK and p-p38 in BMDCs. Panel N displays representative flow overlay histograms of cholesterol and lipid raft levels in BMDCs from different mouse models. Panel O contains representative flow cytometry plots and statistical analysis for the percentage of EGFP positive YAe positive BMDCs. Panel P and Q show representative flow overlay histograms and statistical analysis of CD80, CD86, MHC class 1, and MHC class 2 expression levels in BMDCs. Panel R-T presents bar graphs of membrane cholesterol, lipid raft levels, and expression levels of CD80, CD86, MHC class 1 and MHC class 2 in vehicle-or MCD-treated BMDCs from wild-type and Vnn3 KO mice.

Pantethine inhibits DC activation by reducing cholesterol and lipid raft content. (A) Plasma TC, TG, HDL, and LDL levels in IMQ-induced C57BL/6 mice treated with vehicle or pantethine. (B) Total free cholesterol levels in LPS-stimulated BMDCs treated with vehicle or pantethine, with cholesterol supplementation at the indicated concentrations to rescue the cholesterol defect, quantified using the Amplex Red kit. (C) Statistical analysis of flow cytometry for expression levels of cholesterol (Filipin III) in LPS-stimulated BMDCs treated with vehicle or pantethine and with or without cholesterol supplementation. (D) Statistical analysis of flow cytometry for proliferation rate of CFSE-labeled OT-II CD4+ T cells incubated with BMDCs treated as indicated. (E) Representative flow cytometry plots of IFN-γ, IL-4, and IL-17A in OT-II CD4+ T cells incubated with BMDCs treated as indicated. (F) Production of IFN-γ, IL-4, and IL-17A in OT-II CD4+ T cells incubated with BMDCs treated as indicated, quantified using ELISA kits. (G) Representative images of BMDCs with or without LPS stimulation, pre-treated with vehicle or pantethine (scale bar = 10 μm). (H) Colocalization analysis of TLR4-lipid rafts and cholesterol-lipid rafts of BMDCs with or without LPS stimulation, pre-treated with vehicle or pantethine. (I) Representative images (up) and statistical analysis (down) of total cellular fluorescence (CTCF) of lipid rafts (CTB) in BMDCs treated as indicated, calculated using ImageJ software (scale bar = 10 μm). (J) Expression mRNA levels of TLR4 in LPS-stimulated BMDCs treated as indicated. (K) GSEA of NF-κB pathway-associated genes in LPS-simulated BMDCs pre-treated with or without pantethine. (L) Heatmap and bar plots showing mRNA expression levels of Il1b, Il6, Il12a, Il23, and Tnf in BMDCs pre-treated with either vehicle or pantethine followed by LPS stimulation. (M) Representative image and intensity quantification of the activation of p-ERK and p-p38 in BMDCs treated with or without LPS stimulation, pre-treated with vehicle or pantethine from three independent experiments. (N) Representative flow overlay histograms of cholesterol (left) and lipid raft (right) levels in BMDCs from Vnn3fl/fl or Vnn3fl/flCd11ccre mice and treated as indicated. (O) Representative flow cytometry plots and statistical analysis for the percentage of EGFP+YAe+ BMDCs treated as indicated, analyzed by flow cytometry after in vitro pulsing with EαEGFP protein. (P and Q) Representative flow overlay histograms of CD80, CD86, MHC-I, and MHC-II expression (P) and statistical analysis of MHC-I and MHC-II (Q) levels in BMDCs isolated from Vnn3fl/fl or Vnn3fl/flCd11ccre mice, and treated as indicated. (R–T) Membrane cholesterol (R) and lipid rafts (S) levels and expression levels of CD80, CD86, MHC I, and MHC II (T) in vehicle- or MβCD-treated BMDCs from WT and Vnn3 KO mice, and stimulated with or without LPS. Data are representative of three individual experiments (B–J, L, and N–T) or pooled from three individual experiments (M). Each dot represents an individual mouse (A, n = 4–7 mice/group) or a biological replicate (B–F, I, J, and L–T) or a single cell (G and H). Data are presented as mean ± SD. *P < 0.05, **P < 0.01, ***P < 0.001, and ****P < 0.0001; NS, not significant. Unpaired two-tailed Student’s t test. Source data are available for this figure: SourceData FS4.

Close Figure S4.
Figure 6.
A multi-panel image depicts the effects of RR6, a Vanin inhibitor, on immune activation and psoriasis in mouse models. Panel A shows a schematic diagram of Pan treatment with RR6 inhibiting Vanin, followed by PA and Cys treatment. Panel B shows a bar graph of relative expression level on a log 2 scale in bone marrow derived dendritic cells treated with vehicle or RR6. Panel C shows flow cytometry plots of enhanced green fluorescent protein and YAe expression and a bar graph of the percentage of enhanced green fluorescent protein positive and YAe positive cells in vehicle and RR6 conditions. Panel D shows a flow cytometry histogram of carboxyfluorescein succinimidyl ester labeled OT-2 cells and a bar graph of the percentage of carboxyfluorescein succinimidyl ester low cells under control, vehicle, and RR6 conditions after lipopolysaccharide and ovalbumin stimulation. Panel E shows vertical bar graphs of the percentages of interferon gamma positive CD4 positive T cells, interleukin 4 positive CD4 positive T cells, and interleukin 17A positive CD4 positive T cells under control, vehicle, and RR6 conditions. Panel F shows vertical bar graphs of CD86 and human leukocyte antigen DR mean fluorescence intensity in human monocyte derived dendritic cells treated with vehicle or RR6. Panel G shows flow cytometry overlay histograms of cholera toxin B fluorescence and a bar graph of cholera toxin B mean fluorescence intensity under control, vehicle, RR6, and RR6 plus cholesterol conditions after lipopolysaccharide treatment. Panel H shows vertical bar graphs of the percentages of interferon gamma positive CD4 positive T cells, interleukin 4 positive CD4 positive T cells, and interleukin 17A positive CD4 positive T cells under lipopolysaccharide, RR6, and cholesterol conditions. Panel I shows representative images of mice and dorsal skin under control, vehicle, and RR6 conditions after imiquimod treatment. Panel J shows a line graph of PASI scores over time from day 0 to day 6, with time in days on the x-axis and PASI score on the y-axis, comparing control, vehicle, and RR6 conditions after imiquimod treatment. Panel K shows hematoxylin and eosin staining images of skin sections from control, vehicle, and RR6 conditions after imiquimod treatment. Panel L shows a bar graph of relative messenger RNA expression levels of Ifng, Tnf, Il23, Il22, Il17a, and Il17f under vehicle and RR6 conditions after imiquimod treatment. Panel M shows flow cytometry plots of CD11c and CD45 expression and a bar graph of the percentage of CD11c positive cells in draining lymph nodes after imiquimod treatment. Panel N shows a bar graph of the percentage of CD11c positive cells in the skin after imiquimod treatment. Panel O shows violin plots of CD80, CD86, major histocompatibility complex class 1, and major histocompatibility complex class 2 percentages in cells gated on CD45 positive CD11c positive cells from draining lymph nodes and skin. Panel P shows a bar graph of total cholesterol levels in millimoles per liter under control, vehicle, and RR6 conditions after imiquimod treatment.

Pharmacologically targeting Vanin impairs DC immune activation and attenuates psoriasis in a mouse model. (A) Schematic illustration of RR6 as a specific Vanin inhibitor. (B) Relative pantethine levels in vehicle- or RR6-treated BMDCs, measured by LC/MS. (C) Representative flow cytometry plots (left) and statistical analysis (right) showing the percentage of EGFP+YAe+ cells in vehicle- or RR6-treated BMDCs after an in vitro antigen uptake and presentation assay with EαEGFP protein. (D) Proliferation rate of CFSE-labeled OT-II CD4+ T cells incubated with vehicle- or RR6-treated BMDCs pulsed with OVA323–339. (E) Flow cytometry analysis and quantification of IFN-γ, IL-4, and IL-17A in OT-II CD4+ T cells co-cultured with vehicle- or RR6-treated BMDCs pulsed with OVA323–339. (F) Expression levels of CD86 and HLA-DR in R848-stimulated human moDCs treated with vehicle or RR6, analyzed by flow cytometry. (G) Representative flow overlay histograms (left) and statistical analysis (right) of lipid raft (CTB) levels in BMDCs treated as indicated. (H) Flow cytometry analysis of IFN-γ, IL-4, and IL-17A production in OT-II CD4+ T cells incubated with BMDCs treated as indicated. (I–P) Mice were i.p. injected with vehicle or RR6 during IMQ application. Representative images of back skin (I), PASI scores indicating disease severity (J), H&E staining of skin sections (K; scale bar = 500 μm), mRNA expression of Ifng, Tnf, Il23, Il22, Il17a, and Il17f in the skin (L), flow cytometry plots (M, left), and statistical analysis of CD11c+ cells in DLNs (M, right) and psoriatic skin (N), DC maturation in DLN (O, left), and skin (O, right) were analyzed by flow cytometry. (P) Plasma TC levels in IMQ-induced mice treated with vehicle or RR6. Data are representative of three individual experiments (C–H). Each dot represents a biological replicate (C–H) or an individual mouse (B and I–P, n = 4–7 mice/group). Data are presented as mean ± SD. *P < 0.05, **P < 0.01, ***P < 0.001, and ****P < 0.0001; NS, not significant. Unpaired two-tailed Student’s t test.

Close Figure 6.
+ Expand view − Collapse view
Figure S5.
Figure S5. Refer to the image caption for details. Panel A shows bar graphs of flow cytometry data for CD80 and human leukocyte antigen A, B, and C expression levels in human monocyte-derived dendritic cells treated with vehicle or RR6. Panel B includes flow overlay histograms and bar graphs of cholesterol levels in bone marrow derived dendritic cells treated as indicated. Panel C presents flow cytometry plots and bar graphs showing the percentage of enhanced green fluorescent protein positive and YAe positive cells in vehicle- or RR6-treated bone marrow derived dendritic cells. Panel D displays bar graphs of flow cytometry data for CD80, CD86, major histocompatibility complex class 1, and major histocompatibility complex class 2 expression levels in lipopolysaccharide-stimulated bone marrow derived dendritic cells. Panel E includes flow overlay histograms and bar graphs of proliferation rates of carboxyfluorescein succinimidyl ester-labeled OT-2 CD4 positive T cells. Panels F-M show a schematic illustration of a psoriasis-like mouse model, with various measurements such as pantethine levels, back thickness, body weight, spleen images, spleen weight, spleen index, and flow cytometry data of CD11c positive cells and CD3 positive CD4 positive cells in skin. Panel N illustrates the isolation of monocyte-derived dendritic cells or myeloid dendritic cells from peripheral blood mononuclear cells. Panels O and P show line charts of maturation marker expression in lipopolysaccharide-stimulated monocyte-derived dendritic cells and myeloid dendritic cells from psoriasis patients. Panels Q and R show line charts of maturation marker expression in lipopolysaccharide-stimulated monocyte-derived dendritic cells and myeloid dendritic cells from systemic lupus erythematosus patients. Panel S presents a scatter plot of relative serum pantethine levels between healthy donors and psoriasis patients. Panels T and U show line charts of Physician's Global Assessment scores of patients before and after treatment in Group A and Group B. Panels V and W display line charts of Psoriasis Area and Severity Index scores of patients with dyslipidemia or normal lipid profiles in Groups A and B at baseline, month 2, and month 3 of treatment.

Pharmacological inhibition of Vanin or pantethine supplementation suppresses DC activation and alleviates psoriasiform inflammation. (A) Statistical analysis of flow cytometry for expression levels of CD80 and HLA-A,B,C in R848-stimulated human moDCs treated with vehicle or RR6. (B) Representative flow overlay histograms (left) and statistical analysis (right) of cholesterol (Filipin III) in BMDCs treated as indicated. (C) Representative flow cytometry plots (left) and statistical analysis (right) showing the percentage of EGFP+YAe+ cells in vehicle- or RR6-treated BMDCs after in vitro antigen uptake and presentation assay with EαEGFP protein. R, RR6; C, cholesterol. (D) Statistical analysis of flow cytometry for expression levels of CD80, CD86, MHC I, and MHC-II in LPS-stimulated BMDCs treated as indicated. (E) Representative flow overlay histograms (left) and statistical analysis (right) for the proliferation rate of CFSE-labeled OT-II CD4+ T cells incubated with BMDCs treated as indicated. (F–M) Schematic illustration of the psoriasis-like mouse model. Mice were topically treated with 62.5 mg IMQ on shaved back skin daily for 6 consecutive days. RR6 (10 mg/kg per mouse) or vehicle was administered i.p. 1 h before each IMQ application. Samples were collected on day 6 for analysis (F). Pantethine levels in mouse plasma (G), back thickness changes (H), body weight changes (I), representative spleen images (J), spleen weight (J), spleen index (J), representative flow cytometry plots of CD11c+ cells in skin (K), and statistical analysis of flow cytometry for percentage of CD3+CD4+ cells in skin (L). (M) Plasma TG, HDL, and LDL levels in IMQ-induced mice treated with vehicle or RR6. (N) Schematic illustration of moDC or mDC isolation from PBMCs. mDCs were isolated by magnetic cell sorting from PBMCs, and moDCs were generated in vitro from monocytes derived from patient PBMCs. Maturation was induced by adding LPS in the presence or absence of pantethine or RR6. (O and P) Line chart showing expression of maturation markers in LPS-stimulated moDCs (O) or mDCs (P) generated from PBMCs of psoriasis patients and treated with vehicle, pantethine, or RR6. (Q and R) Line chart showing expression of maturation markers in LPS-stimulated moDCs (Q) or mDCs (R) generated from PBMCs of SLE patients and treated with vehicle, pantethine, or RR6. (S) Relative serum pantethine levels between healthy donors and psoriasis patients, measured by LC/MS (healthy donors n = 17; psoriasis patients n = 12). (T and U) PGA scores of patients before and after treatment in group A (T) and group B (U) (n = 12). (V and W) PASI scores of patients with either dyslipidemia (V) or normal lipid profiles (W) in groups A and B at baseline (M0), month 2 of treatment (M2), and month 3 of treatment (M3). Data are representative of three individual experiments (A–E). Each dot represents a biological replicate (A–E) or an individual mouse (G–M, n = 4–7 mice/group) or an individual human donor (O–W). Data are presented as mean ± SD. *P < 0.05, **P < 0.01, ***P < 0.001, and ****P < 0. 0001; NS, not significant. Unpaired two-tailed Student’s t test.

Figure S5.
A multi-panel image depicts data on DC activation and psoriasiform inflammation. Panel A shows bar graphs of flow cytometry data for CD80 and human leukocyte antigen A, B, and C expression levels in human monocyte-derived dendritic cells treated with vehicle or RR6. Panel B includes flow overlay histograms and bar graphs of cholesterol levels in bone marrow derived dendritic cells treated as indicated. Panel C presents flow cytometry plots and bar graphs showing the percentage of enhanced green fluorescent protein positive and YAe positive cells in vehicle- or RR6-treated bone marrow derived dendritic cells. Panel D displays bar graphs of flow cytometry data for CD80, CD86, major histocompatibility complex class 1, and major histocompatibility complex class 2 expression levels in lipopolysaccharide-stimulated bone marrow derived dendritic cells. Panel E includes flow overlay histograms and bar graphs of proliferation rates of carboxyfluorescein succinimidyl ester-labeled OT-2 CD4 positive T cells. Panels F-M show a schematic illustration of a psoriasis-like mouse model, with various measurements such as pantethine levels, back thickness, body weight, spleen images, spleen weight, spleen index, and flow cytometry data of CD11c positive cells and CD3 positive CD4 positive cells in skin. Panel N illustrates the isolation of monocyte-derived dendritic cells or myeloid dendritic cells from peripheral blood mononuclear cells. Panels O and P show line charts of maturation marker expression in lipopolysaccharide-stimulated monocyte-derived dendritic cells and myeloid dendritic cells from psoriasis patients. Panels Q and R show line charts of maturation marker expression in lipopolysaccharide-stimulated monocyte-derived dendritic cells and myeloid dendritic cells from systemic lupus erythematosus patients. Panel S presents a scatter plot of relative serum pantethine levels between healthy donors and psoriasis patients. Panels T and U show line charts of Physician's Global Assessment scores of patients before and after treatment in Group A and Group B. Panels V and W display line charts of Psoriasis Area and Severity Index scores of patients with dyslipidemia or normal lipid profiles in Groups A and B at baseline, month 2, and month 3 of treatment.

Pharmacological inhibition of Vanin or pantethine supplementation suppresses DC activation and alleviates psoriasiform inflammation. (A) Statistical analysis of flow cytometry for expression levels of CD80 and HLA-A,B,C in R848-stimulated human moDCs treated with vehicle or RR6. (B) Representative flow overlay histograms (left) and statistical analysis (right) of cholesterol (Filipin III) in BMDCs treated as indicated. (C) Representative flow cytometry plots (left) and statistical analysis (right) showing the percentage of EGFP+YAe+ cells in vehicle- or RR6-treated BMDCs after in vitro antigen uptake and presentation assay with EαEGFP protein. R, RR6; C, cholesterol. (D) Statistical analysis of flow cytometry for expression levels of CD80, CD86, MHC I, and MHC-II in LPS-stimulated BMDCs treated as indicated. (E) Representative flow overlay histograms (left) and statistical analysis (right) for the proliferation rate of CFSE-labeled OT-II CD4+ T cells incubated with BMDCs treated as indicated. (F–M) Schematic illustration of the psoriasis-like mouse model. Mice were topically treated with 62.5 mg IMQ on shaved back skin daily for 6 consecutive days. RR6 (10 mg/kg per mouse) or vehicle was administered i.p. 1 h before each IMQ application. Samples were collected on day 6 for analysis (F). Pantethine levels in mouse plasma (G), back thickness changes (H), body weight changes (I), representative spleen images (J), spleen weight (J), spleen index (J), representative flow cytometry plots of CD11c+ cells in skin (K), and statistical analysis of flow cytometry for percentage of CD3+CD4+ cells in skin (L). (M) Plasma TG, HDL, and LDL levels in IMQ-induced mice treated with vehicle or RR6. (N) Schematic illustration of moDC or mDC isolation from PBMCs. mDCs were isolated by magnetic cell sorting from PBMCs, and moDCs were generated in vitro from monocytes derived from patient PBMCs. Maturation was induced by adding LPS in the presence or absence of pantethine or RR6. (O and P) Line chart showing expression of maturation markers in LPS-stimulated moDCs (O) or mDCs (P) generated from PBMCs of psoriasis patients and treated with vehicle, pantethine, or RR6. (Q and R) Line chart showing expression of maturation markers in LPS-stimulated moDCs (Q) or mDCs (R) generated from PBMCs of SLE patients and treated with vehicle, pantethine, or RR6. (S) Relative serum pantethine levels between healthy donors and psoriasis patients, measured by LC/MS (healthy donors n = 17; psoriasis patients n = 12). (T and U) PGA scores of patients before and after treatment in group A (T) and group B (U) (n = 12). (V and W) PASI scores of patients with either dyslipidemia (V) or normal lipid profiles (W) in groups A and B at baseline (M0), month 2 of treatment (M2), and month 3 of treatment (M3). Data are representative of three individual experiments (A–E). Each dot represents a biological replicate (A–E) or an individual mouse (G–M, n = 4–7 mice/group) or an individual human donor (O–W). Data are presented as mean ± SD. *P < 0.05, **P < 0.01, ***P < 0.001, and ****P < 0. 0001; NS, not significant. Unpaired two-tailed Student’s t test.

Close Figure S5.
Figure 7.
A multi-panel image depicts the effects of pantethine on dendritic cell activation and psoriasis treatment. Panel A shows bar graphs and flow cytometry histograms of HLA-A, B, C, HLA-DR, CD80, and CD86 expression levels in LPS-stimulated moDCs from psoriasis patients treated with vehicle, pantethine, or RR6. Panel B shows bar graphs of the same markers in LPS-stimulated mDCs from psoriasis patients under the same treatment conditions. Panel C shows similar bar graphs and flow cytometry histograms for moDCs from SLE patients. Panel D shows bar graphs for mDCs from SLE patients. Panel E shows a CONSORT diagram outlining the clinical trial design comparing Cal/BDP monotherapy with Cal/BDP combined with oral pantethine in psoriasis patients. Panel F shows photographs of the skin condition of patients in Group A before and after treatment. Panel G shows photographs of the skin condition of patients in Group B before and after treatment. Panel H shows a line chart of PASI scores of patients before and after treatment in Group A. Panel I shows a line chart of PASI scores of patients before and after treatment in Group B. Panel J shows a line chart comparing PASI scores of both groups before and after treatment. Panel K shows a bar graph of the PASI reduction index between the two groups.

Pantethine impedes activation of DCs from clinical patients with autoimmune disorders and alleviates disease progression. (A) Representative flow overlay histograms (left) and statistical analysis (right) of maturation marker expression in LPS-stimulated moDCs generated from PBMCs of psoriasis patients and treated with vehicle, pantethine, or RR6. (B) Statistical analysis of flow cytometry for expression levels of maturation markers in LPS-stimulated mDCs derived from PBMCs of psoriasis patients and treated with vehicle, pantethine, or RR6. (C) Representative flow overlay histograms (left) and statistical analysis (right) of maturation marker expression in LPS-stimulated moDCs generated from PBMCs of SLE patients and treated with vehicle, pantethine, or RR6. (D) Statistical analysis of flow cytometry for expression levels of maturation markers in LPS-stimulated mDCs derived from PBMCs of SLE patients and treated with vehicle, pantethine, or RR6. (E) CONSORT diagram of the clinical trial comparing topical Calcipotriol and Betamethasone dipropionate (Cal/BDP) monotherapy versus Cal/BDP combined with oral pantethine in patients with psoriasis. (F and G) Representative photographs of individuals with psoriasis in group A (F) and group B (G) before and after treatment. (H and I) PASI scores of patients before and after treatment in group A (H) and group B (I) (n = 12). (J) Line chart showing PASI scores of group A and group B before and after treatment (n = 12). (K) PASI reduction index between group A and group B. Each dot represents an individual patient. Data are presented as mean ± SEM. *P < 0.05, **P < 0.01, ***P < 0.001, and ****P < 0.0001. Unpaired two-tailed Student’s t test.

Close Figure 7.
Figure 8.
Diagram of immune cell activation and modulation. The left side shows hyperactivated dendritic cells (DCs) with upregulated Vanin expression, leading to the hydrolysis of pantethine and accumulation of cholesterol and lipid rafts. The right side shows therapeutic intervention with pantethine supplementation or Vanin inhibition using RR6, which restores pantethine levels and reduces cholesterol and lipid raft content, alleviating autoimmune responses. The diagram includes labels for CD86, MHC, CD80, Vanin, Pan, Chol, and lipid rafts, illustrating the flow and interaction between these components.

Schematic diagram of the Vanin-pantethine-cholesterol axis governing DC activation and modulating the progression of AIDs. In hyperactivated DCs, Vanin expression is significantly upregulated, resulting in the hydrolysis of its substrate pantethine and concomitant accumulation of cholesterol and lipid rafts, thereby contributing to the progression of autoimmune pathology. Therapeutic intervention with pantethine supplementation or pharmacological inhibition of Vanin using RR6 restores intracellular pantethine levels, reduces cholesterol and lipid raft content, and ultimately alleviates autoimmune responses.

Close Figure 8.

References

Abou-Hamdan
,
M.
,
R.
Saleh
,
S.
Mani
,
P.
Dournaud
,
M.
Metifiot
,
M.L.
Blondot
,
M.L.
Andreola
,
F.
Abdel-Sater
,
M.
De Reggi
,
P.
Gressens
, and
M.
Laforge
.
2023
.
Potential antiviral effects of pantethine against SARS-CoV-2
.
Sci. Rep.
13
:
2237
.
Abou-Hamdan
,
M.
,
B.
Gharib
,
M.
Bajenoff
,
V.
Julia
, and
M.
de Reggi
.
2017
.
Pantethine down-regulates leukocyte recruitment and inflammatory parameters in a mouse model of allergic airway inflammation
.
Med. Sci. Monit. Basic Res.
23
:
368
–
372
.
Adams
,
N.M.
,
D.
Martinez-Krams
,
E.
Esteva
,
A.C.
Ra
,
A.I.
Alexiou
,
H.
Jin
,
T.J.
Yun
,
R.S.
Tellaoui
,
T.
Mudianto
,
E.
Vollmer
, et al
.
2026
.
Transcription factor Etv3 controls the tolerogenic function of dendritic cells
.
Science
.
391
:eads1246.
Adhyaru
,
B.B.
, and
T.A.
Jacobson
.
2018
.
Safety and efficacy of statin therapy
.
Nat. Rev. Cardiol.
15
:
757
–
769
.
Ahlehoff
,
O.
,
L.
Skov
,
G.
Gislason
,
R.
Gniadecki
,
L.
Iversen
,
L.E.
Bryld
,
S.
Lasthein
,
J.
Lindhardsen
,
S.L.
Kristensen
,
C.
Torp-Pedersen
, and
P.R.
Hansen
.
2015
.
Cardiovascular outcomes and systemic anti-inflammatory drugs in patients with severe psoriasis: 5-year follow-up of a Danish nationwide cohort
.
J. Eur. Acad. Dermatol. Venereol.
29
:
1128
–
1134
.
Anderson
,
H.A.
,
E.M.
Hiltbold
, and
P.A.
Roche
.
2000
.
Concentration of MHC class II molecules in lipid rafts facilitates antigen presentation
.
Nat. Immunol.
1
:
156
–
162
.
Arsenio
,
L.
,
S.
Caronna
,
M.
Lateana
,
G.
Magnati
,
A.
Strata
, and
G.
Zammarchi
.
1984
.
[Hyperlipidemia, diabetes and atherosclerosis: Efficacy of treatment with pantethine]
.
Acta Biomed. Ateneo Parmense
.
55
:
25
–
42
.
Bellinato
,
F.
,
M.
Maurelli
,
D.
Geat
,
G.
Girolomoni
, and
P.
Gisondi
.
2024
.
Managing the patient with psoriasis and metabolic comorbidities
.
Am. J. Clin. Dermatol.
25
:
527
–
540
.
Benson
,
R.A.
,
M.K.L.
MacLeod
,
B.G.
Hale
,
A.
Patakas
,
P.
Garside
, and
J.M.
Brewer
.
2015
.
Antigen presentation kinetics control T cell/dendritic cell interactions and follicular helper T cell generation in vivo
.
Elife
.
4
:e06994.
Berruyer
,
C.
,
L.
Pouyet
,
V.
Millet
,
F.M.
Martin
,
A.
LeGoffic
,
A.
Canonici
,
S.
Garcia
,
C.
Bagnis
,
P.
Naquet
, and
F.
Galland
.
2006
.
Vanin-1 licenses inflammatory mediator production by gut epithelial cells and controls colitis by antagonizing peroxisome proliferator-activated receptor γ activity
.
J. Exp. Med.
203
:
2817
–
2827
.
Bonacina
,
F.
,
D.
Coe
,
G.
Wang
,
M.P.
Longhi
,
A.
Baragetti
,
A.
Moregola
,
K.
Garlaschelli
,
P.
Uboldi
,
F.
Pellegatta
,
L.
Grigore
, et al
.
2018
.
Myeloid apolipoprotein E controls dendritic cell antigen presentation and T cell activation
.
Nat. Commun.
9
:
3083
.
Brunetti
,
D.
,
S.
Dusi
,
C.
Giordano
,
C.
Lamperti
,
M.
Morbin
,
V.
Fugnanesi
,
S.
Marchet
,
G.
Fagiolari
,
O.
Sibon
,
M.
Moggio
, et al
.
2014
.
Pantethine treatment is effective in recovering the disease phenotype induced by ketogenic diet in a pantothenate kinase-associated neurodegeneration mouse model
.
Brain
.
137
:
57
–
68
.
Chen
,
C.
,
G.
Hou
,
C.
Zeng
,
Y.
Ren
,
X.
Chen
, and
C.
Peng
.
2021
.
Metabolomic profiling reveals amino acid and carnitine alterations as metabolic signatures in psoriasis
.
Theranostics
.
11
:
754
–
767
.
Cighetti
,
G.
,
M.D.
Puppo
,
R.
Paroni
, and
M.G.
Kienle
.
1988
.
Modulation of HMG-CoA reductase activity by pantetheine/pantethine
.
Biochim. Biophys. Acta
.
963
:
389
–
393
.
Collin
,
M.
, and
V.
Bigley
.
2018
.
Human dendritic cell subsets: An update
.
Immunology
.
154
:
3
–
20
.
de Winde
,
C.M.
,
C.
Munday
, and
S.E.
Acton
.
2020
.
Molecular mechanisms of dendritic cell migration in immunity and cancer
.
Med. Microbiol. Immunol. (Berl.)
.
209
:
515
–
529
.
Donati
,
C.
,
G.
Barbi
,
G.
Cairo
,
G.F.
Prati
, and
E.
Degli Esposti
.
1986
.
Pantethine improves the lipid abnormalities of chronic hemodialysis patients: Results of a multicenter clinical trial
.
Clin. Nephrol.
25
:
70
–
74
.
Elmets
,
C.A.
,
C.L.
Leonardi
,
D.M.R.
Davis
,
J.M.
Gelfand
,
J.
Lichten
,
N.N.
Mehta
,
A.W.
Armstrong
,
C.
Connor
,
K.M.
Cordoro
,
B.E.
Elewski
, et al
.
2019
.
Joint AAD-NPF guidelines of care for the management and treatment of psoriasis with awareness and attention to comorbidities
.
J. Am. Acad. Dermatol.
80
:
1073
–
1113
.
Evans
,
M.
,
J.A.
Rumberger
,
I.
Azumano
,
J.J.
Napolitano
,
D.
Citrolo
, and
T.
Kamiya
.
2014
.
Pantethine, a derivative of vitamin B5, favorably alters total, LDL and non-HDL cholesterol in low to moderate cardiovascular risk subjects eligible for statin therapy: A triple-blinded placebo and diet-controlled investigation
.
Vasc. Health Risk Manag.
10
:
89
–
100
.
Ferreira
,
D.W.
,
P.
Naquet
, and
J.E.
Manautou
.
2015
.
Influence of vanin-1 and Catalytic products in liver during normal and oxidative stress conditions
.
Curr. Med. Chem.
22
:
2407
–
2416
.
Frostegård
,
J.
2005
.
Atherosclerosis in patients with autoimmune disorders
.
Arterioscler. Thromb. Vasc. Biol.
25
:
1776
–
1785
.
Ganguly
,
D.
,
S.
Haak
,
V.
Sisirak
, and
B.
Reizis
.
2013
.
The role of dendritic cells in autoimmunity
.
Nat. Rev. Immunol.
13
:
566
–
577
.
Gentleman
,
R.C.
,
V.J.
Carey
,
D.M.
Bates
,
B.
Bolstad
,
M.
Dettling
,
S.
Dudoit
,
B.
Ellis
,
L.
Gautier
,
Y.
Ge
,
J.
Gentry
, et al
.
2004
.
Bioconductor: Open software development for computational biology and bioinformatics
.
Genome Biol.
5
:
R80
.
Ginestet
,
C.
2011
.
ggplot2: Elegant graphics for data analysis
.
J. R. Stat. Soc. Ser. A Stat. Soc.
174
:
245
–
246
.
Good
,
Z.
,
L.
Borges
,
N.
Vivanco Gonzalez
,
B.
Sahaf
,
N.
Samusik
,
R.
Tibshirani
,
G.P.
Nolan
, and
S.C.
Bendall
.
2019
.
Proliferation tracing with single-cell mass cytometry optimizes generation of stem cell memory-like T cells
.
Nat. Biotechnol.
37
:
259
–
266
.
Greb
,
J.E.
,
A.M.
Goldminz
,
J.T.
Elder
,
M.G.
Lebwohl
,
D.D.
Gladman
,
J.J.
Wu
,
N.N.
Mehta
,
A.Y.
Finlay
, and
A.B.
Gottlieb
.
2016
.
Psoriasis
.
Nat. Rev. Dis. Primer
.
2
:
16082
.
Griffiths
,
C.E.M.
,
A.W.
Armstrong
,
J.E.
Gudjonsson
, and
J.N.W.N.
Barker
.
2021
.
Psoriasis
.
Lancet
.
397
:
1301
–
1315
.
Guan
,
W.
,
J.
Xu
,
Y.
Shi
,
X.
Wang
,
S.
Gu
, and
L.
Xie
.
2023
.
VNN1 as a potential biomarker for sepsis diagnosis and its implications in immune infiltration and tumor prognosis
.
Front. Med.
10
:
1236484
.
Guo
,
C.
, and
H.
Chi
.
2023
.
Immunometabolism of dendritic cells in health and disease
.
Adv. Immunol.
160
:
83
–
116
.
Guo
,
C.
,
Z.
You
,
H.
Shi
,
Y.
Sun
,
X.
Du
,
G.
Palacios
,
C.
Guy
,
S.
Yuan
,
N.M.
Chapman
,
S.A.
Lim
, et al
.
2023
.
SLC38A2 and glutamine signalling in cDC1s dictate anti-tumour immunity
.
Nature
.
620
:
200
–
208
.
Hepworth
,
M.R.
,
L.A.
Monticelli
,
T.C.
Fung
,
C.G.K.
Ziegler
,
S.
Grunberg
,
R.
Sinha
,
A.R.
Mantegazza
,
H.-L.
Ma
,
A.
Crawford
,
J.M.
Angelosanto
, et al
.
2013
.
Innate lymphoid cells regulate CD4+ T-cell responses to intestinal commensal bacteria
.
Nature
.
498
:
113
–
117
.
Huang
,
D.W.
,
B.T.
Sherman
, and
R.A.
Lempicki
.
2009
.
Systematic and integrative analysis of large gene lists using DAVID bioinformatics resources
.
Nat. Protoc.
4
:
44
–
57
.
Huang
,
H.
,
X.
Dong
,
M.X.
Kang
,
B.
Xu
,
Y.
Chen
,
B.
Zhang
,
J.
Chen
,
Q.P.
Xie
, and
Y.L.
Wu
.
2010
.
Novel blood biomarkers of pancreatic cancer–associated diabetes mellitus identified by peripheral blood–based gene expression profiles
.
Am. J. Gastroenterol.
105
:
1661
–
1669
.
Huber
,
W.
,
V.J.
Carey
,
R.
Gentleman
,
S.
Anders
,
M.
Carlson
,
B.S.
Carvalho
,
H.C.
Bravo
,
S.
Davis
,
L.
Gatto
,
T.
Girke
, et al
.
2015
.
Orchestrating high-throughput genomic analysis with Bioconductor
.
Nat. Methods
.
12
:
115
–
121
.
Huxley
,
R.
,
S.
Lewington
, and
R.
Clarke
.
2002
.
Cholesterol, coronary heart disease and stroke: A review of published evidence from observational studies and randomized controlled trials
.
Semin. Vasc. Med.
2
:
315
–
323
.
Jansen
,
P.A.M.
,
J.A.
van Diepen
,
B.
Ritzen
,
P.L.J.M.
Zeeuwen
,
I.
Cacciatore
,
C.
Cornacchia
,
I.M.J.J.
van Vlijmen-Willems
,
E.
de Heuvel
,
P.N.M.
Botman
,
R.H.
Blaauw
, et al
.
2013
.
Discovery of small molecule vanin inhibitors: New tools to study metabolism and disease
.
ACS Chem. Biol.
8
:
530
–
534
.
Joosten
,
S.A.
,
L.C.
Sullivan
, and
T.H.M.
Ottenhoff
.
2016
.
Characteristics of HLA-E restricted T-cell responses and their role in infectious diseases
.
J. Immunol. Res.
2016
:
2695396
.
Kaskow
,
B.J.
,
J.
Michael Proffit
,
J.
Blangero
,
E.K.
Moses
, and
L.J.
Abraham
.
2012
.
Diverse biological activities of the vascular non-inflammatory molecules – the Vanin pantetheinases
.
Biochem. Biophys. Res. Commun.
417
:
653
–
658
.
Kelly
,
B.
, and
L.A.J.
O’Neill
.
2015
.
Metabolic reprogramming in macrophages and dendritic cells in innate immunity
.
Cell Res.
25
:
771
–
784
.
Liberzon
,
A.
,
A.
Subramanian
,
R.
Pinchback
,
H.
Thorvaldsdóttir
,
P.
Tamayo
, and
J.P.
Mesirov
.
2011
.
Molecular signatures database (MSigDB) 3.0
.
Bioinformatics
.
27
:
1739
–
1740
.
Liu
,
C.
,
X.
Alimu
,
X.
Zeng
,
A.
Bahabayi
,
Y.
Gao
,
Y.
Hu
,
Y.
Chen
,
J.
Zhao
,
X.
Lian
,
M.
Zheng
, et al
.
2024
.
Vanin-2 is expressed in peripheral blood T cells and upregulated in patients with systemic lupus erythematosus
.
J. Leukoc. Biol.
116
:
1469
–
1478
.
Liu
,
J.
,
X.
Zhang
,
Y.
Cheng
, and
X.
Cao
.
2021
.
Dendritic cell migration in inflammation and immunity
.
Cell. Mol. Immunol.
18
:
2461
–
2471
.
Lou
,
F.
,
Y.
Sun
,
Z.
Xu
,
L.
Niu
,
Z.
Wang
,
S.
Deng
,
Z.
Liu
,
H.
Zhou
,
J.
Bai
,
Q.
Yin
, et al
.
2020
.
Excessive polyamine generation in keratinocytes promotes self-RNA sensing by dendritic cells in psoriasis
.
Immunity
.
53
:
204
–
216.e10
.
Lu
,
P.
,
C.
Zhang
,
L.
Fu
,
Y.
Wei
,
Y.
Huang
,
X.
Wang
,
C.
Lv
, and
L.
Chen
.
2021
.
Near-infrared fluorescent Probe for imaging and evaluating the role of vanin-1 in chemotherapy
.
Anal. Chem.
93
:
10378
–
10387
.
McCarty
,
M.F.
2001
.
Inhibition of acetyl-CoA carboxylase by cystamine may mediate the hypotriglyceridemic activity of pantethine
.
Med. Hypotheses
.
56
:
314
–
317
.
Miallot
,
R.
,
V.
Millet
,
A.
Roger
,
R.
Fenouil
,
C.
Tardivel
,
J.-C.
Martin
,
F.
Tranchida
,
L.
Shintu
,
P.
Berchard
,
J.S.
Lanza
, et al
.
2023
.
The coenzyme A precursor pantethine enhances antitumor immunity in sarcoma
.
Life Sci. Alliance
.
6
:e202302200.
Millet
,
V.
,
T.
Gensollen
,
M.
Maltese
,
M.
Serrero
,
N.
Lesavre
,
C.
Bourges
,
C.
Pitaval
,
S.
Cadra
,
L.
Chasson
,
T.P.V.
Vu Man
, et al
.
2023
.
Harnessing the Vnn1 pantetheinase pathway boosts short chain fatty acids production and mucosal protection in colitis
.
Gut
.
72
:
1115
–
1128
.
Min-Oo
,
G.
,
A.
Fortin
,
G.
Pitari
,
M.
Tam
,
M.M.
Stevenson
, and
P.
Gros
.
2007
.
Complex genetic control of susceptibility to malaria: Positional cloning of the Char9 locus
.
J. Exp. Med.
204
:
511
–
524
.
Nemati
,
H.
,
R.
Khodarahmi
,
A.
Rahmani
,
A.
Ebrahimi
,
M.
Amani
, and
K.
Eftekhari
.
2013
.
Serum lipid profile in psoriatic patients: Correlation between vascular adhesion protein 1 and lipoprotein (a)
.
Cell Biochem. Funct.
31
:
36
–
40
.
Newman
,
A.M.
,
C.B.
Steen
,
C.L.
Liu
,
A.J.
Gentles
,
A.A.
Chaudhuri
,
F.
Scherer
,
M.S.
Khodadoust
,
M.S.
Esfahani
,
B.A.
Luca
,
D.
Steiner
, et al
.
2019
.
Determining cell type abundance and expression from bulk tissues with digital cytometry
.
Nat. Biotechnol.
37
:
773
–
782
.
Nutt
,
S.L.
, and
M.
Chopin
.
2020
.
Transcriptional networks driving dendritic cell differentiation and function
.
Immunity
.
52
:
942
–
956
.
Ogata
,
H.
,
S.
Goto
,
K.
Sato
,
W.
Fujibuchi
,
H.
Bono
, and
M.
Kanehisa
.
1999
.
KEGG: Kyoto encyclopedia of genes and genomes
.
Nucleic Acids Res.
27
:
29
–
34
.
Pannu
,
S.
, and
D.
Rosmarin
.
2021
.
Psoriasis in patients with metabolic syndrome or type 2 diabetes mellitus: Treatment challenges
.
Am. J. Clin. Dermatol.
22
:
293
–
300
.
Pearce
,
E.J.
, and
B.
Everts
.
2015
.
Dendritic cell metabolism
.
Nat. Rev. Immunol.
15
:
18
–
29
.
Penet
,
M.-F.
,
M.
Abou-Hamdan
,
N.
Coltel
,
E.
Cornille
,
G.E.
Grau
,
M.
de Reggi
, and
B.
Gharib
.
2008
.
Protection against cerebral malaria by the low-molecular-weight thiol pantethine
.
Proc. Natl. Acad. Sci. USA
.
105
:
1321
–
1326
.
Penet
,
M.-F.
,
B.
Krishnamachary
,
F.
Wildes
,
Y.
Mironchik
,
D.
Mezzanzanica
,
F.
Podo
,
M.
de Reggi
,
B.
Gharib
, and
Z.M.
Bhujwalla
.
2016
.
Effect of pantethine on ovarian tumor progression and choline metabolism
.
Front. Oncol.
6
:
244
.
Płóciennikowska
,
A.
,
A.
Hromada-Judycka
,
K.
Borzęcka
, and
K.
Kwiatkowska
.
2015
.
Co-operation of TLR4 and raft proteins in LPS-induced pro-inflammatory signaling
.
Cell. Mol. Life Sci.
72
:
557
–
581
.
Puig
,
L.
2011
.
Obesity and psoriasis: Body weight and body mass index influence the response to biological treatment
.
J. Eur. Acad. Dermatol. Venereol.
25
:
1007
–
1011
.
Rana
,
A.
,
E.
Seinen
,
K.
Siudeja
,
R.
Muntendam
,
B.
Srinivasan
,
J.J.
van der Want
,
S.
Hayflick
,
D.-J.
Reijngoud
,
O.
Kayser
, and
O.C.M.
Sibon
.
2010
.
Pantethine rescues a Drosophila model for pantothenate kinase–associated neurodegeneration
.
Proc. Natl. Acad. Sci. USA
.
107
:
6988
–
6993
.
Reis e Sousa
,
C.
2006
.
Dendritic cells in a mature age
.
Nat. Rev. Immunol.
6
:
476
–
483
.
Schalkwijk
,
J.
, and
P.
Jansen
.
2014
.
Chemical biology tools to study pantetheinases of the vanin family
.
Biochem. Soc. Trans.
42
:
1052
–
1055
.
Shen
,
Z.
,
M.
Fang
,
W.
Sun
,
M.
Tang
,
N.
Liu
,
L.
Zhu
,
Q.
Liu
,
B.
Li
,
R.
Sun
,
Y.
Shi
, et al
.
2022
.
A transcriptome atlas and interactive analysis platform for autoimmune disease
.
Database
.
2022
:
baac050
.
Sherman
,
B.T.
,
M.
Hao
,
J.
Qiu
,
X.
Jiao
,
M.W.
Baseler
,
H.C.
Lane
,
T.
Imamichi
, and
W.
Chang
.
2022
.
DAVID: A web server for functional enrichment analysis and functional annotation of gene lists (2021 update)
.
Nucleic Acids Res.
50
:
W216
–
W221
.
Siudeja
,
K.
,
B.
Srinivasan
,
L.
Xu
,
A.
Rana
,
J.
de Jong
,
E.A.A.
Nollen
,
S.
Jackowski
,
L.
Sanford
,
S.
Hayflick
, and
O.C.M.
Sibon
.
2011
.
Impaired Coenzyme A metabolism affects histone and tubulin acetylation in Drosophila and human cell models of pantothenate kinase associated neurodegeneration
.
EMBO Mol. Med.
3
:
755
–
766
.
Soler
,
D.C.
,
A.
Kerstetter-Fogle
,
A.B.
Young
,
P.
Rayman
,
J.H.
Finke
,
S.M.
Debanne
,
K.D.
Cooper
,
J.
Barnholtz-Sloan
,
A.E.
Sloan
, and
T.S.
McCormick
.
2022
.
Healthy myeloid-derived suppressor cells express the surface ectoenzyme Vanin-2 (VNN2)
.
Mol. Immunol.
142
:
1
–
10
.
Stebegg
,
M.
,
A.
Bignon
,
D.L.
Hill
,
A.
Silva-Cayetano
,
C.
Krueger
,
I.
Vanderleyden
,
S.
Innocentin
,
L.
Boon
,
J.
Wang
,
M.S.
Zand
, et al
.
2020
.
Rejuvenating conventional dendritic cells and T follicular helper cell formation after vaccination
.
Elife
.
9
:e52473.
Subramanian
,
A.
,
P.
Tamayo
,
V.K.
Mootha
,
S.
Mukherjee
,
B.L.
Ebert
,
M.A.
Gillette
,
A.
Paulovich
,
S.L.
Pomeroy
,
T.R.
Golub
,
E.S.
Lander
, and
J.P.
Mesirov
.
2005
.
Gene set enrichment analysis: A knowledge-based approach for interpreting genome-wide expression profiles
.
Proc. Natl. Acad. Sci. USA
.
102
:
15545
–
15550
.
Tang
,
D.
,
M.
Chen
,
X.
Huang
,
G.
Zhang
,
L.
Zeng
,
G.
Zhang
,
S.
Wu
, and
Y.
Wang
.
2023
.
SRplot: A free online platform for data visualization and graphing
.
PLoS One
.
18
:e0294236.
Tang
,
R.
,
N.
Acharya
,
A.
Subramanian
,
V.
Purohit
,
M.
Tabaka
,
Y.
Hou
,
D.
He
,
K.O.
Dixon
,
C.
Lambden
,
J.
Xia
, et al
.
2022
.
Tim-3 adapter protein Bat3 acts as an endogenous regulator of tolerogenic dendritic cell function
.
Sci. Immunol.
7
:eabm0631.
van der Fits
,
L.
,
S.
Mourits
,
J.S.A.
Voerman
,
M.
Kant
,
L.
Boon
,
J.D.
Laman
,
F.
Cornelissen
,
A.-M.
Mus
,
E.
Florencia
,
E.P.
Prens
, and
E.
Lubberts
.
2009
.
Imiquimod-induced psoriasis-like skin inflammation in mice is mediated via the IL-23/IL-17 Axis
.
J. Immunol.
182
:
5836
–
5845
.
van Diepen
,
J.A.
,
P.A.
Jansen
,
D.B.
Ballak
,
A.
Hijmans
,
F.P.J.T.
Rutjes
,
C.J.
Tack
,
M.G.
Netea
,
J.
Schalkwijk
, and
R.
Stienstra
.
2016
.
Genetic and pharmacological inhibition of vanin-1 activity in animal models of type 2 diabetes
.
Sci. Rep.
6
:
21906
.
Wang
,
J.
,
J.
Wang
,
W.
Hong
,
L.
Zhang
,
L.
Song
,
Q.
Shi
,
Y.
Shao
,
G.
Hao
,
C.
Fang
,
Y.
Qiu
, et al
.
2021
.
Optineurin modulates the maturation of dendritic cells to regulate autoimmunity through JAK2-STAT3 signaling
.
Nat. Commun.
12
:
6198
.
Wculek
,
S.K.
,
F.J.
Cueto
,
A.M.
Mujal
,
I.
Melero
,
M.F.
Krummel
, and
D.
Sancho
.
2020
.
Dendritic cells in cancer immunology and immunotherapy
.
Nat. Rev. Immunol.
20
:
7
–
24
.
Wu
,
L.
,
Z.
Yan
,
Y.
Jiang
,
Y.
Chen
,
J.
Du
,
L.
Guo
,
J.
Xu
,
Z.
Luo
, and
Y.
Liu
.
2023
.
Metabolic regulation of dendritic cell activation and immune function during inflammation
.
Front. Immunol.
14
:
1140749
.
Xia
,
Y.
,
Y.
Xie
,
Z.
Yu
,
H.
Xiao
,
G.
Jiang
,
X.
Zhou
,
Y.
Yang
,
X.
Li
,
M.
Zhao
,
L.
Li
, et al
.
2018
.
The mevalonate pathway is a druggable target for vaccine adjuvant discovery
.
Cell
.
175
:
1059
–
1073.e21
.
Yong
,
L.
,
Y.
Yu
,
B.
Li
,
H.
Ge
,
Q.
Zhen
,
Y.
Mao
,
Y.
Yu
,
L.
Cao
,
R.
Zhang
,
Z.
Li
, et al
.
2022
.
Calcium/calmodulin-dependent protein kinase IV promotes imiquimod-induced psoriatic inflammation via macrophages and keratinocytes in mice
.
Nat. Commun.
13
:
4255
.
Yu
,
Y.
,
M.
van der Zwaag
,
J.J.
Wedman
,
H.
Permentier
,
N.
Plomp
,
X.
Jia
,
B.
Kanon
,
E.
Eggens-Meijer
,
G.
Buist
,
H.
Harmsen
, et al
.
2022
.
Coenzyme A precursors flow from mother to zygote and from microbiome to host
.
Mol. Cell
.
82
:
2650
–
2665.e12
.
Yuan
,
X.
,
Y.
Duan
,
Y.
Xiao
,
K.
Sun
,
Y.
Qi
,
Y.
Zhang
,
Z.
Ahmed
,
D.
Moiani
,
J.
Yao
,
H.
Li
, et al
.
2022
.
Vitamin E enhances cancer immunotherapy by reinvigorating dendritic cells via targeting checkpoint SHP1
.
Cancer Discov.
12
:
1742
–
1759
.
Zhang
,
S.
,
C.
Audiger
,
M.
Chopin
, and
S.L.
Nutt
.
2023
.
Transcriptional regulation of dendritic cell development and function
.
Front. Immunol.
14
:
1182553
.
Zhang
,
X.
,
Y.
Chen
,
G.
Sun
,
Y.
Fei
,
H.
Zhu
,
Y.
Liu
,
J.
Dan
,
C.
Li
,
X.
Cao
, and
J.
Liu
.
2024
.
Farnesyl pyrophosphate potentiates dendritic cell migration in autoimmunity through mitochondrial remodelling
.
Nat. Metab.
6
:
2118
–
2137
.
Zhao
,
H.
,
Y.
Yu
,
Y.
Wang
,
L.
Zhao
,
A.
Yang
,
Y.
Hu
,
Z.
Pan
,
Z.
Wang
,
J.
Yang
,
Q.
Han
, et al
.
2022
.
Cholesterol accumulation on dendritic cells reverses chronic hepatitis B virus infection-induced dysfunction
.
Cell. Mol. Immunol.
19
:
1347
–
1360
.
Zizioli
,
D.
,
N.
Tiso
,
A.
Guglielmi
,
C.
Saraceno
,
G.
Busolin
,
R.
Giuliani
,
D.
Khatri
,
E.
Monti
,
G.
Borsani
,
F.
Argenton
, and
D.
Finazzi
.
2016
.
Knock-down of pantothenate kinase 2 severely affects the development of the nervous and vascular system in zebrafish, providing new insights into PKAN disease
.
Neurobiol. Dis.
85
:
35
–
48
.

or Create an Account

Close subscription notice
Close access options