
Skip Nav Destination
Close Modal
![Quantitative affinity proteomics identifies SQSTM1/p62 as an interaction partner of the CUL3 adaptor SHKBP1. (A) Workflow of the first set of proteomics experiments using the neddylation inhibitor MLN4924 to enrich unstable CRL targets (left) and cartoon representation of drug treatment mechanism (right). Cells were treated with MLN4924 (10 μM) or vehicle for 16 h. (B) Workflow of the second set of proteomics experiments using tandem UBA domain fusions to SHKBP1 to enrich ubiquitinated substrates (left) and model of ligase trap (right). Cells stably expressing the corresponding construct were treated with MG-132 (20 μM) for 2 h. (C) Workflow of the third set of proteomics experiments using the SHKBP1F44A CUL3 binding–deficient mutant to reduce CRL complex components in IP compared with SHKBP1WT (left) and corresponding model (right). (D–F) Volcano plots from the three SILAC MS proteomics experiments, showing log2 (fold changes of protein abundance in heavy/light samples) vs. statistical significance (–log10 [P value]). Proteins whose change was below the cutoff (fold change < 1.2) are indicated in gray. Those above the cutoff with P values above 0.05 are shown in green, and those with P values below 0.05 are shown in purple.](https://cdn.rupress.org/rup/content_public/journal/jcb/225/4/10.1083_jcb.202501207/1/s_jcb_202501207_fig1.png?Expires=2147483647&Signature=ZZrjo-BdZdGpyOmKeIwBcjysry8RtorG3ax3FGxq1bD-2h-OTnhC4NMa1s75gMySYd~8RyL8W~i7Jh4oQNJ6ksYAP9vpTsFTf55VpWOwcoAPi4S-LUrPXFxIxqfieAi7wjBUzK-bJLqviIZdVSuX8-Wx2BAYw6J41KhzLGVcwk~fpRD26dilkfFlSu~~5dNylHWzTJjmjJfTq2DsCoLwK1H~bhhE2npT9XUEtN~OeYjtVJ8TMMVmSBFbWXHbKaZLCQ~FffNeP7L4hT580VePPCuFS2xKjdD2~N5RYQOeGqZVjJxs1jtFFKxeRM95KbXMliBsiTBkcVXIo8Idc2j-4A__&Key-Pair-Id=APKAIE5G5CRDK6RD3PGA)


1-20 of 119157
Follow your search
Access your saved searches in your account
Would you like to receive an alert when new items match your search?
1
Journal Articles
Journal:
Journal of Cell Biology
J Cell Biol (2026) 225 (4): e202501207.
Published: 06 February 2026
Includes: Supplementary data
in Cullin-3 adaptor SHKBP1 inhibits SQSTM1/p62 oligomerization and Keap1 sequestration
> Journal of Cell Biology
Published: 06 February 2026
Figure 1. Quantitative affinity proteomics identifies SQSTM1/p62 as an interaction partner of the CUL3 adaptor SHKBP1. (A) Workflow of the first set of proteomics experiments using the neddylation inhibitor MLN4924 to enrich unstable CRL targets More about this image found in Quantitative affinity proteomics identifies SQSTM1/p62 as an interaction pa...
in Cullin-3 adaptor SHKBP1 inhibits SQSTM1/p62 oligomerization and Keap1 sequestration
> Journal of Cell Biology
Published: 06 February 2026
Figure 2. SHKBP1 interacts with p62 under resting conditions and upon blockade of neddylation and proteasomal degradation. (A) Western blot analysis of whole-cell lysates (WCL) and α-GFP immunoprecipitates from HeLa cells cotransfected with More about this image found in SHKBP1 interacts with p62 under resting conditions and upon blockade of ned...
in Cullin-3 adaptor SHKBP1 inhibits SQSTM1/p62 oligomerization and Keap1 sequestration
> Journal of Cell Biology
Published: 06 February 2026
Figure 3. WD domain of SHKBP1 interacts with the PB1 domain of p62. (A) Domain map of SHKBP1 and truncations used in this paper. (B) Representative live-cell images showing localization of full-length (FL) and truncated forms of SHKBP1. HeLa More about this image found in WD domain of SHKBP1 interacts with the PB1 domain of p62. (A) Domain map o...
in Cullin-3 adaptor SHKBP1 inhibits SQSTM1/p62 oligomerization and Keap1 sequestration
> Journal of Cell Biology
Published: 06 February 2026
Figure 4. SHKBP1 inhibits p62 oligomerization without affecting its ubiquitination state. (A) Western blot analysis of in vivo ubiquitination assay. WT or SHKBP1 KO HeLa cells were cotransfected with His-ubiquitin and either GFP-p62 or GFP EV, More about this image found in SHKBP1 inhibits p62 oligomerization without affecting its ubiquitination st...
in Cullin-3 adaptor SHKBP1 inhibits SQSTM1/p62 oligomerization and Keap1 sequestration
> Journal of Cell Biology
Published: 06 February 2026
Figure 5. SHKBP1 decreases the fluidity of cellular p62 bodies. (A) WT and SHKBP1 KO HeLa cells were transfected with GFP-p62 alone or in combination with mScarlet-i-SHKBP1. 24 h later, cells were subjected to live-cell imaging by confocal More about this image found in SHKBP1 decreases the fluidity of cellular p62 bodies. (A) WT and SHKBP1 KO...
in Cullin-3 adaptor SHKBP1 inhibits SQSTM1/p62 oligomerization and Keap1 sequestration
> Journal of Cell Biology
Published: 06 February 2026
in Cullin-3 adaptor SHKBP1 inhibits SQSTM1/p62 oligomerization and Keap1 sequestration
> Journal of Cell Biology
Published: 06 February 2026
in Cullin-3 adaptor SHKBP1 inhibits SQSTM1/p62 oligomerization and Keap1 sequestration
> Journal of Cell Biology
Published: 06 February 2026
in Cullin-3 adaptor SHKBP1 inhibits SQSTM1/p62 oligomerization and Keap1 sequestration
> Journal of Cell Biology
Published: 06 February 2026
Figure 6. SHKBP1 inhibits Keap1 aggregation and clearance via p62 bodies. (A) Western blot analysis of co-IP experiments for endogenous p62. Lysates were from WT HeLa cells, SHKBP1 KO HeLa cells, and HeLa cells transfected with mScarlet-i-SHKBP1 More about this image found in SHKBP1 inhibits Keap1 aggregation and clearance via p62 bodies. (A) Wester...
in Cullin-3 adaptor SHKBP1 inhibits SQSTM1/p62 oligomerization and Keap1 sequestration
> Journal of Cell Biology
Published: 06 February 2026
Figure 7. SHKBP1 KO enhances Nrf2 nuclear translocation. (A) IF analysis of endogenous Nrf2 in WT and SHKBP1 KO HeLa cells by confocal microscopy. Nuclei were stained with DAPI (magenta). Cells were treated with As(III) (10 µM) for the indicated More about this image found in SHKBP1 KO enhances Nrf2 nuclear translocation. (A) IF analysis of endogeno...
Journal Articles
Journal:
Journal of Cell Biology
J Cell Biol (2026) 225 (3): e20030208401202026c.
Published: 05 February 2026

in Correction: Bax and Bak can localize to the endoplasmic reticulum to initiate apoptosis
> Journal of Cell Biology
Published: 05 February 2026
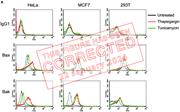
Figure 2. ER stress induces Bax and Bak conformational changes and oligomerization at the ER. (A) ER stresses induce the conformational changes of Bax and Bak. HeLa, MCF7, and 293T cells were treated with thapsigargin (Thap; 2 µM) or tunicamycin More about this image found in ER stress induces Bax and Bak conformational changes and oligomerization at...
in Correction: Bax and Bak can localize to the endoplasmic reticulum to initiate apoptosis
> Journal of Cell Biology
Published: 05 February 2026
Figure 2. ER stress induces Bax and Bak conformational changes and oligomerization at the ER. (A) ER stresses induce the conformational changes of Bax and Bak. HeLa, MCF7, and 293T cells were treated with thapsigargin (Thap; 2 µM) or tunicamycin More about this image found in ER stress induces Bax and Bak conformational changes and oligomerization at...
Journal Articles
Journal:
Journal of Cell Biology
J Cell Biol (2026) 225 (3): e202506149.
Published: 03 February 2026
Includes: Supplementary data
Journal Articles
Journal:
Journal of Cell Biology
J Cell Biol (2026) 225 (4): e202506069.
Published: 03 February 2026
Includes: Supplementary data
Journal Articles
Journal:
Journal of Cell Biology
J Cell Biol (2026) 225 (4): e202510133.
Published: 03 February 2026
Includes: Supplementary data
Journal Articles
Journal:
Journal of Cell Biology
J Cell Biol (2026) 225 (4): e202507149.
Published: 03 February 2026
Includes: Supplementary data
1

