
Skip Nav Destination
Close Modal


1-20 of 107
Follow your search
Access your saved searches in your account
Would you like to receive an alert when new items match your search?
1
Journal Articles
In Special Collection:
Nuclear Organization 2019
Journal:
Journal of Cell Biology
J Cell Biol (2019) 218 (5): 1467–1477.
Published: 07 March 2019
Includes: Supplementary data
in Cell cycle– and genomic distance–dependent dynamics of a discrete chromosomal region
> Journal of Cell Biology
Published: 07 March 2019
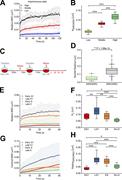
Figure 1. Relative and centroid dynamics of a locus pair situated at a 4.6-kb distance. (A and B) Diagram of CRISPR-Sirius design. (C) Genomic location of IDR2 and IDR3 with their 4.6-kb inter-locus distance. (D and E) Contrasting mobilities More about this image found in Relative and centroid dynamics of a locus pair situated at a 4.6-kb distanc...
in Cell cycle– and genomic distance–dependent dynamics of a discrete chromosomal region
> Journal of Cell Biology
Published: 07 March 2019
Figure 2. Distinct chromosome dynamics during cell cycle progression in interphase. (A) Relative MSD of IDR2 and IDR3 pair from asynchronous cells was classified into low, middle, and high MSD groups. n = 13 trajectories for high, n = 11 for More about this image found in Distinct chromosome dynamics during cell cycle progression in interphase. (...
in Cell cycle– and genomic distance–dependent dynamics of a discrete chromosomal region
> Journal of Cell Biology
Published: 07 March 2019
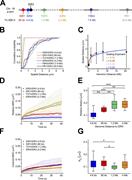
Figure 3. Spatial distance and dynamics of locus pairs situated at kilobase to megabase apart. (A) Diagram of loci on the p-arm of chromosome 19 with distances from IDR3 of 4.6 kb (IDR2), 80 kb (IDR1), 1.2 Mb (TCF3), 4.2 Mb (IDR4), 7.8 Mb More about this image found in Spatial distance and dynamics of locus pairs situated at kilobase to megaba...
in Cell cycle– and genomic distance–dependent dynamics of a discrete chromosomal region
> Journal of Cell Biology
Published: 07 March 2019
Figure 4. Model of cell cycle–dependent chromosome dynamics. Top: Two distinct dynamic modes (local movement and domain movement). Middle: Chromosomal fiber relaxation and dynamics during interphase progression. Bottom: Contrasting dynamics of More about this image found in Model of cell cycle–dependent chromosome dynamics. Top: Two distinct dynam...
Journal Articles
In Special Collection:
JCB65: Nuclear and Chromatin Biology
, Nuclear Organization 2019
, RNA
, The Year in Cell Biology: 2019
Journal:
Journal of Cell Biology
J Cell Biol (2019) 218 (5): 1511–1530.
Published: 01 March 2019
Includes: Supplementary data
in Single nucleosome imaging reveals loose genome chromatin networks via active RNA polymerase II
> Journal of Cell Biology
Published: 01 March 2019
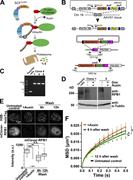
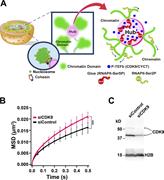
Figure 1. Single-nucleosome imaging in living RPE-1 cells. (A) Expression of H2B-Halo in RPE-1 cells was confirmed by Western blotting with αH2B antibody (lane 1). In lane 2, parental RPE-1 cells show no H2B-Halo signals. (B) RPE-1 cells More about this image found in Single-nucleosome imaging in living RPE-1 cells. (A) Expression of H2B-Hal...
in Single nucleosome imaging reveals loose genome chromatin networks via active RNA polymerase II
> Journal of Cell Biology
Published: 01 March 2019
Figure 2. Decrease in the amount of active RNAPII and RNA synthesis by RNAPII inhibitors. (A) Scheme for RNAPII regulation by phosphorylation of its CTD repeats, (YSPTSPS) × 52. In the initiation process, RNAPII, in which Ser5 of CTD is More about this image found in Decrease in the amount of active RNAPII and RNA synthesis by RNAPII inhibit...
in Single nucleosome imaging reveals loose genome chromatin networks via active RNA polymerase II
> Journal of Cell Biology
Published: 01 March 2019
Figure 3. Increased chromatin dynamics by RNAPII inhibitors. (A) MSD plots (±SD among cells) of nucleosomes in the RPE-1 cells treated with RNAPII inhibitors, α-AM (pink), DRB (purple), and ActD (brown). The controls are DMSO (gray), MQ (light More about this image found in Increased chromatin dynamics by RNAPII inhibitors. (A) MSD plots (±SD amon...
in Single nucleosome imaging reveals loose genome chromatin networks via active RNA polymerase II
> Journal of Cell Biology
Published: 01 March 2019
Figure 4. Inhibitors of RNA polymerase I and splicing had little influence on the chromatin dynamics. (A) Verification of RNA polymerase I inhibition in RPE-1 cells with CX5461 by EU incorporation. (B) The box plots show RNAPII-Ser5P signal More about this image found in Inhibitors of RNA polymerase I and splicing had little influence on the chr...
in Single nucleosome imaging reveals loose genome chromatin networks via active RNA polymerase II
> Journal of Cell Biology
Published: 01 March 2019
Figure 5. Rapid degradation of RNAPII increased the chromatin dynamics. (A) A schematic illustration of the AID system ( Natsume et al., 2016 ; Yesbolatova et al., 2019 Preprint). OsTIR1, which was expressed by addition of doxycycline, can More about this image found in Rapid degradation of RNAPII increased the chromatin dynamics. (A) A schema...
in Single nucleosome imaging reveals loose genome chromatin networks via active RNA polymerase II
> Journal of Cell Biology
Published: 01 March 2019
Figure 6. Serum starvation increased chromatin dynamics. (A) Experimental scheme. Proliferating cells were starved by removing serum from the culture medium. Most of the cells entered the quiescent G0 phase. The starved cells were then More about this image found in Serum starvation increased chromatin dynamics. (A) Experimental scheme. Pr...
in Single nucleosome imaging reveals loose genome chromatin networks via active RNA polymerase II
> Journal of Cell Biology
Published: 01 March 2019
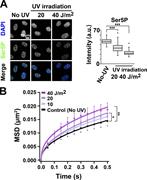
Figure 7. UV-induced increase in chromatin dynamics. (A) Left: RNAPII activity of RPE-1 cells before (no UV) and after 20-or 40-J/m2 UV irradiation observed by immunostaining of Ser5P in RNAPII. Right: Quantifications of RNAPII Ser5P signal More about this image found in UV-induced increase in chromatin dynamics. (A) Left: RNAPII activity of RP...
in Single nucleosome imaging reveals loose genome chromatin networks via active RNA polymerase II
> Journal of Cell Biology
Published: 01 March 2019
Figure 8. A model for chromatin networking via RNAPII-Ser5P. (A) A model for the formation of a loose spatial genome chromatin network via RNAPII-Ser5P, which can globally constrain chromatin dynamics. The P-TEFb complex (blue sphere in right More about this image found in A model for chromatin networking via RNAPII-Ser5P. (A) A model for the for...
1

