Skip to Main Content
Skip Nav Destination
1-20 of 163
Follow your search
Access your saved searches in your account

Would you like to receive an alert when new items match your search?
Close Modal
Sort by
Journal Articles
Images
DC F-actin depolymerization affects immune synapse structure and T cell priming efficiency.(A) Bright field images of mature DCs treated with 1 µM MycB (right) or DMSO (left). Scale bar: 10 µm. (B) Flow cytometry profiles of DMSO and 1 µM MycB-treated mature DCs. Cd11c/MHC II plots are pregated on FSC-A/SSC-A population defined by black oval on the left, representative example of three biological replicates. (C) Immunofluorescence images of synapses formed between DMSO or 1 µM MycB-treated mature DCs and T cells. Upper panel: overview pictures, yellow dotted line outlines DC. Scale bar: 5 µm. Middle panel: en face view on the synaptic interface. Scale bar: 1 µm. Lower panel: surface reconstruction of the synaptic interface. (D) Percentages of mono- and multifocal synapses formed between T cells and 1 µM MycB-treated mature DCs, n = 20 cell duplets for each condition, three biological replicates, mean ± SD. (E) Percentages of activated T cells assessed by CD62L/CD69 surface expression after 16 h of coculture with DMSO or 1 µM MycB-treated mature DCs at indicated OVA323-339 peptide concentrations, three biological replicates, mean ± SD. (F) CFSE dilution profile of T cells after 96 h of coculture with DMSO or 1 µM MycB-treated mature DCs at indicated OVA323-339 peptide concentrations, representative example of three biological replicates. (G) Proliferation indices of CFSE-labeled T cells after 96 h of coculture with DMSO or 1 µM MycB-treated mature DCs at indicated OVA323-339 peptide concentrations, three biological replicates, mean ± SD. (H) Absolute T cell numbers after 96 h of coincubation with DMSO or 1 µM MycB-treated mature DCs at indicated OVA323-339 peptide concentrations, three biological replicates, mean ± SD. Data in E, G, and H were tested for normal distribution, transformed if necessary, and tested by using Student’s t test. FSC-A, forward scatter–A; ns, not significant; SSC-A, side scatter–A. *, P ≤ 0.05; **, P ≤ 0.01; ***, P ≤ 0.001.
Published: 03 February 2021
Figure 1. DC F-actin depolymerization affects immune synapse structure and T cell priming efficiency . (A) Bright field images of mature DCs treated with 1 µM MycB (right) or DMSO (left). Scale bar: 10 µm. (B) Flow cytometry profiles of DMSO More about this image found in DC F-actin depolymerization affects immune synapse structure and T cell pri...
Images
Further characterization of MycB treated DCs. (A) Flow cytometry experiment displaying relative mean fluorescence intensities (MFIs) for Cd11c (left) and MHC II (right) of DMSO- or 1 µM MycB–treated mature DCs, three biological replicates. (B) 7–Actinomycin D (7-AAD) life/dead stain flow cytometry histograms (left) and relative mean fluorescence intensities (right) of DMSO- or 1 µM MycB–treated mature DCs, three biological replicates.
Published: 03 February 2021
Figure S1. Further characterization of MycB treated DCs. (A) Flow cytometry experiment displaying relative mean fluorescence intensities (MFIs) for Cd11c (left) and MHC II (right) of DMSO- or 1 µM MycB–treated mature DCs, three biological More about this image found in Further characterization of MycB treated DCs. (A) Flow cytometry experimen...
Images
Characterization of the structure and dynamics of the DC and T cell actin cytoskeleton at the immunological synapse. (A) 3D projection of Lifeact-eGFP–expressing OT-II T cells (red), interacting with DMSO control (upper) or 1 µM MycB–treated (lower) and 5-Carboxytetramethylrhodamine (TAMRA)-stained mature DC (green). (B) En face time-lapse reconstruction of T cell synapses shown in A (yellow boxes). (C) Relative Lifeact-eGFP intensities along yellow lines shown in B. (D) Time-lapse series of synapses formed between WASP-eGFP (upper) or eGFP-Abi1 (lower) expressing mature WT DCs and OT-II T cells in confiner setup. Yellow ovals demarcate the outline of the T cell. Scale bar: 5 µm. (E) Deviation of maximum WASP-eGFP or Abi1-eGFP signal at the synapse from mean intensity in the cell body, n = 7 synapses for each reporter construct, t test. (F) 3D projection of Lifeact-eGFP–expressing OT-II T cells (red) interacting with WT (top) or hem1−/− (bottom) TAMRA-stained mature DCs (green). (G) En face time-lapse reconstruction of T cell synapses shown in F (yellow boxes). All scale bars: 5 µm. ****, P ≤ 0.0001.
Published: 03 February 2021
Figure S2. Characterization of the structure and dynamics of the DC and T cell actin cytoskeleton at the immunological synapse. (A) 3D projection of Lifeact-eGFP–expressing OT-II T cells (red), interacting with DMSO control (upper) or 1 µM More about this image found in Characterization of the structure and dynamics of the DC and T cell actin c...
Images
Dynamic F-actin foci at the DC immune synapse.(A) Schematic overview of PDMS confiner setup. (B) Left: Maximum intensity projection of Lifeact-eGFP–expressing mature WT DC interacting with TAMRA-stained T cells. Scale bar: 10 µm. Right: Z-stack of bright Lifeact-eGFP signal region on the left. Scale bar: 5 µm. (C) Examples of mature WT and hem1−/− DC–T cell immune synapses and machine learning–based segmentation of synaptic DC Lifeact-eGFP signal. Scale bar: 2 µm. (D) Normalized area of synaptic DC Lifeact-eGFP signal, n = 100 synapses each, Mann-Whitney test, mean ± SD, three biological replicates. (E) Normalized synaptic DC Lifeact-eGFP signal, n = 100 synapses each, Mann-Whitney test, mean ± SD, three biological replicates. (F) Left: Time-lapse series of synaptic DC Lifeact-eGFP signal. Right: Stack through time-lapse series. (G) Kymograph of yellow line in F. (H) Frame-to-frame similarity of synaptic DC Lifeact-eGFP signal, n ≪ 6,000 frame comparisons each, Mann-Whitney test, mean ± min/max, two biological replicates. ****, P ≤ 0.0001.
Published: 03 February 2021
Figure 2. Dynamic F-actin foci at the DC immune synapse. (A) Schematic overview of PDMS confiner setup. (B) Left: Maximum intensity projection of Lifeact-eGFP–expressing mature WT DC interacting with TAMRA-stained T cells. Scale bar: 10 µm. More about this image found in Dynamic F-actin foci at the DC immune synapse. (A) Schematic overview of ...
Images
Flow cytometry analysis of immature and mature wt and hem1−/− DCs. (A) Flow cytometry profiles of MHC II– and Cd11c-stained immature (left) or mature (right) WT or hem1−/− DCs. (B) Flow cytometry histograms of immature (light colors) and mature (dark colors) of WT (top) or hem1−/− (bottom) DCs stained for CD80, CD86, or CD40, respectively. (C) Flow cytometry histograms of three biological replicates for Lifeact-eGFP–expressing mature WT and hem1−/− DCs.
Published: 03 February 2021
Figure S3. Flow cytometry analysis of immature and mature wt and hem1 −/− DCs. (A) Flow cytometry profiles of MHC II– and Cd11c-stained immature (left) or mature (right) WT or hem1−/− DCs. (B) Flow cytometry histograms of immature (light More about this image found in Flow cytometry analysis of immature and mature wt and hem1 −/− ...
Images
Hem1−/− DCs are impaired in T cell activation.(A) Percentage of activated T cells assessed by CD62L/CD69 surface expression at indicated OVA323-339 peptide concentrations, three biological replicates, mean ± SD. (B) Exemplary CD62L/CD69 flow cytometry profile of T cells after 16 h of coculture with mature WT or hem1−/− DCs. (C) IL-2 ELISA after 16 h of T cell mature WT or hem1−/− DC coculture at indicated OVA323-339 peptide concentrations, three biological replicates, mean ± SD. (D) CFSE dilution profile of T cells after 96 h of coculture with mature WT or hem1−/− DCs at indicated OVA323-339 peptide concentrations, representative example of three biological replicates. (E) Absolute T cell numbers after 96 h of coincubation with mature WT or hem1−/− DCs at indicated OVA323-339 peptide concentrations, three biological replicates, mean ± SD. (F) Proliferation indices of CFSE-labeled T cells after 96 h of coculture with mature WT or hem1−/− DCs at indicated OVA323-339 peptide concentrations, three biological replicates, mean ± SD. (G) Exemplary CD4/CD69 (top) and CD4/IL-2 (bottom) flow cytometry profile of T cells after 6 h coculture with WT or hem1−/− DCs. (H) Fraction of IL-2–positive T cells after 4 or 6 h of coculture with mature WT or hem1−/− DCs, pregated on CD4high/CD69high, two biological replicates, one-way ANOVA, mean + SD. (I) Normalized IL-2 mean fluorescence intensity (MFI) of CD4high T cells after 4 or 6 h of coculture with mature WT or hem1−/− DCs, two biological replicates, one-way ANOVA, mean + SD. Data were normalized to WT 4 h. 10 µg/ml brefeldin A was added for the last 3 h of the cocultures in G, H, and I. Data in A, C, E, and F were tested for normal distribution, transformed if necessary, and tested by using Student’s t test. ns, not significant. *, P ≤ 0.05; **, P ≤ 0.01; ***, P ≤ 0.001; ****, P ≤ 0.0001.
Published: 03 February 2021
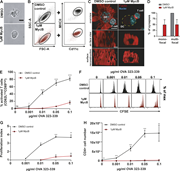
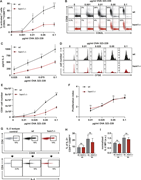
Figure 3. Hem1−/− DCs are impaired in T cell activation. (A) Percentage of activated T cells assessed by CD62L/CD69 surface expression at indicated OVA323-339 peptide concentrations, three biological replicates, mean ± SD. (B) Exemplary More about this image found in Hem1−/− DCs are impaired in T cell activation. (A) Percentage ...
Images
Hem1−/− DCs alter synapse structure and dynamics.(A) Fluorescence microscopy images of synapses formed between mature WT or hem1−/− DCs and T cells stained with phalloidin and DAPI. Scale bar: 5 µm. (B) Percentages of T cell surface area in contact with DC, ∼50 cells each, t test, mean ± SD, three biological replicates. (C) Interaction times of mature WT or hem1−/− DCs with T cells in the absence (−) or presence (+) of OVA323-339 peptide, n = 50 contacts each for (+) or n = 30 contacts each for (−), Mann-Whitney test, mean ± min/max, three biological replicates. (D and E) EM of WT DC–T cell synapse, T cells are colored in red, yellow box and dotted lines denote region magnified in E, yellow arrows highlight T cell protrusions. (F and G) EM of hem1−/− DC–T cell synapse, T cell is colored in red, yellow box and dotted lines denote region magnified in G. Scale bars: 1 µm in D and F, 300 nm in E and G. (H) Frequency histograms in percent of the angles found between DC and T cell membranes, n = 4 synapses each, two biological replicates, Kolmogorov-Smirnov test, P ≤ 0.0001. (I) Frequency histograms in percent of the cleft size found between DC and T cell membranes from H, Kolmogorov-Smirnov test, P ≤ 0.0001. ns, not significant. ****, P ≤ 0.0001.
Published: 03 February 2021
Figure 4. Hem1−/− DCs alter synapse structure and dynamics. (A) Fluorescence microscopy images of synapses formed between mature WT or hem1−/− DCs and T cells stained with phalloidin and DAPI. Scale bar: 5 µm. (B) Percentages of T cell More about this image found in Hem1−/− DCs alter synapse structure and dynamics. (A) Fluoresc...
Images
The dependency of T cell priming defects on the pERM-ICAM1-LFA-1 axis are specific to hem1−/− DCs. (A) Quantification of the number of T cells contacted by mature WT and hem1−/− DCs. Bars represent the median. Mann-Whitney test, three biological replicates. (B) Flow cytometry histogram for ICAM1 in mature WT and hem1−/− DCs. (C) Percentages of WT or 1 µM MycB–treated mature DCs activating β2-integrin–deficient T cells, as assessed by CD62L/CD69 surface expression at indicated OVA323-339 peptide concentrations. (D) Normalized relative number of WT and hem1−/− DCs in the popliteal lymph node 24 h after coinjection in a 1:2 ratio. t test. Data are pooled from nine different mice. *, P ≤ 0.05; **, P ≤ 0.01; ****, P ≤ 0.0001.
Published: 03 February 2021
Figure S4. The dependency of T cell priming defects on the pERM-ICAM1-LFA-1 axis are specific to hem1−/− DCs. (A) Quantification of the number of T cells contacted by mature WT and hem1−/− DCs. Bars represent the median. Mann-Whitney test, three More about this image found in The dependency of T cell priming defects on the pERM-ICAM1-LFA-1 axis are s...
Images
The hem1−/− DC–T cell priming defect is mediated by the pERM–ICAM1–LFA-1 axis.(A) Western blots for ERM, pERM, and GAPDH in mature WT and hem1−/− DCs, representative example of three biological replicates. (B) Relative intensity of pERM signal in mature WT and hem1−/− DCs, t test, three biological replicates. (C) Schematic overview of AFM setup for tether pulling. (D) Static tether force for mature WT and hem1−/− DCs, two biological replicates, t test. (E) Percentages of activated β2-integrin–deficient T cells assessed by CD62L/CD69 surface expression at indicated OVA323-339 peptide concentrations, three biological replicates, mean ± SD. Data were tested for normal distribution, transformed if necessary, and tested by using Student’s t test. ns, not significant. *, P ≤ 0.05; ***, P ≤ 0.001.
Published: 03 February 2021
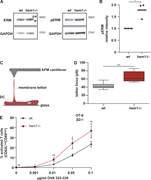
Figure 5. The hem1−/− DC–T cell priming defect is mediated by the pERM–ICAM1–LFA-1 axis. (A) Western blots for ERM, pERM, and GAPDH in mature WT and hem1−/− DCs, representative example of three biological replicates. (B) Relative intensity of More about this image found in The hem1−/− DC–T cell priming defect is mediated by the pERM–ICA...
Images
Hem1−/− DCs have T cell priming defects in vivo.(A) Schematic overview of experimental setup for two-photon intravital microscopy. (B) In vivo interaction times of mature WT or hem1−/− DCs and T cells, n = 45 cell–cell interactions each, Mann-Whitney test. Percentages refer to cell–cell interactions that start and end within the 30-min time window, two biological replicates. (C) Frequency histograms in percent of DC–T cell interaction times from B. (D) Schematic overview of experimental setup for in vivo T cell proliferation assays. (E) Gating strategy to determine the CFSE proliferation profiles of CD45.2/CD4 T cells in CD45.1 mice after WT or hem1−/− DC T cell priming. (F) Absolute CD45.2/CD4 T cell numbers in the popliteal lymph nodes of CD45.1 mice 72 h after DC injections, n = 6 lymph nodes each, Mann-Whitney test, two biological replicates. (G) Proliferation indices of CFSE-labeled T cells from F, t test. ns, not significant. **, P ≤ 0.01.
Published: 03 February 2021
Figure 6. Hem1−/− DCs have T cell priming defects in vivo. (A) Schematic overview of experimental setup for two-photon intravital microscopy. (B) In vivo interaction times of mature WT or hem1−/− DCs and T cells, n = 45 cell–cell interactions More about this image found in Hem1−/− DCs have T cell priming defects in vivo. (A) Schematic...

or Create an Account

Close Modal
Close Modal