
1-20 of 120002
Follow your search
Access your saved searches in your account
Would you like to receive an alert when new items match your search?
Journal Articles
Journal:
Journal of Cell Biology
J Cell Biol (2026) 225 (8): e202509039.
Published: 01 July 2026
Includes: Supplementary data
in Synergistic assembly, disassembly, and protection of complex forms of bundled F-actin
> Journal of Cell Biology
Published: 01 July 2026
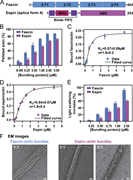
Figure 1. Fascin and espin robustly bundle actin filaments. (A) Domain structure of fascin and the espin splice form used in this study (espin-4). Fascin has four tandem β-trefoil folds (β-T) that form two ABS: ABS1 is formed by β-T1 and β-T4, More about this image found in Fascin and espin robustly bundle actin filaments. (A) Domain structure of ...
in Synergistic assembly, disassembly, and protection of complex forms of bundled F-actin
> Journal of Cell Biology
Published: 01 July 2026
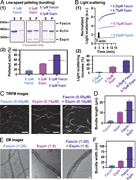
Figure 2. Fascin and espin synergize in actin bundles formation. (A) Low-speed sedimentation assays show that together fascin and espin bundle more actin filaments than would be expected from the sum of their individual effects. A representative More about this image found in Fascin and espin synergize in actin bundles formation. (A) Low-speed sedim...
in Synergistic assembly, disassembly, and protection of complex forms of bundled F-actin
> Journal of Cell Biology
Published: 01 July 2026
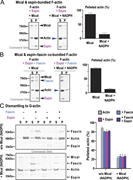
Figure 3. Mical robustly disassembles complex different protein-bundled F-actin structures. (A) Mical/NADPH disassembles espin-bundled F-actin. In low-speed pelleting assays, a majority of espin-bundled F-actin is present in the pellets (left). More about this image found in Mical robustly disassembles complex different protein-bundled F-actin struc...
in Synergistic assembly, disassembly, and protection of complex forms of bundled F-actin
> Journal of Cell Biology
Published: 01 July 2026
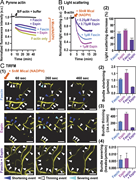
Figure 4. Fascin and espin synergize to dampen Mical’s disassembly of F-actin. (A) Comparison of Mical’s effects on unbundled, fascin-bundled, espin-bundled, and fascin–espin co-bundled filaments. Representative pyrene-actin assay is shown. The More about this image found in Fascin and espin synergize to dampen Mical’s disassembly of F-actin. (A) C...
in Synergistic assembly, disassembly, and protection of complex forms of bundled F-actin
> Journal of Cell Biology
Published: 01 July 2026
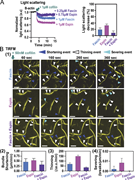
Figure 5. Cofilin affects espin, fascin, and espin–fascin co-bundled F-actin. (A and B) Light-scattering (A) and TIRFM (B) assays reveal that cofilin disassembles espin-bundled filaments and has a stronger effect on them than on fascin-bundled More about this image found in Cofilin affects espin, fascin, and espin–fascin co-bundled F-actin. (A and ...
in Synergistic assembly, disassembly, and protection of complex forms of bundled F-actin
> Journal of Cell Biology
Published: 01 July 2026
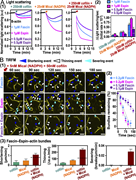
Figure 6. Mical and cofilin synergize to disassemble fascin- and espin-bundled F-actin—but together fascin and espin function to increase bundles protection against this disassembly. (A) Representative light-scattering experiments (at λ = 325 More about this image found in Mical and cofilin synergize to disassemble fascin- and espin-bundled F-acti...
in Synergistic assembly, disassembly, and protection of complex forms of bundled F-actin
> Journal of Cell Biology
Published: 01 July 2026
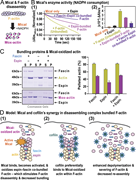
Figure 7. Biochemical mechanisms underlying Mical and cofilin’s synergy in disassembling complex F-actin bundles—and fascin and espin’s protection against this disassembly. (A) Mical, in the presence of its coenzyme NADPH, disassembles F-actin More about this image found in Biochemical mechanisms underlying Mical and cofilin’s synergy in disassembl...
in Synergistic assembly, disassembly, and protection of complex forms of bundled F-actin
> Journal of Cell Biology
Published: 01 July 2026
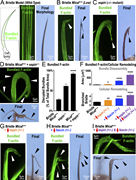
Figure 8. Espin and fascin combine to help protect F-actin bundles against Mical-mediated disassembly and cellular remodeling in vivo. (A) Drosophila bristle cells contain bundled actin filaments (green) cross-linked with bundling proteins (espin More about this image found in Espin and fascin combine to help protect F-actin bundles against Mical-medi...
in Synergistic assembly, disassembly, and protection of complex forms of bundled F-actin
> Journal of Cell Biology
Published: 01 July 2026
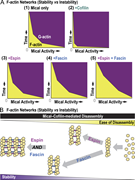
Figure 9. Summary and model: F-actin network stability and instability. (A) Summary. (1) Mical in the presence of its NADPH coenzyme (Mical activity) destabilizes unbundled, single protein (espin or fascin) bundled, and multi-protein (espin + More about this image found in Summary and model: F-actin network stability and instability. (A) Summary....
Journal Articles
Journal Articles
Journal:
Journal of Cell Biology
J Cell Biol (2026) 225 (8): e202602121.
Published: 30 June 2026
Includes: Supplementary data
in Meiotic CENP-C supports centromere assembly and kinetochore recruitment in spermatogenesis
> Journal of Cell Biology
Published: 30 June 2026
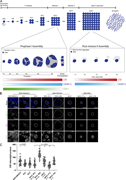
Figure 1. Drosophila melanogaster spermatogenesis and centromere assembly dynamics during meiosis. (A) GSCs divide asymmetrically generating a self-renewing GSC and a differentiating daughter cell called a GB. Four mitotic divisions with More about this image found in Drosophila melanogaster spermatogenesis and centromere ass...
in Meiotic CENP-C supports centromere assembly and kinetochore recruitment in spermatogenesis
> Journal of Cell Biology
Published: 30 June 2026
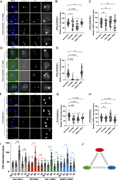
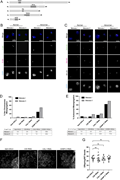
Figure 2. Requirements of CID, CAL1, and CENP-C for their recruitment and stability in meiosis I. (A) Pupal testes stained with anti-CENP-C (green) and anti-CID (magenta) antibodies, and DAPI (blue). Representative images of early prophase I (S1 More about this image found in Requirements of CID, CAL1, and CENP-C for their recruitment and stability i...
in Meiotic CENP-C supports centromere assembly and kinetochore recruitment in spermatogenesis
> Journal of Cell Biology
Published: 30 June 2026
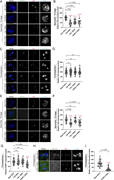
Figure 3. Outer kinetochore recruitment and microtubule spindle assembly in CID, CAL1, and CENP-C RNAi. (A) Pupal testes stained with anti-Spc105 (green) and anti-CID (magenta) antibodies, and DAPI (blue). Representative images of prometaphase I More about this image found in Outer kinetochore recruitment and microtubule spindle assembly in CID, CAL1...
in Meiotic CENP-C supports centromere assembly and kinetochore recruitment in spermatogenesis
> Journal of Cell Biology
Published: 30 June 2026
Figure 4. Meiotic chromosome missegregation and overall fertility in CID, CAL1, and CENP-C RNAi. (A) Schematic of the fluorescence in situ hybridization probes used to follow chromosome segregation through the meiotic divisions. Probes are More about this image found in Meiotic chromosome missegregation and overall fertility in CID, CAL1, and C...
in Meiotic CENP-C supports centromere assembly and kinetochore recruitment in spermatogenesis
> Journal of Cell Biology
Published: 30 June 2026
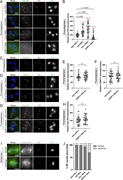
Figure 5. Requirements for the second phase of CID assembly after meiosis II. (A) Pupal testes stained with anti-CENP-C (green) and anti-CID (magenta) antibodies, and DAPI (blue). Representative images of T5 spermatid nuclei from each of the More about this image found in Requirements for the second phase of CID assembly after meiosis II. (A) Pu...

